accretion-ejection connection in the young brown dwarf ... · astronomy & astrophysics...
TRANSCRIPT

Astronomy & Astrophysics manuscript no. ewhelan˙printer˙ref˙v2 c© ESO 2014August 22, 2014
Accretion-ejection connection in the young brown dwarf candidateISO-ChaI 217?
Whelan, E.T.1, Alcala, J.M.2, Bacciotti, F.3, Nisini, B.4, Bonito, R.5,6, Antoniucci, S.4, Stelzer, B.6, Biazzo, K.2, D’Elia,V.7, and T.P. Ray.8
1 Institut fur Astronomie und Astrophysik, Kepler Center for Astro and Particle Physics, Eberhard Karls Universitat, 72076 Tubingen,Germany
2 INAF-Osservatorio Astronomico di Capodimonte, via Moiariello, 16, I-80131, Napoli, Italy3 INAF-Osservatorio Astrofisico di Arcetri, Largo E. Fermi 5, I-50125 Firenze, Italy4 INAF-Osservatorio Astronomico di Roma, via Frascati 33, I-00040 Monteporzio Catone, Italy5 Dipartimento di Fisica e Chimica, Universita di Palermo, Piazza del Parlamento 1, I-90134 Palermo, Italy6 INAF-Osservatorio Astronomico di Palermo, Piazza del Parlamento 1, I-90134 Palermo, Italy7 ASI Science Data Center, Via del Politecnico snc, I-00133 Rome, Italy8 Dublin Institute for Advanced Studies, 31 Fitzwilliam Place, Dublin 2, Ireland
ABSTRACT
As the number of observed brown dwarf outflows is growing it is important to investigate how these outflows compare to the well-studied jets from young stellar objects. A key point of comparison is the relationship between outflow and accretion activity andin particular the ratio between the mass outflow and accretion rates (Mout/Macc). The brown dwarf candidate ISO-ChaI 217 wasdiscovered by our group, as part of a spectro-astrometric study of brown dwarfs, to be driving an asymmetric outflow with the blue-shifted lobe having a position angle of ∼ 20◦. The aim here is to further investigate the properties of ISO-ChaI 217, the morphologyand kinematics of its outflow, and to better constrain Mout/Macc. The outflow is spatially resolved in the [S ii] λλ6716, 6731 lines andis detected out to ∼ 1.′′6 in the blue-shifted lobe and 1 ′′ in the red-shifted lobe. The asymmetry between the two lobes is confirmedalthough the velocity asymmetry is less pronounced with respect to our previous study. Using thirteen different accretion tracers wemeasure log(Macc) [M�/yr]= -10.6 ± 0.4. As it was not possible to measure the effect of extinction on the ISO-ChaI 217 outflowMout was derived for a range of values of Av, up to a value of Av = 2.5 mag estimated for the source extinction. The logarithm ofthe mass outflow (Mout) was estimated in the range -11.7 to -11.1 for both jets combined. Thus Mout/Macc [M�/yr] lies below themaximum value predicted by magneto-centrifugal jet launching models. Finally, both model fitting of the Balmer decrements andspectro-astrometric analysis of the Hα line show that the bulk of the H I emission comes from the accretion flow.
Key words. stars: brown dwarfs–jets– Accretion, accretion disks
1. Introduction
Jets and outflows are an integral part of the star formation pro-cess and models of jet launching and propagation developed forlow mass young stellar objects (YSOs) may also apply to a di-verse range of astrophysical objects, including jets driven bybrown dwarfs (BDs) (Frank et al., 2014; Joergens et al., 2013).BDs are now routinely observed in star forming regions andtherefore it is important to understand how they form and evolve(Luhman, 2012). A key way to do this is to investigate their ac-cretion and outflow properties and compare them to YSOs. Sinceevidence first emerged that BDs launch outflows (Fernandez &Comeron, 2001; Whelan et al., 2005) the number of BD out-flows, both atomic and molecular has grown to ∼ 10 (Phan-Baoet al., 2008; Whelan et al., 2012; Joergens et al., 2012; Stelzeret al., 2013; Monin et al., 2013). While this is still a statisti-cally small sample, the comparison between BD outflows andthose driven by Class II YSOs i.e classical T Tauri stars (CTTSs)has proven to be very interesting (Whelan et al., 2009b, 2011).Similarities include the observation of a knotty jet which is asignature of episodic accretion (Whelan et al., 2012), the de-
? Based on Observations collected with X-shooter at the Very LargeTelescope on Cerro Paranal (Chile), operated by the European SouthernObservatory (ESO). Program ID: 089.C-0143(A).
tection of molecular components to known BD optical outflows(Phan-Bao et al., 2008; Monin et al., 2013), the presence of bothhigh and low velocity components to the outflows (Whelan etal., 2009a) and the discovery of an asymmetric BD jet (Whelanet al., 2009b; Joergens et al., 2012).
The high angular resolution observations needed to directlyprobe the appropriateness of jet launching models developedfor YSOs, in the BD mass regime, are not currently possibledue to the faintness of the BD outflow emission (Ray et al. ,2007). However, the ratio of the mass outflow to accretion rate(Mout/Macc) is constrained by jet launching models and can beinvestigated in BDs. The first attempts at measuring this ratioin BDs yielded values of Mout/Macc which were significantlyhigher than the ∼ 10% measured for low mass YSOs and than thepredictions made by magneto-centrifugal jet launching models(Whelan et al., 2009b). Magneto-centrifugal jet launching mod-els place an upper limit (per jet) of ∼ 0.3 on this ratio (Ferreira etal. , 2006; Cabrit, 2009). However, as discussed in Whelan et al.(2009b, 2014a), observational biases had a strong influence onthese first studies. How this ratio compares in BDs and low massYSOs could tell us something very important about how BDsform. Therefore, observations specifically designed for measure-ments of Mout/Macc, and of a greater number of BDs are needed.
1
arX
iv:1
408.
5011
v1 [
astr
o-ph
.SR
] 2
1 A
ug 2
014

Whelan, E.T. et al.: X-Shooter Spectroscopy of ISO-ChaI 217
Hβ
ΗδΗγ
Ca II Ca II +H7
[S II]H8H9 He I
Ca IIHα[S II]
[Ο I]
Paγ PaβHe I
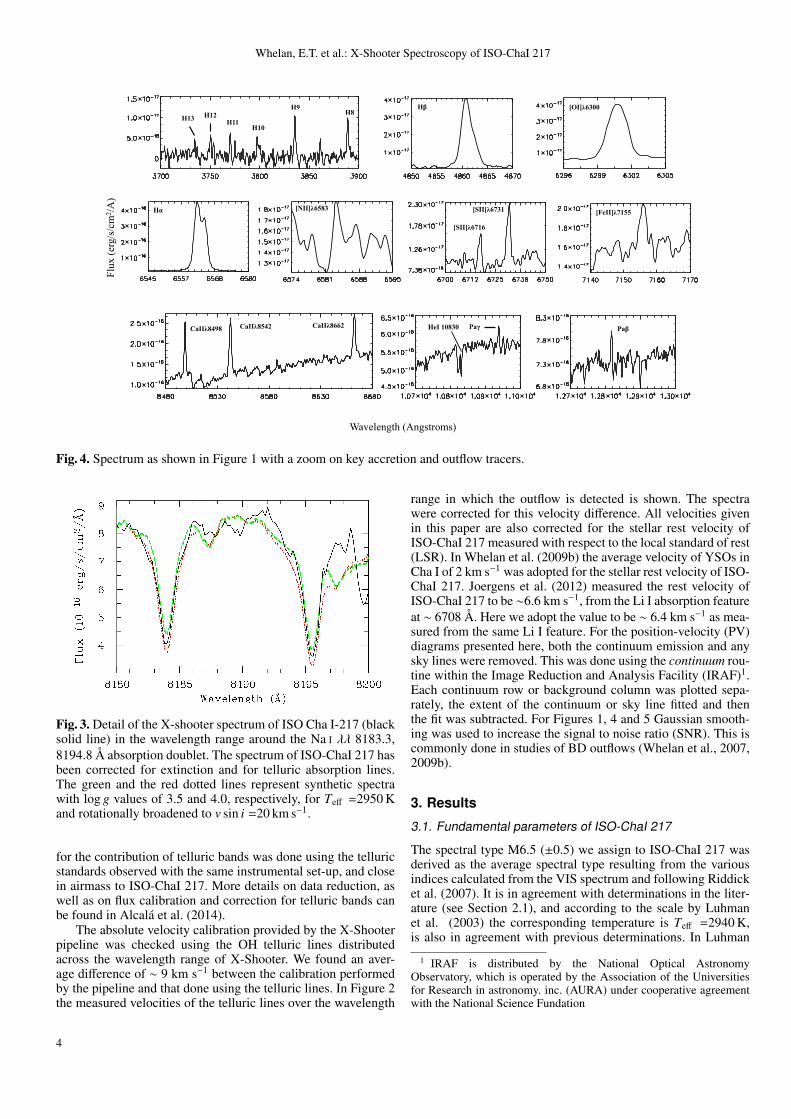
Fig. 1. The full X-Shooter spectrum of ISO-ChaI 217. Key lines are marked and the fluxes of these lines are given in Table 1. Herethe spectrum has been smoothed to increase the SNR of key features. The spectra have not been extinction corrected.
Fig. 2. The velocity of various telluric lines across the wave-length range of the VIS arm of X-Shooter . The difference be-tween the calibration performed by the pipeline and the velocityof the telluric lines is ∼ 9 kms−1.
In Whelan et al. (2009b) visible spectra of a sample of BDsat orthogonal slit position angles (PA) was obtained. Spectro-astrometry (SA) was used to confirm that the BDs were drivingoutflows and the orthogonal data allowed the PAs of the out-flows to be constrained. As a follow-up to this discovery study,ISO-ChaI 217 the target with the strongest jet emission and mostinteresting properties, was observed with X-Shooter. The aim ofthese observations was spatially resolve the ISO-ChaI 217 out-flow by placing the slit along the estimated outflow PA and torefine earlier measurements of Mout/Macc. Here the results ofthis X-Shooter study of ISO-ChaI 217, are presented. The fullX-Shooter spectrum is shown in Figure 1 and the fluxes of iden-tified lines are given in Table 1. The fundamental parameters ofISO-ChaI 217 are derived and discussed in Section 3.1 and themorphology and kinematics of the jet are discussed in Section3.3. Macc is calculated from the luminosity of various accretion
tracers and Mout from the luminosity of the [S ii] λ6731 line,using the approach of Whelan et al. (2014a) (see Section 4.1).Finally, the origin of the permitted emission in the spectrumof ISO-ChaI 217 is investigated through the Balmer decrements(Section 4.2). This work is part of a larger study to investigatethe accretion-ejection connection in BDs and very low mass stars(VLMSs) (Whelan et al., 2014a; Giannini et al., 2013; Stelzer etal., 2013)
2. Target, observations and analysis
2.1. Target
ISO-ChaI 217 (11h09m52s.2, -76◦39′12.′′
8) is a young very lowmass object located in the Chamaeleon I dark cloud (d∼140 ±20 pc; Persi et al. 2000). Its spectral type has been reported asbeing M6.25 and comparison with models give it a mass of80 MJUP, a radius of 0.64 R� and luminosity Lbol = 0.023 to0.028 (Muzerolle et al., 2005; Luhman, 2007). This mass esti-mate places it at the hydrogen burning mass limit therefore it isreasonable to describe it as a good candidate for being a youngBD. Describing it as a BD candidate is also consistent with pre-vious studies of this object. Luhman (2007) assign an age of5-6 Myr to the northern part of the cloud in which ISO-ChaI217 lies. Muzerolle et al. (2005) also report log(Macc) = -10M�yr−1 for ISO-ChaI 217. This estimate of Macc is derived byfitting the Hα line profile with magnetospheric accretion mod-els. Note that the authors do not give any error estimate for thisvalue of Macc. Whelan et al. (2009b, 2014b) measured the PA ofthe blue-shifted outflow at 20◦ ± 10◦ and reported its interestingasymmetry. The asymmetry was revealed in the relative bright-ness of the two lobes of the outflow (the redshifted lobe wasbrighter), the difference in the radial velocity of the two (the red-shifted lobe was faster) and the difference in the electron density(again higher in the red lobe). Whelan et al. (2009b) also esti-mated Mout/Macc > 1 for ISO-ChaI 217. The results of Whelan
2

Whelan, E.T. et al.: X-Shooter Spectroscopy of ISO-ChaI 217
Identificationλair (Å) Ion Type Eu (cm−1) Jet λobs (Å) Flux3734.4 H I 13 - 2 109029.8 3734.3 0.6 ± 0.53750.2 H I 12 - 2 108917.1 3750.1 0.8 ± 0.53770.6 H I 11 - 2 108772.3 3770.4 0.7 ± 0.43797.9 H I 10 - 2 108582.0 3797.5 1.1 ± 0.43835.3 H I 9 - 2 108324.7 3835.4 3.0 ± 0.43889.0 H I 8 - 2 107965.1 3888.9 2.7 ± 0.43933.7 Ca II 2P3/2-2S1/2 25414.4 3933.5 5.6 ± 0.3
3968.2a Ca II 2P1/2-2S1/2 25191.5 3968.2 4.5 ± 0.33970.1 H I 7 - 2 107440.5 3969.9 2.1 ± 0.34101.7 H I 6 - 2 106632.2 4101.5 2.6 ± 0.34340.5 H I 5 - 2 105291.7 4340.2 4.2 ± 0.24861.3 H I 4 - 2 102823.9 4860.9 11.2 ± 0.15
5875.9 He I 3D1-3P0 186101.7 5876.2 2.9 ± 0.26300.3 [O I] 1D1-3P2 15867.9 Blue 6300.3 4.25 ± 0.2
Red 6300.3 4.25 ± 0.26363.7 [O I] 1D2-3P1 15867.9 6363.7 2.6 ± 0.26562.8 H I 3 - 2 97492.3 6563.1 195.0 ± 0.26583.5 [N II] 1D2-3P2 15316.2 Blue 6583.3 1.2 ± 0.26678.2 He I 1D2-1P1 186105.1 6678.8 1.5 ± 0.26716.4 [S II] 2D5/2-4S3/2 14884.7 Blue 6716.4 1.1 ± 0.2
Red 6717.7 1.25 ± 0.26730.8 [S II] 2D3/2-4S3/2 14852.9 Blue 6731.7 1.8 ± 0.2
Red 6732.0 2.2 ± 0.27065.2 He I 3S1-3P0 183236.9 7065.8 1.0 ± 0.27172.0 [Fe II] a2G7/2-a4F7/2 16369.4 7172.4 0.8 ± 0.27432.3 [Fe II] b2F5/2-a2P3/2 31811.82 7432.9 1.5 ± 0.28498.0 Ca II 2P3/2-2D3/2 25414.4 8498.6 25.8 ± 0.28542.1 Ca II 2P3/2-2D5/2 25414.4 8542.5 38.4 ± 0.28662.1 Ca II 2P1/2-2D3/2 25191.5 8662.5 30.2 ± 0.2
10938.0 H I 0 - 3 106632.2 10937.9 33.2 ± 0.312818.1 H I 5 - 3 105291.7 12817.7 56.5 ± 0.5
Table 1. Emission Lines identified in the spectrum of ISO-ChaI 217 . Fluxes are in units of erg/s/cm2 × 10−17 and are not correctedfor extinction. (a) blended lines.
et al. (2009b) were upheld by a subsequent investigation of theproperties of ISO-ChaI 217 by Joergens et al. (2012). Moreover,Joergens et al. (2012) investigated the properties of the disk ofISO-ChaI 217 inferring a disk inclination angle of ∼ 45◦ and adisk mass of 4 × 10⁻⁶ M�. Todorov et al. (2014) report the pos-sible detection of a companion to ISO-ChaI 217 (ISO-ChaI 217B) with a binary separation of ∼ 5 AU and a PA of 238◦ ± 8◦.The presence of a companion which is interacting with the diskof the jet source could explain the observed asymmetry betweenthe lobes of the jet.
2.2. Observations
The X-Shooter observations presented in this paper were con-ducted on April 17 2012, on the VLT as part of the INAF X-Shooter GTO program on star forming regions (Alcala et al.,2011). The single-node exposure time was 850 sec, yielding anominal exposure time of almost 2 hours after 2 (ABBA) cycles.The average seeing was 0.′′8 during the observations. The slit wasaligned with the jet axis and the slit widths of the UVB, VIS andNIR arms were 1.′′0, 0.′′9 and 0.′′9 respectively. This choice of slitwidths yielded spectral resolutions of 5100, 8800 and 5600 foreach arm, respectively. The pixel scale is 0.′′16 for the UVB andVIS arms and 0.′′21 for the NIR arm. More details of the obser-
vations of the GTO program can be found in Alcala et al. (2011)and Alcala et al. (2014).
2.3. Data analysis
The X-Shooter data reduction was performed independentlyfor each arm using the X-Shooter pipeline version 1.3.7. Thepipeline provides 2-dimensional, bias-subtracted, flat-field cor-rected, order-merged, background-subtracted and wavelength-calibrated spectra, but special attention was given to the skysubtraction. Sky regions free of nebular emission were selectedalong the slit to derive a sky spectrum which was then subtractedto the 1-dimensional spectrum. Flux calibration was achievedwithin the pipeline using a response function derived from thespectra of flux-calibrated standard stars observed on the samenight and of ISO-ChaI 217. Following the independent flux cal-ibration of the X-Shooter arms, the internal consistency of thecalibration was checked by plotting together the three spectraextracted from the source position and visually examining thesuperposition of overlapping spectral regions at the edge of eacharm. The UVB and VIS arms were found to be very well aligned,while the NIR arm presented a shift with respect to the VISspectrum of ∼ 25% lower. This was corrected for by scaling theNIR spectrum to the VIS continuum level. Finally, the correction
3
Whelan, E.T. et al.: X-Shooter Spectroscopy of ISO-ChaI 217
H13 H12H11
H10
H9H8
[OI]λ6300HβFl
ux (e
rg/s
/cm
2 /A)
Hα
[SII]λ6716
[SII]λ6731 [FeII]λ7155[NII]λ6583
CaIIλ8498 CaIIλ8542 CaIIλ8662 HeI 10830 Paγ Paβ
Wavelength (Angstroms)
Fig. 4. Spectrum as shown in Figure 1 with a zoom on key accretion and outflow tracers.
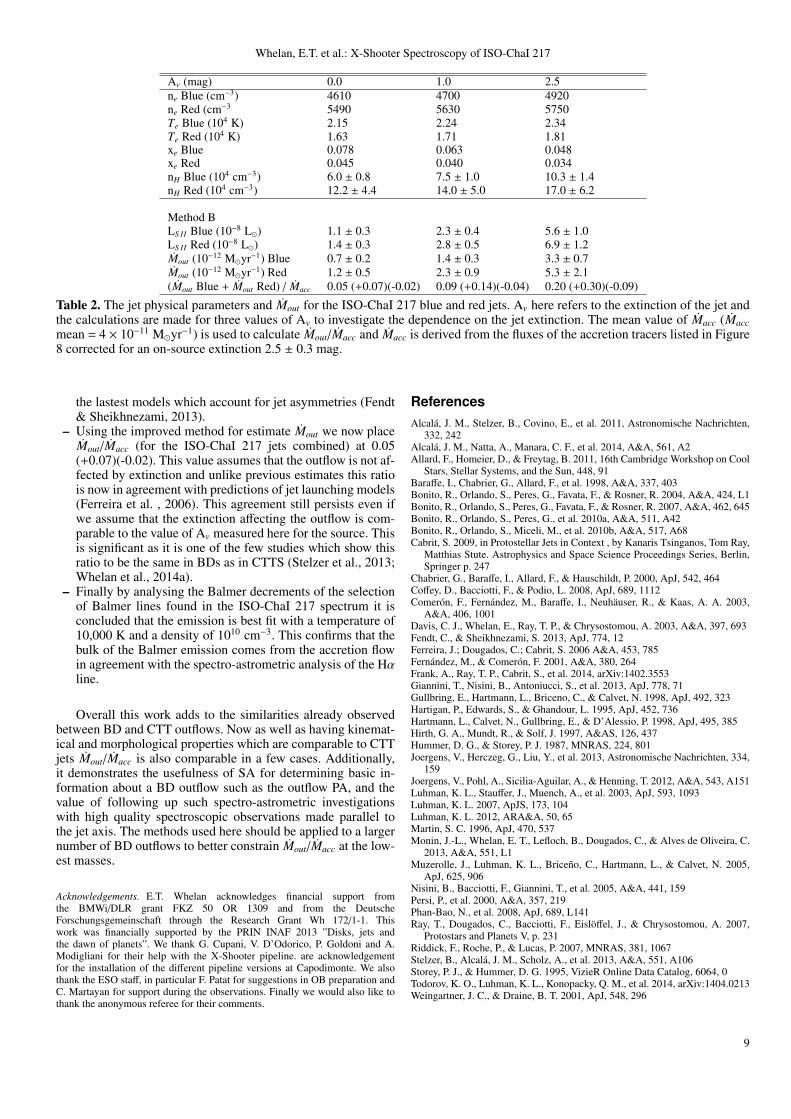
Fig. 3. Detail of the X-shooter spectrum of ISO Cha I-217 (blacksolid line) in the wavelength range around the Na i λλ 8183.3,8194.8 Å absorption doublet. The spectrum of ISO-ChaI 217 hasbeen corrected for extinction and for telluric absorption lines.The green and the red dotted lines represent synthetic spectrawith log g values of 3.5 and 4.0, respectively, for Teff =2950 Kand rotationally broadened to v sin i =20 km s−1.
for the contribution of telluric bands was done using the telluricstandards observed with the same instrumental set-up, and closein airmass to ISO-ChaI 217. More details on data reduction, aswell as on flux calibration and correction for telluric bands canbe found in Alcala et al. (2014).
The absolute velocity calibration provided by the X-Shooterpipeline was checked using the OH telluric lines distributedacross the wavelength range of X-Shooter. We found an aver-age difference of ∼ 9 km s−1 between the calibration performedby the pipeline and that done using the telluric lines. In Figure 2the measured velocities of the telluric lines over the wavelength
range in which the outflow is detected is shown. The spectrawere corrected for this velocity difference. All velocities givenin this paper are also corrected for the stellar rest velocity ofISO-ChaI 217 measured with respect to the local standard of rest(LSR). In Whelan et al. (2009b) the average velocity of YSOs inCha I of 2 km s−1 was adopted for the stellar rest velocity of ISO-ChaI 217. Joergens et al. (2012) measured the rest velocity ofISO-ChaI 217 to be ∼6.6 km s−1, from the Li I absorption featureat ∼ 6708 Å. Here we adopt the value to be ∼ 6.4 km s−1 as mea-sured from the same Li I feature. For the position-velocity (PV)diagrams presented here, both the continuum emission and anysky lines were removed. This was done using the continuum rou-tine within the Image Reduction and Analysis Facility (IRAF)1.Each continuum row or background column was plotted sepa-rately, the extent of the continuum or sky line fitted and thenthe fit was subtracted. For Figures 1, 4 and 5 Gaussian smooth-ing was used to increase the signal to noise ratio (SNR). This iscommonly done in studies of BD outflows (Whelan et al., 2007,2009b).
3. Results
3.1. Fundamental parameters of ISO-ChaI 217
The spectral type M6.5 (±0.5) we assign to ISO-ChaI 217 wasderived as the average spectral type resulting from the variousindices calculated from the VIS spectrum and following Riddicket al. (2007). It is in agreement with determinations in the liter-ature (see Section 2.1), and according to the scale by Luhmanet al. (2003) the corresponding temperature is Teff =2940 K,is also in agreement with previous determinations. In Luhman
1 IRAF is distributed by the National Optical AstronomyObservatory, which is operated by the Association of the Universitiesfor Research in astronomy. inc. (AURA) under cooperative agreementwith the National Science Fundation
4

Whelan, E.T. et al.: X-Shooter Spectroscopy of ISO-ChaI 217
33 +/- 5-20 +/- 5
-15 +/- 5-5 +/- 5
32 +/- 5-25 +/- 5
-24 +/- 5
-20 +/- 5
R
B
Fig. 5. Contour plots for the main emission lines. Velocities are with respect to the systemic velocity of the source. The zero spatialposition is the centre of the continuum emission, measured using Gaussian fitting, and is taken to be the source position. For the[O i] λλ6300, 6363 and Hα lines, contours start at 3σ and for the [N ii] λ6583 and [S ii] λλ6716, 6731 lines they start at 2σ. The1σ value is 1 × 10⁻¹⁸ erg/s/cm2. This is done to highlight the presence of faint extended blue-shifted [SII] emission and the non-detection of even fainter red-shifted [NII]λ6583 emission. In all cases, contours increase with a log scale (
√1.5 for the [NII] and
[SII] lines). The blue dashed lines mark the velocity of the faint [SII]λ6716, 6731 background lines.
(2007) an extinction of AJ = 0.68 mag is derived, meaningAV = 2.1 mag. Here the extinction law by Weingartner & Draine(2001) for RV=5.5 was used. This law covers a wide range inwavelength, from the UV to the mid-IR. We estimated extinc-tion in the same way as in our previous investigations (Stelzer etal., 2013; Alcala et al., 2014; Whelan et al., 2014a), that is, byfinding the best match of artificially reddened X-shooter spec-tra of zero-extinction Class III templates, with the spectrum ofISO-ChaI 217. We derived AV = 2.5 ± 0.3 mag, in fairly goodagreement with the value reported by Luhman et al. (2003).
Both mass and radius are crucial physical parameters for theestimates of the mass accretion rate (see Section 4.1). The val-ues derived by Muzerolle et al. (2005) by comparison with theevolutionary models by Baraffe et al. (1998) and Chabrier etal. (2000) are consistent with an object at the hydrogen burn-ing limit. Another check for the temperature and radius can bedone by determining the surface gravity, log g, using spectral di-agnostics and synthetic spectra. In order to estimate the surfacegravity, log g, and as a by-product the projected rotational ve-locity, v sin i, we used the gravity- and temperature-sensitive ab-sorption doublets of Na i at λλ 8183.3, 8194.8 nm and of K i atλλ 7664.8, 7698.9 nm, by comparing the X-Shooter data to syn-thetic spectra. The BT-Settl model spectra of Allard et al. (2011)were used for a range of Teff around the expected value and arange of log g values. The synthetic spectra were binned to thesame spectral resolution as the X-Shooter data, and rotationallybroadened in steps of v sin i of 5 km s−1 in the range from 10 to35 km s−1. As an example, the synthetic spectra for Teff=2950 Kwith two different values of log g are overlaid in Fig. 3 on theX-shooter spectrum of ISO-ChaI 217 in the region of the Na idoublet. The model spectra have been rotationally broadened tov sin i =20 km s−1, the rotation rate at which the models best
fit the observed spectrum. The width of the observed lines isin agreement with a log g between 3.5 and 4.0. Thus, the pa-rameters for ISO-ChaI 217, Teff =2950 K, log g =3.7(±0.3) andv sin i =20(±5) km s−1 provide the best fit to the data, with theuncertainties being due to the adopted steps in both log g andv sin i in the grid of synthetic spectra. The gravity derived fromthe spectrum is in perfect agreement with the value calculatedfrom the mass and radius as derived by Muzerolle et al. (2005)from evolutionary models. As a consequence, we confirm theresults on luminosity and age reported in Muzerolle et al.(2005) and Luhman (2007) (also see Section 2.1.)
3.2. Line identification
The full UVB, VIS and NIR spectra of ISO-ChaI 217 are pre-sented in Figure 1. By placing the X-Shooter slit along theoutflow PA and using the nodding mode the outflow emis-sion is traced to 8 ′′ on either side of the driving source.The plotted 1D spectra were extracted by summing over thewhole spatial extent of the 2D spectra and thus all the out-flow emission is included. The only resolved emission alongthe slit is in the [S ii] λλ6716, 6731 lines and therefore thereis no contribution from extended emission in any of the otherlines. The identified lines are marked in Figure 1. Emissionlines were identified using the Atomic Line List database(http://www.pa.uky.edu/∼peter/atomic/). For the identification,we considered a wavelength uncertainty of about 0.5 Å. Nebularlines from abundant species having excitation energies below40,000 cm−1 were searched for. Line fluxes were computedthrough the Gaussian fitting of the line profiles after subtrac-tion of the local continuum. Gaussian fitting was done using the
5

Whelan, E.T. et al.: X-Shooter Spectroscopy of ISO-ChaI 217
IRAF task splot. Absolute flux errors were computed from theroot mean square (r.m.s) noise (measured in a portion of thespectrum adjacent to the line) multiplied by the spectral reso-lution element at the considered wavelength. The line fluxes arenot corrected for extinction and a discussion on estimating theon-source extinction of ISO-ChaI 217 is given in Section 3.1.The spatial range over which the flux of the [S ii] λλ6716, 6731was measured is marked in Figure 5. The same range is usedfor the [N ii] λ6583 emission and only blue-shifted emission isdetected. In the case of the [O i] λ6300 line it is assumed thattotal flux is divided evenly between the two outflow lobes. Forthe other lines listed in Table 1 fluxes are measured from the 1Dspectrum.
In Figure 4 line profiles of some of the most interesting linesare plotted. Firstly note that the Balmer lines from H13 to Hαare detected. In Section 4.2 these lines are used to compute theBalmer decrements with respect to the Hβ line. The Hα linehas a shape typical of an accretion dominated Hα line region.While the outflow is not resolved in velocity in the [O i] λ6300line the [S ii] λλ6716, 6731 line regions are double peaked (es-pecially clear in the unsmoothed data) with the red-shifted peakbeing brighter. Thus we can extract velocity information fromthese lines and the X-Shooter line profile compares well to whatwas reported in Whelan et al. (2009b), in that the line is dou-ble peaked and the red-shifted peak is brighter. We discuss the[S ii] λλ6716, 6731 line regions further in Section 3.3. The CaIItriplet, a further strong indicator of accretion is also detected.The HeI 1.083 µm line is seen in blue-shifted absorption. Finallythe Paγ and Paβ lines while faint are detected and are used inSection 4.1 to estimate Macc.
3.3. Kinematics and morphology of the ISO-ChaI 217 jet
In Whelan et al. (2009b) it was demonstrated using SA that the[O i] λλ6300, 6363 and [S ii] λλ6716, 6731 lines were formed inthe outflow of ISO-ChaI 217. As the spectra presented here weretaken with the slit aligned parallel to the estimated outflow PA,it is now possible to investigate the kinematics and morphologyof this outflow along the jet axis. In Figure 5 PV diagrams ofthe brightest outflow lines plus Hα are presented. The Hα lineis the only line included in this figure that traces both out-flow accretion as the FELs are quenched at the densities ofthe accretion shocks (Hirth et al., 1997). Our discussion ofthe kinematics and morphology of the outflow is based on thisFigure. Firstly, from Figure 5 it is clear that the outflow is spa-tially resolved in the [S ii] λλ6716, 6731 lines. This confirms thatthe estimate of the outflow PA derived by Whelan et al. (2009b)was accurate. The blue-shifted lobe extends to ∼ 1.6 ′′ and thered-shifted lobe to ∼ 1 ′′. As described in Section 2 the velocityis measured with respect to the stellar rest velocity of ISO-ChaI217. In Figure 5 the velocities for the different components seenin the outflow are given. The red-shifted flow is marginally fasterthan the blue-shifted flow. Thus the velocity asymmetry reportedin Whelan et al. (2009b) and Joergens et al. (2012) is not as pro-nounced in this dataset. For example, Whelan et al. (2009b) gavethe velocities of the blue and red-shifted lobes at -20 km s−1 and-40 km s−1 respectively. Therefore, in that study the ratio of ve-locity between the red and blue lobes is 2.0 as compared to thevalue of 1.4 found here. The difference between these two sets ofvelocities is due to the different values for the stellar rest veloc-ity adopted (see Section 2) and also likely due to the fact that inWhelan et al. (2009b) we were not observing along the outflow.Overall the radial velocities measured here can be considered tobe more accurate.
As well as the small velocity asymmetry between the twolobes there is also a clear morphological asymmetry. The blue-shifted lobe has three separate knots while only one knot is re-solved in the red-shifted lobe. Although the blue-shifted emis-sion at ∼ 1 ′′ and ∼ 1.6 ′′ is faint we are satisfied that thefact that it is seen in both [SII] lines rules out the possibilitythat this is noise. We also consider the fact that the extendedemission is due to an imperfect subtraction of faint background[S ii] λλ6716, 6731 emission. These background lines are a sig-nature of nebular emission surrounding ISO-ChaI 217 and thevelocity at which we see these lines is marked in Figure 5 by theblue dashed lines. For the [S ii] λ6716 and [S ii] λ6731 knots at∼ 1 ′′ there is enough of a separation in velocity from the back-ground lines for us to conclude that these knots are real. Also thesame argument applies for the [S ii] λ6731 knot at ∼ 1.6 ′′. The[S ii] λ6716 emission at 1.6 ′′ does lie at the velocity of the back-ground line. Thus, we cannot categorically say without higherSNR data, that this is a knot in the outflow. However, the factthat its position coincides with a [S ii] λ6731 knot and the factthat we see no such extended emission in the other jet lines aftersky subtraction makes it likely that it is a knot. By comparingthe radial velocities of three [SII] knots in the blue-shifted out-flow, it is seen that there is a small decrease in radial velocityalong the blue-shifted flow. A decrease in velocity with distanceis often seen in jets from YSOs (Davis et al., 2003). This canbe explained by numerical simulations which show that speed ofthe shock front is lower than the initial velocity of ejection, dueto the interaction with the ambient medium which deceleratesthe outflow (Bonito et al., 2004, 2007).
From Figure 5 it can also be seen that the outflow is not spa-tially resolved in the [O i] λλ6300, 6363 lines. This is not sur-prising as the critical density of the [OI] lines is two ordersof magnitude higher than the critical density of the [SII] lines.Therefore [OI] forms closer to the driving source of the out-flow than the [SII] which often traces more extended emission(Hartigan et al., 1995). This difference between the spatial extentof the [O i] λλ6300, 6363 and [S ii] λλ6716, 6731 lines was alsonoted by Whelan et al. (2009b). Whelan et al. (2009b) measuredoffsets of ∼ 200 mas in the [SII] lines while the [OI] were onlyextended to ∼ 50 mas. In Figure 6 the results of applying SA tothe X-Shooter [O i] λ6300 line region are presented. This anal-ysis confirms that the [OI] emission detected in the X-Shooterspectrum is formed in the ISO-ChaI 217 outflow, and the off-sets are larger than those measured in Whelan et al. (2009b) asexpected for a spectrum taken along the outflow PA. In Figure6 the spectro-astrometric analysis of the Hα line is also shown.We detect no outflow component to the Hα line.
Finally, and very interestingly, it can be seen from Figure 5that [N ii] λ6583 is only detected in the blue-shifted flow and thatit traces slightly higher velocities than the [S ii] λλ6716, 6731lines. The estimated flux of the [N ii] λ6583 emission is 1.2 ±0.2 × 10⁻¹⁷ erg/s/cm2. The critical density of the blue-shifted[N ii] λ6583 emission is ∼ 6 × 104 cm−3 at 10,000 K and it onlytraces the highest velocity emission in YSO jets (Hirth et al.,1997). The non-detection of [N ii] λ6583 in the red-shifted flowimplies that the ionisation fraction is smaller in the red-shiftedlobe than in the blue-shifted lobe (see Table 2). There are manyexamples of CTT jets where [N ii] λ6583 is only weakly de-tected compared to other FELs and thus a low ionisation isinferred. For example (Coffey et al., 2008) discuss the weak[N ii] λ6583 emission from and thus low ionisation of the RWAur red-shifted jet. Furthermore, better angular resolutionobservations are needed before one can conclude if partialobscuration by the ISO-ChaI 217 disk could also contribute
6

Whelan, E.T. et al.: X-Shooter Spectroscopy of ISO-ChaI 217
Fig. 6. Spectro-astrometric analysis of the [O i] λ6300 and Hαlines. Offsets are measured using Gaussian fitting. The black as-teriks are the offsets measured after continuum subtraction. Theaccuracy in the measurement of the offsets is ∼ 20 mas. Thisanalysis confims that the [O i] λ6300 line is tracing the outflowwhile no outflow component is detected in the Hα line.
to the lack of [N ii] λ6583 emission from the ISO-ChaI 217red-shifted jet.
4. Discussion
4.1. Estimating Mout/Macc
The mass accretion rate was calculated from the following equa-tion
Macc = 1.25(LaccR∗)/(GM∗) (1)
where Lacc is the accretion luminosity and R∗ and M∗ are thestellar radius and mass (Gullbring et al., 1998; Hartmann et al.,1998). Lacc is derived from the luminosity of 13 accretion trac-ers (Lline; Figure 8) using the relationships published in Alcalaet al. (2014). Lline was calculated from the extinction correctedfluxes (see section 3.1) of the accretion indicators and assum-ing a distance of 140 pc. Due to the moderate inclination ofthe disk (given in Section 2.1) Lline did not need to be cor-rected for obscuration by the disk as in Whelan et al. (2014a).
Also included is the literature value taken from (Muzerolle etal., 2005). We also consider the effect of variable accretion bycomparing log(Macc) derived here from the Hα line to the valuederived from the VLT / UVES spectra presented in Whelan etal. (2009b). It can be seen from Figure 7 that these values arecompatible within the errors. It is found that the average valuefor log(Macc) [M�/yr]= -10.6 ± 0.4 which is consistent withinerrors with the result of (Muzerolle et al., 2005).
In Table 2 the physical parameters of the ISO-ChaI 217 blueand red jets and the derived values of Mout are given. The physi-cal parameters are the electron density (ne), the electron temper-ature (Te), and the ionisation fraction (xe). The electron densityis estimated from the ratio of the [S ii] λλ6716, 6731, Te from theratio [O i] λ6300/ [S ii] λ6731 and xe from the ratio [N ii] λ6583/ [O i] λ6300 (Whelan et al., 2014a). In the case of the ionisationin the red-shifted jet an upper limit of 3 times the r.m.s noise wasused for the flux of the [N ii] λ6583 line. The extent to which aYSO jet is extincted by the circumstellar material is an impor-tant parameter when calculating Mout and can be estimated usingthe [FeII] jet lines at 1.27, 1.32, 1.64µm (Nisini et al., 2005). Asthese lines are not detected in the spectrum of ISO-ChaI 217 itis not possible to know the level to which the ISO-ChaI 217 jetis extincted by any circumstellar material. Therefore, to test thedependence of the results on the jet extinction, the physical pa-rameters and Mout were calculated for a range of values of Av asshown in Table 2. Increasing the extinction and thus the line fluxdoes not substantially effect the values of ne, Te and xe. It mostlyimpacts LS II and thus Mout.
The measurements of Mout are based on the following equa-tions and further information can be found in Whelan et al.(2014a).
Mout = µmH (nH V) Vtan/lt (2)
with
nH V = LS II
(h ν Ai fi
Xi
XXH
)−1
(3)
Here µ = 1.24 is the mean atomic weight, mH the proton mass,V the volume effectively filled by the emitting gas, Vtan and ltthe tangential velocity and length of the knot, Ai and fi the ra-diative rate and upper level population relative to the consideredtransition and finally Xi
X and XH are xe and the relative abundance
of the considered species. The ionisation fraction and the up-per level population are estimated from the physical parametersgiven in Table 2. The tangential velocities of the blue and redjets are taken at 25 km s−1 and 32 km s−1 respectively, and lt= 1 ′′. We do not include the outer blue-shifted knot in our cal-culation as we should only include knots which are detected ineither [OI]λ6300 or [NII]λ6583. LS II is the luminosity of the[SII]λ6731 line and it is assumed in this calculation that all thesulphur is single ionised.
Overall it is concluded from the results presented in Table 2that Mout/Macc (two-sided) for ISO-ChaI 217 is consistent withmagneto-centrifugal jet launching models and studies of CTTSs.This conclusion applies for all chosen values of Av. In Whelanet al. (2009b) Mout was measured at 1.8 × 10⁻¹⁰ M�yr−1 and3.1 × 10−10 M�yr−1 for the blue-shifted and red-shifted jets re-spectively and thus Mout/Macc using the value of Macc publishedby Muzerolle et al. (2005) was > 1. In Whelan et al. (2009b)the extinction of the source and the jet was assumed to be thesame. The main reason for the difference between the lower andthus more plausible estimate of Mout/Macc made here, and thevalue published in Whelan et al. (2009b) is that in Whelan et al.
7

Whelan, E.T. et al.: X-Shooter Spectroscopy of ISO-ChaI 217
ISO-ChaI 217
.
Fig. 7. Mass accretion rate estimated from various accretion trac-ers. The solid line gives the mean value of log (Macc) and thedashed line is the ± 1σ uncertainty. The errors on the individualmeasurements mainly come from the error in the line fluxes andin the value of the on-source extinction. The value of Macc cal-culated by Muzerolle et al. (2005) from modelling of the Hα lineand from the UVES spectra presented by Whelan et al. (2009b)are included here for comparison. No error estimates were givenin Muzerolle et al. (2005).
(2009b) the method used assumed a value for the critical den-sity (ncr) which was highly uncertain. Here an estimate of ncris not required. Estimates of Macc are more accurate due to theuse of several accretion tracers. Previous to this work it has onlybeen derived from the Hα line. However, this change in the de-rived value of Macc does not have a significant effect on the finalvalues of Mout/Macc. Similarily extinction does not have a largeeffect on our conclusion in this case. As for all values of Av upto the value measured for the driving source Mout/Macc remainswithin the limits of predictions by leading models.
4.2. Investigating the origin of the HI emission
Several HI emission lines are detected in the spectrum of ISO-ChaI 217 (see Figure 4). To investigate the origin of this emis-sion the Balmer decrements were computed with respect to Hβline and are plotted as a function of upper quantum number (nup)in Figure 8. While the spectral range of X-Shooter covers mostof the Balmer lines any lines with nup > 13 were found to be toonoisy for inclusion in our analysis. Additionally, at the interme-diate spectral resolution of X-Shooter the H7 and H8 lines areblended with other lines and are therefore also not included. Toconstrain the physical conditions in the emitting gas the decre-ments were firstly compared to standard Case B predictions cal-culated for a range of temperature and density. The Case Bcurves were derived using the calculations of Hummer & Storey(1987) and using the Fortran program and data files provided byStorey & Hummer (1995). These models assume that all lines areoptically thin. Secondly, the decrements were also compared tooptically thick and thin local thermodynamic equilibrium cases(LTE) ratios, calculated over a temperature range of 2000 K to20000 K. The optically thick case is not shown in Figure 8 as itwas not a good fit to the results. The emission is best fit with theCase B model and Te =10,000 K, ne = 1010 cm−3. This suggestsformation in an accretion flow (Martin, 1996). This is consistentwith the spectro-astrometric analysis of the Hα line (Figure 6) in
which no outflow component is detected. It is likely that the out-flow can be traced by the Hα line but the emission is many timesfainter than the accretion component. Note that no Brackett linesand only two Paschen lines are detected.
0 2 4 6 8 10 12 14
0.1
1.0
10.0
100.0 2000K
LTEopt.thin
2500K
LTEopt.thin
3000K
LTEopt.thin
5000K
LTEopt.thin
20000K
LTEopt.thin
ISO Cha I 217 Case B
1010 cm 3, 1000 K 1010 cm 3, 10000 K 108 cm 3, 1000 K 108 cm 3, 10000 K
F n /
F β
nup
Fig. 8. Balmer decrements. Results seem to be consistent withan accretion scenario, similar to Par-Lup 3-4 .
5. Summary
Here we present a follow-up X-Shooter study of the BD candi-date ISO-ChaI 217 and its outflow. Previous to this work ISO-ChaI 217 was found to have a bipolar outflow which exhibitedvarious asymmetries and Mout/Macc had been estimated to be >1. The advantage of using X-Shooter is that the source and out-flow can be probed at wavelengths previously not investigatedand that Macc and Mout/Macc can be more accurately estimated.An additional advantage of this study is that data were collectedwith the slit aligned with the derived outflow PA thus allowingthe technique for estimating the PA of outflows using SA to betested (Whelan et al., 2009b) and, the morphology and kinemat-ics of the ISO-ChaI 217 jet studied with distance along the jet.The results can be summarised as follows.
– The outflow is spatially resolved in the [SII]λλ6716, 6731lines and three separate knots at ∼ 0.′′1, 0.′′7 and 1.′′6 are de-tected in the blue-shifted flow. Red-shifted emission extendsto ∼ 1 ′′ with an emission peak at 0.′′2.
– While the velocity asymmetry between the blue-shifted andred-shifted lobes of the outflow is not as pronounced as re-ported in Whelan et al. (2009b) the red-shifted flow is stillfound to be faster than the blue-shifted flow. In Whelan et al.(2009b) the factor by which it was faster was ∼ 2 while hereit is ∼ 1.4. There are also morphological asymmetries in thatthree knots are detected in the blue-shifted jet while only onered-shifted knot is detected. These kinematical and morpho-logical asymmetries can be explained by a pulsed jet modelwhich describes how if different ejection rates are involvedin the opposite sides of a bipolar jet, different knot velocitiesare expected (Bonito et al., 2010a,b). Also Mout is larger inthe red-shifted jet than in the blue-shifted, even when we ac-count for the uncertainty introduced by the use of an upperlimit for the flux of the [N ii] λ6583 line in the red-shiftedjet. This difference in Mout was also found in Whelan et al.(2009b) and this sort of of asymmetry can be reproduced by
8
Whelan, E.T. et al.: X-Shooter Spectroscopy of ISO-ChaI 217
Av (mag) 0.0 1.0 2.5ne Blue (cm−3) 4610 4700 4920ne Red (cm−3 5490 5630 5750Te Blue (104 K) 2.15 2.24 2.34Te Red (104 K) 1.63 1.71 1.81xe Blue 0.078 0.063 0.048xe Red 0.045 0.040 0.034nH Blue (104 cm−3) 6.0 ± 0.8 7.5 ± 1.0 10.3 ± 1.4nH Red (104 cm−3) 12.2 ± 4.4 14.0 ± 5.0 17.0 ± 6.2
Method BLS II Blue (10−8 L�) 1.1 ± 0.3 2.3 ± 0.4 5.6 ± 1.0LS II Red (10−8 L�) 1.4 ± 0.3 2.8 ± 0.5 6.9 ± 1.2Mout (10−12 M�yr−1) Blue 0.7 ± 0.2 1.4 ± 0.3 3.3 ± 0.7Mout (10−12 M�yr−1) Red 1.2 ± 0.5 2.3 ± 0.9 5.3 ± 2.1(Mout Blue + Mout Red) / Macc 0.05 (+0.07)(-0.02) 0.09 (+0.14)(-0.04) 0.20 (+0.30)(-0.09)
Table 2. The jet physical parameters and Mout for the ISO-ChaI 217 blue and red jets. Av here refers to the extinction of the jet andthe calculations are made for three values of Av to investigate the dependence on the jet extinction. The mean value of Macc (Maccmean = 4 × 10⁻¹¹ M�yr−1) is used to calculate Mout/Macc and Macc is derived from the fluxes of the accretion tracers listed in Figure8 corrected for an on-source extinction 2.5 ± 0.3 mag.
the lastest models which account for jet asymmetries (Fendt& Sheikhnezami, 2013).
– Using the improved method for estimate Mout we now placeMout/Macc (for the ISO-ChaI 217 jets combined) at 0.05(+0.07)(-0.02). This value assumes that the outflow is not af-fected by extinction and unlike previous estimates this ratiois now in agreement with predictions of jet launching models(Ferreira et al. , 2006). This agreement still persists even ifwe assume that the extinction affecting the outflow is com-parable to the value of Av measured here for the source. Thisis significant as it is one of the few studies which show thisratio to be the same in BDs as in CTTS (Stelzer et al., 2013;Whelan et al., 2014a).
– Finally by analysing the Balmer decrements of the selectionof Balmer lines found in the ISO-ChaI 217 spectrum it isconcluded that the emission is best fit with a temperature of10,000 K and a density of 1010 cm−3. This confirms that thebulk of the Balmer emission comes from the accretion flowin agreement with the spectro-astrometric analysis of the Hαline.
Overall this work adds to the similarities already observedbetween BD and CTT outflows. Now as well as having kinemat-ical and morphological properties which are comparable to CTTjets Mout/Macc is also comparable in a few cases. Additionally,it demonstrates the usefulness of SA for determining basic in-formation about a BD outflow such as the outflow PA, and thevalue of following up such spectro-astrometric investigationswith high quality spectroscopic observations made parallel tothe jet axis. The methods used here should be applied to a largernumber of BD outflows to better constrain Mout/Macc at the low-est masses.
Acknowledgements. E.T. Whelan acknowledges financial support fromthe BMWi/DLR grant FKZ 50 OR 1309 and from the DeutscheForschungsgemeinschaft through the Research Grant Wh 172/1-1. Thiswork was financially supported by the PRIN INAF 2013 ”Disks, jets andthe dawn of planets”. We thank G. Cupani, V. D’Odorico, P. Goldoni and A.Modigliani for their help with the X-Shooter pipeline. are acknowledgementfor the installation of the different pipeline versions at Capodimonte. We alsothank the ESO staff, in particular F. Patat for suggestions in OB preparation andC. Martayan for support during the observations. Finally we would also like tothank the anonymous referee for their comments.
ReferencesAlcala, J. M., Stelzer, B., Covino, E., et al. 2011, Astronomische Nachrichten,
332, 242Alcala, J. M., Natta, A., Manara, C. F., et al. 2014, A&A, 561, A2Allard, F., Homeier, D., & Freytag, B. 2011, 16th Cambridge Workshop on Cool
Stars, Stellar Systems, and the Sun, 448, 91Baraffe, I., Chabrier, G., Allard, F., et al. 1998, A&A, 337, 403Bonito, R., Orlando, S., Peres, G., Favata, F., & Rosner, R. 2004, A&A, 424, L1Bonito, R., Orlando, S., Peres, G., Favata, F., & Rosner, R. 2007, A&A, 462, 645Bonito, R., Orlando, S., Peres, G., et al. 2010a, A&A, 511, A42Bonito, R., Orlando, S., Miceli, M., et al. 2010b, A&A, 517, A68Cabrit, S. 2009, in Protostellar Jets in Context , by Kanaris Tsinganos, Tom Ray,
Matthias Stute. Astrophysics and Space Science Proceedings Series, Berlin,Springer p. 247
Chabrier, G., Baraffe, I., Allard, F., & Hauschildt, P. 2000, ApJ, 542, 464Coffey, D., Bacciotti, F., & Podio, L. 2008, ApJ, 689, 1112Comeron, F., Fernandez, M., Baraffe, I., Neuhauser, R., & Kaas, A. A. 2003,
A&A, 406, 1001Davis, C. J., Whelan, E., Ray, T. P., & Chrysostomou, A. 2003, A&A, 397, 693Fendt, C., & Sheikhnezami, S. 2013, ApJ, 774, 12Ferreira, J.; Dougados, C.; Cabrit, S. 2006 A&A, 453, 785Fernandez, M., & Comeron, F. 2001, A&A, 380, 264Frank, A., Ray, T. P., Cabrit, S., et al. 2014, arXiv:1402.3553Giannini, T., Nisini, B., Antoniucci, S., et al. 2013, ApJ, 778, 71Gullbring, E., Hartmann, L., Briceno, C., & Calvet, N. 1998, ApJ, 492, 323Hartigan, P., Edwards, S., & Ghandour, L. 1995, ApJ, 452, 736Hartmann, L., Calvet, N., Gullbring, E., & D’Alessio, P. 1998, ApJ, 495, 385Hirth, G. A., Mundt, R., & Solf, J. 1997, A&AS, 126, 437Hummer, D. G., & Storey, P. J. 1987, MNRAS, 224, 801Joergens, V., Herczeg, G., Liu, Y., et al. 2013, Astronomische Nachrichten, 334,
159Joergens, V., Pohl, A., Sicilia-Aguilar, A., & Henning, T. 2012, A&A, 543, A151Luhman, K. L., Stauffer, J., Muench, A., et al. 2003, ApJ, 593, 1093Luhman, K. L. 2007, ApJS, 173, 104Luhman, K. L. 2012, ARA&A, 50, 65Martin, S. C. 1996, ApJ, 470, 537Monin, J.-L., Whelan, E. T., Lefloch, B., Dougados, C., & Alves de Oliveira, C.
2013, A&A, 551, L1Muzerolle, J., Luhman, K. L., Briceno, C., Hartmann, L., & Calvet, N. 2005,
ApJ, 625, 906Nisini, B., Bacciotti, F., Giannini, T., et al. 2005, A&A, 441, 159Persi, P., et al. 2000, A&A, 357, 219Phan-Bao, N., et al. 2008, ApJ, 689, L141Ray, T., Dougados, C., Bacciotti, F., Eisloffel, J., & Chrysostomou, A. 2007,
Protostars and Planets V, p. 231Riddick, F., Roche, P., & Lucas, P. 2007, MNRAS, 381, 1067Stelzer, B., Alcala, J. M., Scholz, A., et al. 2013, A&A, 551, A106Storey, P. J., & Hummer, D. G. 1995, VizieR Online Data Catalog, 6064, 0Todorov, K. O., Luhman, K. L., Konopacky, Q. M., et al. 2014, arXiv:1404.0213Weingartner, J. C., & Draine, B. T. 2001, ApJ, 548, 296
9

Whelan, E.T. et al.: X-Shooter Spectroscopy of ISO-ChaI 217
Whelan, E. T., Ray, T. P., Bacciotti, F., et al. 2005, Nature, 435, 652Whelan, E. T., Ray, T. P., Randich, S., et al. 2007, ApJ, 659, L45Whelan, E. T., Ray, T. P., & Bacciotti, F. 2009a, ApJ, 691, L106Whelan, E. T., Ray, T. P., Podio, L., Bacciotti, F., & Randich, S. 2009b, ApJ,
706, 1054Whelan, E. T., et al. 2010, ApJ, 720, L119Whelan, E. T., Bacciotti, F., Ray, T., & Dougados, C. 2011, IAU Symposium,
275, 396Whelan, E. T., Ray, T. P., Comeron, F., Bacciotti, F., & Kavanagh, P. J. 2012,
ApJ, 761, 120Whelan, E. T., Bonito, R., Antoniucci, S., et al. 2014a, A&A, 565, A80Whelan, E. T., Ray, T.P., Podio, L., Bacciotti, F., Randich, S. 2014, erratum sub-
mitted
10