accumulated data november 2017 - · pdf filemonthly evolution of traffic 7 container ......
TRANSCRIPT

Port of Barcelona traffic statistics
Accumulated data November 2017
Statistics Service
15/12/2017

Traffic indicators
Total traffic 3
Main indicators 4
Breakdown of total traffic 5
Breakdown of traffic in transit 6
Monthly evolution of traffic 7
Container traffic
TEU evolution 8
Container traffic (TEU) 9
Passenger traffic
Passenger traffic 10
Passenger classification 11
Automobile traffic
Automobile traffic 12
Short Sea Shipping traffic (SSS)
SSS Goods classification 13
SSS General cargo and Motorways of the sea (MoS) 14
SSS Ranking countries 15
Vessel traffic
Vessel traffic 16
Goods traffic
Mode of packaging and navigation 17
Goods by classification 4.3.7. 18
Goods ranking 19
Containerized goods by classification 4.3.7. 20
Maritime traffic by origin/destination
Geographical areas. Tonnes 21
Geographical areas. Full TEU non transit 22
Ranquing countries. Full TEU non transit 23
Railway traffic
Evolution of railway traffic (TEU and automobile) 24
Evolution of railway traffic (Solid and liquid bulk) 25
Railway gauge traffic 25
Index

TRAFFIC INDICATORS
% 17-16 % 17-16
2016 2017 %accum.
October
accum.
September
Total throughput (t) 43.552.683 55.055.536 26,4% 24,3% 22,9% 47.512.963
Supplies 1.083.129 1.202.902 11,1% 4,6% 1,6% 1.136.726
Fishing 3.288 2.937 -10,7% -11,1% -8,8% 3.314
TOTAL TRAFFIC (t) 44.639.100 56.261.374 26,0% 23,8% 22,4% 48.653.002
TEU 2.043.626 2.733.274 33,7% 31,1% 31,0% 2.236.960
Passengers (units) 3.809.596 3.948.732 3,7% 1,8% 2,7% 3.958.960
Automobiles (units) 845.504 768.551 -9,1% -9,7% -8,8% 916.834
Vessels (units) 8.026 8.288 3,3% 2,8% 2,7% 8.728
UTI 346.570 368.750 6,4% 6,2% 6,1% 371.882
Total traffic
2016
Accumulated data November 2017
Total traffic
Monthly accumulated
The percentages of increase of previous months correspond to data report closing of previous months. While the percentage increase of the graphics
correspond to the closed data of this month. For this reason we can see this discrepancy between these figures.
6,8%
28,5% 25,9%
20,9%
20,9%
18,8%
20,0%
22,1%
23,2% 24,5%
26,4%
0
5.000.000
10.000.000
15.000.000
20.000.000
25.000.000
30.000.000
35.000.000
40.000.000
45.000.000
50.000.000
55.000.000
60.000.000
0
5.000.000
10.000.000
15.000.000
20.000.000
25.000.000
30.000.000
35.000.000
40.000.000
45.000.000
50.000.000
55.000.000
60.000.000
Gener
Febre
r
Març
Abril
Maig
Juny
Julio
l
Agost
Sete
mbre
Oct
ubre
Novem
bre
Dese
mbre
Monthly evolution of the accumulated traffic of goods. Tonnes.
14,8% 32,4%
34,8%
26,6%
28,0%
27,8%
29,5%
31,6%
32,1%
31,7%
33,7%
0
400.000
800.000
1.200.000
1.600.000
2.000.000
2.400.000
2.800.000
3.200.000
0
400.000
800.000
1.200.000
1.600.000
2.000.000
2.400.000
2.800.000
3.200.000
Gener
Febre
r
Març
Abril
Maig
Juny
Julio
l
Agost
Sete
mbre
Oct
ubre
Novem
bre
Dese
mbre
Monthly evolution of the accumulated traffic of goods. TEU.
2016 2017
3

TRAFFIC INDICATORS
2016 2017 %
Goods indicators by navigation and operation (t)
Navigation (t) 43.552.683 55.055.536 26,4% 59.015.816 47.512.963 24,2%
Domestic 7.478.316 7.959.190 6,4% 8.584.465 8.103.592 5,9%
Foreign 36.074.366 47.096.346 30,6% 50.431.350 39.409.371 28,0%
Operation (t) 43.552.683 55.055.536 26,4% 59.015.816 47.512.963 24,2%
Loaded 17.435.319 18.237.727 4,6% 19.720.843 18.918.435 4,2%
Unloaded 18.218.394 20.328.274 11,6% 22.253.825 20.143.946 10,5%
Transit 7.898.969 16.489.535 108,8% 17.041.147 8.450.581 101,7%
Goods indicators by main units.
Containers (TEU) 2.043.626 2.733.274 33,7% 2.926.608 2.236.960 30,8%
TEU O/D 1.639.474 1.755.202 7,1% 1.920.939 1.805.211 6,4%
TEU transit 404.153 978.072 142,0% 1.005.669 431.750 132,9%
Containerized tonnes 19.080.116 27.390.348 43,6% 29.245.292 20.935.060 39,7%
Level of containerization 65,65% 72,45% 72,88% 66,08%
Passengers (u) 3.809.596 3.948.732 3,7% 4.098.096 3.958.960 3,5%
Regular line 1.213.662 1.353.731 11,5% 1.415.435 1.275.366 11,0%
Pleasure cruises 2.595.934 2.595.001 0,0% 2.682.661 2.683.594 0,0%
Automobiles (u) 845.504 768.551 -9,1% 839.881 916.834 -8,4%
Loaded 535.774 471.136 -12,1% 511.843 576.481 -11,2%
Unloaded 211.846 219.606 3,7% 241.290 233.530 3,3%
Transit 97.884 77.809 -20,5% 86.748 106.823 -18,8%
Vessels (u) 8.026 8.288 3,3% 8.990 8.728 3,0%
Number of calls 8.026 8.288 3,3% 8.990 8.728 3,0%
GT 287.177.244 305.343.662 6,3% 328.505.217 310.338.799 5,9%
Average tonnes by vessel 5.426 6.643 22,4% 6.565 5.444 20,6%
UTI 346.570 368.750 6,4% 394.062 371.882 6,0%
Domestic 221.468 234.286 5,8% 249.364 236.546 5,4%
% Full 65,7% 65,0% 70,1% 70,7%
Foreign 125.102 134.464 7,5% 144.698 135.336 6,9%
% Full 95,0% 94,3% 94,4% 95,1%
Accumulated data November 2017
%
12 months-
2016
Main indicatorsMonthly accumulated
Last 12
months
Total traffic
2016
4

Accumulated data November 2017
TRAFFIC INDICATORS
% 17-16 % 17-16
2016 2017 %accum.
October
accum.
September
Goods indicators by type of packaging (t) 43.552.683 55.055.536 26,4% 24,3% 22,9% 100%
Liquid bulk 10.507.653 13.138.989 25,0% 22,7% 19,1% 23,9%
Hydrocarbons 8.347.723 10.632.495 27,4% 25,7% 20,8% 19,3%
Natural gas 2.251.274 3.611.633 60,4% 66,2% 59,2% 6,6%
Petrol 2.304.657 2.989.534 29,7% 26,1% 25,3% 5,4%
Diesel oils 2.512.820 2.138.793 -14,9% -15,1% -23,1% 3,9%
Fuel oil 1.183.354 1.662.630 40,5% 32,5% 36,0% 3,0%
Other petroleum products 79.425 213.663 169,0% 80,0% 79,1% 0,4%
Remainder 16.193 16.243 0,3% 0,3% 0,0% 0,0%
Other liquid bulk 2.159.930 2.506.494 16,0% 11,3% 12,1% 4,6%
Chemical products 881.361 1.108.122 25,7% 20,7% 24,4% 2,0%
Oils and fats 570.975 718.132 25,8% 22,2% 25,6% 1,3%
Biofuel 533.875 467.233 -12,5% -19,4% -23,0% 0,8%
Other petroleum products 116.015 119.605 3,1% 2,0% 6,4% 0,2%
Natural/artificial fertilizer 37.496 70.768 88,7% 100,9% 59,4% 0,1%
Remainder 20.208 22.635 12,0% -17,9% -17,5% 0,0%
Dry bulk 3.983.111 4.113.159 3,3% -1,1% -3,2% 7,5%
Special installation 3.480.125 3.684.095 5,9% 1,5% -1,0% 6,7%
Soya bean 1.073.205 1.274.901 18,8% 8,5% -1,4% 2,3%
Cement and clinker 1.347.059 1.262.231 -6,3% -8,8% -5,8% 2,3%
Potashes 516.474 571.214 10,6% 11,7% 18,2% 1,0%
Cereals and flours 448.561 490.658 9,4% 0,0% -11,8% 0,9%
Feedstuffs and fodder 94.826 85.090 -10,3% 17,9% 18,7% 0,2%
Remainder 0 0 63,6% -100,0% 0,0%
Without special installation 502.986 429.065 -14,7% -19,3% -18,6% 0,8%
Scrap iron 191.076 220.335 15,3% 6,1% 8,4% 0,4%
Common salt 114.203 116.331 1,9% -9,0% -13,4% 0,2%
Other non-metallic minerals 91.317 59.647 -34,7% -44,9% -41,9% 0,1%
Other minerals and metallic waste 27.299 27.000 -1,1% -35,7% -25,2% 0,0%
Coal 79.090 5.752 -92,7% -87,3% -87,3% 0,0%
Remainder 0 0 0,0%
General cargo 29.061.918 37.803.387 30,1% 28,3% 28,0% 68,7%
Containerized 19.080.116 27.390.348 43,6% 40,6% 40,2% 49,8%
Tares of containers (O/D+Transit) 4.165.420 5.607.768 34,6% 31,9% 31,8% 10,2%
Chemical products 3.371.286 4.075.420 20,9% 18,7% 18,5% 7,4%
Other cargo by type 2.183.940 2.899.063 32,7% 30,3% 30,2% 5,3%
Paper and pulp 1.460.397 2.152.550 47,4% 45,2% 44,0% 3,9%
Other food products 1.080.315 2.064.955 91,1% 82,4% 73,8% 3,8%
Remainder 6.818.758 10.590.593 55,3% 52,7% 53,5% 19,2%
Non-containerized 9.981.802 10.413.039 4,3% 4,4% 4,4% 18,9%
Tare of platform and wagons (Ro-ro) 3.729.283 3.950.566 5,9% 5,9% 5,6% 7,2%
Other cargo by type 1.367.245 1.455.955 6,5% 7,4% 7,7% 2,6%
Automobiles and parts 1.279.503 1.213.342 -5,2% -5,9% -5,3% 2,2%
Machinery and spare parts 794.630 947.084 19,2% 19,7% 21,4% 1,7%
Iron and steel products 762.260 714.665 -6,2% -6,3% -6,5% 1,3%
Remainder 2.048.881 2.131.427 4,0% 4,2% 3,5% 3,9%
Monthly accumulated% of
total
accum.
2017
Breakdown of total traffic
5

Accumulated data November 2017
TRAFFIC INDICATORS
% 17-16 % 17-16
2016 2017 %accum.
October
accum.
September
Goods indicators by type of packaging (t) 7.898.969 16.489.535 108,8% 98,7% 94,9% 100%
Liquid bulk 3.696.963 4.969.535 34,4% 27,6% 26,7% 30,1%
Hydrocarbons 3.096.674 4.271.599 37,9% 30,9% 28,5% 25,9%
Petrol 1.522.887 2.319.404 52,3% 46,4% 46,7% 14,1%
Fuel oil 509.168 942.644 85,1% 64,3% 75,6% 5,7%
Diesel oils 951.076 821.406 -13,6% -14,9% -27,4% 5,0%
Other petroleum products 25.753 188.145 630,6% 393,1% 291,7% 1,1%
Natural gas 87.790 0 -100,0% -100,0% -100,0% 0,0%
Remainder 0 0 -100,0% -61,9% -533,3% 0,0%
Other liquid bulk 600.289 697.936 16,3% 10,5% 17,3% 4,2%
Chemical products 178.919 326.621 82,6% 65,3% 69,8% 2,0%
Biofuel 415.012 312.140 -24,8% -30,3% -26,8% 1,9%
Other petroleum products 4.770 43.147 804,5% 804,5% 804,5% 0,3%
Oils and fats 1.400 16.028 1044,9% 1044,9% 1044,9% 0,1%
Wines, beverages, spirits and derivatives 188 0 -100,0% -100,0% -100,0% 0,0%
Remainder 0 0 -349,4% -159,6% -139,4% 0,0%
Dry bulk 0 0 0,0%
Special installation 0 0 0,0%
0 0 0,0%
0 0 0,0%
0 0 0,0%
0 0 0,0%
0 0 0,0%
Remainder 0 0 0,0%
Without special installation 0 0 0,0%
0 0 0,0%
0 0 0,0%
0 0 0,0%
0 0 0,0%
0 0 0,0%
Remainder 0 0 0,0%
General cargo 4.202.006 11.520.000 174,2% 162,5% 155,1% 69,9%
Containerized 3.925.451 11.264.687 187,0% 174,5% 166,3% 68,3%
Tares of containers (O/D+Transit) 822.664 2.024.557 146,1% 134,8% 133,6% 12,3%
Other food products 291.251 1.203.312 313,2% 279,5% 246,4% 7,3%
Chemical products 447.883 1.001.177 123,5% 113,5% 107,3% 6,1%
Other cargo by type 407.109 994.468 144,3% 131,7% 125,3% 6,0%
Other construction materials 473.807 762.935 61,0% 56,3% 54,6% 4,6%
Remainder 1.482.737 5.278.239 256,0% 245,0% 235,5% 32,0%
Non-containerized 276.555 255.312 -7,7% -8,7% -10,1% 1,5%
Automobiles and parts 137.430 111.458 -18,9% -17,7% -15,6% 0,7%
Machinery and spare parts 40.745 38.657 -5,1% 2,0% 1,6% 0,2%
Other cargo by type 37.625 34.164 -9,2% -16,0% -21,3% 0,2%
Tare of platform and wagons (Ro-ro) 29.466 28.824 -2,2% -8,3% -13,5% 0,2%
Chemical products 7.358 7.214 -2,0% -10,8% -11,3% 0,0%
Remainder 23.931 34.996 46,2% 38,1% 27,4% 0,2%
Breakdown of traffic in transit
Monthly accumulated% of
total
accum.
2017
6

TRAFFIC INDICATORS
Monthly evolution of traffic. Tonnes
2016 2017 MonthlyAccumu-
lated2016 2017 Monthly
Accumu-
lated
January 3.370.310 3.599.933 6,8% 6,8% 2.300.690 2.275.779 -1,1% -1,1%
February 3.336.190 5.020.382 50,5% 28,5% 2.160.541 2.803.130 29,7% 13,8%
March 4.233.539 5.152.313 21,7% 25,9% 2.634.422 2.724.416 3,4% 10,0%
April 3.979.229 4.266.400 7,2% 20,9% 2.712.251 2.693.654 -0,7% 7,0%
May 4.419.940 5.350.111 21,0% 20,9% 2.874.212 3.073.430 6,9% 7,0%
June 4.401.245 4.805.191 9,2% 18,8% 2.814.721 2.760.581 -1,9% 5,4%
July 4.612.149 5.833.163 26,5% 20,0% 2.826.414 3.166.678 12,0% 6,4%
August 3.942.147 5.414.286 37,3% 22,1% 2.703.732 2.790.020 3,2% 6,0%
September 3.879.599 5.122.112 32,0% 23,2% 2.560.426 2.873.589 12,2% 6,7%
October 3.872.788 5.287.228 36,5% 24,5% 2.577.317 2.988.086 15,9% 7,6%
November 3.505.547 5.204.418 48,5% 26,4% 2.446.551 2.911.682 19,0% 8,6%
December 4.021.955 -100,0% -100,0% 2.621.474 -100,0% -100,0%
47.574.638 55.055.536 31.232.752 31.061.045
Monthly evolution of traffic. TEU
2016 2017 MonthlyAccumu-
lated2016 2017 Monthly
Accumu-
lated
January 157.211 180.414 14,8% 14,8% 96.618 105.043 8,7% 8,7%
February 163.296 243.853 49,3% 32,4% 101.161 114.761 13,4% 11,1%
March 173.065 241.198 39,4% 34,8% 108.783 111.856 2,8% 8,2%
April 192.471 202.923 5,4% 26,6% 114.707 118.546 3,3% 6,9%
May 200.216 266.294 33,0% 28,0% 110.152 119.975 8,9% 7,3%
June 187.730 238.409 27,0% 27,8% 117.516 108.766 -7,4% 4,6%
July 221.235 303.665 37,3% 29,5% 119.369 132.885 11,3% 5,7%
August 199.492 289.835 45,3% 31,6% 110.952 117.767 6,1% 5,7%
September 193.153 263.254 36,3% 32,1% 117.137 124.168 6,0% 5,8%
October 195.276 250.634 28,3% 31,7% 118.964 115.740 -2,7% 4,9%
November 160.483 252.795 57,5% 33,7% 101.471 118.110 16,4% 5,8%
December 199.957 -100,0% -100,0% 113.630 -100,0% -100,0%
2.243.583 2.733.274 1.330.459 1.287.616
%
Total
% %
Accumulated data November 2017
Monthly evolution of
traffic
Total TEU Full TEU (transit not included)
Total
Monthly evolution of
traffic
Total tonnes % Tonnes (tares & transits not included)
2.000.000
2.500.000
3.000.000
3.500.000
4.000.000
4.500.000
5.000.000
5.500.000
6.000.000
6.500.000
January
Febru
ary
Marc
h
April
May
June
July
August
Septe
mber
Oct
ober
Novem
ber
Dece
mber
Goods. (total Tonnes)
2016 2017 2016 2017
Tonnes (tares & transits not included)
Tonnes
0
25.000
50.000
75.000
100.000
125.000
150.000
175.000
200.000
225.000
250.000
275.000
300.000
325.000
January
Febru
ary
Marc
h
April
May
June
July
August
Septe
mber
Oct
ober
Novem
ber
Dece
mber
Containers. (total TEU)
2016 2017 2016 2017
TEU
Full TEU (transit not included)
7

TRAFFIC INDICATORS
TEU evolution
2016 2017 Monthly Accumulated 2016 2017 Monthly Accumulated
January 43.462 44.083 1,4% 1,4% January 44.294 51.611 16,5% 16,5%
February 39.185 44.636 13,9% 7,3% February 52.494 60.353 15,0% 15,7%
March 42.606 38.382 -9,9% 1,5% March 55.989 61.797 10,4% 13,7%
April 45.584 50.498 10,8% 4,0% April 57.676 57.920 0,4% 10,1%
May 44.120 50.892 15,3% 6,3% May 55.821 58.199 4,3% 8,9%
June 49.765 48.033 -3,5% 4,5% June 57.515 50.254 -12,6% 5,0%
July 46.762 52.541 12,4% 5,6% July 60.409 68.356 13,2% 6,3%
August 43.206 49.094 13,6% 6,6% August 57.994 58.888 1,5% 5,7%
September 42.398 55.933 31,9% 9,3% September 63.336 57.408 -9,4% 3,8%
October 43.833 44.021 0,4% 8,4% October 64.314 61.350 -4,6% 2,9%
November 37.805 43.312 14,6% 8,9% November 53.930 63.510 17,8% 4,1%
December 39.602 -100,0% 0,6% December 63.927 -100,0% -5,5%
Total 518.324 521.423 Total 687.697 649.645
2016 2017 Monthly Accumulated 2016 2017 Monthly Accumulated
January 1.664 1.883 13,2% 13,2% January 7.199 7.466 3,7% 3,7%
February 1.981 1.733 -12,5% -0,8% February 7.502 8.039 7,2% 5,5%
March 2.217 1.765 -20,4% -8,2% March 7.972 9.913 24,4% 12,1%
April 2.026 1.812 -10,6% -8,8% April 9.422 8.317 -11,7% 5,1%
May 2.054 1.852 -9,8% -9,0% May 8.157 9.033 10,7% 6,3%
June 2.039 1.648 -19,2% -10,7% June 8.198 8.831 7,7% 6,5%
July 1.828 1.806 -1,2% -9,5% July 10.371 10.184 -1,8% 5,0%
August 1.842 1.917 4,1% -7,9% August 7.911 7.868 -0,5% 4,4%
September 2.212 1.686 -23,8% -9,9% September 9.193 9.142 -0,5% 3,8%
October 2.094 1.973 -5,8% -9,4% October 8.724 8.397 -3,7% 3,0%
November 2.014 2.072 2,9% -8,3% November 7.723 9.216 19,3% 4,4%
December 1.894 -100,0% -15,6% December 8.208 -100,0% -4,1%
Total 23.863 20.144 Total 100.576 96.404
2016 2017 Monthly Accumulated 2016 2017 Monthly Accumulated
January 20.401 28.957 41,9% 41,9% January 40.192 46.415 15,5% 15,5%
February 18.831 72.498 285,0% 158,6% February 43.305 56.594 30,7% 23,4%
March 18.602 65.598 252,6% 188,9% March 45.681 63.744 39,5% 29,1%
April 24.852 35.280 42,0% 144,7% April 52.912 49.098 -7,2% 18,5%
May 36.740 80.292 118,5% 136,7% May 53.325 66.027 23,8% 19,7%
June 20.814 68.613 229,7% 150,5% June 49.401 61.031 23,5% 20,4%
July 44.111 92.030 108,6% 140,4% July 57.755 78.750 36,4% 23,1%
August 21.534 86.012 299,4% 157,1% August 67.006 86.057 28,4% 24,0%
September 22.507 70.708 214,2% 162,7% September 53.510 68.378 27,8% 24,4%
October 18.873 74.734 296,0% 172,9% October 57.439 60.160 4,7% 22,2%
November 17.559 80.047 355,9% 185,0% November 41.454 54.638 31,8% 22,9%
December 32.185 -100,0% 154,1% December 54.142 -100,0% 12,1%
Total 297.006 754.768 Total 616.119 690.890
Full - TransitFull TEU %
Accumulated data November 2017
EmptyEmpty TEU %
Full-unloaded
domestic
Full TEU % Full-loaded
domestic
Full TEU %
Full-unloaded
foreign
Full TEU % Full-loaded
foreign
Full TEU %
8

CONTAINER TRAFFIC
TEU
Domestic Foreign Total Domestic Foreign Total %
Total traffic 226.607 1.817.020 2.043.626 223.105 2.510.169 2.733.274 33,7%
Unloaded 119.230 907.845 1.027.075 109.007 1.265.125 1.374.132 33,8%
Roll On-Roll Off 29.759 12.039 41.798 26.540 13.474 40.014 -4,3%
Lift On-Lift Off 89.471 895.806 985.277 82.467 1.251.651 1.334.118 35,4%
Loaded 107.377 909.175 1.016.552 114.098 1.245.044 1.359.142 33,7%
Roll On-Roll Off 31.835 14.530 46.365 31.066 13.183 44.249 -4,6%
Lift On-Lift Off 75.542 894.645 970.186 83.032 1.231.861 1.314.893 35,5%
Domestic Foreign Total Domestic Foreign Total %
Loaded 107.246 716.031 823.277 113.655 771.475 885.130 7,5%
Full 92.368 623.770 716.138 96.404 649.645 746.050 4,2%
Empty 14.878 92.261 107.139 17.251 121.830 139.081 29,8%
Unloaded 113.656 702.542 816.197 107.289 762.783 870.072 6,6%
Full 21.969 478.722 500.691 20.144 521.423 541.567 8,2%
Empty 91.687 223.820 315.507 87.145 241.360 328.505 4,1%
Transit 5.705 398.448 404.153 2.161 975.911 978.072 142,0%
Full 260 264.561 264.821 510 754.258 754.768 185,0%
Empty 5.445 133.887 139.332 1.651 221.653 223.304 60,3%
Total traffic 226.607 1.817.020 2.043.626 223.105 2.510.169 2.733.274 33,7%
Full 114.597 1.367.053 1.481.649 117.058 1.925.327 2.042.384 37,8%
Empty 112.010 449.967 561.977 106.047 584.843 690.890 22,9%
% Empty 49,4% 24,8% 27,5% 47,5% 23,3% 25,3%
% Transit 2,5% 21,9% 19,8% 1,0% 38,9% 35,8%
Breakdown by navigation and
operation (TEU)
Monthly accumulated 2016 Monthly accumulated 2017
Accumulated data November 2017
Container traffic (TEU)Monthly accumulated 2016 Monthly accumulated 2017
404.153
978.072
816.197
870.072
823.277
885.130
0
500.000
1.000.000
1.500.000
2.000.000
2.500.000
3.000.000
2016 2017
General cargo distribution by operation. (TEU )
Loaded
Unloaded
Transit
9
PASSENGER TRAFFIC
% 17-16 % 17-16
2016 2017 %accum.
October
accum.
September
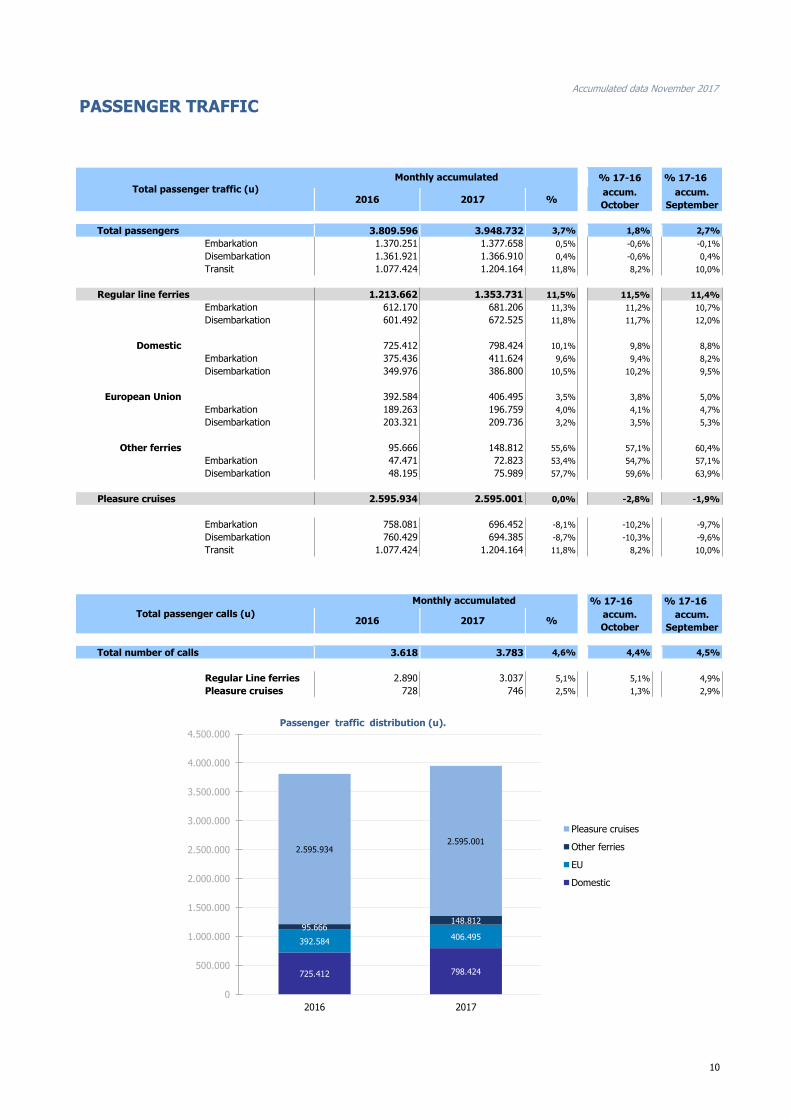
Total passengers 3.809.596 3.948.732 3,7% 1,8% 2,7%
Embarkation 1.370.251 1.377.658 0,5% -0,6% -0,1%
Disembarkation 1.361.921 1.366.910 0,4% -0,6% 0,4%
Transit 1.077.424 1.204.164 11,8% 8,2% 10,0%
Regular line ferries 1.213.662 1.353.731 11,5% 11,5% 11,4%
Embarkation 612.170 681.206 11,3% 11,2% 10,7%
Disembarkation 601.492 672.525 11,8% 11,7% 12,0%
Domestic 725.412 798.424 10,1% 9,8% 8,8%
Embarkation 375.436 411.624 9,6% 9,4% 8,2%
Disembarkation 349.976 386.800 10,5% 10,2% 9,5%
European Union 392.584 406.495 3,5% 3,8% 5,0%
Embarkation 189.263 196.759 4,0% 4,1% 4,7%
Disembarkation 203.321 209.736 3,2% 3,5% 5,3%
Other ferries 95.666 148.812 55,6% 57,1% 60,4%
Embarkation 47.471 72.823 53,4% 54,7% 57,1%
Disembarkation 48.195 75.989 57,7% 59,6% 63,9%
Pleasure cruises 2.595.934 2.595.001 0,0% -2,8% -1,9%
Embarkation 758.081 696.452 -8,1% -10,2% -9,7%
Disembarkation 760.429 694.385 -8,7% -10,3% -9,6%
Transit 1.077.424 1.204.164 11,8% 8,2% 10,0%
% 17-16 % 17-16
2016 2017 %accum.
October
accum.
September
Total number of calls 3.618 3.783 4,6% 4,4% 4,5%
Regular Line ferries 2.890 3.037 5,1% 5,1% 4,9%
Pleasure cruises 728 746 2,5% 1,3% 2,9%
Total passenger traffic (u)
Total passenger calls (u)
Monthly accumulated
Accumulated data November 2017
Monthly accumulated
725.412 798.424
392.584 406.495
95.666 148.812
2.595.934 2.595.001
0
500.000
1.000.000
1.500.000
2.000.000
2.500.000
3.000.000
3.500.000
4.000.000
4.500.000
2016 2017
Passenger traffic distribution (u).
Pleasure cruises
Other ferries
EU
Domestic
10

PASSENGER CLASSIFICATION
2016 2017 Monthly Accumulated
January 69.769 56.730 -18,7% -18,7%
February 84.764 68.035 -19,7% -19,3%
March 102.284 100.692 -1,6% -12,2%
April 222.867 243.425 9,2% -2,3%
May 270.155 296.856 9,9% 2,1%
June 266.406 272.967 2,5% 2,2%
July 361.356 318.534 -11,9% -1,5%
August 355.840 331.825 -6,7% -2,6%
September 332.914 342.199 2,8% -1,7%
October 391.840 362.327 -7,5% -2,6%
November 137.739 201.411 46,2% 0,0%
December 87.565 -100,0% -3,3%
2.683.499 2.595.001
2016 2017 Monthly Accumulated
January 44.113 51.679 17,2% 17,2%
February 38.751 44.939 16,0% 16,6%
March 81.564 75.117 -7,9% 4,4%
April 84.393 124.314 47,3% 19,0%
May 85.349 93.667 9,7% 16,6%
June 143.669 147.690 2,8% 12,5%
July 203.268 220.749 8,6% 11,3%
August 280.949 311.487 10,9% 11,2%
September 128.612 145.274 13,0% 11,4%
October 74.578 84.080 12,7% 11,5%
November 48.416 54.735 13,1% 11,5%
December 60.568 -100,0% 6,2%
1.274.230 1.353.731
2016 2017 Monthly Accumulated
January 113.882 108.409 -4,8% -4,8%
February 123.515 112.974 -8,5% -6,7%
March 183.848 175.809 -4,4% -5,7%
April 307.260 367.739 19,7% 5,0%
May 355.504 390.523 9,9% 6,6%
June 410.075 420.657 2,6% 5,5%
July 564.624 539.283 -4,5% 2,8%
August 636.789 643.312 1,0% 2,3%
September 461.526 487.473 5,6% 2,8%
October 466.418 446.407 -4,3% 1,9%
November 186.155 256.146 37,6% 3,7%
December 148.133 -100,0% -0,2%
3.957.729 3.948.732
Monthly evolution of
passenger traffic
Total
Monthly evolution of
passenger traffic
Total
Accumulated data November 2017
Total
Monthly evolution of
passenger traffic
Pleasure cruises %
Regular lines ferries %
Total passengers %
0
100.000
200.000
300.000
400.000
500.000
600.000
January
Febru
ary
Marc
h
April
May
June
July
August
Septe
mber
Oct
ober
Novem
ber
Dece
mber
Pleasure cruises (u)
2016 2017
0
100.000
200.000
300.000
400.000
500.000
600.000
January
Febru
ary
Marc
h
April
May
June
July
August
Septe
mber
Oct
ober
Novem
ber
Dece
mber
Regular lines ferries (u)
0
100.000
200.000
300.000
400.000
500.000
600.000
700.000
January
Febru
ary
Marc
h
April
May
June
July
August
Septe
mber
Oct
ober
Novem
ber
Dece
mber
Total passengers (u)
11

AUTOMOBILE TRAFFIC
% 17-16 % 17-16
2016 2017 %accum.
October
accum.
September
Automobile traffic by navigation and operation. 845.504 768.551 -9,1% -9,7% -8,8%
Domestic 128.056 125.881 -1,7% -5,3% -2,4%
Loaded 104.296 102.881 -1,4% -4,6% -2,0%
Unloaded 23.760 22.995 -3,2% -8,8% -5,1%
Transit 0 5 0,0% 0,0%
Foreign 717.448 642.670 -10,4% -10,5% -9,9%
Loaded 431.478 368.255 -14,7% -15,5% -15,0%
Unloaded 188.086 196.611 4,5% 5,6% 4,5%
Transit 97.884 77.804 -20,5% -19,2% -16,0%
2016 2017 2016 2017 Monthly Accumulated
January 54.598 54.452 54.598 54.452 -0,3% -0,3%
February 63.409 59.123 118.007 113.575 -6,8% -3,8%
March 90.362 90.893 208.369 204.468 0,6% -1,9%
April 87.750 74.714 296.119 279.182 -14,9% -5,7%
May 87.722 84.282 383.841 363.464 -3,9% -5,3%
June 93.972 72.750 477.813 436.214 -22,6% -8,7%
July 83.310 75.347 561.123 511.561 -9,6% -8,8%
August 46.588 43.219 607.711 554.780 -7,2% -8,7%
September 69.681 63.179 677.392 617.959 -9,3% -8,8%
October 85.911 71.563 763.303 689.522 -16,7% -9,7%
November 82.201 79.029 845.504 768.551 -3,9% -9,1%
December 71.698 917.202 768.551 -100,0% -16,2%
Accumulated data November 2017
%
Total automobile traffic (u)
Monthly automobile traffic (u)
Monthly Accumulated
Monthly accumulated
54.598
63.409
90.362 87.750
87.722 93.972
83.310
46.588
69.681
85.911 82.201
71.698
54.452
59.123
90.893
74.714
84.282
72.750
75.347
43.219
63.179
71.563 79.029
0
10.000
20.000
30.000
40.000
50.000
60.000
70.000
80.000
90.000
100.000
January February March April May June July August September October November December
Evolution of monthly automobile traffic.
2016 2017
12

SHORT SEA SHIPPING (SSS)
2016 2017 %% of total
port traffic
Liquid bulk 6.604.431 7.967.699 20,6% 60,6%
Dry bulk 1.633.660 1.449.250 -11,3% 35,2%
Containerized cargo 6.425.354 7.951.318 23,7% 29,8%
Ro-Ro 8.646.946 9.217.613 6,6% 99,4%
Non-containerized cargo 624.042 574.685 -7,9% 78,3%
Automobile 898.629 830.441 -7,6% 76,3%
Total 24.833.062 27.991.006 12,7% 50,8%
2016 2017 % 2016 2017 % 2016 2017 %
Containerized cargo 852.125 910.784 6,9% 5.573.228 7.040.533 26,3% 6.425.354 7.951.318 23,7%
O/D 829.286 867.601 4,6% 3.395.488 3.335.913 -1,8% 4.224.774 4.203.515 -0,5%
Transit 22.839 43.183 89,1% 2.177.740 3.704.620 70,1% 2.200.579 3.747.803 70,3%
Ro-Ro 5.028.383 5.332.546 6,0% 3.618.563 3.885.068 7,4% 8.646.946 9.217.613 6,6%
O/D 5.028.333 5.332.353 6,0% 3.504.384 3.768.807 7,5% 8.532.717 9.101.159 6,7%
Transit 50 193 287,8% 114.179 116.261 1,8% 114.229 116.454 1,9%
Non-containerized cargo 6.609 7.277 10,1% 617.433 567.409 -8,1% 624.042 574.685 -7,9%
O/D 6.501 7.247 11,5% 602.179 549.816 -8,7% 608.680 557.063 -8,5%
Transit 108 30 -72,2% 15.254 17.593 15,3% 15.362 17.623 14,7%
Automobile 154.664 170.208 10,1% 743.965 660.233 -11,3% 898.629 830.441 -7,6%
O/D 153.797 169.212 10,0% 646.054 585.176 -9,4% 799.851 754.388 -5,7%
Transit 867 996 14,8% 97.911 75.057 -23,3% 98.778 76.053 -23,0%
Spanish Islands SSS Remainder
Accumulated data November 2017
TOTAL
SSS Goods classification
Goods classification.
Tonnes
Monthly accumulated %
SSS General Cargo
Short Sea Shipping (SSS): The transport of cargo/goods and passengers between
ports situated in the European Union or between these ports and non-European ports
with a coastline in seas bordering Europe. This applies to cargo either originating from
or is destinated for these countries (in accordance with the European Shortsea
Network).
Motorways of the sea (MoS): Short Sea Shipping services as an alternative to road
transport and which fulfil the following criteria: minimum frequency of 3 calls per
week and calling at a maximum of 3 different ports.
General cargo:
Including containerized cargo, non-containerized cargo, Ro-Ro and automobiles.
Containerized cargo:
Excluding container cargo by Ro-Ro.
Non-containerized cargo: General non-containerized goods other than Ro-Ro and
excluding automobiles.
Ro-Ro:
General cargo carried in UTI's. Excluding automobiles
0
200
400
600
800
1.000
1.200
Bulk cargo evolution.(Kt)
Liquid bulk 2016 Liquid bulk 2017Dry bulk 2016 Dry bulk 2017
0
200
400
600
800
1.000
1.200
Containerized & Ro-Ro cargo evolution.(Kt)
Cont. 2016 Cont. 2017Ro-Ro 2016 Ro-Ro 2017
0
20
40
60
80
100
120
Non-cont. & automobile cargo evolution.(Kt)
Non-Cont. 2016 Non-Cont. 2017
Automobile 2016 Automobile 2017
SSS goods classification. (Kt)
2016 2017
13

SHORT SEA SHIPPING (SSS)
2016 2017 % 2016 2017 % 2016 2017 %
Containerized cargo. TEU 125.888 138.291 9,9% 687.133 777.962 13,2% 813.021 916.253 12,7%
O/D 123.568 134.004 8,4% 494.192 424.993 -14,0% 617.760 558.997 -9,5%
Full 76.444 79.442 3,9% 215.525 224.585 4,2% 291.969 304.026 4,1%
Empty 47.124 54.563 15,8% 278.667 200.408 -28,1% 325.791 254.971 -21,7%
Transit 2.321 4.287 84,7% 192.941 352.970 82,9% 195.261 357.257 83,0%
Full 1.766 3.278 85,6% 156.982 268.950 71,3% 158.748 272.228 71,5%
Empty 555 1.009 82,0% 35.959 84.020 133,7% 36.513 85.029 132,9%
Ro-Ro. UTI 220.425 233.519 5,9% 124.973 133.937 7,2% 345.398 367.455 6,4%
Full 144.933 151.969 4,9% 118.195 125.883 6,5% 263.128 277.851 5,6%
Empty 75.492 81.550 8,0% 6.778 8.054 18,8% 82.270 89.604 8,9%
125.122 125.811 0,6% 526.020 460.910 -12,4% 651.142 586.721 -9,9%
O/D 124.401 124.963 0,5% 453.200 405.245 -10,6% 577.601 530.208 -8,2%
Transit 721 848 17,6% 72.820 55.665 -23,6% 73.541 56.513 -23,2%
2016 2017 % 2016 2017 % 2016 2017 %
Tonnes 3.614.250 3.884.269 7,5% 31.021 26.373 -15,0% 3.645.271 3.910.642 7,3%
Loaded 1.903.987 2.068.526 8,6% 20.877 17.111 -18,0% 1.924.864 2.085.637 8,4%
Unloaded 1.710.263 1.815.743 6,2% 10.144 9.261 -8,7% 1.720.407 1.825.005 6,1%
UTI 118.540 127.705 7,7% 1.650 1.439 -12,8% 120.190 129.144 7,4%
Loaded 60.067 65.215 8,6% 969 856 -11,7% 61.036 66.071 8,2%
Unloaded 58.473 62.490 6,9% 681 583 -14,4% 59.154 63.073 6,6%
Automobile units 133.444 128.574 -3,6% 1.183 532 -55,0% 134.627 129.106 -4,1%
Loaded 126.960 119.945 -5,5% 1.181 529 -55,2% 128.141 120.474 -6,0%
Unloaded 6.484 8.629 33,1% 2 3 50,0% 6.486 8.632 33,1%
UTI : All those means of unitization, self-propelled or otherwise, that are directly or indirectly used as a means of land transport (e.g. trailers, platforms, trucks, freezer trucks,
etc.) are considered as UTI. Containers are not considered to be included, except those that are handled by an equipment transport of the own terminal.
Motorways of the Sea.
(MoS)
Accumulated data November 2017
SSS General cargo.
Units
TOTALSpanish Islands SSS Remainder
Non-EU TOTALEU
0
25.000
50.000
75.000
100.000
125.000
150.000
175.000
200.000
225.000
250.000
Spanish Islands2016
Spanish Islands2017
Ro-Ro. UTI
0
20.000
40.000
60.000
80.000
100.000
120.000
140.000
160.000
Spanish Islands2016
Spanish Islands2017
Cont. TEU
0
50.000
100.000
150.000
200.000
250.000
300.000
350.000
400.000
450.000
MoS. Tonnes
2016 2017
0
2.000
4.000
6.000
8.000
10.000
12.000
14.000
MoS. UTI
2016 20170
2.000
4.000
6.000
8.000
10.000
12.000
14.000
16.000
18.000
MoS. Automobile units
2016 2017
Empty
0
20.000
40.000
60.000
80.000
100.000
120.000
140.000
160.000
Spanish Islands2016
Spanish Islands2017
Automobile. Units
Empty
Full Full
Transit
O/D O/D
Transit
Transit
O/D O/D
Transit
14
SHORT SEA SHIPPING (SSS)
SSS Ranking countries by mode of packaging
2016 2017 %
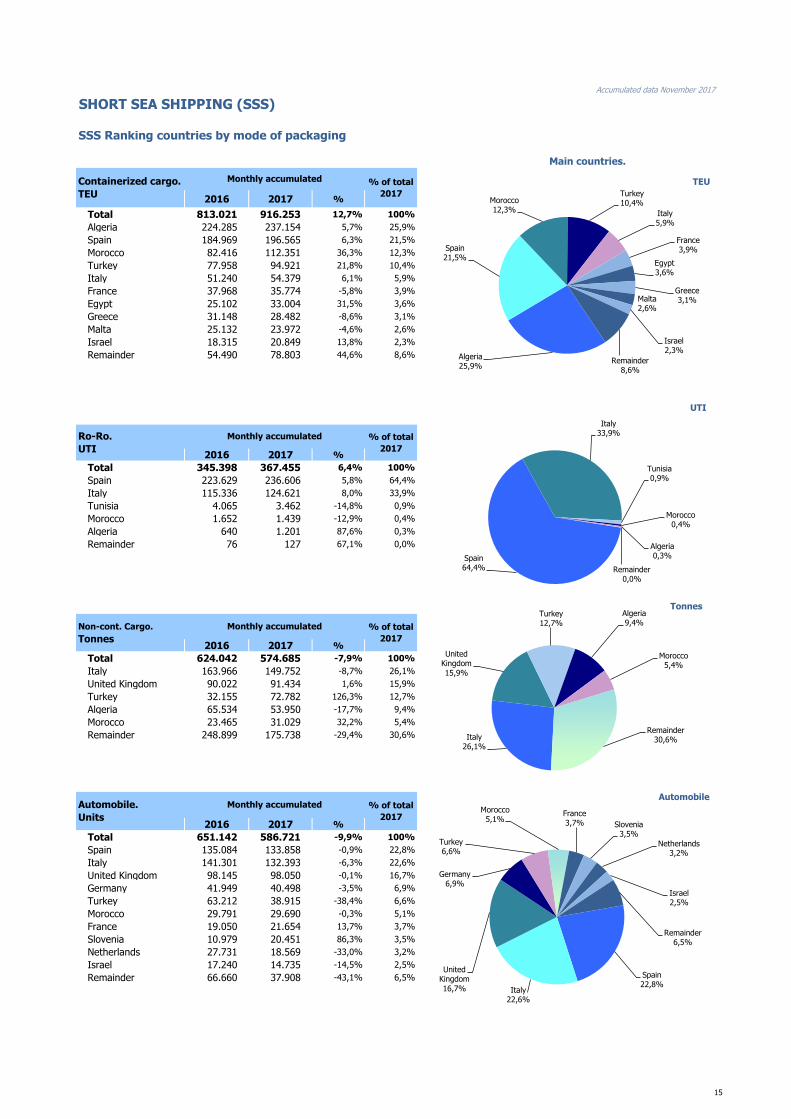
Total 813.021 916.253 12,7% 100%
Algeria 224.285 237.154 5,7% 25,9%
Spain 184.969 196.565 6,3% 21,5%
Morocco 82.416 112.351 36,3% 12,3%
Turkey 77.958 94.921 21,8% 10,4%
Italy 51.240 54.379 6,1% 5,9%
France 37.968 35.774 -5,8% 3,9%
Egypt 25.102 33.004 31,5% 3,6%
Greece 31.148 28.482 -8,6% 3,1%
Malta 25.132 23.972 -4,6% 2,6%
Israel 18.315 20.849 13,8% 2,3%
Remainder 54.490 78.803 44,6% 8,6%
2016 2017 %
Total 345.398 367.455 6,4% 100%
Spain 223.629 236.606 5,8% 64,4%
Italy 115.336 124.621 8,0% 33,9%
Tunisia 4.065 3.462 -14,8% 0,9%
Morocco 1.652 1.439 -12,9% 0,4%
Algeria 640 1.201 87,6% 0,3%
Remainder 76 127 67,1% 0,0%
2016 2017 %
Total 624.042 574.685 -7,9% 100%
Italy 163.966 149.752 -8,7% 26,1%
United Kingdom 90.022 91.434 1,6% 15,9%
Turkey 32.155 72.782 126,3% 12,7%
Algeria 65.534 53.950 -17,7% 9,4%
Morocco 23.465 31.029 32,2% 5,4%
Remainder 248.899 175.738 -29,4% 30,6%
2016 2017 %
Total 651.142 586.721 -9,9% 100%
Spain 135.084 133.858 -0,9% 22,8%
Italy 141.301 132.393 -6,3% 22,6%
United Kingdom 98.145 98.050 -0,1% 16,7%
Germany 41.949 40.498 -3,5% 6,9%
Turkey 63.212 38.915 -38,4% 6,6%
Morocco 29.791 29.690 -0,3% 5,1%
France 19.050 21.654 13,7% 3,7%
Slovenia 10.979 20.451 86,3% 3,5%
Netherlands 27.731 18.569 -33,0% 3,2%
Israel 17.240 14.735 -14,5% 2,5%
Remainder 66.660 37.908 -43,1% 6,5%
Monthly accumulated
Monthly accumulated
Accumulated data November 2017
Non-cont. Cargo.
Tonnes
% of total
2017
Automobile.
Units
% of total
2017
Ro-Ro.
UTI
% of total
2017
Containerized cargo.
TEU
% of total
2017
Monthly accumulated
Monthly accumulated
Main countries.
Spain 22,8%
Italy 22,6%
United Kingdom 16,7%
Germany 6,9%
Turkey 6,6%
Morocco 5,1%
France 3,7% Slovenia
3,5%
Netherlands 3,2%
Israel 2,5%
Remainder 6,5%
Automobile
Italy 26,1%
United Kingdom 15,9%
Turkey 12,7%
Algeria 9,4%
Morocco 5,4%
Remainder 30,6%
Tonnes
Spain 64,4%
Italy 33,9%
Tunisia 0,9%
Morocco 0,4%
Algeria 0,3%
Remainder 0,0%
UTI
Algeria 25,9%
Spain 21,5%
Morocco 12,3%
Turkey 10,4%
Italy 5,9%
France 3,9%
Egypt 3,6%
Greece 3,1% Malta
2,6%
Israel 2,3%
Remainder 8,6%
TEU
15

VESSELS TRAFFIC
2016 2017 %
Number of calls 8.026 8.288 3,3%
Tonnage 287.177.244 305.343.662 6,3%
Average tonnes 35.781 36.842 3,0%
Type of vessels
Calls GT Calls GT Calls GT
Total 8.026 287.177.244 8.288 305.343.662 3,3% 6,3%
Car-carrier 1.352 47.025.457 1.090 40.000.411 -19,4% -14,9%
Càrrega (LO-LO) 574 2.745.802 533 2.456.521 -7,1% -10,5%
Refrigerators 0 0 0 0
Granelers 133 3.237.458 114 3.358.438 -14,3% 3,7%
Passatge 728 66.510.541 743 67.647.964 2,1% 1,7%
Petroliers 826 13.213.745 909 17.359.243 10,0% 31,4%
Portacontenidors 2.035 81.240.854 2.191 94.976.303 7,7% 16,9%
Transbordadors 2.378 73.203.387 2.708 79.544.782 13,9% 8,7%
Calls GT Calls GT
Total 2.554 61.007.999 5.734 244.335.663
Car-carrier 82 1.394.391 1.008 38.606.020
Càrrega (LO-LO) 36 161.234 497 2.295.287
Refrigerators 0 0 0 0
Granelers 1 36.311 113 3.322.127
Passatge 74 3.939.345 669 63.708.619
Petroliers 86 1.051.981 823 16.307.262
Portacontenidors 254 3.715.722 1.937 91.260.581
Transbordadors 2.021 50.709.015 687 28.835.767
Type of vessels (Monthly accumulated 2017)
Accumulated data November 2017
%
ForeignDomestic
Vessel trafficMonthly accumulated
Monthly accumulated
2016 2017
Car-carrier 13,2%
Càrrega (LO-LO) 6,4%
Granelers 1,4%
Passatge 9,0%
Petroliers 11,0%
Portacontenidors 26,4%
Transbordadors 32,7%
Distribution by type of vessel.
16

GOODS TRAFFIC
Domestic Foreign Total Domestic Foreign Total %
Hydrocarbons 913.185 7.434.538 8.347.723 1.106.216 9.526.280 10.632.495 27,4%
Incoming 913.185 5.744.047 6.657.232 1.066.918 6.995.356 8.062.274 21,1%
Outgoing 0 1.690.491 1.690.491 39.297 2.530.924 2.570.221 52,0%
Other liquid bulk 235.975 1.923.955 2.159.930 219.002 2.287.492 2.506.494 16,0%
Incoming 163.833 1.244.527 1.408.360 144.982 1.593.838 1.738.820 23,5%
Outgoing 72.142 679.428 751.570 74.020 693.654 767.674 2,1%
Dry bulk 165.757 3.817.354 3.983.111 140.482 3.972.677 4.113.159 3,3%
Incoming 126.458 1.813.528 1.939.986 98.234 2.006.435 2.104.669 8,5%
Outgoing 39.299 2.003.826 2.043.125 42.248 1.966.242 2.008.490 -1,7%
Containerized cargo 1.350.624 17.729.492 19.080.116 1.373.850 26.016.498 27.390.348 43,6%
Incoming 416.651 7.626.918 8.043.569 383.443 11.869.583 12.253.026 52,3%
Outgoing 933.973 10.102.575 11.036.548 990.407 14.146.915 15.137.322 37,2%
Non-containerized cargo 4.812.775 5.169.026 9.981.802 5.119.640 5.293.399 10.413.039 4,3%
Incoming 1.695.146 2.301.070 3.996.216 1.770.141 2.406.004 4.176.145 4,5%
Outgoing 3.117.629 2.867.957 5.985.586 3.349.499 2.887.394 6.236.894 4,2%
Total general cargo 6.163.399 22.898.519 29.061.918 6.493.491 31.309.897 37.803.387 30,1%
Incoming 2.111.797 9.927.987 12.039.785 2.153.585 14.275.587 16.429.172 36,5%
Outgoing 4.051.602 12.970.531 17.022.133 4.339.906 17.034.309 21.374.216 25,6%
Total throughput 7.478.316 36.074.366 43.552.683 7.959.190 47.096.346 55.055.536 26,4%
Incoming 3.315.273 18.730.090 22.045.363 3.463.719 24.871.216 28.334.935 28,5%
Outgoing 4.163.043 17.344.277 21.507.320 4.495.471 22.225.130 26.720.601 24,2%
Container traffic (TEU) 226.607 1.817.020 2.043.626 223.105 2.510.169 2.733.274 33,7%
Incoming 119.230 907.845 1.027.075 109.007 1.265.125 1.374.132 33,8%
Outgoing 107.377 909.175 1.016.552 114.098 1.245.044 1.359.142 33,7%
Monthly accumulated 2016 Monthly accumulated 2017Type of packaging and
navigation (t)
Accumulated data November 2017
19,2%
5,0%
9,1%
43,8%
22,9%
Distribution by type of packaging 2016.
19,3%
4,6%
7,5%
49,8%
18,9%
Distribution by type of packaging 2017.
27,4%
16,0%
3,3%
43,6%
4,3%
0,0% 5,0% 10,0% 15,0% 20,0% 25,0% 30,0% 35,0% 40,0% 45,0% 50,0%
Annual growth by type of packaging.
Hydrocarbons Liquid bulk Dry bulk Containerized cargo Non containerized cargo
17

GOODS TRAFFIC
2016 2017 %
Total throughput 43.552.683 55.055.536 26,4% 100%
Energy 9.293.681 11.475.223 23,5% 20,8%
Crude oil 563 112 -80,1% 0,0%
Fuel oil 1.198.085 1.694.678 41,4% 3,1%
Diesel oils 2.512.908 2.139.707 -14,9% 3,9%
Petrol 2.305.168 2.989.881 29,7% 5,4%
Other petroleum products 226.055 368.078 62,8% 0,7%
Petroleum fuel gasses 42.870 36.617 -14,6% 0,1%
Coal 96.476 36.759 -61,9% 0,1%
Natural gas 2.251.274 3.611.652 60,4% 6,6%
Biofuel 660.281 597.739 -9,5% 1,1%
Iron, steel and metallurgical products 1.966.917 2.780.093 41,3% 5,0%
Iron ore 8.239 18.949 130,0% 0,0%
Other minerals and metallic waste 183.611 293.052 59,6% 0,5%
Scrap iron 244.340 584.877 139,4% 1,1%
Iron and steel products 1.319.152 1.535.723 16,4% 2,8%
Other metallurgical products 211.574 347.492 64,2% 0,6%
Non-metallic minerals 431.377 504.337 16,9% 0,9%
Common salt 134.679 145.054 7,7% 0,3%
Other non-metallic minerals 296.698 359.283 21,1% 0,7%
Fertilizers 634.311 730.179 15,1% 1,3%
Phosphates 1.183 1.267 7,1% 0,0%
Potashes 520.793 574.573 10,3% 1,0%
Natural/artificial fertilizers 112.335 154.339 37,4% 0,3%
Chemicals 4.415.729 5.346.013 21,1% 9,7%
Chemical products 4.415.729 5.346.013 21,1% 9,7%
Construction materials 2.399.323 2.682.605 11,8% 4,9%
Asphalt 11.706 13.415 14,6% 0,0%
Cement and clinker 1.381.678 1.303.141 -5,7% 2,4%
Other construction materials 1.005.939 1.366.050 35,8% 2,5%
Agriculture, livestock and food 7.508.551 10.551.183 40,5% 19,2%
Cereals and flours 615.650 833.494 35,4% 1,5%
Soya bean 1.087.371 1.365.817 25,6% 2,5%
Fruit, vegetables and pulses 398.108 1.198.419 201,0% 2,2%
Wines, beverages, spirits and derivatives 793.600 932.065 17,4% 1,7%
Canned goods 170.545 283.542 66,3% 0,5%
Tobacco, coffee and cocoa 518.222 692.247 33,6% 1,3%
Oils and fats 848.317 1.018.352 20,0% 1,8%
Other food products 1.590.477 2.599.748 63,5% 4,7%
Frozen fish 398.078 407.222 2,3% 0,7%
Feedstuffs and fodder 1.088.184 1.220.276 12,1% 2,2%
Other cargo 7.318.901 9.603.707 31,2% 17,4%
Timber 98.208 514.214 423,6% 0,9%
Paper and pulp 1.614.125 2.294.109 42,1% 4,2%
Machinery and spare parts 2.055.383 2.435.391 18,5% 4,4%
Other cargo by type 3.551.185 4.359.993 22,8% 7,9%
Vehicles and transport parts 9.583.891 11.382.197 18,8% 20,7%
Automobiles and parts 1.689.188 1.823.859 8,0% 3,3%
Tare of platforms and wagons (ro-ro) 3.729.283 3.950.570 5,9% 7,2%
Tare of containers 4.165.420 5.607.768 34,6% 10,2%
Goods by classification 4.3.7. (t)
Monthly accumulated % of total
accum.
2017
Accumulated data November 2017
18

Accumulated data November 2017
GOODS TRAFFIC
Goods ranking by classification (t)
Ranking of goods
0
500.000
1.000.000
1.500.000
2.000.000
2.500.000
3.000.000
3.500.000
4.000.000
Ranking of loaded goods. (t) 2017 2016
0
500.000
1.000.000
1.500.000
2.000.000
2.500.000
3.000.000
3.500.000
4.000.000
Ranking of unloaded goods. (t)
2017 2016
19

GOODS TRAFFIC
Containerized goods by classification 4.3.7 (Tares & transits not included)
2016 2017 % 2016 2017 % 2016 2017 %
Total tonnes (tares & transits not included) 7.399.500 7.775.387 5,1% 4.410.862 4.766.167 8,1% 11.810.361 12.541.555 6,2%
Chemical products 1.813.478 1.858.202 2,5% 1.109.696 1.216.102 9,6% 2.923.173 3.074.304 5,2%
Other cargo by type 633.964 667.002 5,2% 1.142.707 1.237.149 8,3% 1.776.671 1.904.151 7,2%
Paper and pulp 1.126.115 1.142.673 1,5% 121.201 142.057 17,2% 1.247.316 1.284.730 3,0%
Machinery and spare parts 477.572 499.873 4,7% 478.469 507.850 6,1% 956.041 1.007.722 5,4%
Feedstuffs and fodder 882.034 942.498 6,9% 29.010 24.908 -14,1% 911.044 967.406 6,2%
Other food products 722.895 809.571 12,0% 66.137 51.773 -21,7% 789.033 861.344 9,2%
Iron and steel products 206.198 211.652 2,6% 186.137 216.241 16,2% 392.335 427.894 9,1%
Other construction materials 225.498 252.798 12,1% 129.125 145.158 12,4% 354.623 397.957 12,2%
Tobacco, coffee and cocoa 75.419 80.323 6,5% 291.123 307.078 5,5% 366.542 387.400 5,7%
Wines, beverages, spirits and derivatives 325.908 336.600 3,3% 33.169 41.842 26,1% 359.078 378.442 5,4%
Automobiles and parts 119.364 129.374 8,4% 225.861 231.317 2,4% 345.224 360.691 4,5%
Fruit, vegetables, pulses 87.411 84.363 -3,5% 148.244 146.731 -1,0% 235.655 231.093 -1,9%
Other metallurgical products 53.387 76.550 43,4% 92.110 103.895 12,8% 145.497 180.445 24,0%
Oils and fats 142.338 139.587 -1,9% 37.781 40.120 6,2% 180.119 179.707 -0,2%
Other non-metallic minerals 83.926 82.207 -2,0% 96.083 86.410 -10,1% 180.009 168.617 -6,3%
Canned goods 55.892 65.866 17,8% 43.225 62.476 44,5% 99.117 128.342 29,5%
Other minerals and metallic waste 87.959 96.624 9,9% 21.436 28.693 33,9% 109.395 125.317 14,6%
Biofuel 91.347 93.410 2,3% 18.258 14.511 -20,5% 109.605 107.921 -1,5%
Cereals and flours 52.383 52.251 -0,3% 21.370 25.303 18,4% 73.754 77.554 5,2%
Natural/artificial fertilizer 40.361 39.079 -3,2% 10.892 11.760 8,0% 51.253 50.839 -0,8%
Frozen fish 2.151 3.925 82,4% 44.602 43.381 -2,7% 46.754 47.305 1,2%
Timber 21.876 28.323 29,5% 9.149 8.497 -7,1% 31.025 36.820 18,7%
Other petroleum products 18.083 19.347 7,0% 7.812 9.150 17,1% 25.895 28.496 10,0%
Scrap iron 5.500 6.462 17,5% 19.339 18.721 -3,2% 24.839 25.183 1,4%
Coal 2.133 2.763 29,5% 13.294 18.001 35,4% 15.427 20.763 34,6%
Soya bean 24 40 66,4% 7.641 19.230 151,7% 7.665 19.270 151,4%
Common salt 12.798 14.477 13,1% 2.523 3.355 33,0% 15.321 17.832 16,4%
Cement and clinker 12.451 15.668 25,8% 181 32 -82,5% 12.631 15.699 24,3%
Fuel oil 9.134 11.437 25,2% 2.670 942 -64,7% 11.804 12.379 4,9%
Asphalt 7.470 8.609 15,2% 50 40 -20,1% 7.520 8.648 15,0%
Potashes 756 1.172 54,9% 1.159 1.204 3,9% 1.915 2.376 24,1%
Iron ore 81 157 93,5% 187 1.280 584,0% 268 1.437 435,4%
Petroleum fuel gasses 2.000 1.368 -31,6% 32 64 102,1% 2.032 1.432 -29,5%
Phosphates 1.083 725 -33,0% 1 296 28135,1% 1.084 1.021 -5,8%
Diesel oils 53 165 211,0% 35 435 1155,4% 88 600 583,4%
Petrol 422 221 -47,6% 90 101 12,4% 512 322 -37,0%
Crude oil 31 27 -10,6% 64 46 -27,8% 94 73 -22,2%
Natural gas 1 0 -100,0% 0 19 1 19 3491,5%
Accumulated data November 2017
Containerized goods classification Total monthly accumulatedLoaded Unloaded
Chemical products
24%
Paper and pulp 15%
Feedstuffs and fodder
12%
Other food products
10%
Other cargo by type
9%
Remainder 30%
Distribution of main goods. Loaded 2017
Other cargo by type 26%
Chemical products
25%
Machinery and spare
parts 11%
Tobacco, coffee and
cocoa 6%
Automobiles and parts
5%
Remainder 27%
Distribution of main goods. Unloaded 2017
20

MARITIME TRAFFIC BY ORIGIN/DESTINATION.
Geographical areas. Tonnes
2016 2017 %
Tonnes (t) 43.552.683 55.055.536 26,4% 100%
Spain 8.061.098 8.471.443 5,1% 15,4%
Italy/France (Mediterranean) 6.813.934 7.095.465 4,1% 12,9%
Far East and Japan 5.250.875 5.983.155 13,9% 10,9%
North Africa 4.779.006 5.845.954 22,3% 10,6%
Persian Gulf/Arabian Sea 2.408.402 3.702.072 53,7% 6,7%
Eastern Mediterranean/Black Sea/Caspian Sea/Middle East 2.788.342 3.604.510 29,3% 6,5%
South America (Atlantic) 1.783.119 2.990.127 67,7% 5,4%
West Africa 1.940.061 2.883.220 48,6% 5,2%
Europe (Atlantic) 2.385.450 2.778.367 16,5% 5,0%
Pakistan/India/Sri Lanka/Bangladesh 1.131.671 2.147.129 89,7% 3,9%
Southeast Asia 1.360.190 1.709.696 25,7% 3,1%
Gulf of Mexico (Mexico and USA) 1.464.893 1.696.633 15,8% 3,1%
Red Sea 531.158 1.125.050 111,8% 2,0%
Central America and Caribbean 874.958 1.098.983 25,6% 2,0%
Canada (Atlantic) and Great Lakes 205.623 1.047.555 409,5% 1,9%
South America (Pacific) 443.289 806.402 81,9% 1,5%
North America (Atlantic) 690.538 788.175 14,1% 1,4%
North America (Pacific) 89.857 447.342 397,8% 0,8%
South-Eastern Africa/Indian Ocean 324.599 382.642 17,9% 0,7%
Unknown area (Tare of empty containers) 79.510 265.773 234,3% 0,5%
Australia, New Zealand/Pacific Islands 146.110 185.843 27,2% 0,3%
Geographical areas
Monthly accumulated % of total
accum.
2017
Accumulated data November 2017
Spain
North Africa
Italy/France (Mediterranean)
Far East and Japan
Eastern Mediterranean/Black Sea/CaspianSea/Middle East
West Africa
Persian Gulf/Arabian Sea
Europe (Atlantic)
Pakistan/India/Sri Lanka/Bangladesh
South America (Atlantic)
Main areas of destination. (t)
2016 2017
Italy/France (Mediterranean)
Far East and Japan
Spain
South America (Atlantic)
Persian Gulf/Arabian Sea
North Africa
Eastern Mediterranean/Black Sea/CaspianSea/Middle East
Europe (Atlantic)
Pakistan/India/Sri Lanka/Bangladesh
Gulf of Mexico (Mexico and USA)
Main areas of origin. (t)
2016 2017
21
MARITIME TRAFFIC BY ORIGIN/DESTINATION.
Geographical areas. Full TEU non transit
2016 2017 %
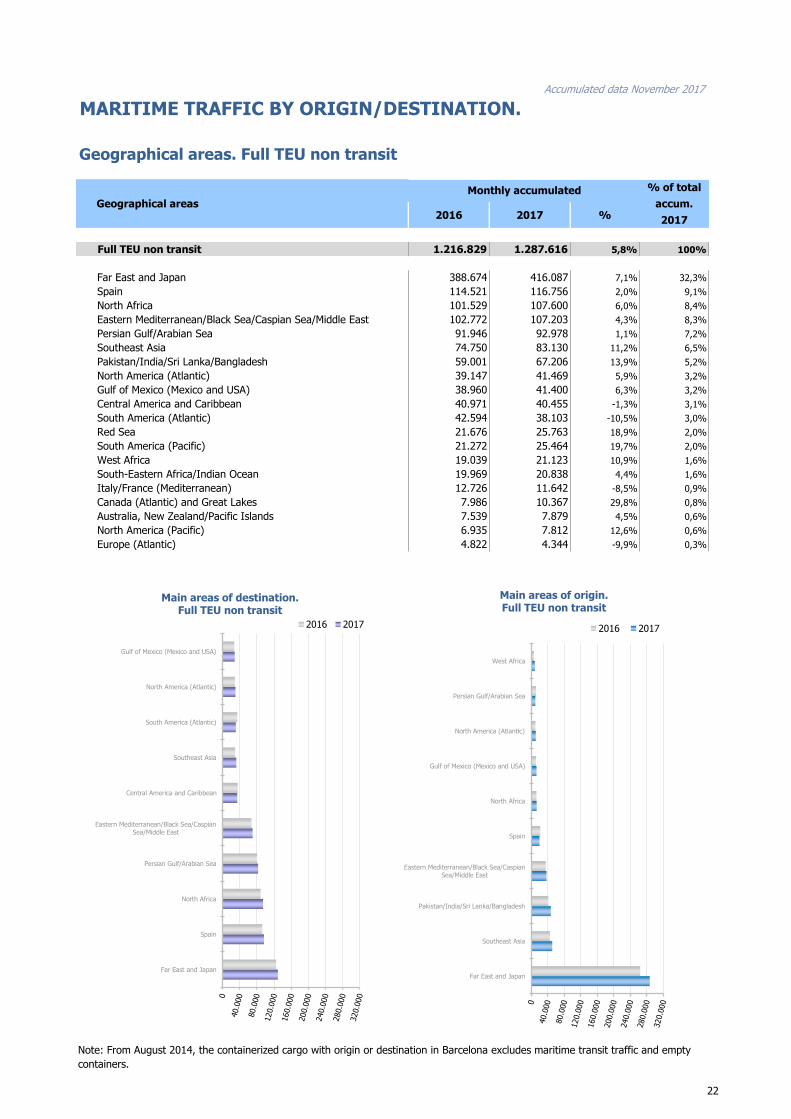
Full TEU non transit 1.216.829 1.287.616 5,8% 100%
Far East and Japan 388.674 416.087 7,1% 32,3%
Spain 114.521 116.756 2,0% 9,1%
North Africa 101.529 107.600 6,0% 8,4%
Eastern Mediterranean/Black Sea/Caspian Sea/Middle East 102.772 107.203 4,3% 8,3%
Persian Gulf/Arabian Sea 91.946 92.978 1,1% 7,2%
Southeast Asia 74.750 83.130 11,2% 6,5%
Pakistan/India/Sri Lanka/Bangladesh 59.001 67.206 13,9% 5,2%
North America (Atlantic) 39.147 41.469 5,9% 3,2%
Gulf of Mexico (Mexico and USA) 38.960 41.400 6,3% 3,2%
Central America and Caribbean 40.971 40.455 -1,3% 3,1%
South America (Atlantic) 42.594 38.103 -10,5% 3,0%
Red Sea 21.676 25.763 18,9% 2,0%
South America (Pacific) 21.272 25.464 19,7% 2,0%
West Africa 19.039 21.123 10,9% 1,6%
South-Eastern Africa/Indian Ocean 19.969 20.838 4,4% 1,6%
Italy/France (Mediterranean) 12.726 11.642 -8,5% 0,9%
Canada (Atlantic) and Great Lakes 7.986 10.367 29,8% 0,8%
Australia, New Zealand/Pacific Islands 7.539 7.879 4,5% 0,6%
North America (Pacific) 6.935 7.812 12,6% 0,6%
Europe (Atlantic) 4.822 4.344 -9,9% 0,3%
Geographical areas
Monthly accumulated % of total
accum.
2017
Accumulated data November 2017
Note: From August 2014, the containerized cargo with origin or destination in Barcelona excludes maritime transit traffic and empty
containers.
Far East and Japan
Spain
North Africa
Persian Gulf/Arabian Sea
Eastern Mediterranean/Black Sea/CaspianSea/Middle East
Central America and Caribbean
Southeast Asia
South America (Atlantic)
North America (Atlantic)
Gulf of Mexico (Mexico and USA)
Main areas of destination. Full TEU non transit
2016 2017
Far East and Japan
Southeast Asia
Pakistan/India/Sri Lanka/Bangladesh
Eastern Mediterranean/Black Sea/CaspianSea/Middle East
Spain
North Africa
Gulf of Mexico (Mexico and USA)
North America (Atlantic)
Persian Gulf/Arabian Sea
West Africa
Main areas of origin. Full TEU non transit
2016 2017
22

MARITIME TRAFFIC BY ORIGIN/DESTINATION.
Ranking countries. Full TEU non transit
Spain 96.582 4,4% 12,9%
China 75.544 1,3% 10,1%
United Arab Emirates 63.971 10,6% 8,6%
Algeria 47.201 14,7% 6,3%
United States 40.919 5,1% 5,5%
Turkey 32.451 8,5% 4,3%
Morocco 27.895 1,3% 3,7%
Mexico 24.281 3,8% 3,3%
Brazil 18.706 -20,0% 2,5%
Saudi Arabia 17.532 -26,6% 2,3%
Japan 17.078 15,1% 2,3%
South Korea 16.794 26,4% 2,3%
India 14.026 13,0% 1,9%
Republic of South Africa 12.612 -1,2% 1,7%
Chile 11.321 12,5% 1,5%
Remainder 421.833
Remainder 229.140 4,3% 30,7%
TOTAL 746.050 4,2% 100%
China 231.056 9,8% 42,7%
South Korea 32.281 9,2% 6,0%
Turkey 26.361 5,6% 4,9%
India 24.862 17,0% 4,6%
Spain 20.178 -8,3% 3,7%
Vietnam 18.112 5,2% 3,3%
United States 17.698 7,6% 3,3%
Bangladesh 16.254 15,2% 3,0%
Thailand 11.934 2,0% 2,2%
Saudi Arabia 11.426 13,9% 2,1%
Mexico 9.492 18,6% 1,8%
Japan 8.329 0,4% 1,5%
Indonesia 8.200 19,3% 1,5%
Egypt 8.127 -1,3% 1,5%
Taiwan 7.933 3,4% 1,5%
Remainder 206.829
Remainder 89.327 6,6% 16,5%
TOTAL 541.567 8,2% 100%
China 306.600 7,5% 23,8%
Spain 116.760 2,0% 9,1%
United Arab Emirates 66.704 9,0% 5,2%
Turkey 58.812 7,2% 4,6%
United States 58.617 5,8% 4,6%
South Korea 49.075 14,6% 3,8%
Algeria 48.248 14,7% 3,7%
India 38.888 15,6% 3,0%
Mexico 33.772 7,6% 2,6%
Morocco 30.795 2,4% 2,4%
Saudi Arabia 28.958 -14,6% 2,2%
Japan 25.407 9,9% 2,0%
Brazil 23.426 -17,8% 1,8%
Vietnam 22.457 7,2% 1,7%
Thailand 18.696 4,6% 1,5%
Remainder 680.125
Remainder 360.405 5,6% 28,0%
TOTAL 1.287.616 5,8% 100%
TotalFull
TEU
%
17-16
% a/pac-
kaging
Accumulated data November 2017
%
17-16
% a/pac-
kagingUnloaded
Full
TEU
LoadedFull
TEU
%
17-16
% a/pac-
kaging
Spain 13%
China 10%
United Arab Emirates
9%
Algeria 6%
United States 5%
Remainder
57%
Main countries. Loaded
China
43%
South Korea 6%
Turkey 5%
India 4%
Spain 4%
Remainder
38%
Main countries. Unloaded
China 24%
Spain 9%
United Arab Emirates
5%
Turkey 5%
United States
4% Remainder
53%
Main countries. Total
23

RAILWAY TRAFFIC
Monthly evolution of railway traffic. TEU
Loaded Unloaded Total Loaded Unloaded Total MonthlyAccumu-
lated
January 7.540 6.670 14.210 10.107 8.940 19.047 34,0% 34,0% 13,5%
February 9.137 8.357 17.494 8.377 8.550 16.927 -3,2% 13,5% 10,9%
March 9.133 8.720 17.853 10.122 11.159 21.281 19,2% 15,5% 14,0%
April 9.610 9.181 18.791 8.446 8.181 16.627 -11,5% 8,1% 11,1%
May 9.527 8.619 18.146 10.249 9.849 20.098 10,8% 8,7% 12,4%
June 9.392 8.960 18.352 10.001 9.516 19.517 6,3% 8,3% 13,5%
July 9.276 10.316 19.592 11.869 10.703 22.572 15,2% 9,3% 13,1%
August 10.634 10.102 20.736 13.126 11.562 24.688 19,1% 10,7% 14,7%
September 11.182 11.325 22.507 9.516 9.696 19.212 -14,6% 7,3% 11,2%
October 9.260 10.315 19.575 11.634 11.072 22.706 16,0% 8,2% 14,2%
November 9.209 9.814 19.023 10.011 10.561 20.572 8,1% 8,2% 13,0%
December 9.312 10.405 19.717
Total 113.212 112.784 225.996 113.458 109.789 223.247 12,9%
Monthly evolution of railway traffic. Automobile
Loaded Unloaded Total Loaded Unloaded Total MonthlyAccumu-
lated
January 945 15.978 16.923 1.388 13.443 14.831 -12,4% -12,4% 31,0%
February 1.708 24.496 26.204 1.710 19.340 21.050 -19,7% -16,8% 39,0%
March 1.768 26.042 27.810 2.034 24.997 27.031 -2,8% -11,3% 32,9%
April 2.019 28.386 30.405 1.116 17.041 18.157 -40,3% -20,0% 27,9%
May 1.431 26.750 28.181 2.250 24.147 26.397 -6,3% -17,0% 33,3%
June 1.074 24.507 25.581 2.023 19.907 21.930 -14,3% -16,6% 34,0%
July 2.039 21.825 23.864 2.815 18.132 20.947 -12,2% -16,0% 30,6%
August 0 6.615 6.615 524 2.088 2.612 -60,5% -17,6% 7,2%
September 2.604 22.899 25.503 2.643 14.701 17.344 -32,0% -19,3% 31,8%
October 1.418 22.686 24.104 2.397 20.415 22.812 -5,4% -17,9% 35,3%
November 1.571 22.952 24.523 2.252 24.066 26.318 7,3% -15,5% 35,6%
December 376 11.580 11.956
Total 16.953 254.716 271.669 21.152 198.277 219.429 31,8%
Monthly evolution of
railway traffic
Automobile 2016 Automobile 2017 % % of total
port traffic
2017
Accumulated data November 2017
Monthly evolution of
railway traffic
TEU 2016 TEU 2017 % % of total
port traffic
2017
-12,4%
-19,7% -2,8% -40,3% -6,3%
-14,3% -12,2%
-60,5%
-32,0%
-5,4% 7,3%
0
10.000
20.000
30.000
40.000
January
Febru
ary
Marc
h
April
May
June
July
August
Septe
mber
Oct
ober
Novem
ber
Dece
mber
Monthly evolution of railway traffic. Automobile
2016 2017
20% 18% 19%
30% 29% 27%
30%
32% 31% 31%
35% 34% 32%
4% 3% 3%
3%
5%
8%
11%
11% 11%
12% 13% 13% 13%
0,0%
2,0%
4,0%
6,0%
8,0%
10,0%
12,0%
14,0%
0,0%
5,0%
10,0%
15,0%
20,0%
25,0%
30,0%
35,0%
40,0%
Automobile TEU
Share evolution of railway traffic.
34,0% -3,2%
19,2%
-11,5% 10,8%
6,3% 15,2%
19,1% -14,6%
16,0%
8,1%
0
10.000
20.000
30.000
40.000
January
Febru
ary
Marc
h
April
May
June
July
August
Septe
mber
Oct
ober
Novem
ber
Dece
mber
Monthly evolution of railway traffic. TEU
24

RAILWAY TRAFFIC
Monthly evolution of railway traffic. Dry and liquid bulk
Dry bulk Liquid bulk Total Dry bulk Liquid bulk Total Monthly Accumulated
Dry bulk 2016 Liquid bulk 2016 Dry bulk 2017 Liquid bulk 2017
January 35.415 12.324 47.739 31.980 10.193 42.173 -11,7% -11,7%
February 33.021 8.300 41.321 31.825 7.137 38.962 -5,7% -8,9%
March 36.762 4.688 41.450 30.094 7.767 37.861 -8,7% -8,8%
April 36.879 7.604 44.483 24.019 11.600 35.619 -19,9% -11,6%
May 38.841 4.951 43.792 44.427 9.405 53.832 22,9% -4,7%
June 37.449 5.245 42.694 44.221 6.924 51.145 19,8% -0,7%
July 26.574 7.039 33.613 31.984 7.995 39.979 18,9% 1,5%
August 29.677 6.345 36.022 66.005 9.186 75.191 108,7% 13,2%
September 32.986 6.248 39.234 50.968 9.528 60.496 54,2% 17,5%
October 36.127 5.359 41.486 44.483 10.865 55.348 33,4% 19,1%
November 36.845 4.842 41.687 54.537 7.797 62.334 49,5% 21,9%
December 36.297 4.974 41.271 -100,0% 11,8%
Total 416.873 77.919 494.792 454.543 98.397 552.940
Railway traffic.
2016 2017
Iberian gauge 6.045 6.045 0,0% 74,5%
UIC 231 280 21,2% 3,5%
FGC 2.083 1.789 -14,1% 22,0%
Total 8.359 8.114 -2,9% 100%
Railway gauge traffic (u) %
% of
accumulated
total
2017
Accumulated data November 2017
Monthly evolution of
railway traffic
Tonnes 2016 Tonnes 2017 %
0
10.000
20.000
30.000
40.000
50.000
60.000
70.000
January
Febru
ary
Marc
h
April
May
June
July
August
Septe
mber
Oct
ober
Novem
ber
Dece
mber
Tonnes Monthly evolution of railway traffic. Dry and liquid bulk.
Dry bulk 2016 Liquid bulk 2016 Dry bulk 2017 Liquid bulk 2017
Liquid bulk
Dry bulk
6.045 6.045
231 280
2.083 1.789
0
1.000
2.000
3.000
4.000
5.000
6.000
7.000
8.000
9.000
2016 2017
Railway gauge traffic distribution (u).
FGC
UIC
Iberian
gauge
25