accuracy of commercial fitness trackers during high
TRANSCRIPT
Western Kentucky University Western Kentucky University
TopSCHOLAR® TopSCHOLAR®
Masters Theses & Specialist Projects Graduate School
Summer 2016
Accuracy of Commercial Fitness Trackers During High-Intensity Accuracy of Commercial Fitness Trackers During High-Intensity
Functional Training Functional Training
Paige Wessel Western Kentucky University, [email protected]
Follow this and additional works at: https://digitalcommons.wku.edu/theses
Part of the Exercise Science Commons, and the Sports Sciences Commons
Recommended Citation Recommended Citation Wessel, Paige, "Accuracy of Commercial Fitness Trackers During High-Intensity Functional Training" (2016). Masters Theses & Specialist Projects. Paper 1634. https://digitalcommons.wku.edu/theses/1634
This Thesis is brought to you for free and open access by TopSCHOLAR®. It has been accepted for inclusion in Masters Theses & Specialist Projects by an authorized administrator of TopSCHOLAR®. For more information, please contact [email protected].

i
ACCURACY OF COMMERCIAL FITNESS TRACKERS DURING HIGH-
INTENSITY FUNCTIONAL TRAINING
A Thesis
Presented to
The Faculty of the School of Kinesiology, Recreation, and Sport
Western Kentucky University
Bowling Green, Kentucky
In Partial Fulfillment
Of the Requirements for the Degree
Master of Science
By
Paige Wessel
August 2016

iii
There are so many people who I would like to thank for making this thesis experience
possible. I would like to thank my thesis committee members for their help during this
project. Dr. Jill Maples, thank you for taking on this project as my thesis chair. It has
been such pleasure working with you and to have had you for a mentor and professor.
Dr. Mark Schafer, it has been an honor to work with you on this project, tackle
conferences, and to have had you as a professor for many classes over the past five years.
Dr. Cody Morris and Dr. Rachel Tinius, thank you for stepping on board with this project
and helping in every way that you could with statistics, edits, suggestions, and support.
Without the help of my thesis committee, this project would not have been possible. I
would also like to thank those individuals who worked in the lab with me (graduates and
undergraduates) who have helped with this project along the way collecting data, entering
data into files, and spending countless hours in the lab – especially BethAnne Clayton,
Brooke Grimes, Alyssa Olenick, and Battogtokh Zagdsuren. I would like to thank the
participants of the study, for without volunteers, this study would have been impossible
to complete. To my parents, thank you for your endless love and support, and for always
supporting my education and for motivating me throughout this entire process. Partial
support for this project from an Institutional Development Award (IDeA) from National
Institute of General Medical Sciences, National Institutes of Health Grant
5P20GM103436; WKU Graduate School Research Grant, NIGMS 2P20 GM103436-14,
and the WKU RCAP Grant 14-8007.
iv
CONTENTS
Chapter 1. Introduction…………………………………………………………...……….1
Chapter 2. Literature Review………………………………………………..…………….6
Chapter 3. Materials and Methods……………………………………………..………...12
Chapter 4. Manuscript………………………………………………………..…….……18
Chapter 5. Summary of Findings……………………………………….….…………....37
References …………………….……………………….……………………….………41

v
LIST OF FIGURES
Figure 1. Mean absolute percentage error (±SD) for all monitors with measured REE...34
Figure 2. Bland-Altman Plots using estimated resting energy expenditure (REE)…...…35

vi
LIST OF TABLES
Table 1. Exercise Protocol for Main Test Day………………………………….…….....28
Table 2. Physical Characteristics of Participants……………………...…………………30
Table 3. Total Estimated Energy Expenditure (kcals)...…………………………………31
Table 4. Pearson Correlations……………………………………………………………32
vii
ACCURACY OF COMMERCIAL FITNESS TRCKERS DURING HIGH-
INTENSTIY FUNCTIONAL TRAINING
Paige Wessel August 2016 43 Pages
Directed by: Jill Maples, Mark Schafer, Cody Morris, and Rachel Tinius
School of Kinesiology, Recreation, and Sport Western Kentucky University
Commercially available fitness trackers have been found to accurately measure
steps and caloric expenditure during walking and running activities. Circuit-style, high-
intensity functional training (HIFT) has become increasingly popular because it is
inexpensive and effective in improving muscular strength and cardiovascular fitness.
PURPOSE: To evaluate the accuracy of five accelerometers (ActiGraph GT3X, Nike
Fuelband, Fitbit One, Fitbit Charge HR, and Jawbone UP Move) in estimating energy
expenditure while performing an acute bout of HIFT. METHODS: Participants (n = 47)
underwent baseline testing and at least 48 hours later, each participant completed the
main test: a 15-minute workout consisting of 12 repetitions each of 7 different exercises;
performed circuit-style by completing as many rounds as possible. During the main test,
each participant wore the Cosmed K4b2 portable metabolic analyzer (PMA) and five
different accelerometers. RESULTS: Four of the five fitness trackers reported lower (p
<0.01) total caloric expenditure values compared to the PMA during the acute bout of
HIFT. The waist-mounted device (ActiGraph, 182.55 ± 37.93 kcals) most closely
mimicked caloric expenditure compared to the PMA (Cosmed, 144.99 ± 37.13 kcals) as
indicated by an insignificant p value (0.056). Systematic differences between the activity
monitors were calculated using an Intraclass Correlation (ICC) with an ICC = -0.032.
The ICC of F (46,235) = 0.812 (p = 0.799) was not significant at the predetermined 0.05
viii
alpha level. A Repeated Measures ANOVA showed that when compared to the Cosmed,
all activity monitors were significantly different at the 0.05 alpha level. The Fitbit One
and the Fitbit Charge HR were the only two activity monitors that are not significantly
different from one another (p = 0.985). The range of error based on mean absolute
percentage errors (MAPE) was lowest for the ActiGraph (15.1%) and highest for the
Fitbit Charge HR (22.1%). CONCLUSION: The wrist- and hip-mounted fitness trackers
do not accurately assess energy expenditure during HIFT exercise.
Supported by: WKU Graduate School, NIGMS 2P20 GM103436-14; Institutional
Development Award (IDeA) from National Institute of General Medical Sciences,
National Institutes of Health, 5P20GM103436 and the WKU RCAP Grant 14-8007.
1
Chapter 1 - Introduction
Commercial fitness trackers, also sometimes referred to as accelerometers, are
small devices that are typically worn on the wrist or on the waist and are capable of
measuring the daily caloric expenditure, steps taken, energy expenditure, possible sleep
patterns, and heart rate (Kooiman et al., 2015; Tucker, Bhammar, Sawyer, Buman, &
Gaesser, 2015). These monitors are developed so that consumers can track daily physical
activity levels, as well as recognize the amount sedentary time they accumulate for a
given time period. Over the last decade, commercial fitness devices (objective method of
monitoring physical activity) have been readily available for purchase, and are becoming
increasingly popular ways to assess energy expenditure among free-living conditions
(Kooiman et al., 2015; Nilsson, Ekelund, Yngve, & Sjostrom, 2002; Cartrine Tudor-
Locke, 2002). The fitness tracker industry is making quite a bit of money with these
different trackers available on the market. This industry is set to triple its sales from $2
billion in 2014 to almost $5.4 billion in 2018 (Lamkin, 2015). Therefore, it is important
to determine the accuracy of these fitness trackers in order for consumers and fitness
professionals to be knowledgeable about the true capacities of the activity monitors they
are purchasing and/or recommending.
Fitness trackers estimate energy expenditure using regression equations that are
generated by researchers (Crouter, Horton, & Bassett, 2012). These regression equations
have been developed to estimate the amount of energy expended over a given time frame
and are based counts per minute (movement) in order to estimate physical activity
intensity (Crouter, Clowers, & Bassett, 2006). For example, lifestyle regression
equations more accurately estimate physical activity energy expenditure (PAEE) for

2
moderate intensity exercises, however they tend to overestimate the energy expenditure
of sedentary and light activities, while underestimating the energy expenditure of
vigorous activities (Bassett et al., 2000). Additionally, consistent movement patterns
during activities such as walking and running lead to a more accurate estimate of PAEE
than irregular movement patterns such as those involving free-living movements (uphill
walking, lifting objects, squatting down, standing up from a seated position, etc.)
(Crouter, Churilla, & Bassett, 2006).
Typically, self-reported questionnaires, logs, interviews, and journals have been
used to assess physical activity (Lyden, Kozey, Staudenmeyer, & Freedson, 2011; Sallis
& Saelens, 2000; Cartrine Tudor-Locke, 2002). However, this is problematic as
individuals have a tendency to over report favorable outcomes and under report
unfavorable outcomes (Caeser, 2012). People tend to overestimate their physical activity
levels when self-report measurements are used (Sallis & Saelens, 2000). Therefore, the
amount of energy expended from each individual is most likely being overestimated as
well. In addition to issues with overestimation using self-reported measures, these tools
are time–consuming and burdensome for the individuals as they have to keep track the
amount of exercise they partake in on a daily basis (walking, gardening, running,
calisthenics, etc.); and these logs do not take into account the intensity of the physical
activity (Caeser, 2012; Cartrine Tudor-Locke, 2002).
According to the World Wide Survey of Fitness Trends for 2015, body weight
training (BWRT) and high-intensity interval training (HIIT) have become increasingly
popular modes of exercise (Thompson, 2014). This includes exercises such as push-ups,
air squats, sit-ups, and lunges. BWRT and HIIT have become very popular because they

3
are inexpensive, require minimal equipment, and are effective (Thompson, 2014). One
particular type of HIIT, high-intensity functional training (HIFT), is a high-intensity
circuit-style training method in which only an individual’s body weight is utilized
(Heinrich, Patel, O’Neal, & Heinrich, 2014). This mode of exercise can be done
anywhere; while also removing common exercise barriers such as weather, access to
exercise facilities, and safety of surroundings. There are few studies that investigate
HIFT and its benefits, however one study reported that a high-intensity, circuit-style
training modality elicited cardiovascular responses similar to sprint intervals in college-
aged men and women (Gist, Freese, & Cureton, 2014). HIFT is a relatively new
modality that warrants further investigation into its risks and benefits. Because HIFT is
becoming an increasingly useful mode of exercise, and the use of commercial fitness
trackers have become extremely popular, understanding the accuracy of commercial
fitness trackers during this mode of exercise is important. People may experience
significant physiological benefits from HIFT training, but if their fitness trackers do not
pick up on the caloric expenditure and/or step counts, they may discontinue the exercise
and perceive it as not helping them achieve their fitness goals. To our knowledge no
previous study has investigated the accuracy of popular, commercial activity trackers in
assessing total energy expenditure (TEE) during a HIFT session.
Statement of the Problem
Commercially available fitness trackers are advertised as having the capacity to
assess a variety of physiological measures, including TEE. High-intensity interval
training exercise, such as HIFT circuits, are a popular mode of exercise training. HIFT
exercises include functional movements performed daily (e.g. stair climbing, squatting,
4
and lunging). Given the popularity of commercially available fitness trackers and the
popularity of HIFT, there is a need to evaluate the effectiveness of these devices in
regards to calculating TEE during HIFT.
Statement of the Purpose
The purpose of this study is to determine the accuracy/validity of four
commercially available fitness trackers (Nike Fuelband, Fitbit One, Fitbit Charge HR,
and Jawbone UP Move) in assessing TEE during an acute bout of HIFT.
It is hypothesized that these commercial fitness trackers will underestimate the
total amount of energy that is being expended based upon the types of exercises being
performed (e.g. body weight squats and sit-ups). This hypothesis will be assessed by the
research question:
Do commercially available fitness trackers accurately assess total energy expenditure
(TEE) during a high-intensity, circuit-style, functional training (HIFT) bout of exercise?
Significance of the Study
This study will advance knowledge in the field of Exercise Science and
Kinesiology by helping technicians, clinicians, consumers, and other health care
providers better understand the accuracy and functionality of the fitness equipment they
are purchasing and/or recommending to their clients/patients. This study will compare
the latest commercially available fitness trackers (Nike Fuelband, Fitbit One, Fitbit
Charge HR, and Jawbone UP Move) to two criterion measures: 1) The ActiGraph GXT3
(a well-validated accelerometer used extensively for assessing PAEE for research
purposes) and 2) The Cosmed K4b2 (portable metabolic analyzer which uses indirect
calorimetry to accurately assess TEE). With this information, we will be able to
5
determine whether or not the commercial fitness trackers are accurate in calculating TEE
during HIFT, which is one of the most popular modes of exercise today. This study is
unique in that the exercises being performed do not involve running/walking, therefore
we will be able to determine if they can correctly calculate energy expenditure based
upon exercises that are completed (e.g. sit-ups and body weight squats). This study will
benefit those who are interested in using a fitness tracker to help self-monitor their daily
physical activity levels.
List of Terms
High-Intensity Functional Training (HIFT) – high-intensity, circuit-style training in
which only an individuals’ body weight is utilized; mimics movements used in daily
living activities (Heinrich et al., 2014).
Fitness Tracker – device used to track fitness metrics such as calories burned, steps taken,
and distance traveled
Accelerometers – an instrument for measuring acceleration
Triaxial Accelerometer – An accelerometer that is capable of sensing motion in three
planes (anterior-posterior, vertical, and medial-lateral)
Portable metabolic analyzer (Cosmed K4b2) – portable system for pulmonary gas
exchange measurement with true breath-by-breath analysis
Maximal Aerobic Capacity – maximum rate at which a human subject can take up
oxygen from the air; also known as VO2 max. It is the highest amount of oxygen a person
can consume during maximal exercise of several minutes’ duration (Medical Dictionary
for the Health Professions and Nursing, 2012; Dictionary of Sport and Exercise Science
and Medicine by Churchill Livingston, 2008).
6
Chapter 2 - Literature Review
This chapter will discuss physical inactivity, physical activity, define total energy
expenditure (TEE), and provide an overview of physical activity fitness trackers.
Physical Inactivity
The obesity epidemic poses a significant threat to the overall health of the nation,
and its prevalence has increased over the years from 12% in 1991 to 18% in 1998
(Mokdad et al., 1999). Currently, 16% of children are considered overweight, and 34%
are at risk of becoming overweight (Wang & Beydoun, 2007). Obesity has many
consequences for the individuals being affected such as psychological, health, and social
implications. Projections show that if the obesity trend continues along its current path,
80% of all American adults will be considered overweight or obese (Wang, Beydoun,
Liang, Caballero, & Kumanyika, 2008). One major factor that has contributed to these
metabolic diseases such as obesity is the lack of physical activity (Cartrine Tudor-Locke,
2002). There are many factors that play a role in reducing the time or ability to be active
and many factors that have created a more sedentary environment at home and work.
One investigation reported that on average, overweight and obese individuals take fewer
steps throughout the day than those individuals who are lean (C. Tudor-Locke, Brashear,
Johnson, & Katzmarzyk, 2010). As the industrial revolution approached the nation over
time and technology advanced, there have been more occupations created where sitting
on a computer is considered normal versus getting up and being physical at work such as
working assembly lines, farming, and hard physical labor. There are several Americans
who dedicate their lives to their work, which ultimately leads them to work from 9:00am

7
to 5:00pm with very little room to exercise or be active. This issue goes hand in hand
with college students. Those individuals who work in a white collar job setting may be
unaware of the lack of physical activity being performed daily due to their job
environment. Many students who attend universities have a great deal of responsibility
with classes, course work, occupations, etc., that they are unable to find time to workout
during the day or simply be recreationally physically active.
Physical Activity
Physical activity is movement involving the musculature of the body resulting in
energy expenditure above the resting baseline values (Caspersen, Powell, & Christenson,
1985). Physical activity is a multi-dimensional behavior that is characterized by mode,
intensity, frequency, and duration. These variables put together categorize physical
activity energy expenditure (PAEE). Physical activity, whether it be walking, running,
anaerobic, or aerobic exercising, has been known to help reverse the effects of major
diseases such as obesity, diabetes, cardiovascular disease, hypertension, etc. (Kumahara
et al., 2004). It is well known that physical activity affords many health-related benefits,
however physical activity/exercise can tend to be overlooked by the lack of motivation,
time, capability, or gym space.
The use of fitness trackers and pedometers, devices used to track steps taken, are
highly associated with increases in the amount of physical activity that is performed by
an individual. Setting a step goal ranging from 2,000-10,000 steps, depending on the
individual, seems to be a motivational factor for increasing the amount of daily physical
activity (Bravata et al., 2007). These devices are becoming a popular motivational tool
and not just solely being used to estimate energy expenditure. For those individuals who

8
just want to walk more, these devices are a great way to track steps and distance traveled.
On the other hand, for those avid gym goers, these activity monitors may help them gage
their amount of physical activity for any given day. Fitness trackers help gage the
amount of physical activity that is being performed, whether it be walking through the
office at work, or performing a high intensity training workout (i.e. if an individual has
set a 10,000 step goal and has only achieved 4,000 of those steps, they are well aware that
they are below their goal thus far and need to start being more active for that day).
Total Energy Expenditure (TEE)
Total energy expenditure (TEE) takes into consideration resting energy
expenditure (REE) as well as physical activity energy expenditure (PAEE). In simpler
terms, TEE = PAEE + REE. For those fitness trackers that only take into consideration
PAEE, it is necessary to add measured or estimated REE to have comparable results to
those fitness trackers that already estimate TEE (Lee, Kim, & Welk, 2014). REE can be
measured by using a portable metabolic device or a metabolic cart. If unable to actually
measure an individuals’ REE, it can be estimated by using equations such as that derived
by Mifflin et al. 1990:
For females, REE = 9.99 x weight (kg) + 6.25 x height (cm) – 4.92 x age (years) -161
For males, REE = 9.99 x weight (kg) + 6.25 x height (cm) – 4.92 x age (years) + 5.
For example, the Fitbit activity monitors measure TEE and accounts for both PAEE as
well as the energy expended at rest (Caeser, 2012).
Physical Activity Fitness Trackers
Physical activity fitness trackers are devices used to measure the
duration/intensity of a workout, as well as estimate the amount of energy expended, steps

9
taken, floors climbed, etc. These devices have become popular among consumers due to
their smaller size and their ability to measure different variables. Fitness trackers use
algorithms (energy expenditure equations) to estimate energy expenditure; however,
when in free-living conditions and while performing non-weight bearing activities, these
physical activity monitors tend to underestimate energy expenditure (Dannecker,
Sazonova, Melanson, Sazonov, & Browning, 2013). Current physical activity monitors
contain small sensors to measure acceleration, gravity, etc. (Caeser, 2012). Micro-
electro-mechanical accelerometers (MEMs) are embedded into some physical activity
monitors. MEMs allow these fitness trackers to detect human motion in various planes
(triaxial and biaxial) without compromising the ability of the monitor to measure
acceleration (Caeser, 2012).
Movement
Fitness trackers and pedometers can measure steps and energy expenditure easily
based upon movement from one spot to another. For agility drills such as shuffling,
pivoting, and anything involving quick steps and fast arm movements, the fitness trackers
appear to underestimate the energy expenditure (Stackpool, Porcari, Mikat, Gillette, &
Foster, 2014). This is likely due to various, complex movements that are being
performed while completing the agility exercises. Small, quick, abnormal steps may not
be registering with the fitness trackers and therefore underestimating the energy
expenditure. There is typically less major arm movement involved in exercises involving
quick steps, which then effects the accuracy of the fitness trackers worn on the wrist and
arm (Stackpool et al., 2014). When subjects completed a two session study involving a
50-minute workout session that included a 40-minute treadmill walk with a 10-minute

10
rest period in between for the first session; as well as a 20-minute elliptical workout with
agility drills after for the second session, all while wearing commercial fitness devices, it
was shown that the energy expenditure reported from the activity monitors were lower
than those reported from the portable metabolic analyzer. During the treadmill running,
the Fitbit Ultra, Nike Fuelband, and Jawbone UP Move underestimated caloric
expenditure when compared to the portable metabolic analyzer; and while performing the
agility drills (agility ladder and “T Drill”), the Nike Fuelband underestimated caloric
expenditure by 14% with Jawbone UP Move underestimating by 30% when compared to
the criterion method. Not only did the activity trackers differ significantly from the
portable metabolic analyzer, it is also worth mentioning that the steps were also
underestimated with the Nike Fuelband (Stackpool et al., 2014). In a study that looked at
accelerometer energy expenditure in different activity settings such as treadmill walking,
reclining, typing on a computer, elliptical, biking, and stair climbing, it was reported that
the activity monitors showed relatively accurate measurements when compared to the
criterion method (Oxycon mobile 5.0). The participants completed 13 different activities
for a duration of 69 minutes. The 13 activities were performed for 5 minutes each, with
the treadmill activities lasting 3 minutes. The value of kilocalories measured from the
portable metabolic analyzer (Oxycon mobile 5.0) was 356.9 ± 67.6 kilocalories, and the
estimates from the eight accelerometers used in the study ranged from 271.1 ± 53.8
kilocalories (Basis B1 Band) to 370.1 ± 51.5 kilocalories (Jawbone UP Move). Mean
absolute percentage error (MAPE) measures error in a device (fitness trackers in this
case) when compared to the criterion method and is expressed as a percentage. It is
another method to assess the error in the fitness trackers compared to a criterion method.
11
MAPE is calculated by dividing the average of absolute differences between the fitness
trackers and the criterion method by the criterion method value, and finally multiplying it
by 100 to generate a percentage. The Fitbit One recorded a MAPE of 10.4% with the
Nike Fuelband recording a 13.3% MAPE (Lee, Kim, and Welk, 2014). The
underestimation of lifestyle activities results from not taking into consideration the added
energy expenditure from arm movement, uphill walking, stair climbing, and carrying
objects (Bassett et al., 2000).
In a previous study involving 21 participants, there was a series of three routines
used in the protocol. One routine involved sedentary/walking movements, routine two
consisted of household/yard work activities, while the last routine involved
conditioning/sports exercises (17 total exercises combined). The Nike Fuelband
overestimated the energy expenditure for more than half of the 17 total exercises, and
underestimated for three of them. During the household activities involving a great
amount of arm movement, the Nike Fuelband overestimated energy expenditure
(sweeping; Nike Fuelband, 4.7 ± 0.4 vs. Cosmed, 3.0 ± 0.8). However, during the
elliptical exercise, the Nike Fuelband was significantly different than the Cosmed
(Caeser, 2012).
Body Placement
Body placement of these commercial fitness trackers is also an area of question.
Accelerometer output is dependent upon where the accelerometer is placed on the
individual's body, and sensor capabilities of the monitor (Caeser, 2012). Several different
fitness trackers exist that allow an individual to wear them on their wrist, around their
waist/arm, clipped onto their belt loop, or clipped directly onto their pants/shorts. There
12
is not a significant amount of research that discusses which placement on the body is
most accurate. For those exercises that require full body movements, it has been
suggested to place the accelerometer as close to the center of mass as possible to
maximize accuracy (Caeser, 2012; Crouter, Schneider, Karabulut, & Bassett, 2003).
Chapter 3 - Methods
Participants
This study included 47 total participants [male (n = 22) and female (n = 25)]
between the ages of 18-59 recruited in the Bowling Green, KY area. Flyers were posted
on the Western Kentucky University campus as well as emailed Western Kentucky
University students, faculty, and staff. Each participant was given an informed consent
form that has been approved by the University Institutional Research Board (IRB) (ID:
802720-1) which included potential risks, benefits, and detailed study procedures.
Demographic characteristics of the 47 participants are located in Table 2. Participants
were recreationally active individuals. Recreationally active is defined as regular
exercise such as aerobic or weight training activities 2 to 5 days per week and not
participating in college athletics (Pescatello & American College of Sports, 2014).
Participants were instructed to continue their typical daily activities, diet, and sleep
regimens.
Equipment
Cosmed K4b2. The Cosmed K4b2 (Cosmed, Rome, Italy) is a small portable
metabolic analyzer using indirect calorimetry and is capable of assessing a variety of
variables. For the present study, caloric expenditure and oxygen consumption (VO2)
were primary outcomes of interest. The Cosmed K4b2 portable metabolic analyzer with
13
the battery pack and the harness weigh about 1.5 kg (3.3 lbs) (Crouter, Clowers, et al.,
2006). Before each test was conducted, the Cosmed K4b2 was calibrated and operated
according to the manufacturer’s instructions. All study team members were trained on
the proper use of the equipment.
ActiGraph GT3X. The ActiGraph (ActiGraph, Pensacola, FL) is a small
accelerometer typically used for research purposes and has been used in many previous
studies to assess physical activity (Lee et al., 2014). The ActiGraph can be worn on the
hip, wrist, ankle, and on the waist. Several studies have utilized the ActiGraph on the
waist (Crouter, Churilla, et al., 2006; Lee et al., 2014), as it is closest to the individual’s
center of gravity. It’s a triaxial device and can measure human motion in three planes
(horizontal, vertical, and diagonal) (Lee et al., 2014). This accelerometer can detect both
static and dynamic acceleration. MEMs-based physical activity monitors have been
developed to measure physical activity, and have become the most widely used
accelerometers to assess physical activity (Caeser, 2012). ActiGraph is one of the most
widely used accelerometer for research, and because it is so popular, there have been
several regression equations made available to use in the software when analyzing the
data (Crouter, Churilla, et al., 2006). Freedson et al., generated one equation in particular
that works fairly well when used during treadmill walking or jogging (Freedson,
Melanson, & Sirard, 1998). Hendelmen et al. 2000 and Swartz et al. 2000 generated
regression equations that apply to moderate-intensity lifestyle activities. These activities
in these studies included playing golf, dusting, vacuuming, lawn mowing, recreational
activities, and conditioning (Hendelman, Miller, Baggett, Debold, & Freedson, 2000;
Swartz et al., 2000).

14
Nike Fuelband. The Nike Fuelband (Nike Inc., Beaverton, OR) is a triaxial
accelerometer that is worn specifically on the wrist. This device assesses steps taken,
distance progressed, and calories burned. Data can be synchronized to the Nike+
Connect software (website) by attaching the device to the USB cord provided, which will
be connected to the computer; or by uploading the data to a cellular device that uses iOS
software (iPhone) via Bluetooth. Data can be shown on the Nike Fuelband itself by a
multitude of LED lights that rotate about the band displaying the different measurements
the Fuelband has to offer. By clicking the button on the band, the different measurements
will be displayed (steps and calories).
Jawbone UP Move. The Jawbone UP Move (Jawbone, San Francisco, CA) is a
triaxial accelerometer that can be attached in a small band and worn on the wrist, or
clipped onto the waistband of pants/shorts. Jawbone UP Move can assess physical
activity patterns throughout the day as well as assess sleep patterns. There is not a screen
on this device to display any data visibly. Data can be synchronized by using a cellular
device with iOS software (iPhone) and the UP by Jawbone app via Bluetooth.
Fitbit One. The Fitbit One (Fitbit Inc., San Francisco, CA) is a triaxial
accelerometer that can measure different variables such as steps taken, calories burned,
floors climbed, sleep patterns, and distance traveled. This device is worn on the
waistband of pants/shorts. There is a small screen that displays the features and can be
rotated through by clicking the button. Data can be synchronized via Bluetooth on a
cellular device with the Fitbit app; or on a desktop computer using wifi and a wireless
dongle that is plugged into the USB port of the computer and the Fitbit Connect software.
Fitbit Charge HR. The Fitbit Charge HR (Fitbit Inc., San Francisco, Ca) is a

15
triaxial accelerometer that can measure different variables such as steps taken, calories
burned, distance traveled, heart rate via plethysmography, and floors climbed. This
device is specifically worn on the wrist and can be purchased in three different sizes:
small, medium, and large. Data can be synchronized via Bluetooth on a cellular device
with the Fitbit app; or on a desktop computer using wifi and a wireless dongle that is
plugged into the USB port of the computer and the Fitbit Connect software.
Protocol
The protocol consists of two different data collection sessions. Session one, the
participants underwent baseline measurements such as blood pressure, heart rate, body
composition, and waist/hip/thigh circumferences. In addition to baseline measures,
participants performed a maximal oxygen consumption test using the ParvoMedics
TrueOne metabolic cart and a treadmill using the Bruce protocol. Session two, the
participants returned to the Biomechanics/Exercise Physiology lab and performed an
acute bout of a HIFT workout while wearing the Cosmed K4B2 and each of the activity
monitors. The HIFT intervention/data analysis took place in the laboratories. The
participants visited the Exercise Physiology lab during two separate sessions, which are
described below.
Session One: Initial assessment
In session one, each participant reported to the Exercise Science Lab after an 8
hour overnight fast. The participants were asked to fill out an informed consent, health
history questionnaire, self-efficacy questionnaire, physical activity enjoyment
questionnaire, and a physical activity readiness questionnaire (PAR-Q). Resting
measurements were taken including: resting blood pressure, heart rate, waist and hip
16
circumferences, and body composition via skinfold calipers (Lange skinfold calipers,
Beta Technology, Santa Cruz, CA). Height and weight were measured using a
stadiometer and digital scale in order to calculate body mass index (BMI). The
participants completed a maximal aerobic capacity test based on the Bruce treadmill
protocol using the open-circuit spirometry (breathing in ambient air) ParvoMedics
TrueOne 2400 maximal oxygen consumption system. Learning and practicing proper
movement execution of the high-intensity functional training exercises that will be used
for the main test day served as a warm-up for the maximal aerobic capacity treadmill test.
Blood pressure (BP) in mmHg was measured using a manual blood pressure cuff
when subjects are in the lab. An appropriately sized cuff was placed around the subjects
left arm, over the brachial artery, just above the cubital fossa of the elbow. Pressure was
increased to 200 mmHg, then decreased slowly to receive and accurate measurement.
The participants' body weight (kg) and height (cm) were determined using a Detect-
Medic Scale and attached stadiometer (Detecto Scales Inc., New York). Subjects were
asked to remove their shoes and wore a t-shirt and shorts. Once height and weight are
obtained body mass index (BMI) was then calculated.
The participants' body composition was measured using calibrated Lange skinfold
calipers. The objective is to measure subcutaneous fat to determine body fat. Waist, hip,
and thigh circumference measurements were taken by using a standard tape measure.
Along with body composition measurements, the participants’ circumferences were
measured using a calibrated tension tape measure. Circumference measurements were
taken so that the tape measure was on the participants’ skin and not over clothing to
assure accuracy while measuring.

17
Maximum aerobic capacity testing was conducted on a standard treadmill using
the Bruce protocol in the Exercise Physiology lab. The ParvoMedics True One metabolic
cart (Sandy, Utah) was used during the maximum aerobic capacity test to measure the
exchange of gases every 30 seconds throughout the assessment until the participant
reached volitional fatigue in order to assess maximal aerobic fitness. Volitional fatigue is
defined as the point at which the subject can no longer continue running at the current
pace. At this point, the treadmill was stopped immediately.
A rating of perceived exertion scale (RPE) was used to determine a subjective
level exertion during the maximal aerobic testing. This scale was based on a numerical
system (OMNI-RPE scale) with the numbers being 0-10, 0 being zero exertion and 10
being maximal exertion. Prior to maximal aerobic test, the subjects received standard
instructions on RPE scaling procedures.
Session Two: Acute Exercise Bout
The portable metabolic analyzer by Cosmed (Albano Laxiale, Italy) was worn by
each participant during the HIFT session in order to track intensity and record the amount
of energy being expended and to determine how hard the participant was working based
on their VO2 value. Each participant was scheduled to report to the Exercise Science Lab
48-72 hours after session one. After arriving at the lab, research technicians led the
participant through a five-minute warm-up on the treadmill at a self-selected pace. Once
the participant was properly warmed up, the portable metabolic analyzer and the activity
monitors were fitted to the participant. After the equipment was properly secured,
technicians set the timer for the 15-minute exercise bout. The HIFT circuit protocol that
the participant performed is described in Table 1. Modifications to the exercises were
18
made if the participants were unable to complete the given exercise. For example, many
participants were unable to complete pull-ups, therefore we allowed them to use rings in
order to complete an inverted row. Similarly, for push-ups, if a participant was unable to
complete a push-up with correct technique, they were able to use the bench and do an
incline push-up. The modifications were used if the participant was unable to perform
the exercises. The Fitness Trackers that were used during the HIFT workout included
two wrist-mounted (Fitbit Charge HR, left wrist; and Nike Fuelband, right wrist), two
hip-mounted (Fitbit One, left hip; and Jawbone UP, right hip), and one waist-mounted
(ActiGraph GT3X, right side near the midaxillary line) device.
Throughout the duration of the workout, the participants were cheered on by the
technicians and encouraged to push themselves as hard as they possibly could for the
entire 15-minute duration. All participants received the same amount and type of
feedback to ensure feedback did not influence results. To assess the perceived rating of
exertion, participants reported RPE (using the OMNI-RPE scale from 0-10) at minute
7:30, 15:00, and then again 15 minutes post exercise (three RPE values total). Post-
exercise, participants were asked to estimate the amount of calories they thought they
expended during that 15-minute workout in order to assess their perception of the amount
of calories they burned compared to the energy expenditure determined by the Cosmed.
Data was collected and analyzed via the Cosmed and software compatible for the
various physical activity fitness trackers. Breath-by-breath data was collected using the
Cosmed and analyzed by using the K4b2 software. Once the 15-minute workout was
completed, the total number of kilocalories was used to represent the amount of energy
expended during the HIFT workout using the Cosmed as the “criterion measurement” to
19
compare all fitness trackers to. The total number of kilocalories was used to determine
the amount of total energy expended (TEE) during the HIFT workout.
Chapter 4 – Manuscript
Introduction
According to the World Wide Survey of Fitness Trends for 2015, body weight
resistance training (BWRT) and high-intensity interval training (HIIT) have become
increasingly popular modes of exercise (Thompson, 2014). This includes exercises such
as push-ups, air squats, sit-ups, and lunges. Thompson (2014) believes BWRT and HIIT
are most popular because it is inexpensive, requires minimal equipment, and is effective.
One particular type of HIIT is, high-intensity functional training (HIFT), which is a high-
intensity, circuit-style training method in which only an individual’s body weight is
utilized (Heinrich et al., 2014). This mode of exercise can be done anywhere; while also
removing common exercise barriers such as weather, access to exercise facilities, and
safety of surroundings. There are few studies that investigate HIFT and its benefits,
however one study reported that a high-intensity circuit-style training modality elicited
cardiovascular responses similar to sprint intervals in college-aged men and women (Gist
et al., 2014). HIFT is a relatively new modality that warrants further investigation into its
risks and benefits. Because HIFT is becoming an increasingly useful mode of exercise,
and the use of commercial fitness bands has become extremely popular, understanding
the accuracy of commercial fitness bands during this mode of exercise is important.
People may experience significant physiological benefits from HIFT training, but if their
fitness trackers do not pick up on the caloric expenditure and/or step counts, they may

20
discontinue the exercise and perceive it as not helping them achieve their fitness goals.
To our knowledge no previous study has investigated the accuracy of popular,
commercial fitness trackers in assessing TEE during a HIFT session.
Commercial fitness trackers, also sometimes referred to as accelerometers, are
small devices that are typically worn on the wrist or on the waist and are capable of
measuring the daily caloric expenditure, steps taken, energy expenditure, possible sleep
patterns, and heart rate (Kooiman et al., 2015; Tucker et al., 2015). These monitors are
developed so that consumers can track daily physical activity levels, as well as recognize
the amount of sedentary time they accumulate for a given time period. The use of
activity trackers is highly associated with increases in the amount of physical activity that
is performed by an individual. Setting a step goal ranging from 2,000-10,000 steps,
depending on the individual, seems to be a motivational factor for increasing the amount
of daily physical activity (Bravata et al., 2007). Fitness trackers help gauge the amount
of physical activity that is being performed, whether it is walking through the office at
work, or performing a high intensity training workout (i.e. if an individual has set a
10,000 step goal and has only achieved 4,000 of those steps, they are well aware that they
are below their goal thus far and need to start being more active for that day).
Typically, self-reported questionnaires, logs, interviews, and journals are used to
assess physical activity (Lyden et al., 2011; Sallis & Saelens, 2000; Cartrine Tudor-
Locke, 2002). However, this is problematic as individuals have a tendency to over-report
favorable outcomes and under-report unfavorable outcomes (Caeser, 2012). People tend
to overestimate their physical activity levels when self-report measurements are used
(Sallis & Saelens, 2000). Therefore, the amount of energy expended from each individual

21
is most likely being overestimated as well.
Commercially available fitness trackers such as the Nike Fuelband, Fitbit devices,
and Jawbone devices are becoming increasingly popular in the fitness industry. This
industry is set to triple its sales from $2 billion in 2014 to almost $5.4 billion in 2018
(Lamkin, 2015). Therefore, it is important to determine the accuracy of these fitness
trackers in order for consumers and fitness professionals to be knowledgeable about the
true capacities of the activity monitors they are purchasing and/or recommending. It is
important to determine whether or not these fitness trackers are measuring exactly what
they are claiming to measure. Fitness trackers estimate energy expenditure; however, the
calculations are based on regression equations. These regression equations have been
developed to estimate the amount of energy expended over a given time frame and are
based counts per minute (movement) in order to estimate physical activity intensity
(Crouter, Clowers, et al., 2006). For example, lifestyle regression equations more
accurately estimate physical activity energy expenditure (PAEE) for moderate intensity
exercises, however they tend to overestimate the energy expenditure of sedentary and
light activities, while underestimating the energy expenditure of vigorous activities
(Bassett et al., 2000). Additionally, consistent movement patterns during activities such
as walking and running lead to a more accurate estimate of PAEE than irregular
movement patterns such as those involving free-living movements (uphill walking, lifting
objects, squatting down, standing up from a seated position, etc.) (Crouter, Churilla, et
al., 2006). Fitness trackers and pedometers should be able to measure steps and energy
expenditure easily based upon movement from one spot to another. For agility drills such
as shuffling, pivoting, or anything involving quick steps and fast arm movements, the
22
fitness trackers appear to underestimate the energy expenditure (Stackpool et al., 2014).
This is likely due to various, complex movements that are being performed while
completing the agility exercises. Small, quick, abnormal steps may not be registering
with the fitness trackers and therefore underestimating the energy expenditure. There is
typically less major arm movement involved in exercises involving quick steps, which
then effects the accuracy of the fitness trackers worn on the wrist and arm (Stackpool et
al., 2014).
The purpose of this study was to determine the accuracy/validity of four
commercially available fitness trackers during an acute bout of circuit-style high-intensity
functional training (HIFT). Based on the previously mentioned studies, the hypothesis is
that fitness trackers will underestimate the amount of energy that is being expended based
upon the types of exercises being performed (e.g. body weight squats and sit-ups).
Methods
Participants
This study included 47 total participants [male (n = 22) and female (n = 25)]
between the ages of 18-59 recruited in the Bowling Green, KY area. Flyers were posted
on the Western Kentucky University campus as well as sent to a master email list of
Western Kentucky University students, faculty, and staff. Each participant was given an
informed consent form that has been approved by the University Institutional Research
Board (IRB) which included potential risk, benefits, and instructions. It was assumed that
all participants would continue to partake in their usual daily activities, as well as adhere
to their everyday dietary and sleep habits.
Instruments
23
Cosmed K4b2. The Cosmed K4b2 (Cosmed, Rome, Italy) is a small portable
metabolic analyzer using indirect calorimetry and is capable of assessing a variety of
variables. For the present study, caloric expenditure and oxygen consumption (VO2)
were primary outcomes of interest. The Cosmed K4b2 portable metabolic analyzer with
the battery pack and the harness weigh about 1.5 kg (3.3 lbs) (Crouter, Clowers, et al.,
2006). Before each test was conducted, the Cosmed K4b2 was calibrated and operated
according to the manufacturer’s instructions. All study team members were trained on
the proper use of the equipment.
ActiGraph GT3X. The ActiGraph (ActiGraph, Pensacola, FL) is a small
accelerometer typically used for research purposes and has been used in many previous
studies to assess physical activity (Lee et al., 2014). The ActiGraph can be worn on the
hip, wrist, ankle, and on the waist. Several studies have utilized the ActiGraph on the
waist (Crouter, Churilla, et al., 2006; Lee et al., 2014), as it is closest to the individual’s
center of gravity. It’s a triaxial device and can measure human motion in three planes
(horizontal, vertical, and diagonal) (Lee et al., 2014). This accelerometer can detect both
static and dynamic acceleration. MEMs-based physical activity monitors have been
developed to measure physical activity, and have become the most widely used
accelerometers to assess physical activity (Caeser, 2012). ActiGraph is one of the most
widely used accelerometer for research, and because it is so popular, there have been
several regression equations made available to use in the software when analyzing the
data (Crouter, Churilla, et al., 2006). Freedson et al., generated one equation in particular
that works fairly well when used during treadmill walking or jogging (Freedson et al.,
1998). Hendelmen et al. 2000 and Swartz et al. 2000 generated regression equations that

24
apply to moderate-intensity lifestyle activities. These activities in these studies included
playing golf, dusting, vacuuming, lawn mowing, recreational activities, and conditioning
(Hendelman et al., 2000; Swartz et al., 2000).
Nike Fuelband. The Nike Fuelband (Nike Inc., Beaverton, OR) is a triaxial
accelerometer that is worn specifically on the wrist. For this study, it was worn on the
participants’ right wrist. This device assesses steps taken, distance progressed, and
calories burned. Data can be synchronized to the Nike+ Connect software (website) by
attaching the device to the USB cord provided, which will be connected to the computer;
or by uploading the data to a cellular device that uses iOS software (iPhone) via
Bluetooth. Data can be shown on the Nike Fuelband itself by a multitude of LED lights
that rotate about the band displaying the different measurements the Fuelband has to
offer. By clicking the button on the band, the different measurements will be displayed
(steps and calories).
Jawbone UP Move. The Jawbone UP Move (Jawbone, San Francisco, CA) is a
triaxial accelerometer that can be attached in a small band and worn on the wrist, or
clipped onto the waistband of pants/shorts. Jawbone UP Move can assess physical
activity patterns throughout the day as well as assess sleep patterns. There is not a screen
on this device to display any data visibly. Data can be synchronized by using a cellular
device with iOS software (iPhone) and the UP by Jawbone app via Bluetooth.
Fitbit One. The Fitbit One (Fitbit Inc., San Francisco, CA) is a triaxial
accelerometer that assesses steps taken, calories burned, floors climbed, sleep patterns,
and distance traveled. This device is worn on the waistband of pants/shorts. There is a
small screen that displays the features and can be rotated through by clicking the button.

25
To record data for this study, at the beginning of the exercise bout the button would be
pressed until vibration, initializing the start of the exercise bout. When finished, the same
button was held down until vibration indicating the exercise bout was successful recorded
as active minutes. Data can be synchronized via Bluetooth on a cellular device with the
Fitbit app; or on a desktop computer using wifi and a wireless dongle that is plugged into
the USB port of the computer and the Fitbit Connect software.
Fitbit Charge HR. The Fitbit Charge HR (Fitbit Inc., San Francisco, Ca) is a
triaxial accelerometer that can measure different variables such as steps taken, calories
burned, distance traveled, heart rate via plethysmography, and floors climbed. This
device is specifically worn on the wrist and can be purchased in three different sizes:
small, medium, and large. Data can be synchronized via Bluetooth on a cellular device
with the Fitbit app; or on a desktop computer using wifi and a wireless dongle that is
plugged into the USB port of the computer and the Fitbit Connect software.
Protocol
Session One: Initial assessment
The protocol consisted of two different data collection sessions. For session one,
participants reported to the Exercise Physiology Lab after an 8 hour overnight fast,
typically in the morning. An informed consent, health history questionnaire, and a
Physical Activity Readiness Questionnaire (PAR-Q) were completed and baseline
measurements were taken (resting blood pressure, resting heart rate, waist and hip
circumference, and skin fold body composition) for each participant height and weight
measurements were used to calculate body mass index (BMI). Participants were then
instructed in the high-intensity functional movement exercises (See Table 2) and given

26
time to practice the exercises, which served as a warm-up for the maximal aerobic
capacity (VO2 max) test. VO2 max testing was completed using the Bruce treadmill
protocol (Pescatello & American College of Sports, 2014) and the ParvoMedics TrueOne
2400 (Sandy, UT) oxygen consumption system. Learning and practicing proper
movement execution of the high-intensity functional training exercises that will be used
for the main test day served as a warm-up for the maximal aerobic capacity treadmill test.
Session Two: Acute Exercise Bout
The Cosmed K4b2 portable metabolic analyzer (Albano Laxiale, Italy) was worn
by each participant during the HIFT session in order to track intensity and record the
amount of energy being expended and to determine how hard the participant was working
based on their VO2 value. Each participant was scheduled to report to the laboratory 48-
72 hours after completing session one. After arriving at the lab, research technicians led
the participant through a five-minute warm-up on the treadmill at a self-selected pace.
Once the participant was properly warmed up, the portable metabolic analyzer and the
activity monitors were fitted to the participant.
The fitness trackers that were used during the HIFT workout included two wrist-
mounted, two hip-mounted, and one waist-mounted fitness tracker. The fitness trackers
worn on the wrist consisted of the Fitbit Charge HR (Fitbit Inc., San Francisco, CA) and
the Nike Fuelband (Nike Inc., Beaverton, OR). The fitness trackers worn on the hip
consisted of the Fitbit One (Fitbit In., San Francisco, CA) and the Jawbone UP Move
(Jawbone, San Francisco, CA). The waist-mounted fitness tracker was the ActiGraph
GT3X (ActiGraph, Pensacola, FL). All of these fitness trackers were placed in specific
places on the body in order to fit the manufacturers recommendations. Each activity

27
monitor uses different outcome measures to summarize the data. Three of the five fitness
trackers used provide estimates of physical activity energy expenditure (PAEE) (PAEE;
Nike Fuelband, ActiGraph GT3X, and Jawbone UP Move) rather than total energy
expenditure (TEE; PAEE + REE) (TEE; Fitbit One and Fitbit Charge). In order to
compare these estimates, it was necessary to add resting energy expenditure (REE) to
those three activity monitors that measure PAEE values (expressed in kilocalories per
minute (Lee et al., 2014). To find REE for each participant, an equation was used to
determine the estimated energy expenditure for the entire day while at rest. Once that
value was found, it was broken down to kcals/min instead of kcal/day. The following
equations were used to determine REE kcal/day (Mifflin et al., 1990):
For females, REE = 9.99 x weight (kg) + 6.25 x height (cm) – 4.92 x age (years) -161
For males, REE = 9.99 x weight (kg) + 6.25 x height (cm) – 4.92 x age (years) + 5.
After the equipment was properly secured, technicians set the timer for the 15-
minute exercise bout. The HIFT circuit protocol that each participant performed is
described in Table 1. Modifications to the exercises were made if the participants were
unable to complete the given exercise. For example, many participants were unable to
complete pull-ups, therefore we allowed them to use rings in order to complete an
inverted row. Similarly, for push-ups, if a participant was unable to complete a push-up
with correct technique, they were able to use the bench and do an incline push-up. The
modifications were used if the participant was unable to perform the exercises. Once the
15-minute workout was completed, the total number of kilocalories was used to represent
the amount of energy expended during the HIFT workout using the Cosmed K4b2 as the
“criterion measurement” to compare the accuracy of all fitness trackers against. The total

28
number of kilocalories (TEE) was used to determine the amount of total energy expended
during the HIFT workout. Throughout the duration of the workout, the participants were
encouraged to push themselves as hard as they possibly could for the entire 15-minute
duration. Participants reported their rate of perceived exertion (RPE) (using the OMNI-
RPE scale from 0-10) at minute 7:30, 15:00, and then again 15 minutes post exercise
(three RPE values total).
Following the completion of the exercise session, participants were asked to
estimate the amount of calories they thought they expended during that 15-minute
workout in order to assess their perception of the amount of calories they burned
compared to the energy expenditure determined by the Cosmed K4b2 portable metabolic
analyzer.
Table 1. Exercise Protocol for Main Test Day
Exercise Protocol for Session Two
Warm-up
Five minutes of treadmill jogging at self-
selected pace
HIFT Circuit
Complete as many rounds as possible in 15
minutes of:
12 air squats
12 push-ups
12 sit-ups
12 lunges
12 pull-ups
12 high knees
12 step-ups
Statistical Analyses
Statistical analyses were conducted using IBM SPSS Statistics software version

29
23 for Windows (IBM Corporation, Armon, NY, USA). For all analyses, statistical
significance was defined as a p level < 0.05. Descriptive analyses were conducted to
examine associations and differences with the criterion measurement and the multiple
fitness trackers. To assess validity of the different fitness trackers when compared to the
Cosmed K4b2, an Intraclass Correlation Coefficient (ICC) was conducted using the data
collected in the HIFT exercise bout. Based upon previous literature involving activity
trackers (Crouter, Clowers, et al., 2006; Stackpool et al., 2014), a repeated measures
ANOVA was conducted to look at the comparison of means between the fitness trackers
and the criterion measure. Pearson Correlations were computed to observe overall
group–level associations. Mean absolute percentage errors (MAPE) were also computed
to provide an indication of complete measurement error. In other words, MAPE
measures error in a device (fitness trackers in this case) when compared to the criterion
method and is expressed as a percentage (Lee et al., 2014). It is another method to assess
the error in the fitness trackers compared to a criterion method. MAPE is calculated by
dividing the average of absolute differences between the fitness trackers and the criterion
method by the criterion method value, and finally multiplying it by 100 to generate a
percentage. This is a conservative method to estimate error that takes into consideration
both the overestimation and underestimation of devices because the absolute value of the
error is used for calculating.
Bland-Altman Plots with corresponding 95% limits of agreement and fitted lines
were used to visually show the variability in the individual error scores of the fitness
trackers. These plots help to identify overestimation and underestimation of the different
fitness trackers to compare against the Cosmed K4b2. The limits of agreement were

30
calculated as the mean difference between devices ± SD (Bland & Altman, 1986). Data
points located around zero (slope and intercept of 0) signify a higher accuracy of the
fitness trackers, while data points located above the zero signify an underestimation of
energy expenditure and data points below the zero indicate an underestimation of energy
expenditure (Bland & Altman, 1986).
Results
Participants
Due to some errors occurring while downloading data from the ActiGraph
software, four participants’ data was excluded from the total number of participants
whose data was analyzed (n = 47; females = 25 and males = 22). Descriptive statistics
for the population are specified in Table 2. Participants’ ages ranged between 18 and 59
years (female = 26.9 ± 11.5; male = 29.5 ± 11.0). The body mass index of the
participants ranged between 15.33 and 40.35 kgm-2 (females = 22.79 ± 3.4; males =
24.7 ± 4.4). Height, weight, body fat, and VO2 max values were significantly different
for males and females (see Table 2.)
Table 2. Physical Characteristics of Participants
Male (n = 22) Females (n = 25) Total (n = 47)
Mean ± SD Range Mean ± SD Range Mean ± SD Range
Age 29.5 ± 11.0 18.0–52.0 26.9 ± 11.5 18.0-59.0 28.5 ± 11.6 18.0-59.0
Height (cm) 177.7 ± 7.5* 161.5-189.0 164.8 ± 4.6 154.8-175.5 69.4 ± 9.0 154.8-189.0
Weight (kg) 77.8 ± 15.7* 50.0–128.6 61.3 ± 8.9 50.2-86.6 69.4 ± 15.1 50.0-128.6
Body Fat (%) 13.8 ± 7.7* 4.8–30.8 23.6 ± 7.2 7.7-36.0 18.8 ± 8.8 4.8-36.0
BMI (kg m2) 24.7 ± 4.4 15.3–33.0 22.79 ± 3.4 18.3-40.3 23.6 ± 4.0 15.3-36.4

31
VO2 max
(mlkgmin)
53.0 ± 9.3* 32.0-70.2 41.4 ± 6.7 21.1-50.3 47.8 ± 9.7 21.1-70.2
*. Significantly different from females, p <0.001
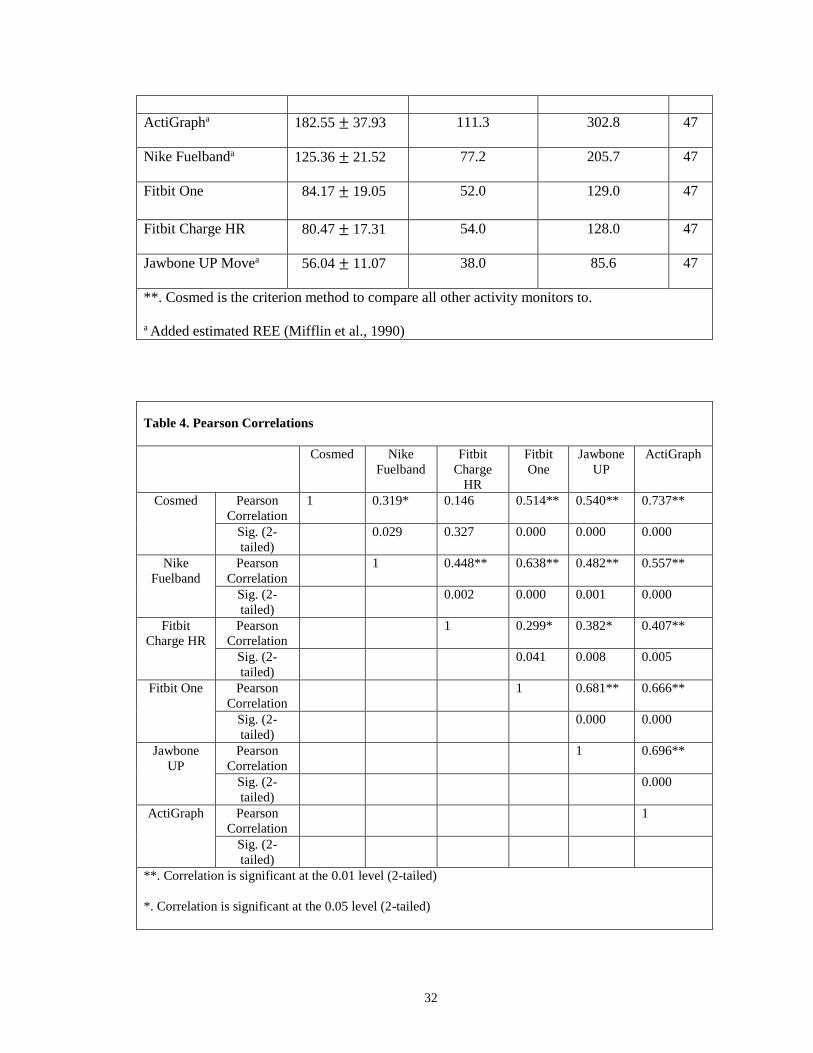
Table 3 provides descriptive statistics (mean ± SD) for the various monitors used,
including the criterion measuring device (Cosmed K4b2), during the HIFT exercise bout.
The measured value of the criterion measure was 144.99 ± 37.13 kcal, and the estimates
from the monitors ranged from a low of 56.04 ± 11.07 kcal (Jawbone UP) to a high of
182.55 ± 37.93 kcal (ActiGraph). Table 4 shows the correlation coefficients (r) between
the indirect calorimetry measurements (Cosmed K4b2) and the fitness trackers. The
strongest correlation between the Cosmed K4b2 and the fitness trackers were seen with
the ActiGraph (r = 0.74). The correlation coefficients for the other monitors ranged from
r = 0.15 to 0.70 when compared to the criterion measure (Cosmed K4b2).
Systematic differences between the activity monitors were calculated with an ICC
= -0.032. The ICC of F (46,235) = 0.812 (p = 0.799) was not significant at the
predetermined 0.05 alpha level. A Repeated Measures ANOVA showed that when
compared to the criterion measure, all fitness trackers were significantly different at the
0.05 alpha level. In addition, all fitness tracker measures are significantly different from
all other monitors, with the notable exception that the Fitbit Charge HR and the Fitbit
One were the only two fitness trackers that are not significantly different from one
another (p = 0.985).
Table 3. Total Estimated Energy Expenditure (kcals)
Mean ± SD
Minimum Maximum N
Cosmed** 144.99 ± 37.13 66.7 265.7 47
32
ActiGrapha
182.55 ± 37.93 111.3 302.8 47
Nike Fuelbanda
125.36 ± 21.52 77.2 205.7 47
Fitbit One 84.17 ± 19.05 52.0 129.0 47
Fitbit Charge HR
80.47 ± 17.31 54.0 128.0 47
Jawbone UP Movea
56.04 ± 11.07 38.0 85.6 47
**. Cosmed is the criterion method to compare all other activity monitors to.
a Added estimated REE (Mifflin et al., 1990)
Table 4. Pearson Correlations
Cosmed Nike
Fuelband
Fitbit
Charge
HR
Fitbit
One
Jawbone
UP
ActiGraph
Cosmed Pearson
Correlation
1 0.319* 0.146 0.514** 0.540** 0.737**
Sig. (2-
tailed)
0.029 0.327 0.000 0.000 0.000
Nike
Fuelband
Pearson
Correlation
1 0.448** 0.638** 0.482** 0.557**
Sig. (2-
tailed)
0.002 0.000 0.001 0.000
Fitbit
Charge HR
Pearson
Correlation
1 0.299* 0.382* 0.407**
Sig. (2-
tailed)
0.041 0.008 0.005
Fitbit One Pearson
Correlation
1 0.681** 0.666**
Sig. (2-
tailed)
0.000 0.000
Jawbone
UP
Pearson
Correlation
1 0.696**
Sig. (2-
tailed)
0.000
ActiGraph Pearson
Correlation
1
Sig. (2-
tailed)
**. Correlation is significant at the 0.01 level (2-tailed)
*. Correlation is significant at the 0.05 level (2-tailed)

33
Figure 1 depicts the MAPE for the multiple activity monitors (computed as the
average absolute value of errors relative to the Cosmed). The range of errors was least
for the ActiGraph (15.1%), followed by the Fitbit One (17.5%) and the Jawbone Up
(18.1%); with the highest MAPE value being the Fitbit Charge HR (22.1%).
Bland-Altman plot analyses showed the distribution of error for the estimates.
The plots show the differences between the Cosmed and a fitness tracker along the y-axis
(Cosmed – fitness tracker1), with the mean of the two methods along the x-axis. The
plots (see Fig. 2) showed the narrowest 95% limits of agreement for the ActiGraph
(difference = 106.8) with a slightly higher value for the Fitbit One (difference = 124.8).
Values were higher for the Nike Fuelband (difference = 146.1), the Fitbit Charge HR
(difference = 151.3), and the Jawbone UP Move (difference = 213.4). A tighter grouping
of data points around the mean for the ActiGraph, Fuelband, and Fitbit One and less total
error were observed when compared with the measured energy expenditure values.
15.1% 17.5% 18.8% 21.3% 22.1%
0
5
10
15
20
25
30
35
40
45
Actigraph Fitbit One Jawbone Up Nike FuelBand
Fitbit Charge
Mea
n A
bso
lute
Per
cen
tage
Err
or
(%)

34
*. Fitbit One and Fitbit Charge HR provide total energy expenditure (REE+AEE)
*. Added estimated resting energy expenditure ActiGraph, Nike Fuelband, and Jawbone UP Move ((Mifflin et al., 1990)
Figure 1. – Mean absolute percentage error (SD) for all monitors with measured REE

35
Discussion
100 200 300-200
-100
0
100
200
Average of Cosmed and Actigraph GT3X (kcals)
Co
sm
ed
- A
ctr
iGra
ph
GT
3X
(kcals
) Cosmed vs. ActiGraph GT3X
Estimated resting energy expenditure added
+1.96 SD15.9
Mean-37.6
-1.96 SD-90.9
100 200 300-200
-100
0
100
200
Average of Cosmed and Fitbit One (kcals)
Co
sm
ed
- F
itb
it O
ne (
kcals
)
Cosmed vs. Fitbit One
+1.96 SD123.2
Mean60.8
-1.96 SD-1.6
100 200 300-200
-100
0
100
200
Average of Cosmed and Jawbone UP (kcals)
Co
sm
ed
- J
aw
bo
ne U
P (
kcals
)
Cosmed vs. Jawbone UP
Estimated resting energy expenditure added
+1.96 SD172.1
Mean106.7
-1.96 SD41.3
100 200 300-200
-100
0
100
200
Average of Cosmed and Nike Fuelband (kcals)
Co
sm
ed
- N
ike F
uelb
an
d (
kcals
)
Cosmed vs. Nike Fuelband
Estimated resting energy expenditure added
+1.96 SD110.4
Mean37.4
-1.96 SD-35.7
100 200 300-200
-100
0
100
200
Average of Cosmed and Fitbit Charge HR (kcals)
Co
sm
ed
- F
itb
it C
harg
e H
R (
kcals
) Cosmed vs. Fitbit Charge HR
+1.96 SD140.2
Mean64.5
-1.96 SD-11.1
Figure 2. - Bland-Altman plots using estimated resting energy expenditure (REE)

36
The current study examined the accuracy of an assortment of consumer-based,
brand name fitness trackers for estimating the energy expended during a HIFT exercise
protocol. The results did not provide accurate estimations of energy expenditure of the
activity monitors after analyzing the data. With the exception of the ActiGraph GT3X,
the remaining four fitness trackers showed inaccurate estimates of the amount of
kilocalories expended during the HIFT exercise bout compared to the criterion measure.
Although the ActiGraph yielded the most favorable results, it is a research based
accelerometer and is a much more expensive device. Because this is a research based
accelerometer, it is not surprising that the ActiGraph (182.55 kcal ± 37.93 kcal) shows
the most accuracy when compared to the Cosmed (144.99 kcal ± 37.13 kcal). Not only
is the device expensive to purchase alone, but the software to analyze the data is also an
expensive purchase. The second most accurate activity monitor in this study showed to
be the Nike Fuelband (125.36 kcal ± 21.52 kcal). This is an affordable consumer-based
fitness tracker that can be purchased commercially in many locations. Of the 5 activity
monitors tested, the research based accelerometer (ActiGraph) had the highest
correlations with the Cosmed (r = 0.74) and the smallest MAPE value (15.1%). The Fitbit
monitors had two of the highest MAPE values (Fitbit One = 17.5% and Fitbit Charge HR
= 22.1%). In comparison to the study conducted by Lee and colleagues, the ActiGraph
recorded similar MAPE values. In the current study, the ActiGraph reported a MAPE
value of 15.1% whereas in the study conducted by Lee and colleagues, the ActiGraph
reported a MAPE values of 12.6%. When looking at the Fitbit One devices, between the
current study and Lee and colleagues’ study, the MAPE value had a difference of 7.1%
(Lee et al., 2014). According to the repeated measures ANOVA, the Fitbit monitors were

37
not significantly different from one another (p = 0.985), however they were significantly
different from the Cosmed. This statement makes sense because the two monitors that
are closely related to one another are manufactured by the same company.
The study protocol was designed to replicate functional movements that reflect
normal daily behavior, however activity monitors typically have a hard time recognizing
these life-style activities (e.g. weight bearing activity, stair climbing, squatting down, and
arm movement).
To the best of the authors’ knowledge, no previous study has assessed
commercially available fitness trackers when preforming a HIFT exercise protocol. The
use of fitness trackers to measure energy expenditure is popular among consumers,
however depending on the type of exercises being performed (walking, running, BWRT,
HIFT, CrossFit, etc.) some fitness trackers may be better than others.
The significance of this study is that it provides information on energy
expenditure estimates for HIFT exercises. This could be beneficial in developing new
approaches and methods for quantifying physical activity measurements. The
participants’ fitness level prior to beginning this study is a potential strength of this study,
deeming it novel, because all participants were welcome to participate in the study within
the age range regardless of prior fitness level. There was no pre-determined fitness level
that the participants were required to have, therefore the fitness level of participants may
have been a factor influencing the amount of energy expended.
An advantage of consumer fitness trackers is that they are user friendly, offer
immediate feedback, and they are less obtrusive than having to keep up with a journal or
log, or use a research based accelerometer. However, these fitness devices should only
38
be used as an estimate or reference for caloric expenditure, and not as a dietary intake
guide. Future researchers should consider the multiple HIFT exercises when creating
energy expenditure equations for these user friendly fitness trackers.
Chapter 5 – Summary of Findings
Discussion
The current study examined the accuracy of an assortment of consumer-based,
brand name fitness trackers for estimating the energy expended during a HIFT exercise
protocol. The results showed that when performing HIFT, these activity trackers showed
to be inaccurate. With the exception of the ActiGraph GT3X, the remaining four fitness
trackers showed inaccurate estimates of the amount of kilocalories expended during the
HIFT exercise bout compared to the Cosmed K4b2. Although the ActiGraph yielded the
most favorable results, it is a research based accelerometer and is a very expensive
device. Because this is a research based accelerometer, it is not surprising that the
ActiGraph (182.55 kcal ± 37.93 kcal) shows the most accuracy when compared to the
Cosmed (144.99 kcal ± 37.13 kcal). Not only is the device expensive to purchase alone,
but the software to analyze the data is also an expensive purchase. The second most
accurate fitness tracker in this study showed to be the Nike Fuelband (125.36 kcal ±
21.52 kcal). This is an affordable consumer-based accelerometer that can be purchased at
Best Buy, Nike, etc. Of the 5 fitness trackers tested, the research based accelerometer
(ActiGraph) had the highest correlations with the Cosmed (r = 0.74) and the smallest
MAPE value (15.1%). The Fitbit monitors reported two of the highest MAPE values
(Fitbit One = 17.5% and Fitbit Charge HR = 22.1%). In comparison to the study

39
conducted by Lee and colleagues, the ActiGraph recorded similar MAPE values. In the
current study, the ActiGraph reported a MAPE value of 15.1% whereas in the study
conducted by Lee and colleagues, the ActiGraph reported a MAPE values of 12.6%.
When looking at the Fitbit One devices, between the current study and Lee and
colleagues’ study, the MAPE value had a difference of 7.1% (Lee et al., 2014).
According to the repeated measures ANOVA, the Fitbit monitors were not significantly
different from one another (p = 0.985), however they were significantly different from
the Cosmed. This statement makes sense because the two monitors that are closely
related to one another are manufactured by the same company.
The study protocol was designed to replicate functional movements that reflect
normal daily behavior, however activity monitors typically have a hard time recognizing
these life-style activities (e.g. weight bearing activity, stair climbing, squatting down, and
arm movement). There is a possibility that some activity monitors overestimated some
activities, as well as overestimated some.
To the best of the authors’ knowledge, no previous study has assessed
commercially available fitness trackers when preforming a HIFT exercise protocol. This
study showed that the use of certain commercially available fitness trackers for various
modes of exercise are in question. The use of fitness trackers to measure energy
expenditure is popular among consumers, however depending on the type of exercises
being performed (walking, running, HIFT, BWRT, CrossFit, etc.) these fitness trackers
showed to be inaccurate. This study revealed that four commercially available fitness
trackers measured significantly lower energy expenditure when compared to the Cosmed.
Despite advertisements, these fitness trackers showed to be inaccurate when measuring

40
caloric expenditure during a HIFT circuit. Due to this inaccuracy these fitness trackers
should be used as a motivational tool rather than a caloric expenditure measurement tool.
The study provided new knowledge about these physical activity monitors. There
are some limitations in that the population was derived of Western Kentucky University
Kinesiology students, as well as the university faculty and staff. A strength however is
that these participants’ fitness level was not predetermined, therefore we can generalize
these findings to all ages and body types.
The significance of this study is that it provides information on energy
expenditure estimates for HIFT exercises. This could be beneficial in developing new
approaches and methods for quantifying physical activity measurements. The
participants’ fitness level prior to beginning this study based upon their previous training
or active lifestyle is a potential limitation because all participants were welcome to
participate in the study within the age range. There was no pre-determined fitness level
that the participants were required to have, therefore the fitness level of participants may
have been a factor influencing the amount of energy expended. Since it was not taken
into consideration for this study, it is considered a limiting factor and could be assessed in
further research with participants categorized in different fitness levels
An advantage of consumer fitness trackers is that they are user friendly, offer
immediate feedback, and they are less obtrusive than having to keep up with a journal or
log, or use a research based accelerometer. However, these fitness devices should only
be used as an estimate or reference for caloric expenditure, and not as a dietary intake
guide. Future researchers should consider the multiple HIFT exercises when creating
energy expenditure equations for these user friendly activity monitors.

41
References
Bassett, D. R., Jr., Ainsworth, B. E., Swartz, A. M., Strath, S. J., O'Brien, W. L., & King,
G. A. (2000). Validity of four motion sensors in measuring moderate intensity
physical activity. Med Sci Sports Exerc, 32(9 Suppl), S471-480.
Bland, J. M., & Altman, D. G. (1986). Statistical methods for assessing agreement
between two methods of clinical measurement. Lancet, 1. doi:10.1016/s0140-
6736(86)90837-8
Bravata, D. M., Smith-Spangler, C., Sundaram, V., Gienger, A. L., Lin, N., Lewis, R., . . .
Sirard, J. R. (2007). Using pedometers to increase physical activity and improve
health: a systematic review. Jama, 298(19), 2296-2304.
doi:10.1001/jama.298.19.2296
Caeser, T. G. (2012). The Estimation of Caloric Expenditure Using Three Triaxial
Accelerometers (Thesis ), University of Tennessee. Retrieved from
http://trace.tennessee.edu/utk_graddiss/1514
Caspersen, C. J., Powell, K. E., & Christenson, G. M. (1985). Physical activity, exercise,
and physical fitness: definitions and distractions for health-related reseach. Public
Health Reports, 100(2), 126-133.
Crouter, S. E., Churilla, J. R., & Bassett, D. R. (2006). Estimating energy expenditure
using accelerometers. Eur J Appl Physiol, 98. doi:10.1007/s00421-006-0307-5
Crouter, S. E., Clowers, K. G., & Bassett, D. R., Jr. (2006). A novel method for using
accelerometer data to predict energy expenditure. J Appl Physiol (1985), 100(4),
1324-1331. doi:10.1152/japplphysiol.00818.2005
Crouter, S. E., Horton, M., & Bassett, D. R. (2012). Use of a 2-Regression Model for
Estimating Energy Expenditure in Children. Med Sci Sports Exerc, 44(6), 1177-
1185. doi:10.1249/MSS.0b013e3182447825
Crouter, S. E., Schneider, P. L., Karabulut, M., & Bassett, D. R., Jr. (2003). Validity of
10 electronic pedometers for measuring steps, distance, and energy cost. Med Sci
Sports Exerc, 35(8), 1455-1460. doi:10.1249/01.mss.0000078932.61440.a2
Dannecker, K. L., Sazonova, N. A., Melanson, E. L., Sazonov, E. S., & Browning, R. C.
(2013). A Comparison of Energy Expenditure Estimation of Several Physical
Activity Monitors. Med Sci Sports Exerc, 45(11), 2105-2112.
doi:10.1249/MSS.0b013e318299d2eb
Freedson, P. S., Melanson, E., & Sirard, J. (1998). Calibration of the Computer Science
and Applications, Inc. accelerometer. Med Sci Sports Exerc, 30(5), 777-781.
Gist, N. H., Freese, E. C., & Cureton, K. J. (2014). Comparison of responses to two high-
intensity intermittent exercise protocols. J Strength Cond Res, 28(11), 3033-3040.
doi:10.1519/jsc.0000000000000522
Heinrich, K. M., Patel, P. M., O’Neal, J. L., & Heinrich, B. S. (2014). High-intensity
compared to moderate-intensity training for exercise initiation, enjoyment,
adherence, and intentions: an intervention study. BMC Public Health, 14(1), 1-6.
doi:10.1186/1471-2458-14-789
Hendelman, D., Miller, K., Baggett, C., Debold, E., & Freedson, P. (2000). Validity of
accelerometry for the assessment of moderate intensity physical activity in the
field. Med Sci Sports Exerc, 32(9 Suppl), S442-449.
Kooiman, T. J. M., Dontje, M. L., Sprenger, S. R., Krijnen, W. P., van der Schans, C. P.,

42
& de Groot, M. (2015). Reliability and validity of ten consumer activity trackers.
BMC Sports Sci Med Rehabil, 7(1), 1-11. doi:10.1186/s13102-015-0018-5
Kumahara, H., Schutz, Y., Ayabe, M., Yoshioka, M., Yoshitake, Y., Shindo, M., . . .
Tanaka, H. (2004). The use of uniaxial accelerometry for the assessment of
physical-activity-related energy expenditure: a validation study against whole-
body indirect calorimetry. Br J Nutr, 91(2), 235-243. doi:10.1079/bjn20031033
Lamkin, P. (2015). Fitness tracker market to top $5bn by 2019. Retrieved from
http://www.wareable.com/fitness-trackers/fitness-tracker-market-to-top-dollar-5-
billion-by-2019-995
Lee, J. M., Kim, Y., & Welk, G. J. (2014). Validity of consumer-based physical activity
monitors. Med Sci Sports Exerc, 46. doi:10.1249/mss.0000000000000287
Lyden, K., Kozey, S. L., Staudenmeyer, J. W., & Freedson, P. S. (2011). A
comprehensive evaluation of commonly used accelerometer energy expenditure
and MET prediction equations. Eur J Appl Physiol, 111(2), 187-201.
doi:10.1007/s00421-010-1639-8
Mifflin, M. D., Jeor, S. T. S., Hill, L. A., Scott, B. J., Daugherty, S. A., & Koh, Y. O.
(1990). A new predictive equation for resting energy expenditure in healthy
individuals. American Journal of Clinical Nutrition, 51(2), 241-247.
Mokdad, A. H., Serdula, M. K., Dietz, W. H., Bowman, B. A., Marks, J. S., & Koplan, J.
P. (1999). The spread of the obesity epidemic in the United States, 1991-1998.
Jama, 282(16), 1519-1522.
Nilsson, A., Ekelund, U., Yngve, A., & Sjostrom, M. (2002). Assessing Physical Activity
Among Children With Accelerometers Using Different Time Sampling Intervals
and Placements (Vol. 14): Human Kinetics Publishers, Inc.
Pescatello, L. S., & American College of Sports, M. (2014). ACSM's guidelines for
exercise testing and prescription (9th ed.). Philadelphia: Wolters
Kluwer/Lippincott Williams & Wilkins Health.
Sallis, J. F., & Saelens, B. E. (2000). Assessment of physical activity by self-report:
status, limitations, and future directions. Res Q Exerc Sport, 71(2 Suppl), S1-14.
Stackpool, C., Porcari, J., Mikat, R., Gillette, C., & Foster, C. (2014). The Accuracy of
Various Activity Trackers in Estimating Steps Taken and Energy Expenditure J
Fit Res, 3(3), 32-48.
Swartz, A. M., Strath, S. J., Bassett, D. R., Jr., O'Brien, W. L., King, G. A., & Ainsworth,
B. E. (2000). Estimation of energy expenditure using CSA accelerometers at hip
and wrist sites. Med Sci Sports Exerc, 32(9 Suppl), S450-456.
Thompson, W. R. (2014). Worldwide Survey of Fitness Trends for 2015. ACSM's Health
& Fitness Journal, 18(6), 8-17.
Tucker, W. J., Bhammar, D. M., Sawyer, B. J., Buman, M. P., & Gaesser, G. A. (2015).
Validity and reliability of Nike + Fuelband for estimating physical activity energy
expenditure. BMC Sports Sci Med Rehabil, 7, 14. doi:10.1186/s13102-015-0008-7
Tudor-Locke, C. (2002). Taking Steps toward Increased Physical Activity: Using
Pedometers To Measure and Motivate President's Council on Physical FItness
and Sports Research Digest, 3, 1-8.
Tudor-Locke, C., Brashear, M. M., Johnson, W. D., & Katzmarzyk, P. T. (2010).
Accelerometer profiles of physical activity and inactivity in normal weight,
overweight, and obese U.S. men and women. Int J Behav Nutr Phys Act, 7, 60.
43
doi:10.1186/1479-5868-7-60
Wang, Y., & Beydoun, M. A. (2007). The Obesity Epidemic in the United States—
Gender, Age, Socioeconomic, Racial/Ethnic, and Geographic Characteristics: A
Systematic Review and Meta-Regression Analysis. Epidemiologic Reviews, 29(1),
6-28. doi:10.1093/epirev/mxm007
Wang, Y., Beydoun, M. A., Liang, L., Caballero, B., & Kumanyika, S. K. (2008). Will
All Americans Become Overweight or Obese? Estimating the Progression and
Cost of the US Obesity Epidemic. Obesity, 16(10), 2323-2330.
doi:10.1038/oby.2008.351