accuracy, reliability and clinical implications of static
TRANSCRIPT

European Journal of Prosthodontics and Restorative Dentistry (2020) 28, 1–12
ejprd.org - Published by Dennis Barber Journals. Copyright ©2021 by Dennis Barber Ltd. All rights reserved.
ARTICLE IN PRESS
• • • • • • • • • • • • • • • • • • • • • • • • • • • • • • • • EJPRD
Accuracy, Reliability and Clinical Implications of Static Compared to Quantifiable Occlusal Indicators
ABSTRACTObjective: This literature review summarizes the properties, advantages, limitations,
and clinical implications of employing static occlusal indicators compared to quantifi-able digital occlusal indicators during occlusal adjustments. Method: An electronic database search of dental literature was carried out in PubMed/MEDLINE using the key words Occlusal Indicators, Occlusal Assessment, Static, Reliability, Dynamic, Repeata-bility, Validity and Clinical Accuracy. A total of 231 papers were isolated, with 129 papers considered for review. Results: The included papers were grouped by Static and Dynamic Occlusal indicators. The numbers of papers in the Static Group was extremely low (only 20 papers) compared to The Dynamic group (T-Scan: 89; Dental Prescale: 28; Intraoral Scanners:17). Conclusion: Little evidence supports the use of static occlusal indicators due to their high degree of subjectivity required during implementation. However, much scientific evidence supports the use of T-Scan, as it measures relative occlusal forces and timing objectively, accurately, and repeatedly. For the improvement of Occlusal Practice, Subjective Interpretation using Static occlusal indicators should be replaced with digital ones for objective measurements. Clinical Relevance: The computerized occlusal analysis system is well studied and has the capacity to provide precise time and force sequencing information to objectively evaluate occlusal contacts for improved treatment outcome.
INTRODUCTIONThe term “Occlusion” has been of considerable interest to dental clini-
cians and researchers alike. It is describes the contact relationship be-tween the upper and lower teeth. Evaluation of the occlusion has a long history dating back to 1681, when Borelli studied the intraoral mastication load using a mechanical ‘Gnathodynamometer’ (Brawley et al. in 1938). Since then, researchers and dental professionals continue to study how teeth intercuspate, using various occlusal indicators and devices that were invented and designed to gain more insight into the dynamic interactions between mandibular movements and the many morphological tooth-to-tooth contact interactions. These morpho-functional interactions involve all aspects of the masticatory system, namely the teeth, the periodontal tissues, the neuromuscular system, the temporomandibular joint, and the craniofacial bones.1-3 The various occlusal indicators analyze these occlusal interactions, and facilitate the making of beneficial occlusal adjustments during dental procedures.
KeywordsObjective EvaluationDigital WorkflowOcclusal AnalysisDigital Occlusal IndicatorsStatic Occlusal IndicatorsT-Scan
AuthorsSarah Qadeer * (BDS., MSD)
Mutlu Özcan § (Prof. Dr. Dr. Med. Dent., h.c., Ph.D)
Daniel Edelhoff ‡ (C.D.T., Dr. Med. Dent., Ph.D)
Hans VanPelt ^ (Dr., PhD)
Address for Correspondence Sarah Qadeer *Email: [email protected]
* Dept. of Prosthodontics & Occlusion, Faculty of Dentistry, Thammasat University Rangsit Campus, Thailand
§ University of Zürich, Division of Dental Biomaterials, Clinic for Reconstructive Dentistry, Center for Dental and Oral Medicine, Zürich, Switzerland
‡ Department of Prosthodontics, School of Dentistry, Ludwig Maximilians University, Munich, Germany
Dept. of Restorative Dentistry and Oral Function, University Medical Center, Center of Dental and Oral Care University Groningen, The Netherlands
Received: 03.09.2020 Accepted: 02.12.2020
doi: 10.1922/EJPRD_2202Qadeer12
ejprd.org - Published by Dennis Barber Journals. Copyright ©2021 by Dennis Barber Ltd. All rights reserved.
European Journal of Prosthodontics and Restorative Dentistry (2020) 28, 1–12 ARTICLE IN PRESS
• • • • • • • • • • • • • • • • • • • • • • • • • • • • • • • • • • • • Static and Quantifiable Occlusal Indicators...
Occlusal indicators can be broadly categorized into Static Occlusal Indicators and Quantifiable Occlusal Indicators. The commonly used static occlusal indicators are dental materials (articulation paper, Shim Stock foils, impression materials and occlusal wax sheets), who’s contact selections during occlusal adjustments are based on each material’s differing physical properties and intraoral appearance characteristics. Static indicators are placed between opposing teeth to imprint, or mark with color, the occlusal contact locations and their con-tact area, which is defined by each material’s thickness and flexibility. To choose contacts for occlusal adjustment, the mark size and mark color intensity, or the imprint depression depth, is subjectively judged for force levels by the operator interpreting the markings or imprints, which is combined with patient verbal feel feedback about where perceived high points exist in their occlusion.4 Quantifiable Occlusal Indica-tors on the other hand, have the capacity to record and display the registration of the occlusal contact relative force levels per tooth, and sequence the differing contacts’ timing vari-ant when a patient makes a closure movement into Maximum Intercuspation (MIP), or when excursing laterally or protrusively.
Occlusal Adjustment is defined by Bulter5 as being a modifi-cation on the tooth surfaces, in order to attain a harmonious, stable relationship between opposing contacting surfaces. Occlusal adjustments are performed on both maxillary and mandibular teeth, by selectively grinding off tooth material to establish (in theory) simultaneous occlusal contacts in clo-sure, and ensure there are no interfering contacts present during mandibular excursions.6,7 Although widely performed throughout dental practice when delivering crowns and den-tal implant prostheses, some authors have opined that occlus-al adjustment procedures made to natural teeth are invasive and irreversible.8
The registration of the occlusion for dentate patients is an essential element of everyday clinical practice. Making a reli-able occlusal diagnosis is crucial to remedying the patient’s in-dividual occlusal issues with appropriate occlusal adjustment procedures.9 Yet, it is surprising that occlusal evaluations are normally carried out as an afterthought to many clinical pro-cedures, where the materials and techniques used have not been the subject of extensive research.10
The Specific Aims of this review paper are to answer the fo-cus question, “what is the Accuracy, Reliability and Clinical Im-plications of using Static Occlusal indicators when compared to using Quantifiable Occlusal Indicators?” To that end, this ar-ticle reviews the advantages and limitations of the commonly employed differing static and quantifiable occlusal indicators that are used when refining the occlusion.
MATERIAL AND METHOD
SEARCH STRATEGYAn electronic database search of the English language den-
tal literature without restrictions was carried out in PubMed/MEDLINE, using the Key Words Occlusal Indicators, Occlusal Assessment, Static, Reliability, Dynamic, Repeatability, Validity and Clinical Accuracy, with all fields in each search term being considered. A total of 231 papers were located, out of which 129 papers were considered for this review.
The inclusion criteria were to select studies involving any static or dynamic occlusal indicators that pertained to:
• Making an occlusal diagnosis,
• Testing occlusal treatment outcomes with any static occlusal indicator, the T-Scan system, or the Dental Prescale system
• Evaluating the characteristics, properties, sensitivity, ac-curacy, and reliability of the occlusal indicators when used individually, or in combination.
The exclusion criteria were to eliminate studies that did not:
• Pertain to the accuracy or reliability of the occlusal in-dicators
• Relate to the focus question despite appearing within the search (e.g. The accuracy of virtual interocclusal reg-istration during intraoral scanning),
• Describe the methodology or technique of how specifi-cally, the occlusal registration materials or differing in-dicators were used in the study (for example; Bite force and occlusal load distribution in normal complete denti-tions of young adults),
• Present their Abstract in English.
The selection process grouped the papers together by whether they were about Static or Dynamic Occlusal Indica-tors. Under the Dynamic Indicators category there were 6 subgroups of papers:
1. T-Scan (89 papers)
2. Dental Prescale (28 papers)
3. Gnathodynanometer (4 papers),
4. Fiber Bregg Grating Bite Force Recording (1 paper)
5. Electrognathography System (1 paper)
6. Intraoral Scanners (17 papers)
The numbers of papers in the literature describing the Static Group was surprisingly low (only 20 papers total), indicating that, although they are commonly employed, static materials have been minimally studied for their use accuracy.
P2

ejprd.org - Published by Dennis Barber Journals. Copyright ©2021 by Dennis Barber Ltd. All rights reserved.
European Journal of Prosthodontics and Restorative Dentistry (2020) 28, 1–12ARTICLE IN PRESS
• • • • • • • • • • • • • • • • • • • • • • • • • • • • • • • • • • • • • • • • • • • • • • • • • • • • • • • • •EJPRD
Under the Static Indicators category there were also 6 sub-groups of papers:
1. Articulating paper (8 papers)
2. Optical Silicone Registration material (2 papers)
3. Accufilm articulating Mylar film (3 papers)
4. High Viscosity Polysiloxane moulding material (1 paper)
5. Shim Stock and silk ribbon (3 papers)
6. occlusal waxes (3 papers).
STATIC OCCLUSAL INDICATORSStatic Occlusal indicators are used to determine the occlusal
contact locations, and/or for recording and transferring a pa-tient’s interocclusal relationship onto an articulator (Figure 1). Some static indicators can be used in the fabrication of dental prostheses, by placing them between opposing teeth to im-print the maxillomandibular relationship, or mark occlusal surfaces with colored inks to subjectively determine contact forces, which is often combined with the patient’s verbal feel feedback to help guide a dentist in making occlusal adjustments.
Use of these Occlusal Indicators to determine the occlusal contact areas, or detect locations of supposedly heavy contact points in the occlusion, is based on their displayed appear-ance characteristics and of their physical properties (viscosity, elasticity, volumetric shrinkage, distortion, and crumpling).4
The residual ink mark left on the tooth, or the imprint of the occlusal surface morphology in silicone or wax, is subjectively interpreted by the clinician to judge the amount of occlusal
force associated with the color-depth of the ink mark, the size of the ink mark, or the shape and depth of the imprint. What is surprising is that dentists routinely use these materials as if they measure occlusal forces in some way by their appear-ance characteristics, despite that none of these materials have any true force measurement descriptive capacity. Therefore, in reality, the static method used for occlusal adjustment pro-cedures, although widespread in Dental Medicine, lacks sci-entific evidence that correlates wax or impression material imprints, or the depth, color, or size of an articulating paper mark to actual measured amounts of applied occlusal force. This method has been proved to be highly error prone and frequently results in poor occlusal contact choices.11,12,13
Commonly used Static occlusal indicators are:
• Articulation paper strips – the strip leaves ink marks on the teeth where occlusal contact exists.14
• Shimstock foils - are tugged and pulled out from be-tween occluding teeth to detect “withdrawal resistance” that supposedly indicates differing levels of forceful or non-forceful occlusal contacts.15,16
• Occlusal wax sheets - are softened and then imprinted by opposing teeth. Wax perforations or apparent wax thinness indicate occlusal contact or near contact.17,18
• Elastomeric impression materials – these materials are injected between opposing teeth to locate occlusal con-tacts. It is believed where the impression material is dis-placed completely, tooth contact is present.19
Figure 1: The Static Occlusal Indicators; articulation paper strips, shim stock foil, elastomeric impression materials (syringe mixed, and hand mixed), and occlusal wax sheets
P3

ejprd.org - Published by Dennis Barber Journals. Copyright ©2021 by Dennis Barber Ltd. All rights reserved.
European Journal of Prosthodontics and Restorative Dentistry (2020) 28, 1–12 ARTICLE IN PRESS
• • • • • • • • • • • • • • • • • • • • • • • • • • • • • • • • • • • • Static and Quantifiable Occlusal Indicators...
THE LIMITATIONS OF COMMONLY USED STATIC OCCLUSAL INDICATORS
Articulation paper Articulating papers are used to detect high force contacts,
whereby the width, thickness, and dye type of the articulating paper leave a mark where contact exits.20 Articulating paper is a widely accepted occlusal indicator that supposedly locates forceful tooth contacts, despite that no scientific evidence shows ink spots measure differing occlusal force levels by their size or color depth. The clinical use of articulating paper relies on the unproven and non-scientific concepts that larg-er and darker marks are considered to be forceful contacts, while lighter marks and smaller marks supposedly indicate less forceful contacts. Despite no correlation exists between mark size and occlusal load,21-23 some textbooks on occlusion still incorrectly advocate that mark size is representative of the load contained within the mark.24-26
The disadvantages of articulating papers are that the strips and ink can be affected by saliva, the differing strips vary in thickness and often have an inflexible base material, whereby all of these factors contribute to a greater number of pseudo (false positive) contact markings.20 Articulation paper when used intraorally is subject to fragmentation, perforation, and ongoing ink loss during intercuspation, as the patient repeated-ly taps thru the same strip multiple times. This means the sub-strate loses marking material each time a patient intercuspates into the strip, limiting the strip’s repetitive marking capability.
An in vitro study tested various occlusal indicators (articulat-ing papers, foils, silk strips, and the T-Scan I system) to ex-amine the loss of sensitivity of the recording materials when interposed between articulated maxillary and mandibular dentate casts, that were loaded with 3 consecutive intercus-pations by a universal testing machine. The differences in the contact points made on the test models by each of the re-cording materials were evaluated visually for consistency. The authors concluded that multiple uses of the same recording material led to decreased sensitivity of all the recording ma-terials, and that material degradation could lead a clinician to make an inaccurate occlusal analysis. Because of the material degradation and to minimize any affects from saliva, the au-thors recommended using the tested indicators only once.27
Several studies looked at the relationship between articulat-ing mark size and the occlusal force levels contained within the same contacts denoted by the ink marks, by measuring the contacts with the T-Scan 9/10 technology.11-13 The differing stud-ies all showed that choosing high force or low force occlusal contacts by contact size and color depth was highly error prone (87% - 95% inaccurate), and that using the quantifiable T-Scan occlusal analysis removed the inaccurate operator subjectivity from the contact selection decision-making process.
Shim Stock Foils Shim Stock is an 8µm wide metallic polyester-film that is an-
tistatic and tear resistant. It is used by the clinician to evaluat-ed the interproximal contact points during the fitting of fixed dental prostheses, or for (supposedly) determining occlusal force levels when withdrawing it from between two occlud-ed teeth. Forceful occlusal contact selection is based on an operator’s “resistance feel” when pulling the Shim Stock out from opposing occluded teeth.4 A high degree of subjectivity is involved in its use because a clinician must interpret contact “hold” resistance levels, as the film is tugged on from the buc-cal aspect of intercuspated teeth. Further, Shim Stock itself does not mark teeth, and so after the contact hold strength is subjectively determined, articulating paper is still required to (supposedly) locate the most forceful contact that “held” the Shim Stock. Both Shim Stock “hold” and visually observing ar-ticulating paper markings for occlusal contact force levels are highly subjective,28 and both occlusal indicator methods are absent of any true force measurement capability. Shim Stock has not scientifically demonstrated any ability to sequence occlusal contact timing order, or quantify differing occlusal contact force levels.
Within the literature, Shim Stock has been tested in very few studies that attempted to determine its’ use accuracy, yet it is commonly used in daily dental practice. In one study where Shim Stock was “pulled out” from between a tooth and a restorative material specimen, the authors concluded that interpreting contact “hold” resistance levels were subjective and unreliable.29 Another study that recorded the marking patterns of four foils, six articulating paper materials, and four silk ribbons that were all imprinted at different pressures onto differing surface morphologies, reported that foils as a group were the thinnest indicator materials, and reported more ac-curate contact marking patterns than did articulating paper and silk.30 However, under smaller loads the ink-impregnated foil marking capacity was questionable. The authors also re-ported the more intensive marking papers with less base ma-terial flexibility, and the thicker types of silk ribbons, led to a greater numbers of false positive contact markings.30
Occlusal Waxes Occlusal Wax is used in clinical dentistry to:
• Determine static occlusal relationships during intercus-pation
• Determine initial occlusal contacts and track excursive guidance contacts
• Evaluate tooth mobility
• For transferring interocclusal records
When using Occlusal Wax, a torn, perforated, indented, or translucent area has been advocated to signify a definitive oc-clusal contact. However, it has been reported that frequently the wax may not perforate to signify areas of true occlusal
P4

ejprd.org - Published by Dennis Barber Journals. Copyright ©2021 by Dennis Barber Ltd. All rights reserved.
European Journal of Prosthodontics and Restorative Dentistry (2020) 28, 1–12ARTICLE IN PRESS
• • • • • • • • • • • • • • • • • • • • • • • • • • • • • • • • • • • • • • • • • • • • • • • • • • • • • • • • •EJPRD
contact due to variations in patient applied closing pres-sure.31,32 Like Shim Stock and articulating paper, determining force levels from wax imprint shapes and degrees of perfora-tion is highly subjective, lacks any true force measurement, and is largely based on a clinician’s judgement.
Within the literature, Occlusal Wax has been tested in very few studies that attempted to determine its’ use accuracy. Yet it is also commonly used in daily dental practice. In 2004, a study evaluated the physical properties of several interocclus-al recording materials. It was concluded that wax flow largely depended on
1. wax temperature,
2. the applied occlusal force used when occluding into the wax wafer,
3. the duration of the force application, and
4. the wax setting time.31,32
The authors from another study stated that, “thermoplastic waxes have many advantages; they are quick, easy and inex-pensive to use. In addition, they can be checked and modi-fied in the mouth”. However, distortion of the wax at different temperatures and during transport, incomplete and uneven softening, and the inconvenience of prewarming wafers were described as some of the drawbacks of occlusal wax.33,34
Because of its physical properties, occlusal wax is far better suited for capturing interocclusal records than it is for assess-ing differing occlusal contact force levels. No study to date has shown that Occlusal Wax can quantify occlusal contact force levels in any way, despite the (incorrectly) advocated belief that the size and depth of a wax imprints does indicate the ap-plied load. Actually, the size of a wax hole or near perforation only indicates the possible contact area, but describes nothing about the applied load or the contact timing order. More im-portantly, no significant scientific literature published in the last decade could be found that validated the use of Occlusal Wax as being a reliable occlusal indicator.
Silicone Impression Materials Polyvinyl Siloxane (PVS) impression material was introduced
in the 1970s for the purpose of recording and transferring intraoral records to the laboratory. While these materials do demonstrate accurate intraoral structure replication, successful clinical results as an interocclusal registration material depends upon the clinician managing their dimensional instability, their volumetric shrinkage, their tear strength, their elastic recovery, flowability, wetability, and their hydrophilicity.4 However, no studies exist that illustrate the size characteristics of silicone imprints, and perforations through the material describe ap-plied occlusal forces or describe the contact timing order. Like Occlusal Wax, holes and near perforations in Polyvinyl Siloxane (PVS) only indicate the possible occlusal contact area.
When making impressions, PVS is not susceptible to syner-esis or imbibition, and its stiffness helps to force the light-bod-ied putty into close contact with the teeth.35 Silicone impres-sion materials create more accurate impressions than does alginate when used to make diagnostic models, and when fabricating custom impression trays. The combination of a rigid, fast-setting polyvinyl siloxane bite registration paste and a disposable closed-mouth impression tray, enhances patient comfort during impression making while simultaneously ena-bling the dentist to reliably record habitual centric occlusion, the prepared tooth or teeth, and the opposing arch.36
Chai et. al.,37 tested nine commercially available impression pastes for their surface hardness and rheological properties (1 zinc oxide eugenol paste; 7 polyvinyl siloxane pastes; 1 polyether paste), and concluded that the materials tested had adequate immediate surface hardness, with some materials becoming harder at 24 hours. The 9 differing elastomeric ma-terials showed wide variations in hardness, and demonstrated variable times to achieve that hardness, which were depend-ent on each material’s individual properties.
The minimal dental literature surrounding the use of the aforementioned group of static occlusal indicating materials to assess occlusal function, gives rise to major questions in regards to their force detection capacity, their accuracy re-sultant from their physical properties and individual handling characteristics, and most importantly, the high degree of op-erator subjectivity employed with their clinical implementa-tion. Research performed in vitro or in vivo to support the use of this group of particular materials as indicators of occlusal function, is non-existent.10
Quantifiable Occlusal IndicatorsQuantifiable Occlusal indicators have been developed that
overcome the limitations and subjectivity of the static occlusal indicators. The Dental Prescale system (Dental Prescale, Fuji Film Co., Tokyo, Japan), the Photoocclusion Technique, and the T-Scan system (current version T-Scan 10; Tekscan, Inc. S. Boston, MA, USA), are the most used and the most researched quantifiable systems for determining occlusal relation-ships.9,38,39,40,41 These quantifiable occlusal analysis systems in-corporate advanced technology to detect and display occlusal force data to a clinician. In addition to measuring 256 levels of relative occlusal force, the T-Scan system also comprehen-sively can record and display time variants in fractions of seconds, that describe the closure occlusal contact sequence and any excursive movement time durations, while differing occlusal forces change on individual teeth around the entire dental arch.
Dental Prescale System The Dental Prescale System is a pressure-sheet based occlusal
analysis system developed in 1981 for the measurement and analysis of bite force (N), occlusal contact area (mm2), and bite pressure (MPa). It consists of 98 mm (0.1 mm) thick, pressure-
P5

ejprd.org - Published by Dennis Barber Journals. Copyright ©2021 by Dennis Barber Ltd. All rights reserved.
European Journal of Prosthodontics and Restorative Dentistry (2020) 28, 1–12 ARTICLE IN PRESS
• • • • • • • • • • • • • • • • • • • • • • • • • • • • • • • • • • • • Static and Quantifiable Occlusal Indicators...
sensitive, horse-shoe shaped film sheets, and a companion color image scanner analyzer (Occluzer FPD703; GC Corp., To-kyo, Japan). The patient occludes onto a single film sheet for 10 - 20 seconds, that has embedded in its matrix colored mi-crocapsules that are coated with a polyethylene-teraphthalate resin (PTE), and are filled with color-producing ingredients (Figure 2). When the film sheet is subjected to occlusal load-ing as teeth compress its matrix, different colors form on the sheet depending on the differing microcapsule densities. The colored areas of the film are then inspected under polariscope light within the Occluzer FPD703, to determine differing relative tooth contact occlusal force intensities.41,42
The literature search yielded 31 relevant publications that tested the Dental Prescale system’s reliability, validity, and reproducibility, alone or in conjunction with other occlusal in-dicators.43-47 Hattori et. al., evaluated the occlusal force meas-urement reliability of Dental Prescale on both a patient and on casts. The author found a linear relationship existed be-tween the applied load and the Prescale reported loads, and stated that Prescale was not influenced by the subjectivity and experience of practitioners.48 Another study by Noguchi et al., suggested that the film sheet is unaffected by intraoral hu-midity and temperature.49 Suzuki et al., found no statistical difference in color forming between the sheets compressed for 1 second or 5 seconds. But when compressed for 10 sec-onds, the film sheets showed higher color formation than did the sheets that were compressed for 1 second. The authors reported that the velocity and duration of the force applied had a negligible effect on the color formation.49 Suzuki in a different evaluation of the efficacy of Prescale, concluded that Prescale was capable of measuring occlusal pressure at every contact point, and should be considered a useful method for occlusal analysis and patient screening.50 The existing litera-ture shows that Prescale is a suitable tool for the assessment of occlusal contact area and bite force, which can also be used to evaluate the results of performed occlusal treatment.51
The reported limitations of the Dental Prescale system are at-tributed to the thickness and rigidity of the inflexible pressure sensitive sheet, where an over-detection of the occlusal con-tact areas and the bite forces in the posterior teeth can occur, which diminishes towards the anterior region.52-54 Investiga-tors have also concluded that the photo-occlusion method is a complicated technique,9,55 which is time consuming because of the need to photo-evaluate the film sheet within the Oc-cluzer following patient compression. A few studies reported that the Prescale method is not highly reproducible.55-57 Clini-cally, the measurements made with a pressure-sensitive sheet can be affected by masticatory muscle strength or weakness, and by the pre-existing dental and occlusal conditions.58,59
And, when compared to the T-Scan System, the Prescale sys-tem lacks time quantification and contact time-sequencing capacity, which are also drawbacks.
T-Scan Computerized Occlusal Analysis System(s)The original T-Scan I computerized occlusal analysis system
was manufactured in 1984 by Tekscan, Inc. (South Boston, MA, USA), in collaboration with Professor William L. Maness and engineers from the Massachusetts Institute of Technology.60
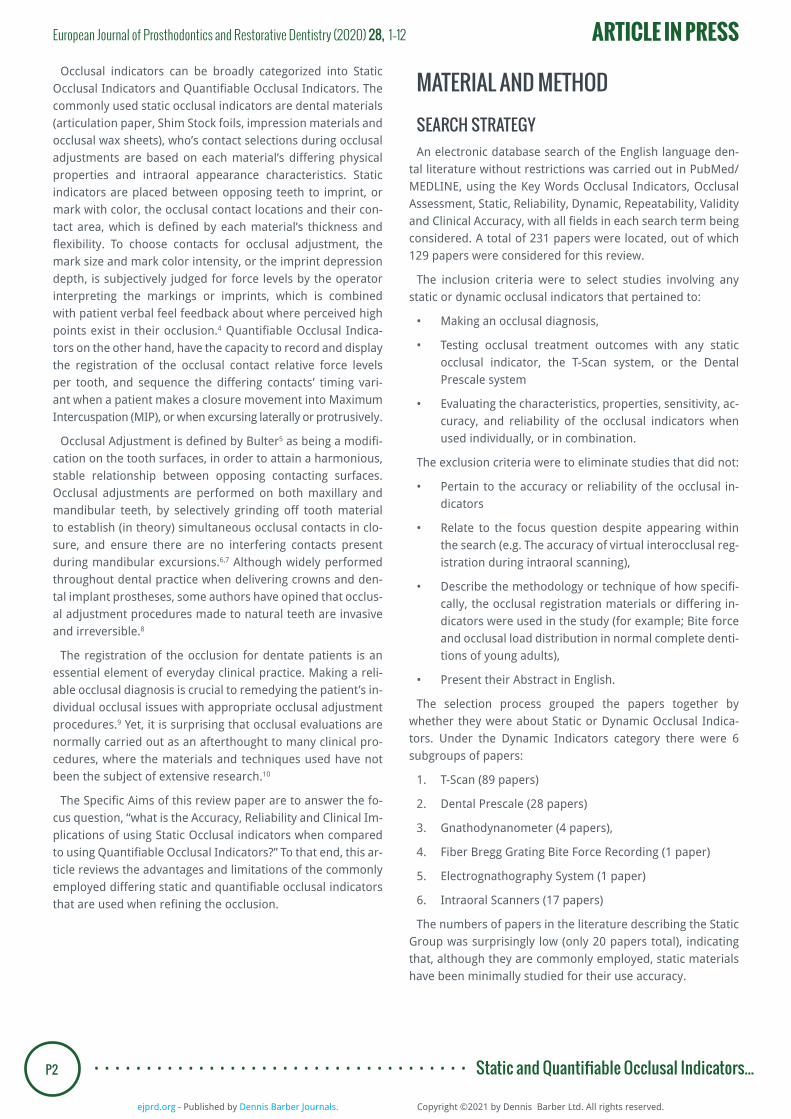
The T-Scan system consists of a recording handle that con-nects to a laptop or a Windows-based PC with a USB connec-tion, in which sits an arch-shaped Mylar-encased pressure measuring sensor (Novus High Definition (HD) Sensor; Teks-can Inc. S. Boston, MA, USA), that fits between a patient’s oc-cluding teeth (Figure 3). The High Definition (HD) recording sensor comes in 2 sizes (large with 2,200 sensel force measur-ers; small with 1,500 sensel force measurers). The sensels are compressible, electronically resistive receptor points, aligned in an x-y grid that is surrounded by conductive ink.
When the patient occludes upon an HD sensor, the opposing teeth make approximating contact and compress together the upper and lower sensor surfaces, which results in a change in the resistance in each of the contacted sensels. These resistance changes are then measured by the T-Scan’s hardware electron-ics as a change in Digital Output Voltage (DO).9,38,57,60-62 Higher applied contact force produce larger resistance changes, and lower occlusal contact force produces lesser resistance chang-es. 256 relative occlusal force levels that result from these dif-fering resistance changes caused by the compression of the differing occlusal contacts, are recorded by the T-Scan system in real-time increments of 0.003 seconds. The T-Scan 10 soft-ware then presents for diagnosis and treatment, this time and force data in a multi-colored 2 and 3-Dimensional graphical desktop display. The recorded variable digital output voltage force data can be played forwards and backwards continu-ously, or frame-by-frame, to make an occlusal diagnosis.62
The proper T-Scan clinical method involves using T-Scan initially to record the occlusal force levels, determine the occlusal balance, determine the contact timing order of intercuspation, and determine the time duration posterior teeth are involved in lateral excursions, and then to combine
Figure 2: Dental Prescale wax sheets are layered with embedded polyethylene-teraphthalate (PTE) resin coated microcapsules that are filled with color-producing ingredients that are released under applied occlusal pressure.
P6
ejprd.org - Published by Dennis Barber Journals. Copyright ©2021 by Dennis Barber Ltd. All rights reserved.
European Journal of Prosthodontics and Restorative Dentistry (2020) 28, 1–12ARTICLE IN PRESS
• • • • • • • • • • • • • • • • • • • • • • • • • • • • • • • • • • • • • • • • • • • • • • • • • • • • • • • • •EJPRD
that occlusal data with the marking of teeth with thin articulating paper (Accufilm 23 micron, Parkell, Inc., Farmingdale, NY, USA), to isolate the data-determined problem contacts. Because the T-Scan sensor does not mark the teeth, thin articulating paper is required to make targeted occlusal adjustments of the problem contacts, where only the data-determined problem contacts are adjusted, regardless of the appearance characteristics of the neighboring articulating paper marks. In this combined method, all healthy low force occlusal contacts are left untreated, which dramatically improves the outcomes of any T-Scan guided occlusal adjustment procedure.
The T-Scan system has been the most researched of all the occlusal indicators since its inception, when the earliest publi-cation about T-Scan I system appeared in the dental literature in 1987.38 The search criteria revealed that the differing T-Scan versions have been referenced in many papers, yielding a total of 89 relevant papers about the T-Scan’s reliability, re-producibility, and its clinical applications involving repetitive occlusal function measurements.9,39,57,60,63-94 These 89 T-Scan studies are comprised of both relative force measurement papers and time sequence and time quantification papers, because the T-Scan is the only occlusal indicator that records and measures both of these occlusal contact parameters.
Occlusal Force Measurement PapersPatyk tested the diagnostic validity of the T-Scan I system
on 16 patients, and reported the T-Scan I system was a valu-able tool for the education of both students and patients, not-ing that the on-screen color display of occlusal mechanisms was impressive. However, the authors also found the T-Scan I Epoxy-based sensor was thick and somewhat inflexible, that could create an uncontrollable shift of the mandible during the recording of intercuspation, resulting in a misleading re-production of some occlusal contacts.67, Harvey, Hatch, and Osborne also found the original T-Scan I sensor was inflex-ible, requiring increasing patient effort to compress and reg-ister increased force level jumps within the columnar force display.39 Differently, another study that evaluated the repro-ducibility of the T-Scan II system when measuring occlusal contacts, reported that the T-Scan II showed acceptable re-producibility.65 However, both the T-Scan I and T-Scan II are no longer commercially available, and the original T-Scan I and II epoxy-based recording sensors were vastly different in composition, thickness, flexibility, and accuracy, compared to today’s T-Scan 10 High Definition (HD) Novus Mylar-encased, electronic printed circuit sensors.
The High Definition (HD) sensor design (developed with T-Scan version III) increased the sensor’s active recording area by 33%, and decreased the inactive (non-recording area) area
Figure 3: The T-Scan 10 Novus recording handle loaded with a Novus HD sensor, that is connected via USB to the T-scan 10’s companion, color-coded force and timing software
P7

ejprd.org - Published by Dennis Barber Journals. Copyright ©2021 by Dennis Barber Ltd. All rights reserved.
European Journal of Prosthodontics and Restorative Dentistry (2020) 28, 1–12 ARTICLE IN PRESS
• • • • • • • • • • • • • • • • • • • • • • • • • • • • • • • • • • • • Static and Quantifiable Occlusal Indicators...
by 50% compared to earlier sensor designs, by packing the recording sensels much closer together.72 The HD configura-tion reduces the likelihood that the T-Scan sensor would miss an occlusal contact because a contact might land between sensels. Subsequent to the development of the HD sensor, an in vitro sensor analysis showed the HD sensor design could repeatedly measure multiple differing occlusal force levels, in multiple locations on the same sensor all at the same time, for up to 20 uses after 4 test intercuspations conditioned the sensor to report linear force reproduction.72
Koos in 2010 evaluated the precision of the T-Scan III meth-od of occlusal analysis, and found that neither changing the HD sensor with the same subject, nor repeatedly measuring each subject with the same sensor, had any statistically sig-nificant influence on the consistency of the measured output values. The authors reported the T-Scan III demonstrated 95% force reproduction capability using up to 5 different sensors per subject, indicating that the system demonstrated a high degree of repeatable occlusal force measurement. Koos also suggested that the T-Scan system could reliably identify the occlusal contacts, and clearly depict the critical nature of the distribution of occlusal force.68
Some of the reported limitations of T-Scan system are at-tributed to distortion of the sensor that could lead to meas-urement error.67 However, this criticism was made about the T-Scan I epoxy-based sensor before the Mylar-encased HD sensor design was developed. Clinically, linear force repro-duction is achieved by making the 4 test intercuspations to adapt the sensor to the occlusal anatomy.68,72,75 Another au-thor who cut the T-Scan sensor in half to use it like articulating paper (thereby rendering the sensor inoperable), incorrectly opined that the thickness of the T-Scan sensor may affect the sEMG activity of masticatory muscle during occlusion.70 This supposed criticism has been countered many times over, as in the literature there are numerous research papers where the T-Scan HD sensor recorded occlusal force and timing data simultaneously with surface EMG data, such that T-Scan sen-sor does not affect the gathering of very high-quality electro-myography data.77-88
The most common critical statements made by authors stud-ying the T-Scan systems was to question the T-Scan’s abilities to provide accurate occlusal contact force and timing data, be-cause the HD recording sensor thickness is 100µm. This thick-ness is well within the range of many commonly used static interarch occlusal indicators (Occlusal Wax, Prescale wax sheets, and some articulating papers) that are not questioned for their accuracy, even when research shows articulating pa-per, wax, and silicone are inaccurate, are highly subjective to use, and have no force level measurement or time-measure-ment descriptive capabilities.21-23,28 The 100µm T-Scan sensor thickness is a positive sensor attribute, as it houses and pro-tects sophisticated printed electronic components within a flexible and compressible Mylar substrate. The HD sensor has been shown in both research and clinical papers to continuously
report force and timing data when used repeatedly, without sustaining significant sensor damage breakdown from in-tercuspating teeth.72,77-88 The 2006 force reproduction study clearly showed the 100µm sensor thickness was not a factor that influenced the HD sensor’s ability to repeatedly and con-sistently report multiple relative occlusal force levels on 30 differing HD sensors.72 To date, no “frequent sensor perfora-tion” has been reported as a consistent problem when record-ing with the T-Scan HD sensor.
Validity studies of the T-Scan HD sensor were performed in 2006,72 2010,68 2012,74 and by De Silva Martins in 2014.75 These studies indicate that the HD sensor can repeatedly measure dif-fering relative occlusal contact force levels in multiple locations simultaneously within the dental arch. To date, no published paper has disproved the validity of the T-Scan HD sensor.
Timing Measurement PapersA significant volume of clinical T-Scan research involves T-
Scan time measurements made of closure contact sequence timing, and of excursive movement Disclusion Time dura-tions.77-92 Recordings acquired in turbo mode (in 0.003 sec-onds/frame), allow a clinician to visualize individual contact force changes on transitory occlusal contacts, as they occur in fractions of seconds. At least 3 studies evaluated the timing ac-curacy of the T-Scan system, in which the T-Scan demonstrated a high degree of time-measurement consistentency.74,92,93 In one sensor evaluation it was reported that the T-Scan system showed high degree of validity when measuring time.93 This is important because many T-Scan-based clinical procedures are accomplished by reducing closure sequence timing durations, and prolonged excursive movement Disclusion Time dura-tions.77-92 In these many time-based treatment studies, many differing T-Scan HD sensors were used, different treating clini-cians performed the research, which took place in different research settings, with many differing groups of patients and controls. The collective studies results repeatedly showed that multiple researchers were individually able to success-fully treat Occlusal-muscle Dysfunction to very high and simi-lar numerical tolerances, using the T-Scan-guided, time-based coronoplasty known as Immediate Complete Anterior Guid-ance Development (ICAGD).77-92
Several other studies compared articulation paper marks to T-Scan data, which found the T-Scan to be a reliable guide for selecting tooth contacts for occlusal adjustment. The authors reported T-Scan provided more comprehensive and evidence-based results that lack the subjectivity inherent in using non-digital, static occlusal indicators.11-13,61,94 However, many clini-cians consider the increased chair-time required to obtain a high quality T-Scan recording for performing a computer-guided occlusal adjustment procedure, as a challenge.9 The T-Scan learning curve involves choosing appropriate sensitivity settings, orally guiding the patient through the needed man-dibular movements with the sensor interposed between their teeth, and observing the screen to follow the Center of Force
P8

ejprd.org - Published by Dennis Barber Journals. Copyright ©2021 by Dennis Barber Ltd. All rights reserved.
European Journal of Prosthodontics and Restorative Dentistry (2020) 28, 1–12ARTICLE IN PRESS
• • • • • • • • • • • • • • • • • • • • • • • • • • • • • • • • • • • • • • • • • • • • • • • • • • • • • • • • •EJPRD
Trajectory as it moves around the T-Scan dental arch during patient data acquisition. While some clinicians may feel that operating the T-Scan with patients may be time-consuming, the increased chair-time allows for completion of occlusal adjustments objectively, to measured physiologic force and timing numerical endpoints.79 This computer-guided method is far more accurate than when the non-digital indicators are used subjectively.94 The T-Scan guided contact selection meth-od greatly lessens multiple follow-up visits that are common with static occlusal indicators, because the latter method is often poorly impacted by the clinician’s subjective judgement to differentiate forceful from non-forceful contacts.9,11-13
DISCUSSIONOcclusal adjustments are an essential element of everyday
clinical practice. However, despite the volume of literature available relating occlusion and its importance to oral health, non-digital techniques are commonly used to record the oc-clusion, and the materials used for selecting contacts during occlusal adjustment procedures have not been proven reli-able. The ongoing widespread (incorrect) belief in their (non-existent) force descriptive capacity has not stood the test of time.10 Based on this detailed literature search, little scientific evidence is available to support that dental educators con-tinue to (falsely) advocate the accuracy and reliability of the commonly used static occlusal indicators.
Studies consistently show that static occlusal indicators only indicate the contact size or location, based on the specific in-dicator’s physical properties, its appearance characteristics, which is influenced by a clinician’s subjective interpretation that lacks objective force measurement. Importantly, clini-cian contact selection studies clearly show that the subjec-tive interpretation of paper mark depth and size leads to a high percentage of incorrect contact selections (87.5% - 95.5% incorrect). Use of these subjective, inaccurate, and more in-vasive static occlusal indicators can directly lead to occlusal adjustment complications, the removal of unwarranted tooth material, thinned enamel tooth sensitivity, weakened tooth structure and weakened dental materials, the destabilizing of a patient’s occlusal contact comfort level, and triggering the onset of TMD symptoms.4,61
The quantifiable occlusal analysis systems are a superior alternative to the conventional static occlusal indicators that require a high degree of inaccurate subjectivity to employ. Dental Prescale provides the clinician occlusal pressure data that is not possible to gather with any static occlusal indicator, but Prescale lacks time quantification, and to date, no clinical applications or treatment protocols have been developed for Dental Prescale, where a dentist could apply its’ data in spe-cific, known ways to teeth or dental implants, and predictably improve a dental occlusion. Alternatively, the T-Scan Comput-erized occlusal analysis technology is superior in that T-Scan provides both occlusal force and timing data, objectively.
There is significant scientific evidence in dental literature il-lustrating that the T-Scan Occlusal Analysis technology is ac-curate, repeatable, and has many clinical applications in many disciplines of Dental Medicine. The T-Scan has the capacity to readily detect occlusal force imbalances, pinpoint forceful contacts during closure into Maximum Intercuspation and during excursive movements, assist in performing precise and targeted occlusal diagnoses and corrective adjustments, en-hance doctor-patient communication, and minimize occlusal complications by yielding predictable, numerically measured treatment outcomes.
CONCLUSIONThe improvement of the future occlusal practice warrants
that the subjective interpretation of static occlusal indicators be replaced with technology based, objective occlusal meas-urements. In this new era of digital dentistry and the Digital Workflow, patients are being treated with precision metrics. Dental Medicine should accept that subjective interpretation of static occlusal indicators is not accurate and does not measure anything occlusal, and instead should adopt the occlusal objec-tivity provided to clinicians by computerized occlusal analysis.
DISCLAIMER STATEMENTSContributors – Conceptualization: SQ., HvP.; Methodology:
SQ., HvP.; Validation: SQ., HvP.; Data curation: SQ., HvP.; Writ-ing-original draft preparation: SQ., HvP, D.E., M.Ö.; Writing-review and editing: SQ., HvP, D.E., M.Ö.;
All authors have read and agreed to the submitted version of the manuscript.
The 1st author is a longtime researcher and speaker about the T-Scan Occlusal Analysis Technology.
Funding: None
Ethics approval: Not applicable
Conflicts of Interest: None
REFERENCES 1. Rues S, Schindler HJ, Turp JC, Schweizerhof K, Lenz J. Motor behavior
of the jaw muscles during different clenching levels. Eur J Oral Sci. 2008;116:223–8.
2. Dickerson WG, Chan CA, Carlson J. The human stomatognathic system: a scientific approach to occlusion. Dent Today. 2001;20:100–2, 104–7.
3. Kois JC, Phillips KM. Occlusal vertical dimension: alteration concerns. Compend Contin Educ Dent. 1997;18:1169–74, 1176–7; quiz 1180.
4. Qadeer S. Limitations of traditional non digital occlusal indicators when compared to T-Scan computerized occlusal analysis. In: Kerstein RB, editor. Handbook of research: computerized occlusal analysis technology applications in dental medicine. Vol. 1. Hershey (PA): IGI Global; 2015; 36–65.
5. Bulter JH. Occlusal adjustment. Dent Digest 1970;76:422-6.
P9

ejprd.org - Published by Dennis Barber Journals. Copyright ©2021 by Dennis Barber Ltd. All rights reserved.
European Journal of Prosthodontics and Restorative Dentistry (2020) 28, 1–12 ARTICLE IN PRESS
• • • • • • • • • • • • • • • • • • • • • • • • • • • • • • • • • • • • Static and Quantifiable Occlusal Indicators...
6. Gray HS. Occlusal adjustment: principles and practice. New Zealand Dent J 1994;90:13-9.
7. Lima AF, Cavalcanti AN, Martins LR, Marchi GM. Occlusal interferenc-es. How can this concept influence the clinical practice? Eur J Dent. 2010;4:487-91.
8. Barbosa G, Badaró Filho C, Fonseca R, et al. The role of occlusion and occlusal adjust-ment on temporomandibular dysfunction. Braz J Oral Sci. 2004;3:589-594.
9. Afrashtehfar KI, Qadeer S. Computerized occlusal analysis as an alter-native occlusal indicator. Cranio. 2016;34:52–57.
10. Murray MC, Smith PW, Watts DC, et al. Occlusal registration: science or art? Int Dent J. 1999;49:41-6.
11. Sutter, B.A. A digital poll of dentists testing the accuracy of paper mark subjective interpretation, CRANIO® 2017;9:18 DOI:10.1080/08869634.2017.1362786
12. Kerstein, R.B., & Radke, J. Clinician accuracy when subjectively inter-preting articulating paper markings. Cranio 2013; 32:13-23
13. Basson E, Kerstein RB, Radke J. Ability to Correctly Select High Force Occlusal Contacts from Articulating Paper Markings. Adv Dent Tech. 2020;2:101-10.
14. Schelb E, Kaiser DA, Brukl CE. Thickness and marking characteristics of occlusal registration strips. J Prosthet Dent. 1985;54:122–6.
15. Halperin GC, Halperin AR, Norling BK. Thickness, strength, and plastic deformation of occlusal registration strips. J Prosthet Dent. 1982;48:575–8.
16. Takai A, Nakano M, Bando E, Hewlett ER. Evaluation of three occlusal examination methods used to record tooth contacts in lateral excur-sive movements. J Prosthet Dent. 1993;70:500–5.
17. De Boever JA, McCall WD, Jr, Holden S, Ash MM, Jr. Functional occlusal forces: an investigation by telemetry. J Prosthet Dent. 1978;40:326–33.
18. Breeding LC, Dixon DL, Kinderknecht KE. Accuracy of three interoc-clusal recording materials used to mount a working cast. J Prosthet Dent. 1994;71:265–70.
19. Millstein PL. An evaluation of occlusal indicator wax. J Prosthet Dent. 1985;53:570–2.
20. Panigrahi D., Satpathy A., Patil A., et al. Occlusion and occlusal indicat-ing materials. Int. J. Appl. Dent. Sci. 2015;1:23-26.
21. Qadeer, S., Kerstein, R.B., Yung-Kim, R.J., Huh, J.B., & Shin, S.W. Rela-tionship between articulation paper mark size and percentage of force measured with computerized occlusal analysis. J Adv Prosthodont. 2012;4:7-12.
22. Saad, M.N., Weiner. G., Ehrenberg, D., & Weiner, S. Effects of load and indicator type upon occlusal contact markings. J Biomed Mater Res B 2008;85:18-22.
23. Carey JP, Craig M, Kerstein RB, Radke J. Determining a relationship be-tween applied occlusal load and articulating paper mark area. Open Dent. J. 2007;1:1-7.
24. Glickman, I., & Carranza, F.A., Jr. (1979). Glickman’s Clinical Periodon-tology: Prevention, diagnosis, and treatment of periodontal disease in the practice of general dentistry. 5th ed. Philadelphia, PA: W.B. Saun-ders Co. pp. 951.
25. Kleinberg, I. (1991). Occlusion practice and assessment. Oxford (UK): Knight Publishing, pp.128.
26. Dawson, P.E. (2007). Functional Occlusion: From TMJ to Smile Design. St. Louis, MO: CV Mosby, pp. 47.
27. Saraçoğlu A, Ozpinar B. In vivo and in vitro evaluation of occlusal indi-cator sensitivity. J Prosthet Dent. 2002;88:522-6.
28. Kerstein, R.B. Articulating paper mark misconceptions and computer-ized occlusal analysis technology. Dent Implantol Update. 2008;19: 41-6.
29. Harper, K.A., & Setchell, D.A. The use of Shim-stock to assess occlusal contacts, a laboratory study. Int J Prosthodont 2002;15:347-52.
30. Reiber T, Fuhr K, Hartmann H, Leicher D. Recording pattern of occlusal indicators. I. Influence of indicator thickness, pressure, and surface morphology. Dtsch Zahnarztl Z. 1989;44:90-3.
31. Millstein, P.L. An evaluation of occlusal wax indicators. J Prosthet Dent. 1985;53:570-573.
32. Millstein, P.L., Clarke, R.E., & Kronmen, J.H. Determination of the ac-curacy of wax interocclusal registrations. Part II, J Prosthet Dent. 1973; 29:40-45.
33. Michalakis, K.X., Pissiotis, A., Anastasiadou, V., & Kapari, D. An experi-mental study on particular physical properties of several interocclusal recording media. Part II: Linear Dimensional change and accompany-ing weight change. J Prosthodont 2004;13:150-159.
34. Fattore L-D, Malone W F, Sandrick J.L., et al. Clinical evaluation of the accuracy of interocclusal recording materials. J Prosthet Dent. 1984;51:152-157
35. Patel, P.& Guni, A. A student’s guide to dental materials: first impres-sions. Retrieved December 19, 2011 part 1. http://thedentalstudent.co.uk/first-impressions_1/
36. Werrin SR. The 2-minute impression technique. Quintessence Int. 1996;27:179-81.
37. Chai J, Tan Pang I., a study of surface hardness and dimensional stabil-ity of several intermaxillary registration materials. Int J Prosthodont. 1994;7:538-542.
38. Maness WL, Benjamin M, Podoloff R, Bobick A, Golden RF. Com-puterized occlusal analysis: a new technology. Quintessence Int. 1987;18:287–92.
39. Harvey WL, Osborne JW, Hatch RA. A preliminary test of the replica-bility of a computerized occlusal analysis system. J Prosthet Dent. 1992;67:697–700.
40. Olivieri F, Kang KH, Hirayama H, Maness WL. New method for analyzing complete denture occlusion using the center of force concept: a clini-cal report. J Prosthet Dent. 1998;80:519–23.
41. Takahashi M, Takahashi F, Morita O. Evaluation of the masticatory part and the habitual chewing side by wax cube and bite force measur-ing system (dental prescale). Nihon Hotetsu Shika Gakkai Zasshi. 2008;52:513–20.
42. Suzuki T, Kumagai H, Watanabe T. et al. Evaluation of complete denture occlusal contacts using pressure-sensitive sheets. Int J Prosthodont. 1997;10:386-91.
43. Jadhao VA, Lokhande N, Habbu SG, Sewane S, Dongare S, Goyal N. Ef-ficacy of botulinum toxin in treating myofascial pain and occlusal force characteristics of masticatory muscles in bruxism. Indian J Dent Res. 2017;28:493-97.
44. Shinogaya T, Bakke M, Thomsen CE, Vilmann A, Matsumoto M. Bite force and occlusal load in healthy young subjects--a methodological study. Eur J Prosthodont Restor Dent. 2000;8:11-15.
45. Kitafusa Y. Application of “prescale” as an aid to clinical diagnosis in orthodontics. Bull Tokyo Dent Coll. 2004;45:99-108.
P10

ejprd.org - Published by Dennis Barber Journals. Copyright ©2021 by Dennis Barber Ltd. All rights reserved.
European Journal of Prosthodontics and Restorative Dentistry (2020) 28, 1–12ARTICLE IN PRESS
• • • • • • • • • • • • • • • • • • • • • • • • • • • • • • • • • • • • • • • • • • • • • • • • • • • • • • • • •EJPRD
46. Suzuki T, Kumagai H, Yoshitomi N, et al. Kokubyo Gakkai Zasshi. 1994;61:437-45.
47. Matsui Y, Ohno K, Michi K, Suzuki Y, Yamagata K. A computerized method for evaluating balance of occlusal load. J Oral Rehabil. 1996;23:530-35.
48. Hattori Y, Okugawa H, Watanabe M. Occlusal force measurement using dental Prescale. J Jpn Prosthodont Soc. 1994;38:835-41.
49. Noguchi T, Fukuda M, Taguchi S. Wrapping of occlusal Prescale for oc-clusal examination. Nihon Shishubyo Gakkai Kaishi. 1983;25:575-81. (article in Japanese)
50. Suzuki T. Watanabe T. Yoshitomi N. Evaluation of a New Measuring Sys-tem for Occlusal Force with Pressure Sensitive Sheet. J Jpn Prosthodont Soc. 1994;38:966-70 (article in Japanese)
51. Suzuki T, Kumagai H, Watanabe T, et al. Evaluation of complete denture occlusal contacts using pressure-sensitive sheets. Int J Prosthodont. 1997;10:386-91.
52. Alkan A, Bulut E, Arici S, Sato S. Evaluation of Treatments in Patients with Nocturnal Bruxism on Bite Force and Occlusal Contact Area: A preliminary report. Eur J Dent. 2008;2:276-82.
53. Yoshinori H, Chiaki S, Makoto W. Bite force distribution on dental arch during clenching. J Jpn Soc Stomatognath Funct. 1996;2:111-117.
54. Chiaki S. A study of bite force distribution on the dental arch in normal subjects. J Jpn Prosthodont Soc. 1997;41:634-44.
55. Ando K, Fuwa Y, Kurosawa M, et al. Bite force measurement system using pressure-sensitive sheet and silicone impression material. Dent Mater J. 2009;28:212-8.
56. Millstein PL. An evaluation of occlusal contact marking indicators: a de-scriptive, qualitative method. Quintessence Int Dent Dig. 1983;14:813–36
57. Fitzig S, Serfaty V, Gazit E. Photocclusion technique for simultaneous qualitative and quantitative occlusal contact registration. J Prosthet Dent. 1985;53:413–4.
58. Amsterdam M, Purdum LC, Purdum KL. The occlusalgraph: a graphic representation of photocclusion data. J Prosthet Dent. 1987;57:94–8.
59. Ohkura K, Harada K, Morishima S, Enomoto S. Changes in bite force and occlusal contact area after orthognathic surgery for correction of mandibular prognathism. Oral Surg Oral Med Oral Pathol Oral Radiol Endod. 2001;91:141-145.
60. Maness WL, Benjamin M, Podoloff R, Bobick A, Golden RF. Com-puterized occlusal analysis: a new technology. Quintessence Int. 1987;18:287–92.
61. Qadeer, S. Limitations of traditional non digital occlusal indicators when compared to T-Scan computerized occlusal analysis. In: Kerstein RB, editor. Handbook of research: computerized occlusal analysis technology applications in dental medicine. Vol. 2. Hershey (PA): IGI Global; 2019, p.55-99
62. Kerstein R.B. The evolution of T-Scan system from 1984 to present day T-Scan 10 System. In: Kerstein RB, editor. Handbook of research: com-puterized occlusal analysis technology applications in dental medicine. Vol. 2. Hershey (PA): IGI Global; 2019, p. 1-54
63. Okamoto K, Okamoto Y, Shinoda K, Tamura Y. Shoni Shikagaku Zasshi. 1990;28:975-983.
64. Garg AK. Analyzing dental occlusion for implants: Tekscan’s TScan III. Dent Implantol Update. 2007;18:65-70.
65. Garcia Cartagena A, Gonzalez Sequeros O, Garrido Garcia VC. Analysis of two methods for occlusal contact registration with the T-Scan sys-tem. J Oral Rehabil. 1997;24:426-432.
66. Girouard P. Biometrics: digital technology as a clinical aid to dental ex-amination and diagnosis. Gen Dent. 2019;67:32-36.
67. Patyk A, Lotzmann U, Scherer C, Kobes LW. Vergleichende okklusion-sanalytische Studie zur klinischen Anwendbarkeit des T-Scan Systems [Comparative analytic occlusal study of clinical use of T-scan systems]. ZWR. 1989;98:752-55.
68. Koos, B., Godt, A., Schille, C., et al. Precision of an instrumentation-based Method of Analyzing Occlusion and its Resulting Distribution of Forces in the Dental Arch. J Orofac Orthop. 2010;71:403-10.
69. Maeda Y, Ohtani T, Okada M, et al. Osaka Daigaku Shigaku Zasshi. 1989;34:378-84.
70. Forrester SE, Presswood RG, Toy AC, Pain MT. Occlusal measurement method can affect SEMG activity during occlusion. J Oral Rehabil. 2011;38:655-60.
71. Patyk A, Lotzmann U, Paula JM, Kobes LW. Ist das T-Scan-System eine diagnostisch relevante Methode zur Okklusionskontrolle? [Is the T-scan system a relevant diagnostic method for occlusal control?]. ZWR. 1989;98:686-94.
72. Harty, M., Lowe, M., Kerstein, R.B., & Radke, J. A Force reproduction analysis of two recording sensors of a computerized occlusal analysis system. CRANIO®, 2006;24:15-24.
73. Okuma K, Hirano S, Hayakawa I. Kokubyo Gakkai Zasshi. 2002;69:277-84.
74. Koos B, Höller J, Schille C, Godt A. Time-dependent analysis and repre-sentation of force distribution and occlusion contact in the masticatory cycle. J Orofac Orthop 2012; 73:204-14.
75. da Silva Martins MJ, Caramelo FJ, Ramalho da Fonseca JA, Gomes Nico-lau PM. In vitro study on the sensibility and reproducibility of the new T-Scan® III HD system. Revista Portuguesa de Estomatologia, Medici-na Dentária e Cirurgia Maxilofacial 2014;55:14-22
76. Ferrato G, Falisi G, Ierardo G, Plimeni A, Di Paolo C. Digital evaluation of occlusal forces: comparison between healthy subjects and TMD pa-tients. Annali di Stomatologia 2017;8:79-88.
77. Kerstein RB, Radke J. Average chewing pattern improvements follow-ing Disclusion Time reduction. Cranio. 2017;35:135-51. 2.
78. Kerstein RB, Wright N. Electromyographic and computer analyses of patients suffering from chronic myofascial pain-dysfunction syn-drome: before and after treatment with immediate complete anterior guidance development. J Prosthet Dent. 1991;66:677–86. 3.
79. Kerstein RB. Reducing chronic masseter and temporalis muscular hy-peractivity with computer guided occlusal adjustments. Comp Contin Ed Dent. 2010;31:530-4, 536, 538 passim.
80. Kerstein RB, Radke J. The effect of Disclusion Time reduction on maxi-mal clench muscle activity levels. Cranio®. 2006;24:156–65. 10.
81. Kerstein RB, Radke J. Masseter and temporalis excursive hyperactiv-ity decreased by measured anterior guidance development. Cranio®. 2012;30:243–54. 11.
82. Thumati P, Manwani R, Mahantshetty M. The effect of reduced Disclu-sion Time in the treatment of myofascial pain dysfunction syndrome using immediate complete anterior guidance development protocol monitored by digital analysis of occlusion. Cranio®. 2014;32:289–99.
83. Yiannios N, Kerstein RB, Radke J. Treatment of frictional dental hyper-sensitivity (FDH) with computer-guided occlusal adjustments. Cranio. 2017;35:347-57. 14.
P11

ejprd.org - Published by Dennis Barber Journals. Copyright ©2021 by Dennis Barber Ltd. All rights reserved.
European Journal of Prosthodontics and Restorative Dentistry (2020) 28, 1–12 ARTICLE IN PRESS
• • • • • • • • • • • • • • • • • • • • • • • • • • • • • • • • • • • • Static and Quantifiable Occlusal Indicators...
84. Thumati P, Thumati RP. The effect of Disocclusion Time Reduction therapy to treat chronic myofascial pain: A single group interven-tional study with 3-year follow-up of 100 cases. J Ind Prosthodont Soc. 2016;16:234-41. 15.
85. Thumati P. The influence of immediate complete anterior guidance development technique on subjective symptoms in Myofascial pain patients: Verified using digital analysis of occlusion (Tekscan) for ana-lysing occlusion: A 3-year clinical observation. J Ind Prosthodont Soc. 2015;15:218-23.
86. Thumati P, Sutter B, Kerstein RB, Yiannios N, Radke J. Changes in the Beck Depression Inventory - II Scores of TMD Subjects after Measured Occlusal Treatment. Adv Den Tech. 2018;1:1-13.
87. Thumati P, Poovani S, Bharathi B, Mounika A, Kerstein RB, Radke J. A Disclusion Time Reduction Randomized Controlled Occlusal Adjust-ment Trial. Adv Den Tech. 2020;2:1-23.
88. Baldini A, Nota A, Cozza P. The association between occlusion time and temporomandibular disorders. J Electromyogr Kinesiol. 2015;25:151-54
89. Kerstein R. Disclusion time measurement studies: stability of Disclu-sion Time – a 1-year follow-up. J Prosthet Dent. 1994;72:164–8.
90. Kerstein RB. Disclusion time measurement studies: a comparison of Disclusion Time between chronic myofascial pain dysfunction patients and nonpatients: a population analysis. J Prosthet Dent. 1994;72:473–80. 7.
91. Kerstein RB. Treatment of myofascial pain dysfunction syndrome with occlusal therapy to reduce lengthy Disclusion Time – a recall evalua-tion. Cranio®. 1995;13:105–15.
92. Kerstein RB, Chapman R, Klein M. A comparison of ICAGD (immedi-ate complete anterior guidance development) to ‘mock ICAGD’ for symptom reductions in chronic myofascial pain dysfunction patients. Cranio®. 1997;15:21– 37.
93. Cerna, M., Ferreira, F., Zaror, C., Navarro, P., & Sandoval, P. In vitro evaluation of T-Scan® III through study of the sensels, CRANIO®, 2016;33:300-06
94. Andrus, R., Quian, F., Weir, D., Schneider, R., Huber, L., Kerstein, R.B. Comparison of results of traditional occlusal adjustment technique w/ computer-aided occlusal adjustment technique. Advanced Technolo-gies and Techniques 2019;1:43-53.
P12