ace joint ngo comments on ccs – appendix b - catf
TRANSCRIPT

1
Appendix B
I. Introduction As described in comments, carbon capture and sequestration is adequately demonstrated and available at costs that are not exorbitant. In 2014, CATF submitted extensive comments on carbon capture and geologic sequestration, which we incorporate and attach here,1 and this Appendix supplements those comments with information arising since that time. II. Types of Capture Technology
a. CO2 Capture has been Demonstrated at Commercial Scale for Decades.
Large scale CO2 separation routinely occurs in gas processing and many other industrial applications.2 Additionally, carbon dioxide capture from industrial air emissions streams, including from facilities burning coal, has occurred since the 1930s at a variety of industrial facilities, both in the U.S. and abroad, which need to remove CO2 as a processing step.3 Commercial scale capture projects in power generation have been established at Petra Nova W.A. Parish project and SaskPower’s Boundary Dam 3 project.
There are three technically feasible technologies for capturing CO2 from power generation, which are being demonstrated around the world: pre-combustion capture, post-combustion capture and oxyfuel capture. EPA has correctly recognized, each of these three carbon capture approaches is “technically feasible and available throughout most of the United States.”4 The selection of technology is specific to each facility and depends on considerations such as percentage capture, cost, plant locations, water requirements and availability as well as plant characteristics such as efficiency, capacity and space.
i. Pre-Combustion Systems are Demonstrated and Commercially
Available at Large Scale.
Pre-combustion capture of CO2 is the process by which CO2 is removed from the syngas of a coal gasification plant so that the remainder is mostly hydrogen.5 To accomplish the CO2 removal, two steps are required in addition to the initial gasification: carbon monoxide in the syngas must be converted to CO2 and hydrogen (in an operation called a ‘water-gas shift reaction’) and the CO2
1 See Comment submitted by CATF & Partial Carbon Capture and Storage Retrofit Technical Appendix (Modified and Reconstructed Sources), Doc. No. EPA-HQ-OAR-2013-0603-0280 (Oct. 16, 2014) (Attach. H); Supplemental comment submitted by CATF & Technical Appendix (New Source Performance Standards) Doc. No. EPA-HQ-OAR-2013-0495-9664 (May 9, 2014) (Attach. I); Comment submitted by CATF (Clean Power Plan) & Attached Apps. and Exs., Doc. No. EPA-HQ-OAR-2013-0602-25574 (Attach. J). 2 See generally Global CCS Institute, The Global Status of CCS: 2017, https://www.globalccsinstitute.com/sites/www.globalccsinstitute.com/files/uploads/global-status/1-0_4529_CCS_Global_Status_Book_layout-WAW_spreads.pdf [hereinafter “Global Status of CCS 2017”]. 3 CPP RIA at 2-31. 4 Abatement Measures TSD, ch. 7; CPP RIA at 2-29 – 2-39. 5 See generally, Global CCS Institute, Global Status of CCS 2013, ch. 5 (Aug. 1, 2013) https://www.globalccsinstitute.com/publications/global-status-ccs-2013.

2
must be removed through an ‘acid gas removal’ step (AGR system). By varying the hydrogen to carbon monoxide ratio through the number of shift operations and AGR, the final concentration of CO2 emitted after combusting the syngas can result in an overall 90 percent CO2 reduction or in varying removal levels such as 65 percent, 30 percent or no removal at all.
A 2016 DOE database includes a total of 1.014 projects, consisting of 12,559 gasifiers (excluding spares), of which 356 projects with 863 gasifiers are active commercial operating projects.6 All three of those processes (ammonia production, SNG, and liquid fuels production) entail significant amounts of syngas ‘shift’ and AGR. For many of these projects, the Rectisol® pre-combustion capture process of the German firms Linde or Lurgi is used (e.g., Dakota Gasification in the United States7 and Sasol in South Africa8); for others, UOP’s Selexol™ process has been used (e.g., the Coffeyville Syngas Plant in Kansas9). The total thermal capacity of these projects exceeds 20,000 MW, and some have been operating for decades.10 CO2 captured at the Dakota Gasification project is transported by pipeline to Canada, where it is used for EOR and sequestered. The CO2 from the Coffeyville plant is transported by pipeline to Chaparral's oil fields at its North Burbank Unit in Osage County, Oklahoma for EOR where injection began on June 6, 2013.11 Additionally, pre-combustion capture systems have been commercially available for decades. The Rectisol® process uses methanol in subzero temperatures to remove CO2 to a ppm level.12 It has been available for decades, and over 50 Rectisol® units are in operation worldwide on gasifiers. 13 The Selexol™ process is offered by UOP, a Honeywell company.14 The technology removes CO2 using a physical solvent. Over 115 plants around the world have use the technology around the world.15
ii. Post-Combustion Systems are Demonstrated and Commercially
Available at Large Scale
6 Chris Higman, State of the Gasification Industry: Worldwide Gasification and Syngas Databases: 2016 Update, (Oct. 2016), https://www.globalsyngas.org/uploads/downloads/2016-Wed-Higman.pdf. 7 See U.S. DOE, Office of Fossil Energy, Practical Experience Gained During the First Twenty Years of Operation of the Great Plains Gasification Plant and Implications for Future Projects, at 24 (2006), http://www.fossil.energy.gov/programs/powersystems/publications/Brochures/dg_knowledge_gained.pdf. 8 See Koss, U., State Of The Art Gas Technologies For Zero Emission IGCCs, at 8 (2002), http://www.cooretec.de/lw_resource/datapool/Neuigkeiten/technologies_co2_separation.pdf. 9 UOP, UOP Selexol Technology for Acid Gas Removal, at 23 (2009), http://www.uop.com/wp-content/uploads/2011/02/UOP-Selexol-Technology-for-Acid-Gas-Removal-tech-presentation.pdf. 10 CATF analysis of U.S. DOE data. The U.S. DOE data is available at: http://www.netl.doe.gov/research/coal/energy-systems/gasification/gasification-plant-databases/2010-archive. 11 “Chaparral Energy Begins CO2 Injection at EOR Field in North Burbank,” World Oil News (July 1, 2013), http://www.worldoil.com/Chaparral-Energy-begins-CO2-injection-at-EOR-project-in-North-Burbank-field.html. 12 NETL, “Acid Gas Removal (AGR),” https://www.netl.doe.gov/research/coal/energy-systems/gasification/gasifipedia/rectisol. 13 See HEI, L.L.C., HECA Feasibility study, Report #23 – AGR Licensor Evaluation, at 3-4 (Feb. 7, 2010), http://www.cpuc.ca.gov/NR/rdonlyres/538A0BA6-F6C9-495D-B13B-1399E446CDEC/0/23AGRLicensorEvaluation7Feb2010.pdf. 14 UOP, UOP Selexol Technology for Acid Gas Removal, at 23 (2009) http://www.uop.com/wp-content/uploads/2011/02/UOP-Selexol-Technology-for-Acid-Gas-Removal-tech-presentation.pdf. 15 Honeywell, UOP, “Technologies for Efficient Purification of Natural and Synthetic Gases,” https://www.uop.com/technologies-for-efficient-purification-of-natural-and-synthetic-gases/.
3
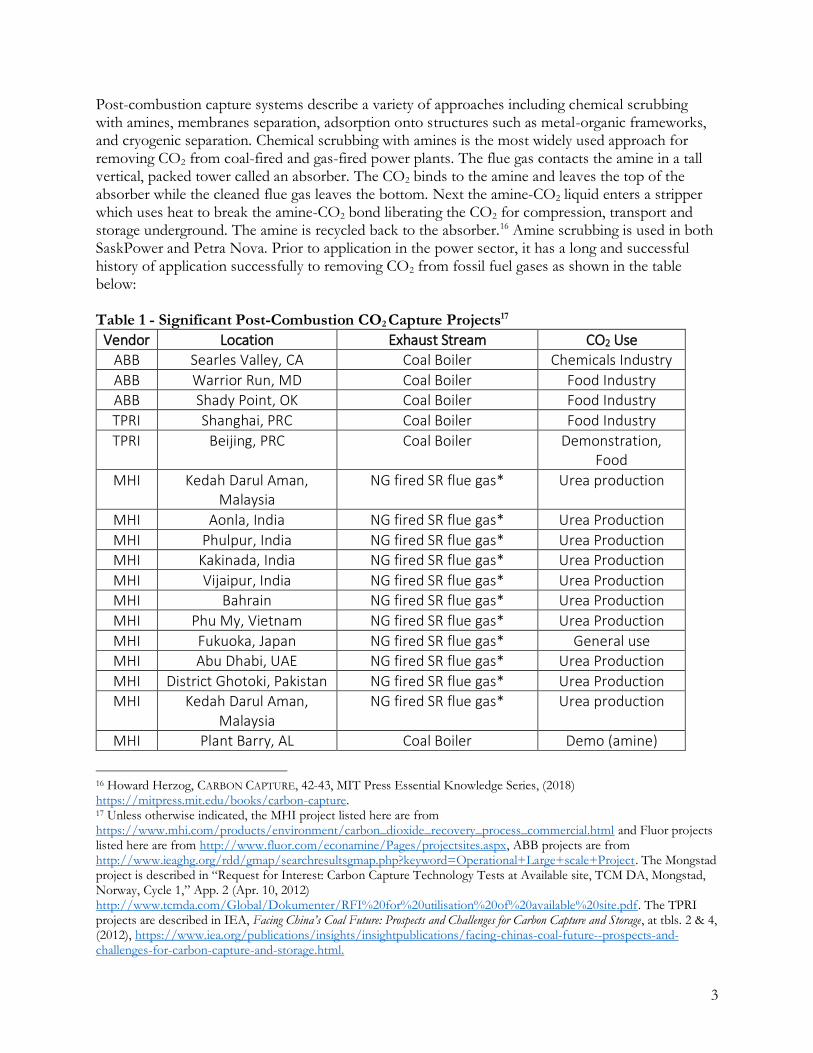
Post-combustion capture systems describe a variety of approaches including chemical scrubbing with amines, membranes separation, adsorption onto structures such as metal-organic frameworks, and cryogenic separation. Chemical scrubbing with amines is the most widely used approach for removing CO2 from coal-fired and gas-fired power plants. The flue gas contacts the amine in a tall vertical, packed tower called an absorber. The CO2 binds to the amine and leaves the top of the absorber while the cleaned flue gas leaves the bottom. Next the amine-CO2 liquid enters a stripper which uses heat to break the amine-CO2 bond liberating the CO2 for compression, transport and storage underground. The amine is recycled back to the absorber.16 Amine scrubbing is used in both SaskPower and Petra Nova. Prior to application in the power sector, it has a long and successful history of application successfully to removing CO2 from fossil fuel gases as shown in the table below:
Table 1 - Significant Post-Combustion CO2 Capture Projects17
Vendor Location Exhaust Stream CO2 Use ABB Searles Valley, CA Coal Boiler Chemicals Industry
ABB Warrior Run, MD Coal Boiler Food Industry ABB Shady Point, OK Coal Boiler Food Industry
TPRI Shanghai, PRC Coal Boiler Food Industry
TPRI Beijing, PRC Coal Boiler Demonstration, Food
MHI Kedah Darul Aman, Malaysia
NG fired SR flue gas* Urea production
MHI Aonla, India NG fired SR flue gas* Urea Production
MHI Phulpur, India NG fired SR flue gas* Urea Production MHI Kakinada, India NG fired SR flue gas* Urea Production
MHI Vijaipur, India NG fired SR flue gas* Urea Production MHI Bahrain NG fired SR flue gas* Urea Production
MHI Phu My, Vietnam NG fired SR flue gas* Urea Production
MHI Fukuoka, Japan NG fired SR flue gas* General use MHI Abu Dhabi, UAE NG fired SR flue gas* Urea Production
MHI District Ghotoki, Pakistan NG fired SR flue gas* Urea Production
MHI Kedah Darul Aman, Malaysia
NG fired SR flue gas* Urea production
MHI Plant Barry, AL Coal Boiler Demo (amine)
16 Howard Herzog, CARBON CAPTURE, 42-43, MIT Press Essential Knowledge Series, (2018) https://mitpress.mit.edu/books/carbon-capture. 17 Unless otherwise indicated, the MHI project listed here are from https://www.mhi.com/products/environment/carbon_dioxide_recovery_process_commercial.html and Fluor projects listed here are from http://www.fluor.com/econamine/Pages/projectsites.aspx, ABB projects are from http://www.ieaghg.org/rdd/gmap/searchresultsgmap.php?keyword=Operational+Large+scale+Project. The Mongstad project is described in “Request for Interest: Carbon Capture Technology Tests at Available site, TCM DA, Mongstad, Norway, Cycle 1,” App. 2 (Apr. 10, 2012) http://www.tcmda.com/Global/Dokumenter/RFI%20for%20utilisation%20of%20available%20site.pdf. The TPRI projects are described in IEA, Facing China’s Coal Future: Prospects and Challenges for Carbon Capture and Storage, at tbls. 2 & 4, (2012), https://www.iea.org/publications/insights/insightpublications/facing-chinas-coal-future--prospects-and-challenges-for-carbon-capture-and-storage.html.

4
Fluor Bellingham, MA Gas Turbine Exhaust Food Industry Fluor Lubbock, TX Natural Gas Enhanced Oil
Recovery
Fluor Carlsbad, NM Natural Gas Enhanced Oil Recovery
Fluor Santa Domingo, DR Light Fuel Oil Enhanced Oil Recovery
Fluor Barranquilla, Columbia Natural Gas Food Industry
Fluor Quito, Ecuador Light Fuel Oil Food Industry
Fluor Brazil NG / Heavy Fuel Oil Food Industry
Fluor Rio de Janeiro, Brazil Steam Reformer Methanol Production
Fluor Sao Paulo, Brazil Gas Engine Exhaust Food Production Fluor Argentina Steam Reformer Urea Plant Feed
Fluor Spain Gas Engine Exhaust Food Industry
Fluor Barcelona, Spain Gas Engine Exhaust Food Industry Fluor Bithor County, Romania Heavy Fuel Oil Food Industry
Fluor Cairo, Egypt Light Fuel Oil Food Industry Fluor Israel Heavy Oil Boiler Food Industry
Fluor Uttar Pradesh, India NG Reformer Furnace Urea Plant Feed Fluor Sechuan Province, PRC NG Reformer Furnace Urea Plant Feed
Fluor Singapore Steam Reformer Food Industry
Fluor San Fernando, Philippines Light Fuel Oil Food Industry Fluor Manila, Philippines Light Fuel Oil Food Industry
Fluor Osaka, Japan LPG Demo Plant Fluor Chibu, Japan Refinery Gas Mixture
Heavy Fuel Industry Food Industry
Fluor Yokosuka, Japan Coal/Heavy Fuel Oil Demo Plant Fluor Botany Australia Natural Gas Food Industry
Fluor Alton, Australia Natural Gas Food Industry Alstom New Haven, WV Coal Boiler Demo (ammonia)
Alstom Mongstad, Norway NG turbine/refinery Demo (ammonia)
Aker Mongstad, Norway NG turbine/refinery Demo (amine) * MHI describes these as “post-combustion” capture projects, and the exhaust gas from which the CO2 is separated is quite similar to conventional combustion gases (68% nitrogen, 8% CO2, balance mostly water).18 + Licensing of the PCC technology developed by Kerr-McGee19 was transferred to ABB in 1990.
18 Kamijo, et al., Recent technology development of KS-1 CO2 recovery process, (May, 2004), http://www.netl.doe.gov/publications/proceedings/04/carbon-seq/038.pdf. 19 Herzog, H. J., The Economics of CO2 Separation and Capture, tbl. 1, n. 1, http://www.me.unm.edu/~mammoli/ME561_stuff/economics_in_technology.pdf.

5
iii. Oxy-Combustion Capture Systems.
Oxy-combustion systems use high-purity O2, rather than air, to combust coal and thereby produce a highly concentrated CO2 stream.20 The bulk of the nitrogen is removed from the air before combustion, resulting in CO2 content up to 90 percent.21 If regulations and geochemistry permit, the raw, dehydrated flue gas may be stored directly without further purification resulting in 100 percent capture.22 This technology offers the lowest efficiency penalty and by its nature will be a “near zero” emitter of all criteria pollutants except, possibly, carbon monoxide.23
The most promising new oxyfuel technology under development is Net Power. Net Power believes their system will eventually rival the costs of electricity achieved by NGCC plants without carbon controls.24 This gas-fired technology is in the demonstration stage at a 50 MW plant outside of Houston. This high pressure, oxy-combustion system uses supercritical CO2 as the working fluid. CO2 under these conditions offers thermodynamic efficiencies compared to steam-based systems. The inherent high pressure of the system reduces component size (reducing costs) and eliminates the costs of compression other systems incur to bring the CO2 to pipeline or injection site pressures.25 Plans for the technology also include a coal-based version that utilizes syngas derived from coal instead of methane.26
The Schwarze Pumpe oxyfuel pilot, southeast of Berlin in Germany, uses oxyfuel combustion and post-combustion to capture 75,000 tpa of CO2.
27 The CO2 was transported 400 km by road tanker, where it is injected into a depleted natural gas field.28 The project consisted of a steam generator with a single 30 MW pulverized coal burner and the subsequent flue gas cleaning equipment.29 The CO2 purification and compression plant downstream produces liquid CO2 and gaseous oxygen with a 99.5 percent purity.30 The Schwarze Pumpe went into operation in 2008 and Vattenfall announced in November 2009 that it was achieving nearly 100 percent CO2 capture.31 The first test period of
20 See generally, Nicolas Perrin, et al., Oxycombustion for Carbon Capture on Coal Plants and Industrial Processes: Advantages, Innovative Solutions and Key Projects, 37 Energy Procedia 1389-1404 (2013), http://www.sciencedirect.com/science/article/pii/S1876610213002580; Global CCS Institute, CO2 Capture Technologies: Oxy Combustion with CO2 Capture, at 3 (Jan. 2012), http://www.globalccsinstitute.com/publications/co2-capture-technologies-oxy-combustion-co2-capture/online/111741. 21 Id. 22 Id. 23 Id. 24 Bill Brown, “Demonstration and Commercialization of Net Power and Beyond,” presented at 14th International Conference on Greenhouse Gas Control Technologies, GHGT-14, October 21-25, 2018 (photos of slides on file with CATF). 25 Allam et al., High efficiency and low cost of electricity generation from fossil fuels while eliminating atmospheric emissions, including carbon dioxide, 37 Energy Procedia 1135 (2013), https://www.sciencedirect.com/science/article/pii/S187661021300221X. 26 Xijia Lu, “Flexible Integration of the sCO2 Allam Cycle with Coal Gasification for Low-Cost, Emission-Free Electricity Generation,” presented at 14th International Conference on Greenhouse Gas Control Technologies, GHGT-14, October 21-25, 2018 (Attach. K). 27 MIT, “Schwarze Pumpe Fact Sheet,” https://sequestration.mit.edu/tools/projects/vattenfall_oxyfuel.html; Vattenfall, “The Schwarze Pumpe Pilot Project,” http://www.vattenfall.com/en/ccs/schwarze-pumpe.htm. 28 Id. 29 Id. 30 Id. 31 Id.

6
combustion with lignite ran from 2008 to 2011.32 The second test period with bituminous coal began in 2012.33 As of April 2011, the plant had accumulated 12,700 hours of operation.34,35 The pilot concluded operations in 2014.
The table below describes tests of other oxy-fired systems.
Table 2: Oxy-combustion Test Facilities and Pilot Projects36
The ability of power systems to adopt CCS is due in large part from the experience of industrial projects that can be transferred to power applications. Listed below are key projects in the industrial sector that use CCS.
b. Examples of North American Integrated CO2 Capture and Sequestration
Projects in Other Industrial Applications.
1. Great Plains Synfuel Plant, North Dakota and Weyburn-Midale Project, Southeastern
Saskatchewan, Canada (Synthetic Natural Gas): The Great Plains Synfuel plant in North Dakota is a coal gasification facility that separates about 7,700 tpd of CO2 for transportation by a pipeline crossing international borders, and injection for EOR into the Weyburn Field and sequestration in the Midale field in Saskatchewan, Canada.37 EPA
32 MIT, “Schwarze Pumpe Fact Sheet,” https://sequestration.mit.edu/tools/projects/vattenfall_oxyfuel.html; Vattenfall, “The Schwarze Pumpe Pilot Project”, http://www.vattenfall.com/en/ccs/schwarze-pumpe.htm. 33 Id. 34 Id. 35 Uwe Burchhardt, Göran Lindgre, Thomas Porsche, “Three years operational experiences with the Oxyfuel Pilot Plant of Vattenfall in Schwarze Pumpe,” 2nd Oxyfuel Combustion Conference, https://ieaghg.org/docs/General_Docs/OCC2/Abstracts/Abstract/occ2Final00152.pdf 36 IEA Greenhouse Gas R&D Programme, Carbon Capture and Storage: Proven and it Works, (Mar. 2014), http://www.ieaghg.org/docs/general_publications/CCS%20-%20Proven%20and%20it%20Works%20Update%20High%20Resolution.pdf. 37 Global CCS Institute, “Great Plains Synfuel Plant and Weyburn-Midale Project,” http://www.globalccsinstitute.com/project/great-plains-synfuel-plant-and-weyburn-midale-project; MIT, “Weyburn-
7
correctly noted that the plant is “functionally very similar to an electric power producing IGCC plant.”38 Over 20 Mt of CO2 have been stored in these two fields since October 2000.39 In addition to the purely commercial operation of this plant to produce synthetic natural gas and CO2 for use in EOR, the project’s sequestration operations are associated with a long-standing EOR monitoring and performance evaluation and research project, the IEAGHG Weyburn-Midale CO2 Monitoring & Storage Project directed by the Petroleum Technology Research Centre.40 Testing and evaluation of CO2 sequestration monitoring methods include surface seismic, shallow groundwater, soil gas, and passive seismic techniques.41 Covering more than 53,000 acres in southeast Saskatchewan, the area has undergone significant development of its oil and gas resources, notably water flooding and multi-leg horizontal well drilling.42 In recent years, Cenovus has installed additional injection and production wells, pipelines for both oil production and injection of CO2, as well as compression to increase the volume of CO2 that is recycled.43 The project and associated monitoring efforts demonstrate the permanence of CO2 sequestration in developed oil fields.44
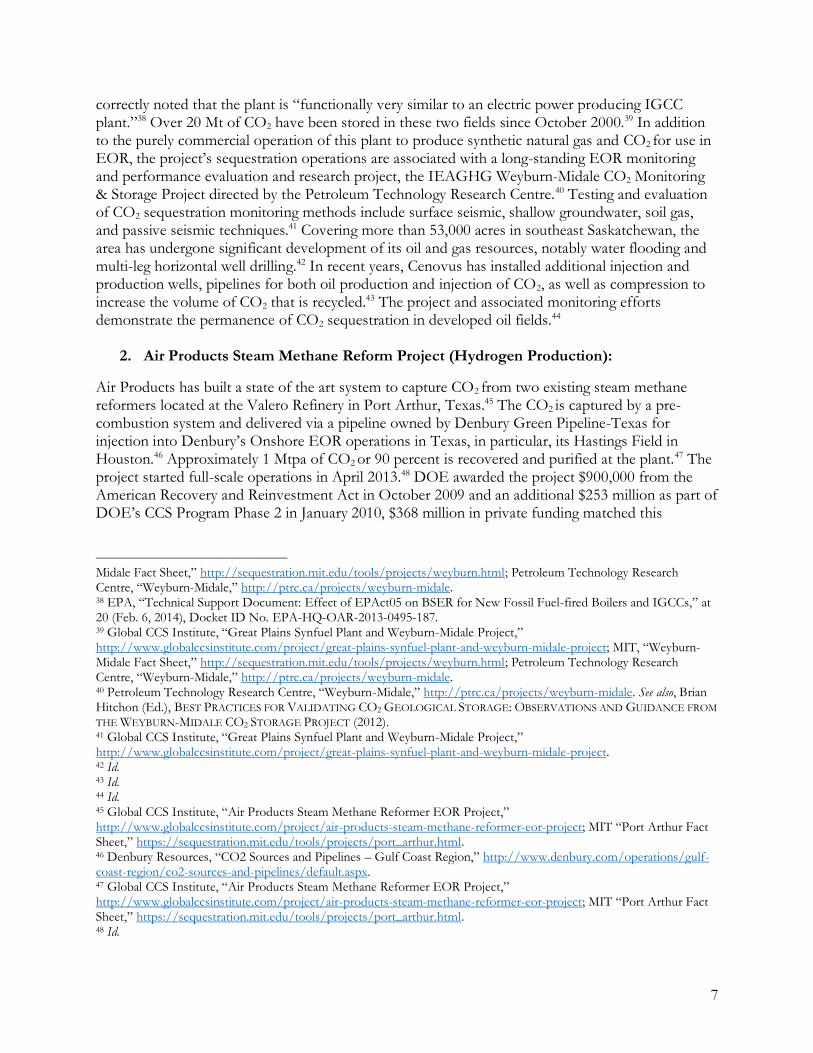
2. Air Products Steam Methane Reform Project (Hydrogen Production):
Air Products has built a state of the art system to capture CO2 from two existing steam methane reformers located at the Valero Refinery in Port Arthur, Texas.45 The CO2 is captured by a pre-combustion system and delivered via a pipeline owned by Denbury Green Pipeline-Texas for injection into Denbury’s Onshore EOR operations in Texas, in particular, its Hastings Field in Houston.46 Approximately 1 Mtpa of CO2 or 90 percent is recovered and purified at the plant.47 The project started full-scale operations in April 2013.48 DOE awarded the project $900,000 from the American Recovery and Reinvestment Act in October 2009 and an additional $253 million as part of DOE’s CCS Program Phase 2 in January 2010, $368 million in private funding matched this
Midale Fact Sheet,” http://sequestration.mit.edu/tools/projects/weyburn.html; Petroleum Technology Research Centre, “Weyburn-Midale,” http://ptrc.ca/projects/weyburn-midale. 38 EPA, “Technical Support Document: Effect of EPAct05 on BSER for New Fossil Fuel-fired Boilers and IGCCs,” at 20 (Feb. 6, 2014), Docket ID No. EPA-HQ-OAR-2013-0495-187. 39 Global CCS Institute, “Great Plains Synfuel Plant and Weyburn-Midale Project,” http://www.globalccsinstitute.com/project/great-plains-synfuel-plant-and-weyburn-midale-project; MIT, “Weyburn-Midale Fact Sheet,” http://sequestration.mit.edu/tools/projects/weyburn.html; Petroleum Technology Research Centre, “Weyburn-Midale,” http://ptrc.ca/projects/weyburn-midale. 40 Petroleum Technology Research Centre, “Weyburn-Midale,” http://ptrc.ca/projects/weyburn-midale. See also, Brian Hitchon (Ed.), BEST PRACTICES FOR VALIDATING CO2 GEOLOGICAL STORAGE: OBSERVATIONS AND GUIDANCE FROM
THE WEYBURN-MIDALE CO2 STORAGE PROJECT (2012). 41 Global CCS Institute, “Great Plains Synfuel Plant and Weyburn-Midale Project,” http://www.globalccsinstitute.com/project/great-plains-synfuel-plant-and-weyburn-midale-project. 42 Id. 43 Id. 44 Id. 45 Global CCS Institute, “Air Products Steam Methane Reformer EOR Project,” http://www.globalccsinstitute.com/project/air-products-steam-methane-reformer-eor-project; MIT “Port Arthur Fact Sheet,” https://sequestration.mit.edu/tools/projects/port_arthur.html. 46 Denbury Resources, “CO2 Sources and Pipelines – Gulf Coast Region,” http://www.denbury.com/operations/gulf-coast-region/co2-sources-and-pipelines/default.aspx. 47 Global CCS Institute, “Air Products Steam Methane Reformer EOR Project,” http://www.globalccsinstitute.com/project/air-products-steam-methane-reformer-eor-project; MIT “Port Arthur Fact Sheet,” https://sequestration.mit.edu/tools/projects/port_arthur.html. 48 Id.

8
money.49 The DOE called the project a “first-of-a-kind, breakthrough project advances carbon capture, utilization and storage technologies and demonstrates the potential to safely secure carbon dioxide pollution underground while providing an economic benefit and increasing our energy security.”50
3. Century Plant (Natural Gas Processing):
Century, located in Pecos County, Texas, uses captures CO2 from a natural gas processing plant in West Texas using Honeywell’s UOP Selexol CO2 pre-combustion capture technology.51 The plant has an operational CO2 capture capacity of 8.4 Mpta, making it the largest single industrial source CO2 facility in North America.52 The CO2 captured at the plant is transported by pipeline for EOR in the Kinder Morgan Permian delivery system.53 The first train of the plant has been in operation since 2010, with a second coming on line in 2012.54
4. Coffeyville Gasification Plant (Fertilizer Production): Coffeyville Resources, a subsidiary of CVR Energy, operates a nitrogen fertilizer plant in Coffeyville, Kansas.55 Chaparral Energy, an independent oil and natural gas production and exploration company, worked with Coffeyville Resources to build a CO2 compression facility at the plant site.56 The project utilizes industrial separation to capture the CO2.
57 Approximately 650,000 to 770,000 tpa of CO2 is captured through the fertilizer production process.58 The plant converts petroleum petcoke to a hydrogen rich syngas used to make chemicals and nitrogen fertilizer.59 In the process, the CO2, which is typically vented, is captured during the process of fertilizer production and is being transported 69 miles by pipeline to Chaparral's oil fields at its North Burbank Unit in Osage County, Oklahoma for EOR. The project commenced operation in 2013.60
5. Enid Fertilizer CO2-EOR Project (Fertilizer Production):
Around 680,000 tpa of CO2, derived from the manufacture of fertilizer, are captured through industrial separation at Koch Nitrogen's Enid fertilizer plant in northern Oklahoma.61 A 225 km
49 Id. 50 U.S. DOE, “Breakthrough Industrial Carbon Capture, Utilization and Storage Project Begins Full Scale Operation,” (May 10, 2013), available at: http://energy.gov/articles/breakthrough-industrial-carbon-capture-utilization-and-storage-project-begins-full-scale. 51 Global CCS Institute, “Century Plant,” http://www.globalccsinstitute.com/project/century-plant; MIT, “Century Plant Fact Sheet,” http://sequestration.mit.edu/tools/projects/century_plant.html. 52 Id. 53 Id. 54 Id. 55 Global CCS Institute, “Coffeyville Gasification Plant,” http://www.globalccsinstitute.com/project/coffeyville-gasification-plant; MIT, “Coffeyville Fact Sheet,” http://sequestration.mit.edu/tools/projects/coffeyville.html. 56 Id. 57 Id. 58 Id. 59 Id. 60 Global CCS Institute, “Coffeyville Gasification Plant,” http://www.globalccsinstitute.com/project/coffeyville-gasification-plant; MIT, “Coffeyville Fact Sheet,” http://sequestration.mit.edu/tools/projects/coffeyville.html. 61 Global CCS Institute, “Enid Fertilizer CO2-EOR Project,” http://www.globalccsinstitute.com/project/enid-fertilizer-co2-eor-project; MIT, “Enid Fertilizer Fact Sheet,” http://sequestration.mit.edu/tools/projects/enid_fertilizer.html.

9
pipeline transports the CO2 for use in EOR at the Northeast Purdy and the Brady Unit of the composite Golden Trend Field, as well as the Sko-Vel-Tum Field, both south of Oklahoma City. EOR at these fields commenced as early as 1982.62 In early 2010, Koch Nitrogen completed upgrades and expansion of its Enid Oklahoma Plant, having purchased the plant in 2003.63
6. Lost Cabin Gas Plant (Natural Gas Processing): This project uses pre-combustion capture technology at the existing Lost Cabin natural gas processing plant in Wyoming.64 Approximately 1 Mtpa of CO2 will be captured from the currently operating plant and transported via a 370 km pipeline to the Bell Creek oil field in Montana for EOR.65 Construction of the CO2 capture facilities started in 2011 and commenced operation in 2013.66
7. Core Energy/South Chester Gas Processing Plant (Natural Gas Processing):
CO2 is captured by Core Energy from natural gas processing for EOR in northern Michigan, with over 2 million MT captured to date. Operations began in 2003.
8. Antrim Gas Plant (Natural Gas Processing):
CO2 from a gas processing plant owned by DTE Energy is captured at a rate of approximately 1,000 tons per day since 2013 and injected into a nearby oil field operated by Core Energy in the Northern Reef Trend of the Michigan Basin.
9. Val Verde Natural Gas Plants (Natural Gas Processing): These five separate gas-processing facilities in the Val Verde area of Texas, capture around 1.3 Mtpa of CO2 for use in EOR operations at the Sharon Ridge oilfield.67 The dehydrated and compressed gas is transported via the Val Verde and CRC pipelines.68 The five facilities are the Mitchell, Gray Ranch, Puckett, Pikes Peak and Terrell gas plants.69 EOR has been used at the Sharon Ridge field since 1972.70
10. Shute Creek Gas Processing (Natural Gas Processing):
62 Id. 63 Id. 64 Global CCS Institute, “Lost Cabin Gas Plant,” http://www.globalccsinstitute.com/project/lost-cabin-gas-plant; MIT, “Lost Cabin Fact Sheet,” http://sequestration.mit.edu/tools/projects/lost_cabin.html. 65 Id. 66 Id. 67 Global CCS Institute, “Val Verde Natural Gas Plants,” http://www.globalccsinstitute.com/project/val-verde-natural-gas-plants; MIT, “Val Verde Fact Sheet,” http://sequestration.mit.edu/tools/projects/val_verde.html. 68 Id. 69 Id. 70 Id.

10
CO2 injection in the Salt Creek oil field commenced in 2004. Five of the 18 phases of the Salt Creek EOR project have been completed, with closure planned by 2023.71 It is regarded as one of the largest EOR projects in the United States.72 A new 400 km pipeline to connect Exxon Mobil's Shute Creek gas plant in southwest Wyoming to Anadarko’s Salt Creek oil field was completed in 2006.73 Following an expansion in plant capacity in 2010, around 7 Mtpa of CO2 are recovered from the gas processing facility using pre-combustion capture technology.74 The Rangely Oil Field is one of the oldest and largest oil fields in the Rocky Mountain region.75 The field has been producing since the 1940s, and has injected a total of approximately 23-25 Mt of CO2 for EOR since 1986.76
11. Chaparral/Conestoga Energy Partners’ Arkalon Bioethanol plant (Chemical Production):
Located in Kansas, this was the first ethanol plant to deploy carbon capture and supplies 170,000 tons of CO2 per year to Chaparral Energy, which uses it for EOR in Texas oil fields.
12. ADM Decatur CCS Project (Chemical Production):
This project, which involves the compression and dehydration of CO2, already separated in a corn-to-ethanol plant, and its storage in a deep saline aquifer adjacent to the producing plant, has progressed significantly through its construction activities.77 The Illinois Industrial CCS Project will integrate its facilities with the existing 1,000 tpd of CO2 facility under the Illinois Basin-Decatur Project to achieve a total CO2 injection capacity of 3,000 tpd or approximately 1Mtpa of CO2.
78 Construction of the surface facilities and the two monitoring wells has been completed.79 EPA approved the a Class injection well VI permit for the project in September 2014.80 The project began operations in April, 2017.81
13. Shell Quest Facility (Hydrogen Production):
In 2012, Shell announced that it would begin construction of a CCS facility at its Scotford Upgrader, capturing 1 Mtpa of CO2 beginning in 2015 - a 35 percent reduction in direct CO2 emissions from
71 Global CCS Institute, “Shute Creek Gas Processing Facility,” http://www.globalccsinstitute.com/project/shute-creek-gas-processing-facility; MIT, “LaBarge Fact Sheet,” https://sequestration.mit.edu/tools/projects/la_barge.html. 72 Id. 73 Id. 74 Id. 75 Id. 76 Global CCS Institute, “Shute Creek Gas Processing Facility,” http://www.globalccsinstitute.com/project/shute-creek-gas-processing-facility; MIT, “LaBarge Fact Sheet,” https://sequestration.mit.edu/tools/projects/la_barge.html. 77 Global Status of CCS 2014 at 12; Global CCS Institute, “Illinois Industrial Carbon Capture and Storage Project, http://www.globalccsinstitute.com/project/illinois-industrial-carbon-capture-and-storage-project; MIT, “Decatur Fact Sheet,” https://sequestration.mit.edu/tools/projects/decatur.html. 78 Id. 79 Id. 80 See EPA, “U.S. EPA Approves Carbon Sequestration Permit in Decatur, Illinois,” (Sept. 26, 2014), https://archive.epa.gov/epapages/newsroom_archive/newsreleases/afbc8abba5c91e3685257d5f0050ac84.html. 81 See ADM, “ADM Begins Operations for Second Carbon Capture and Storage Project,” (Apr. 7, 2017) https://www.adm.com/news/news-releases/adm-begins-operations-for-second-carbon-capture-and-storage-project-1.

11
the plant.82 The Scotford Upgrader processes bitumen with hydrogen to produce oil.83 An amine absorber captures CO2 from the Upgrader’s hydrogen plants.84 The CO2 is transported about 65 km by pipeline and injected into a saline formation.85 In June 2018, Quest announced it had captured and stored three million tonnes of CO2.
86
c. Examples of Overseas Integrated CO2 Capture and Sequestration Projects in Other Industrial Applications
1. In Salah, Algeria (Natural Gas Processing):
The currently suspended BP, Statoil, Sonatrach, DOE, EU Directorate of Research In Salah sequestration project is located in the Sahara Desert in Algeria.87 Injections were suspended in 2011, but since it began operation in 2004, over 3.8 Mt of CO2 were captured from an onsite BP natural gas processing plant and transported via pipeline, ultimately being injected in a saline field at a rate of up to 1.2 Mtpa.88 The CO2 is injected two km deep into the 20-meter thick Krechba Carboniferous sandstone formation via 3 horizontal wells.89 The sandstone has 12 percent porosity and 10 mD permeability (a relatively tight formation but similar to many formations around the world).90 A suite of monitoring tools, including satellite interferometry (INSAR) were tested and proven at the In Salah field. INSAR data documented unexpected vertical CO2 migration along an unknown fracture or fault zone, however the CO2 remained below its caprock and the integrity of the storage was not jeopardized.91 This project demonstrates the successful injection, monitoring and sequestration of commercial volumes of CO2 in saline reservoirs. This project demonstrated the successful injection of commercial volumes of CO2.
92
2. Sleipner, Norway, North Sea (Natural Gas Processing):
The Sleipner sequestration project is located 250 km offshore in the North Sea where CO2 separated at an offshore natural gas processing platform has been injected at a rate of 1 Mtpa into the Utsira
82 Global CCS Institute, “Quest,” http://www.globalccsinstitute.com/project/quest; MIT, “Quest Fact Sheet,” http://sequestration.mit.edu/tools/projects/quest.html; OGJ Editors, Shell okays Quest CCS Project in Alberta, Oil & Gas J. (Sept. 5, 2012), available at: http://www.ogj.com/articles/2012/09/shell-okays-quest-ccs-project-in-alberta.html 83 Id. 84 Id. 85 Shell, Shell to Construct World’s First Oil Sands Carbon Capture and Storage (CCS) Project, (Sept. 5, 2012), http://www.shell.com/global/aboutshell/media/news-and-media-releases/2012/quest-first-oil-sands-ccs-project-05092012.html. 86 Global CCS Institute, “Quest,” https://www.globalccsinstitute.com/projects/quest. 87 Global CCS Institute, “In Salah CO2 Storage,” http://www.globalccsinstitute.com/project/salah-co2-storage; MIT, “In Salah Fact Sheet,” https://sequestration.mit.edu/tools/projects/in_salah.html; Global Status of CCS 2013 at 27, 29, 30, 42, 51, 126, 132, 164; P.S. Ringrose et al., The In Salah CO2 Storage Project: Lessons Learned and Knowledge Transfer, 37 Energy Procedia 6226 (2013), http://www.sciencedirect.com/science/article/pii/S1876610213007947. 88 Id. 89 Id. 90 Id. 91 Id. 92 Global CCS Institute, “In Salah CO2 Storage,” http://www.globalccsinstitute.com/project/salah-co2-storage; MIT, “In Salah Fact Sheet,” https://sequestration.mit.edu/tools/projects/in_salah.html; Global Status of CCS 2013 at 27, 29, 30, 42, 51, 126, 132, 164; P.S. Ringrose et al., The In Salah CO2 Storage Project: Lessons Learned and Knowledge Transfer, 37 Energy Procedia 6226 (2013), http://www.sciencedirect.com/science/article/pii/S1876610213007947.

12
Sandstone since 1996.93 Approximately 18 Mt have been injected over the life of the project. The Utsira is a 200-250-meter-thick formation –with an overlying 800-meter-thick caprock formation that is predicted to be able to contain 600 billion tons of CO2. Monitoring has verified that CO2 is secure.94 The Sleipner project demonstrates the successful long-term injection of commercial volumes of CO2 into a deep offshore geologic saline reservoir.95
3. Snohvit, Norway, North Sea (Natural Gas Processing):
The Snohvit saline sequestration project is operated by Norwegian Statoil and has sequestered approximately 01.9 Mt of CO2 separated from a natural gas, into the Tubaen sandstone Formation since 2008 at a subsea depth of about 2.5 km.96 EU-financed monitoring accompanies this project.97 The project is groundbreaking in that it is the first to operate without offshore installations.98 The caprock that has kept the natural gas being produced in place for millennia is also expected to keep the CO2 secure.99
4. Petrobras Lula Oil Field CCS Project, Brazil (Natural Gas Processing): This facility is an offshore natural gas processing plant using pre-combustion technology to capture 700,000 tpa of CO2. The CO2 is directly injected via a 2 km injection riser to EOR at the Lula oil field located in the Santos Basin.100 As part of developing the project, Petrobras conducted studies and determined that EOR provided a means to cost effectively recover hydrocarbon reserves instead of venting.101 CO2 injection commenced at pilot scale in 2011 and at commercial scale in June 2013.102
5. Abu Dhabi CCS Project (Iron & Steel):
The Abu Dhabi CCS project is the first ever CCS project in the iron and steel sector. The plant captures high purity CO2 produced by the direct reduced iron-making process at the Emirates Steel Industries factory in Mussafah.103 Launched in November 2016, the compression facility has a
93 See MIT “Sleipner Fact Sheet,” http://sequestration.mit.edu/tools/projects/sleipner.html; Global CCS Institute, “Sleipner CO2 Injection,” http://www.globalccsinstitute.com/project/sleipner%C2%A0co2-injection; Global Status of CCS 2013 at 30, 42, 51, 126, 164, 181. 94 Id. 95 Id. 96 MIT, “Snohvit Fact Sheet,” http://sequestration.mit.edu/tools/projects/snohvit.html; Global CCS Institute, “Snohvit CO2 Injection,” http://www.globalccsinstitute.com/project/sn%C3%B8hvit-co2-injection. 97 Id. 98 Id. 99 Id. 100 Global CCS Institute, “Petrobas Lula Oil Field CCS Project”, http://www.globalccsinstitute.com/project/petrobras-lula-oil-field-ccs-project; MIT, “Lula Fact Sheet,” http://sequestration.mit.edu/tools/projects/lula.html; Global Status of CCS 2013 at 31; Jorge Oscar de Sant’ Anna Pizzaro, Celso Cesar Moreira Branco, Planning and implementing an EOR project for the pre-salt Lula field, World Oil (Aug. 2012), available at: http://www.worldoil.com/supplement-detail.aspx?supplementID=91087. 101 Id. 102 Id. 103 Global CCS Institute, “Abu Dhabi CCS (Phase 1 being Emirates Steel Industries)”, https://www.globalccsinstitute.com/projects/abu-dhabi-ccs-project-phase-1-being-emirates-steel-industries-esi-ccs-project.
13
capture capacity of 0.8 Mtpa. The captured CO2 is transported via approximately 50km pipeline to Abu Dhabi National Oil Company (ADNOC) oil reservoirs for enhanced oil recovery.104
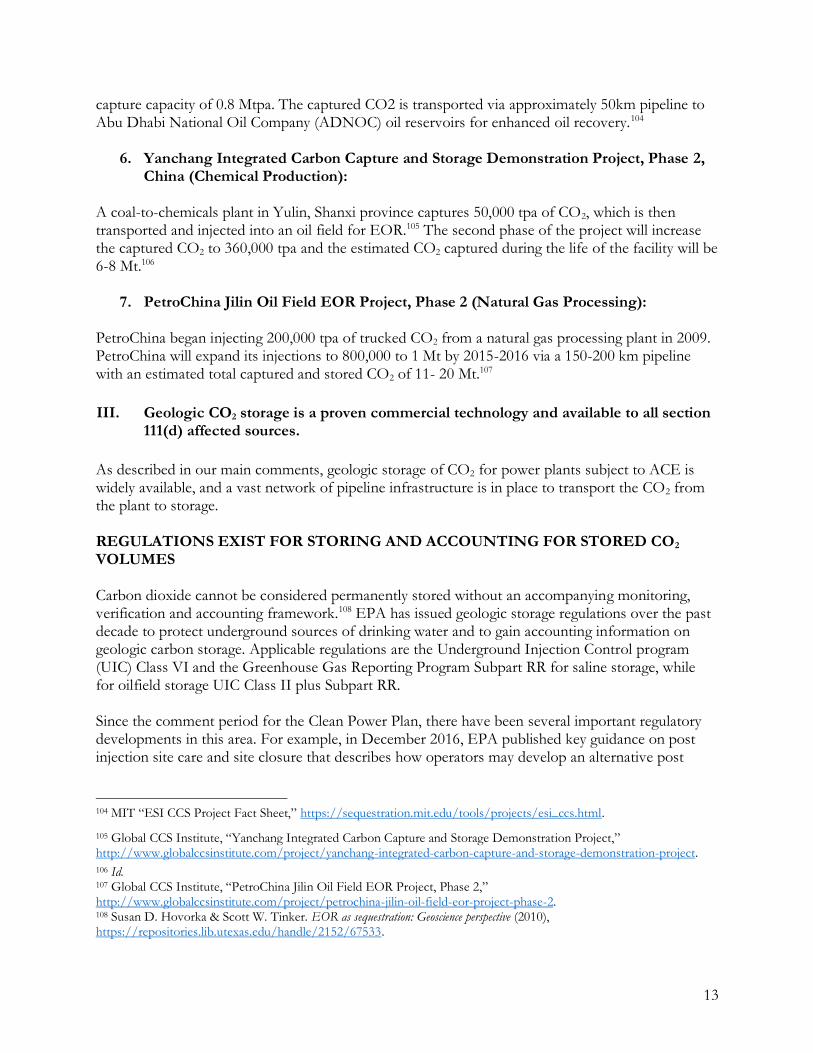
6. Yanchang Integrated Carbon Capture and Storage Demonstration Project, Phase 2, China (Chemical Production):
A coal-to-chemicals plant in Yulin, Shanxi province captures 50,000 tpa of CO2, which is then transported and injected into an oil field for EOR.105 The second phase of the project will increase the captured CO2 to 360,000 tpa and the estimated CO2 captured during the life of the facility will be 6-8 Mt.106
7. PetroChina Jilin Oil Field EOR Project, Phase 2 (Natural Gas Processing):
PetroChina began injecting 200,000 tpa of trucked CO2 from a natural gas processing plant in 2009. PetroChina will expand its injections to 800,000 to 1 Mt by 2015-2016 via a 150-200 km pipeline with an estimated total captured and stored CO2 of 11- 20 Mt.107
III. Geologic CO2 storage is a proven commercial technology and available to all section
111(d) affected sources.
As described in our main comments, geologic storage of CO2 for power plants subject to ACE is widely available, and a vast network of pipeline infrastructure is in place to transport the CO2 from the plant to storage. REGULATIONS EXIST FOR STORING AND ACCOUNTING FOR STORED CO2 VOLUMES Carbon dioxide cannot be considered permanently stored without an accompanying monitoring, verification and accounting framework.108 EPA has issued geologic storage regulations over the past decade to protect underground sources of drinking water and to gain accounting information on geologic carbon storage. Applicable regulations are the Underground Injection Control program (UIC) Class VI and the Greenhouse Gas Reporting Program Subpart RR for saline storage, while for oilfield storage UIC Class II plus Subpart RR. Since the comment period for the Clean Power Plan, there have been several important regulatory developments in this area. For example, in December 2016, EPA published key guidance on post injection site care and site closure that describes how operators may develop an alternative post
104 MIT “ESI CCS Project Fact Sheet,” https://sequestration.mit.edu/tools/projects/esi_ccs.html.
105 Global CCS Institute, “Yanchang Integrated Carbon Capture and Storage Demonstration Project,” http://www.globalccsinstitute.com/project/yanchang-integrated-carbon-capture-and-storage-demonstration-project.
106 Id. 107 Global CCS Institute, “PetroChina Jilin Oil Field EOR Project, Phase 2,” http://www.globalccsinstitute.com/project/petrochina-jilin-oil-field-eor-project-phase-2. 108 Susan D. Hovorka & Scott W. Tinker. EOR as sequestration: Geoscience perspective (2010), https://repositories.lib.utexas.edu/handle/2152/67533.

14
injection site care timeframe other than the UIC Class VI 50-year default.109 In January 2018, EPA published a UIC Class VI (sequestration) implementation manual.110 In addition, EPA has approved monitoring reporting and verification (MRV) plans for four projects opting into sequestration under GHGRP Subpart RR.111 EPA also approved North Dakota’s application for UIC Class VI primacy.112 In addition, a number of states such as Texas have adopted state regulatory programs to verify CO2 storage as highlighted in the table below.113
Source: Holly Javedan, MIT, 2013.114 Note: Missing 2017 UIC Class VI Primacy approval for ND.
GEOLOGIC SEQUESTRATION CAPACITY ASSESSMENTS HAVE BEEN EXPANDED AND REFINED DOE’s National Energy Technology Laboratory (NETL) has issued a national carbon atlas, and revisions since the previous decade. The most recent reassessment of the NATCARB Atlas (version V, published in 2015) demonstrates additional storage capacity compared to the previous version
109 EPA, Geologic Sequestration of Carbon Dioxide, Underground Injection Control (UIC) Program Class VI Well Plugging, Post-Injection Site Care, and Site Closure Guidance (2016), https://www.epa.gov/sites/production/files/2016-12/documents/uic_program_class_vi_well_plugging_post-injection_site_care_and_site_closure_guidance.pdf. 110 U.S. Environmental Protection Agency, Geologic Sequestration of Carbon Dioxide—Underground Injection Control Program Class VI Implementation Manual for UIC Program Directors (2018), https://www.epa.gov/sites/production/files/2018-01/documents/implementation_manual_508_010318.pdf. 111 U.S. Environmental Protection Agency, Subpart RR – Geologic Sequestration of Carbon Dioxide, https://www.epa.gov/ghgreporting/subpart-rr-geologic-sequestration-carbon-dioxide (MRV plan final decision documents). 112 40 C.F.R. § 147 (2018). 113 16 Tex. Admin. Code § 5.101 (2010). 114 Holly Javedan, Regulations for Underground Storage of CO2 Passed by U.S. States (2013), https://sequestration.mit.edu/pdf/US_State_Regulations_Underground_CO2_Storage.pdf

15
cited in the CPP RIA. 115 116 117 According to the Atlas, the low, medium, and high estimates of geologic sequestration capacity are, respectively, 2.4 trillion metric tons, 8.3 trillion metric tonnes and, 22 trillion metric tonnes. This is enough capacity for hundreds, if not thousands of years of coal plant CO2 emissions. (For reference, the United States’ energy sector CO2 emissions totaled 5.1 billion metric tonnes in 2017.118) Worldwide saline projects, such as Norway’s Sleipner and Snohvit sites, Canada’s Aquistore project, SECARB’s Cranfield project, and the Illinois Basin project in Decatur IL, have demonstrated the ability to sequester millions of tonnes of CO2 that has been verified by sophisticated monitoring methods.119 120 121 122 NETL Research Carbon Sequestration Partnerships (RCSPs) have delineated carbon storage reservoirs across North America and, in the process, developed protocols and experience in site characterization, monitoring, verification and accounting (MVA) to ensure that injected CO2 remains confined in the subsurface and does not migrate and threaten aquifers or escape into the atmosphere.123 There have been important learning and results from the regional partnerships discussed in our 2014 comments. For example, the Plains CO2 Reduction Partnership (PCOR), in 2016, released the 5th edition of their storage Atlas which covers nine U.S. states in the northern Rocky Mountains, Great Plains and adjacent Alberta and Saskatchewan Canada. The Atlas suggests a regional storage capacity of 330 Gt of CO2 (about 150 years of U.S. EGU-related emissions) and that CO2-EOR in the region’s depleted oil fields could store an additional 3.2 Gt of CO2 while producing 7 billion barrels of oil.124 As a part of NETL’s efforts, the American Recovery and Reinvestment Act of 2009 (ARRA) provided $100 million for nine specific geologic storage projects, as summarized in the NETL 2016 Site Characterization Accomplishments final report.125 The ARRA-funded projects cut broadly
115 National Energy Technology Laboratory, U.S. Department of Energy, NETL’s 2015 Carbon Storage Atlas Shows Increase in U.S. CO2 Storage Potential (2015), https://www.energy.gov/fe/articles/netl-s-2015-carbon-storage-atlas-shows-increase-us-co2-storage-potential. 116 National Energy Technology Laboratory, U.S. Department of Energy, Carbon Storage Atlas 111 (5th ed. 2015), https://www.netl.doe.gov/research/coal/carbon-storage-1/atlasv. 117 U.S. Environmental Protection Agency, Regulatory Impact Analysis for the Clean Power Plan Final Rule, at 2-33 (2015), https://www3.epa.gov/ttnecas1/docs/ria/utilities_ria_final-clean-power-plan-existing-units_2015-08.pdf. 118 U.S. Energy Information Administration, U.S. energy-related CO2 emissions fell slightly in 2017 (2018), https://www.eia.gov/todayinenergy/detail.php?id=36953. 119 CCP, “Key Large-scale CO2 capture and storage (CCS) Projects,” https://www.co2captureproject.org/ccs_in_action.html 120 CCS Network, “Sleipner CO2 Storage Project,” https://ccsnetwork.eu/projects/sleipner-co2-injection. 121 Aquistore “Aquistore Project: Annual Report,” (2016) http://aquistore.ca/+pub/AQ%20Annual%20Report%202016%20Final.pdf. 122 Greenberg, S. et al., Geologic carbon storage at a one million tonne demonstration project: Lessons learned from the Illinois Basin-Decatur Project, 114 Energy Procedia 5529 (2017) https://ac.els-cdn.com/S1876610217321215/1-s2.0-S1876610217321215-main.pdf?_tid=e6afd238-2357-44b2-8bc0-2ac7220667e0&acdnat=1540985984_04496614dc1c6e844f809b8ae19cb690. 123 For example, Gulf Coast Carbon Center geologic storage technical library contains over a decade of technical papers on geologic storage. See http://www.beg.utexas.edu/gccc/forum/codexhome.php; National Energy Technology Laboratory, U.S. Department of Energy, Monitoring, Verification and Accounting of CO2 Stored in Deep Geologic Formations, (2nd ed. 2012), http://www.netl.doe.gov/File%20Library/Research/Carbon%20Seq/Reference%20Shelf/MVA_Document.pdf. 124 See Plains CO2 Reduction Partnership, Regional Storage Potential, https://www.undeerc.org/pcor/region/ 125 See National Energy Technology Laboratory, U.S. Department of Energy, NETL’s ARRA Site Characterization

16
across the U.S.: Los Angeles basin/California offshore; Newark Basin/New Jersey, Pennsylvania, New York; South Georgia Rift Basin/South Carolina, Georgia; Illinois and Michigan Basins/Illinois, Indiana, Kentucky, Michigan; Black Warrior Basin/Alabama; Ozark Plateau Aquifer/Kansas; Miocene Texas offshore; Rocky Mountains/Colorado, Utah, Arizona, New Mexico; Rock Springs uplift and Moxa Arch/Wyoming. These ARRA projects have demonstrated improved geologic storage assessment and monitoring best practices and have resulted in storage capacity estimates ranging from 160 billion metric tonnes to upwards of 640 billion metric tonnes (76-305 times today’s power sector emissions) in the assessed geologic formations alone. Moreover, these ARRA projects have supported development and improvement of computational models used to develop regional storage capacity estimates including providing new data on subsurface formation porosity, permeability, injectivity. NETL has been winding down these regional carbon sequestration partnerships and has been transitioning to its new CarbonSAFE program since 2016.126 In addition, the U.S. Geological Survey has independently studied some sedimentary basins with deep, secure subsurface formations and estimates there is the capacity to sequester over 500 years of today’s U.S. energy emissions in the formations assessed to date only.127 Additional capacity lies in the basins not yet assessed by USGS. VERY LARGE EASTERN U.S. AND GULF COAST OFFSHORE GEOLOGIC STORAGE COULD STORE TRILLIONS OF TONNES OF CO2 Offshore storage holds promise to receive large quantities of captured CO2 for EOR and saline storage. It can be envisioned that a network of pipelines leading to a trunk line to the Gulf could store CO2 from a wide region in the United States. Offshore storage offers several important advantages:
• Offshore formations are thicker, and more ductile, less prone to fracture and more likely to accommodate CO2;
• Storage sites are distant from populated areas;
• Offshore geologic resource leasing is less complex;
• Pipelines will be easier to route;
• There are no underground sources of drinking water (USDWs) in the offshore, and, moreover, leakage of CO2 and brine (concentrated seawater) in to the ocean may pose lesser environmental risk (if unaccompanied by hydrocarbons); and
• Softer sedimentary rocks on the continental shelf minimizes risk of damaging induced seismicity.
Initiative: Accomplishments (2016), https://www.netl.doe.gov/File%20Library/Research/Coal/carbon-storage/infrastructure/ARRA-Site-Characterization-Accomplishments-2016.pdf. 126 See National Energy Technology Laboratory, U.S. Department of Energy, RCSP Geologic Characterization Efforts, https://www.netl.doe.gov/research/coal/carbon-storage/carbon-storage-infrastructure/rcsp-geologic-characterization (describing NETL’s Regional Carbon Sequestration Partnerships). 127 U.S. Geological Survey, National Assessment of Geologic Carbon Dioxide Storage Resources (2013), https://pubs.er.usgs.gov/publication/fs20133020.

17
In 2012, ICF International, for the BOEM Outer Continental Shelf Study, analyzed U.S. offshore storage options in the U.S. Outer Continental Shelf, where there very large carbon storage resources, an estimated 3.6 trillion metric tonnes. The report includes costs for construction of pipelines and provides estimates for several example cases.128 The study concluded that there would be $16.9B benefit to the U.S. economy for storing CO2 on the Outer continental shelf. According to a 2014 assessment by ARI for NETL, 310 Mt to 3.9 Gt of CO2 could be utilized and stored at a low cost in the process of EOR in the offshore Gulf of Mexico, one of the world’s largest and thickest porous sedimentary sequences. 129 130 The Gulf Coast Carbon Center at the University of Texas, Austin, also a recipient of funding has recently mapped and begun the process of estimating the magnitude of large geologic carbon storage formations in the offshore saline formations and gas fields of the Gulf of Mexico. In 2018, the Center released an atlas of storage opportunities in Miocene age strata of the Gulf Coast and concluded that hundreds of millions of tonnes could be sequestered in those thick sandstone sequences alone. 131 Modeled offshore pipeline buildout scenarios demonstrate that the Gulf Coast could serve as a hub for storing CO2 from energy and industrial production in the United States.132 The analysis concluded that for a total capital cost of $6 billion dollars, there is a potential to store 40 Mtpa in 52 oil fields in the shallow Gulf of Mexico through a three pipeline system, and store 57 Mtpa in 63 large oil fields also connected by a three pipeline system in the deep Gulf of Mexico. Battelle Memorial Institute received a $4.7 million grant in 2015 to lead a consortium to investigate geologic storage opportunities in the Northeast United States including the Baltimore Canyon Trough and the George's Banks Basin.133 The results of this investigation are particularly important given the limited opportunities that exist in the Northeast United States for deep geologic carbon storage onshore. The effort includes mapping the geologic formations in the subsurface using existing well logs and seismic methods, investigating the hydrogeology by testing existing geologic cores. The results suggest that three deep saline reservoir formations, representing thousands of feet of thickness, such as the Mississauga Formation, exist in the offshore overlain by thick mud caprock that, combined, may be able to store large quantities of CO2, providing a permanent geologic sink for the hundreds of millions to billions of tonnes of CO2 generated by coal plants in the Northeast
128 Harry Vidas, Bob Hugman, Ananth Chikkatur, Boddu Venkatesh, ICF International (2012). Analysis of the Costs and Benefits of CO2 Sequestration on the U.S. Outer Continental Shelf, https://www.boem.gov/uploadedFiles/BOEM/Oil_and_Gas_Energy_Program/Energy_Economics/External_Studies/OCS%20Sequestration%20Report.pdf. 129 National Energy Technology Laboratory, U.S. Department of Energy, CO2 – EOR Offshore Resource Assessment (2014), https://www.netl.doe.gov/research/energy-analysis/search-publications/vuedetails?id=626. 130 Ramon Trevino & Tip Meckel, Geological CO2 Sequestration Atlas of Miocene Strata, Offshore Texas State Waters (2017), https://store.beg.utexas.edu/reports-of-investigations/3415-ri0283-atlas.html?search_query=RI0283&results=2. 131 Id. 132 Vello Kuuskraa, Advanced Resources International, Inc., Establishing CO2 Utilization, Storage and Pipeline Systems for Oil Fields in Shallow and Deep Waters of the Gulf of Mexico (2017), https://www.osti.gov/servlets/purl/1469161. 133 National Energy Technology Laboratory, U.S. Department of Energy, Mid-Atlantic U.S. Offshore Carbon Storage Resource Assessment Project, https://www.netl.doe.gov/research/coal/project-information/fe0026087?k=FE0026087.

18
region.134 Initial results of the study suggest that these formations have the capacity, permeability, porosity, and requisite depth for commercial scale geologic carbon storage.
Battelle Mid-Atlantic offshore carbon resources assessment region.135 ADDITIONAL PROGRESS HAS BEEN MADE IN GEOLOGIC CARBON SEQUESTRATION RESEARCH Substantial new research in the field of geologic sequestration has taken place since the end of the comment period for the Clean Power Plan in late 2014, which has deepened our understanding of geologic carbon storage technologies and delineated it in more detail. In the U.S., this includes a deeper understanding of options for geologic CO2 storage in onshore and offshore regions.136 Globally, recently published studies include global and regional storage capacity assessments, as well as field and laboratory research efforts that provide additional confidence in geologic carbon storage as a critical technology for reducing emissions from the power sector.137 Further development of computational models has also improved scientists’ abilities to assess subsurface formations and
134 See Neeraj Gupta, Mid-Atlantic U.S. Offshore Carbon Storage Resource Assessment (2017), https://www.netl.doe.gov/File%20Library/Events/2017/carbon-storage-oil-and-natural-gas/tues/Gupta-P2-FY17_MidAtlanticProjectTeam_DOE_FINAL.pdf. 135 Id. 136 For example, a research effort supported by the U.S. Department of Energy National Energy Technology Lab (NETL), has resulted in major advances in the understanding of offshore storage reservoirs in the Gulf Coast as part of the NETL CarbonSAFE program. See National Energy Technology Laboratory, U.S. Department of Energy, Regional Carbon Sequestration Partnerships (RCSP) Initiative, https://www.netl.doe.gov/research/coal/carbon-storage/carbon-storage-infrastructure/rcsp; National Energy Technology Laboratory, U.S. Department of Energy, CarbonSAFE, https://www.netl.doe.gov/research/coal/carbon-storage-1/storage-infrastructure/carbonsafe. 137 See, e.g., IEA Greenhouse Gas R&D Programme, International Energy Agency, IEAGHG Technical Report 2017-01: Case Studies of CO2 Storage in Depleted Oil and Gas Fields, IEA-GHG R&D (2017), https://ieaghg.org/docs/General_Docs/Reports/2017-01.pdf; International Energy Agency, 2015, Carbon Capture and Storage: The Solution for Deep Emissions Reductions, https://www.iea.org/publications/freepublications/publication/CarbonCaptureandStorageThesolutionfordeepemissionsreductions.pdf; Society of Petroleum Engineers, 2017, CO2 Storage Resources Management System, https://www.spe.org/industry/docs/SRMS.pdf.

19
estimate their storage capacities, thereby enhancing the tools available to identify and select secure CO2 storage sites. More specifically, studies have advanced storage practices and technologies in several key areas: 1) improvement of the quantitative ability to estimate volumetric storage capacities using data on CO2 storage efficiencies and storage rates;138 2) improvement of the available methods for the identification of robust storage sites;139 3) better management of subsurface CO2 including reservoir pressure response and build up in saline reservoirs;140 4) assessment of new storage resources such as in the offshore, depleted gas reservoirs and residual oil zones.141
Summary of North American Storage Resources. Table from NETL (2015).142
138 See, e.g., Nicholas W. Bosshart et al., Quantifying the effects of depositional environment on deep saline formation CO2 storage efficiency and rate, 69 Int. J. Greenhouse Gas Control 8 (2018), https://doi.org/10.1016/j.ijggc.2017.12.006; Reza Ganjdanesh & Seyyed A. Hosseini, Development of an analytical simulation tool for storage capacity estimation of saline aquifers, 74 Int. J. Greenhouse Gas Control 142 (2018), https://doi.org/10.1016/j.ijggc.2018.04.017; Angela Goodman, Sean Sanguinito, and Jonathan S. Levine, Prospective CO2 saline resource estimation: Refinement of existing US-DOE-NETL methods based on data availability, 54 Int. J. Greenhouse Gas Control 242 (2016), http://dx.doi.org/10.1016/j.ijggc.2016.09.009. 139 See, e.g., Rebecca Allen et al., 2017, Ranking and categorizing large-scale saline aquifer formations based on optimized CO2 storage potentials and economic factors, 65 Int. J. of Greenhouse Gas Control 182, http://dx.doi.org/10.1016/j.ijggc.2017.07.023; Stefan Iglauer, Optimum storage depths for structural CO2 trapping, 77 Int. J. Greenhouse Gas Control 82 (2018), https://doi.org/10.1016/j.ijggc.2018.07.009. 140 Jens T. Birkholzer, Curtis M. Oldenburg, & Quanlin Zhou, CO2 migration and pressure evolution in deep saline aquifers, 40 Int. J. Greenhouse Gas Control 203 (2015), http://dx.doi.org/10.1016/j.ijggc.2015.03.022. 141 See, e.g., Stefan Bachu, Review of CO2 storage efficiency in deep saline aquifers, 40 Int. J. of Greenhouse Gas Control 188 (2015), http://dx.doi.org/10.1016/j.ijggc.2015.01.007; Amy L. Clarke et al., Application of material balance methods to CO2 storage capacity estimation within selected depleted gas reservoirs, 23 Petroleum Geoscience 339 (2017), https://doi.org/10.1144/petgeo2016-052, (Attach. L); David L. Carr et al., CO2 Sequestration Capacity Sectors in Miocene Strata of the Offshore Texas State Waters, 5 Gulf Coast Association of Geological Societies Journal 130 (2016) (Attach. M); IEA Greenhouse Gas R&D Programme, International Energy Agency, IEAGHG Technical Report 2017-01: Case Studies of CO2 Storage in Depleted Oil and Gas Fields, IEA-GHG R&D (2017), https://ieaghg.org/docs/General_Docs/Reports/2017-01.pdf. 142 National Energy Technology Laboratory, U.S. Department of Energy, Carbon Storage Atlas 3 (5th ed. 2015), https://www.netl.doe.gov/research/coal/carbon-storage-1/atlasv.

20
2016 DECADE-LONG NETL CARBONSAFE INITIATIVE WILL ASSIST IN DEVELOPING LARGE ONSHORE AND OFFSHORE CARBON STORAGE RESOURCES In late 2016, DOE, following the end of its successful decade-long Regional Carbon Storage Partnerships (RCSP) effort, initiated a new phase of its efforts to advance carbon storage technology. In November 2016, DOE launched the “CarbonSAFE” program by awarding $44 MM to support and promote the development of carbon storage sites with the potential to store over 50 Mt of CO2 by 2026, building on learning from its RCSP program.143 144 There are 16 CarbonSAFE storage projects currently receiving federal funding as illustrated in the table below.
CarbonSAFE map shows locations of projects in table below.145
List of NETL CarbonSAFE Projects as of September 2018.146 CarbonSAFE is an extension of the research efforts initiated in the regional sequestration partnerships. There are two phases of funded CarbonSAFE projects: Phase I: Pre-Feasibility studies in Wyoming, Illinois, Texas Gulf Coast, Utah, Nebraska, Kansas, Rocky Mountains, Washington State (onshore
143 See National Energy Technology Laboratory, U.S. Department of Energy, CarbonSAFE, https://www.netl.doe.gov/research/coal/carbon-storage-1/storage-infrastructure/carbonsafe. 144 See National Energy Technology Laboratory, U.S. Department of Energy, Energy Department Announces more than $44 Million for CO2 Storage Projects (2016), https://netl.doe.gov/newsroom/news-releases/news-details?id=8dc33ed0-b938-442b-812e-9c4d453f58fe. 145 National Energy Technology Laboratory, supra note 143. 146 See id.

21
and offshore) Central Appalachian Basin, California, North Dakota, and Louisiana, and, Phase II: Storage complex feasibility studies in Mississippi, North Dakota, and the Illinois Basin. One important Phase II CarbonSAFE project is already showing promise as an option to be a major hub for geologic sequestration in the southeast U.S. Southern States Energy Board and Southern Company Kemper County Mississippi’s ECO2S project (number 15 on the map above). The ECO2S project is a delineated and studied 30,000-acre area near the Kemper County energy facility.147 The consortium, formed in 2016, has, so far, drilled four wells into the Tuscaloosa Group, Washita-Fredricksburg Interval, and Paluxy Formation, which, together, show great promise to store large volumes of CO2 in its thick, stacked Cretaceous-age sandstones which lie beneath a thick mudstone caprock. These low cost ($2-$4 per metric tonne) highly porous and permeable saline reservoirs (e.g. 30% porosity and Darcy-class permeability in the Paluxy) may be able to accommodate large commercial CO2 volumes, and has potential to provide a regional storage hub for Mississippi and other Southeast states. CO2 SEQUESTRATION IN OIL FIELDS CO2 injected for EOR does not simply produce oil but can be sequestered in the process. CO2-EOR provides revenue to offset the added costs of carbon sequestration. The term “incidental” or “associated” storage is used to describe CO2 that is trapped in the process of producing oil with CO2 flooding. In addition to proving storage through monitoring and verification, storage in EOR settings requires CO2 separation and recycling facilities to recapture CO2 from the produced oil for reinjection such that the CO2 does not return to the atmosphere. Several studies have assessed the ability of CO2-EOR to sequester carbon dioxide and/or reduce the carbon intensity of oil production.148 EOR storage offers some advantages over storage in saline formations: 1) the EOR industry possess long experience in managing, injecting and tracking injected CO2, and possess the know-how to manage CO2 projects; 2) depleted oil fields with long operating histories offer known reservoir capacities, injectivities and other characteristics, can today accept large volumes of CO2 for tertiary oil production and subsequent storage; 3) EOR fields are generally equipped with the facilities to manage and inject CO2; 4) oil fields are proven geologic traps by nature, known for their ability to hold oil and gas for millions of years; 5) multiple injection and production wells offer the potential to manage the subsurface CO2 plume; 6) the opportunity for stacked storage in associated saline water-bearing formations in the EOR fields enhances local storage capacity and storage options; and 7) the added revenues from EOR can drive investment in CO2 capture, transportation, injection, and monitoring infrastructure, which can be transferred to saline sequestration at a potentially lower cost than in greenfield saline sequestration.149
147 Southern States Energy Board, CarbonSAFE: Establishing an early CO2 storage complex in Kemper County, Mississippi: Project ECO2S (2018), https://www.netl.doe.gov/File%20Library/Events/2018/mastering/monday/D-Riestenberg-CarbonSAFE-Project-ECO2S.pdf. 148 See, e.g., International Energy Agency, Storing CO2 through Enhanced Oil Recovery (2015), https://www.iea.org/publications/insights/insightpublications/Storing_CO2_through_Enhanced_Oil_Recovery.pdf. 149 Bruce Hill et al., Geologic Carbon Storage Through Enhanced Oil Recovery, 37 Energy Procedia 6808, 6811 (2013), https://www.sciencedirect.com/science/article/pii/S1876610213008576.
22
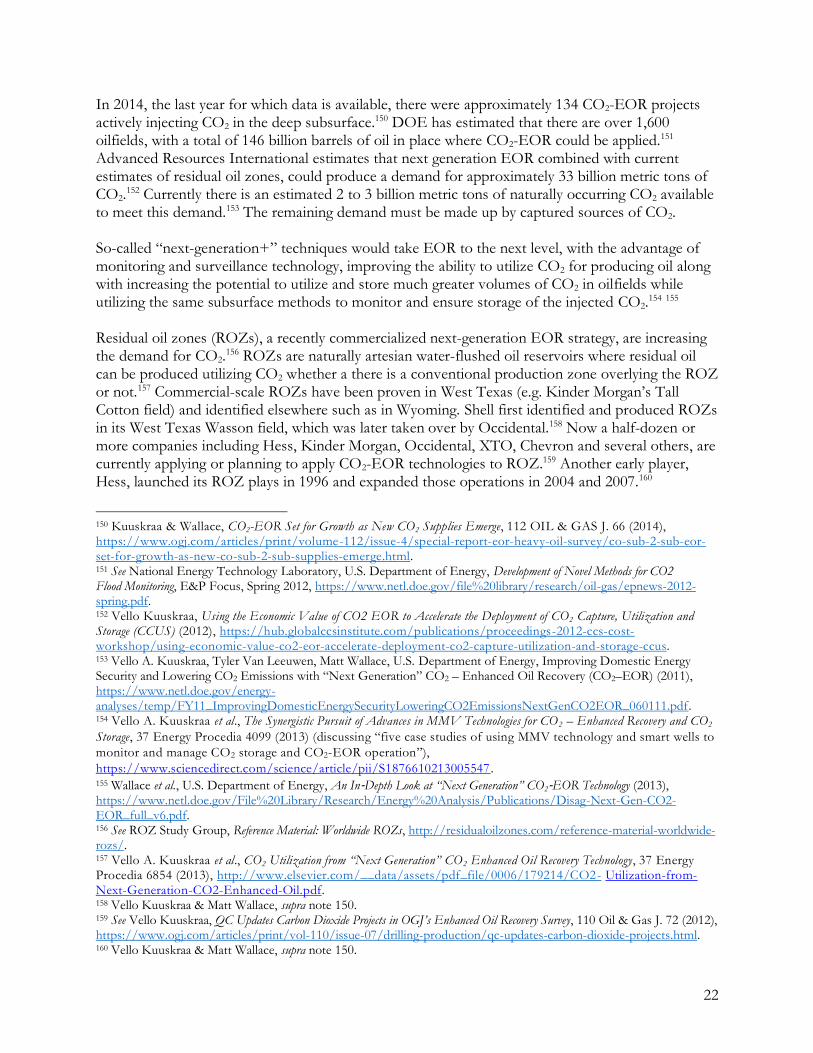
In 2014, the last year for which data is available, there were approximately 134 CO2-EOR projects actively injecting CO2 in the deep subsurface.150 DOE has estimated that there are over 1,600 oilfields, with a total of 146 billion barrels of oil in place where CO2-EOR could be applied.151 Advanced Resources International estimates that next generation EOR combined with current estimates of residual oil zones, could produce a demand for approximately 33 billion metric tons of CO2.
152 Currently there is an estimated 2 to 3 billion metric tons of naturally occurring CO2 available to meet this demand.153 The remaining demand must be made up by captured sources of CO2. So-called “next-generation+” techniques would take EOR to the next level, with the advantage of monitoring and surveillance technology, improving the ability to utilize CO2 for producing oil along with increasing the potential to utilize and store much greater volumes of CO2 in oilfields while utilizing the same subsurface methods to monitor and ensure storage of the injected CO2.
154 155 Residual oil zones (ROZs), a recently commercialized next-generation EOR strategy, are increasing the demand for CO2.
156 ROZs are naturally artesian water-flushed oil reservoirs where residual oil can be produced utilizing CO2 whether a there is a conventional production zone overlying the ROZ or not.157 Commercial-scale ROZs have been proven in West Texas (e.g. Kinder Morgan’s Tall Cotton field) and identified elsewhere such as in Wyoming. Shell first identified and produced ROZs in its West Texas Wasson field, which was later taken over by Occidental.158 Now a half-dozen or more companies including Hess, Kinder Morgan, Occidental, XTO, Chevron and several others, are currently applying or planning to apply CO2-EOR technologies to ROZ.159 Another early player, Hess, launched its ROZ plays in 1996 and expanded those operations in 2004 and 2007.160
150 Kuuskraa & Wallace, CO2-EOR Set for Growth as New CO2 Supplies Emerge, 112 OIL & GAS J. 66 (2014), https://www.ogj.com/articles/print/volume-112/issue-4/special-report-eor-heavy-oil-survey/co-sub-2-sub-eor-set-for-growth-as-new-co-sub-2-sub-supplies-emerge.html. 151 See National Energy Technology Laboratory, U.S. Department of Energy, Development of Novel Methods for CO2 Flood Monitoring, E&P Focus, Spring 2012, https://www.netl.doe.gov/file%20library/research/oil-gas/epnews-2012-spring.pdf. 152 Vello Kuuskraa, Using the Economic Value of CO2 EOR to Accelerate the Deployment of CO2 Capture, Utilization and Storage (CCUS) (2012), https://hub.globalccsinstitute.com/publications/proceedings-2012-ccs-cost-workshop/using-economic-value-co2-eor-accelerate-deployment-co2-capture-utilization-and-storage-ccus. 153 Vello A. Kuuskraa, Tyler Van Leeuwen, Matt Wallace, U.S. Department of Energy, Improving Domestic Energy Security and Lowering CO2 Emissions with “Next Generation” CO2 – Enhanced Oil Recovery (CO2–EOR) (2011), https://www.netl.doe.gov/energy-analyses/temp/FY11_ImprovingDomesticEnergySecurityLoweringCO2EmissionsNextGenCO2EOR_060111.pdf. 154 Vello A. Kuuskraa et al., The Synergistic Pursuit of Advances in MMV Technologies for CO2 – Enhanced Recovery and CO2
Storage, 37 Energy Procedia 4099 (2013) (discussing “five case studies of using MMV technology and smart wells to
monitor and manage CO2 storage and CO2-EOR operation”),
https://www.sciencedirect.com/science/article/pii/S1876610213005547. 155 Wallace et al., U.S. Department of Energy, An In‐Depth Look at “Next Generation” CO2‐EOR Technology (2013), https://www.netl.doe.gov/File%20Library/Research/Energy%20Analysis/Publications/Disag-Next-Gen-CO2-EOR_full_v6.pdf. 156 See ROZ Study Group, Reference Material: Worldwide ROZs, http://residualoilzones.com/reference-material-worldwide-rozs/. 157 Vello A. Kuuskraa et al., CO2 Utilization from “Next Generation” CO2 Enhanced Oil Recovery Technology, 37 Energy Procedia 6854 (2013), http://www.elsevier.com/__data/assets/pdf_file/0006/179214/CO2- Utilization-from-Next-Generation-CO2-Enhanced-Oil.pdf. 158 Vello Kuuskraa & Matt Wallace, supra note 150. 159 See Vello Kuuskraa, QC Updates Carbon Dioxide Projects in OGJ’s Enhanced Oil Recovery Survey, 110 Oil & Gas J. 72 (2012), https://www.ogj.com/articles/print/vol-110/issue-07/drilling-production/qc-updates-carbon-dioxide-projects.html. 160 Vello Kuuskraa & Matt Wallace, supra note 150.

23
In summary, the long commercial experience with deep geologic CO2 injection, the continuously expanding infrastructure that accompanies CO2-EOR, accompanied by the rising demand for CO2, renders oilfields a viable option for sequestering CO2 captured from EGUs in the U.S.
Illustration showing residual oil zones (ROZ) below existing oilfields. Residual oil zones may also exist where there
is no conventional production interval. Source: Advanced Resources International.161
STACKED SALINE STORAGE IN OILFIELDS Another potential storage opportunity takes advantage of existing infrastructure for EOR to store CO2 in geologic formations that are associated with producing formations. This is called stacked saline storage. In oilfields, the characteristic sedimentary sequences often include repeating layers of interbedded sandstone and mudstone that represent opportunities for storing CO2. Stacked storage takes advantage of these repeating sequences of geology to build storage capacity vertically. See illustration below. Utilizing multiple formation sections for storage is advantageous because injected CO2 may be spread out throughout the geologic section instead of creating one large single CO2 plume. Also, commercial pipelines and injection facilities used for EOR may now be repurposed for saline storage within the EOR fields. Stacked geologic carbon storage may be an opportunity to store CO2 at a lower cost because of the existing facilities which could reduce cost at the outset.
161 Kuuskraa et al., supra note 157 at 6862.

24
Illustrations above-- Left: J.C. Pashin et al., Southeastern Regional Carbon Sequestration Partnership (SECARB) Phase III:
Final Report prepared for Advanced Resources International, at 57 (2008) (illustration of stacked saline storage). Right: Sus an
Hovorka, TX BEG modified from Noel Tyler and William A. Ambros, Facies architecture and production characteristics of strand
plain reservoirs in North Markham – North Bay City Field, Frio Formation, Texas, 70 AAPG BULL. 809-829 (July 1986)
(illustration of layered oil, gas and saline formations (and intervening caprock in white) at the SECARB Frio project, Texas that
could be accessed in stacked storage).
TODAY’S SUPERCRITICAL CO2 PIPELINE SYSTEM DEMONSTRATES THE COMMERICAL AVAILABILITY OF CO2 PIPELINES Pipeline networks will play an important role in providing storage opportunities for CO2 storage from coal plants not located above or adjacent to a storage basin. Pipelines are a mature and safe CO2 commercial transport method that have been proven by decades of use as evidenced by the >4,500 miles of CO2 pipelines in the United States today. In total this pipeline system, which spans a dozen states and neighboring Canada, carries about 68 million tons per year of natural and anthropogenic CO2 and has continued to grow to meet demand from the EOR industry.162 At this time, about 20% of the CO2 is from captured sources, and the remainder is naturally sourced CO2. However, according to NETL in a 2015 report, EOR alone could absorb 400 MT of CO2 per year, 85% of which would be from captured sources.163 NRG Petra Nova’s W.A. Parish Plant in Thompsons, Texas, is America’s first commercial scale full-chain post combustion capture CCUS project and demonstrates the ability to capture and transport CO2 for geologic storage.164 1.4 Mt of supercritical CO2 per year is delivered from the Parish plant to the West Ranch Field through a newly-constructed 12-inch diameter supercritical pipeline 82 miles
162 National Energy Technology Laboratory, U.S. Department of Energy, A Review of the CO2 Pipeline Infrastructure in the U.S. (2015), https://www.energy.gov/sites/prod/files/2015/04/f22/QER%20Analysis%20-%20A%20Review%20of%20the%20CO2%20Pipeline%20Infrastructure%20in%20the%20U.S_0.pdf 163 Id. 164 National Energy Technology Laboratory, U.S. Department of Energy, Recovery Act: Petra Nova Parish Holdings: W.A. Parish Post-Combustion CO2 Capture and Sequestration Project, https://www.netl.doe.gov/research/coal/project-information/fe0003311.

25
to the south. The project is on track to deliver CO2 to the EOR site for 20 years.165 The project has been operating successfully for several years, starting December 2016 and reported capturing and transporting 1 Mt of CO2 in the first 10 months of operations and boosting oil production 1300%. 166 The plant is designed to capture the 1.4 Mtpa of CO2 from a 240 MWe slipstream from boiler #8 and transporting the 99% purity CO2 to the Hilcorp West Ranch Field for EOR. A storage monitoring plan for the project was designed by Texas Bureau of Economic Geology. Air Products’ CO2 , captured from two existing steam methane reformers at the Valero Refinery in Port Arthur, Texas, was connected by a spur to Denbury’s Green Pipeline in 2013.167 The captured CO2 is delivered for injection into Denbury’s Onshore EOR operations at Hastings Field in Houston.168 Approximately 1 Mtpa of CO2 or 90 percent is recovered and purified at the plant and transported by pipeline.169 The project started full-scale operations in April 2013 and is still successfully operating today. MODELING STUDIES DEMONSTRATE HOW PIPELINE NETWORKS CAN BE BUILT TO TRANSPORT CAPTURED CO2 TO SEQUESTRATION SITES. Numerous studies over the past decade have examined the potential for a nationwide network of pipelines for CO2 transport. Different methods and considerations were used in each case to connect sources to suitable storage sites, with some using direct point-to-point routes, and others considering aggregating emission from multiple sources into a trunk line. The results of those analyses demonstrate the necessity for, and viability of a network of U.S. CO2 pipelines to transport large volumes of CO2 necessary to meet climate objectives. In one of the most comprehensive studies NETL (2011) looked at the 388 large coal plants existing nearly a decade ago, and found that 84% of them were within 25 miles of storage, 97% were within 100 miles of storage – 322 of the 323 GW examined were within 150 miles of storage.170 NETL found that “both transport and storage requirements for retrofits at a significant number of sites have a good chance of being met. The report also details expansions of the pipeline system that were planned at the time of the report and modeled EIA-NEMS analysis to investigate a range of pipeline expansion scenarios. A modeled 2030 case projected 56 new pipeline segments and 11,000 miles of new pipelines, primarily from electric power plants to EOR projects and saline storage sites, based on a tripling of carbon capture in the U.S, with 99% coming from electric utilities. Pipelines were built at an average cost of $562,000 per mile with 323 million per mile for interstate pipelines and $624 million per mile for intrastate pipelines. Note that pipeline transportation costs are difficult to predict in general because they are dependent upon volume of CO2 moved through them, terrain,
165 Wikipedia, the Free Encyclopedia, Petra Nova, https://en.wikipedia.org/wiki/Petra_Nova. 166 See NRG Energy, Inc., Carbon capture and the future of coal power, https://www.nrg.com/case-studies/petra-nova.html. 167 Global CCS Institute, Air Products Steam Methane Reformer EOR Project (2017), http://www.globalccsinstitute.com/project/air-products-steam-methane-reformer-eor-project; MIT, Port Arthur Fact Sheet: Carbon Dioxide Capture and Storage Project, https://sequestration.mit.edu/tools/projects/port_arthur.html. 168 Denbury Resources, Naturally Occurring CO2 Sources, http://www.denbury.com/operations/gulf-coast-region/co2-sources-and-pipelines/default.aspx. 169 See supra note 167. 170 National Energy Technology Laboratory, U.S. Department of Energy, Coal-Fired Power Plants in the United States: Examinations of the Costs of Retrofitting with CO2 Capture Technologies, Revision 3 (2011), https://www.netl.doe.gov/File%20Library/Research/Energy%20Analysis/Publications/GIS_CCS_retrofit.pdf .
26
and population restrictions. Additional NETL pipeline analysis published in 2015 found that if a CO2 emissions cap was imposed of 40% of 2005 levels by 2030 and 80% by 2050, 15,194 miles (24,452 km) of pipeline would exist by 2040, with 79% of this being direct source-sink.171 A 2010 DOE/NETL study examined transportation from plants to storage basins estimated transport costs to be $3.65 per tonne.
Other studies demonstrating CO2 pipeline feasibility include:
• A 2009 study modeled potential pipeline buildout scenarios for CO2 pipelines.172 The study showed that to limit the atmospheric CO2 levels to 450 ppm and 550 ppm, 23,000 miles (37,014 km) or 11,000 miles (17,702 km) respectively would be needed - and could be built - by 2050. The study concluded that the need to increase the size of existing dedicated CO2 pipeline system should not be seen as a major obstacle for the commercial deployment of CCS technologies in the United States.
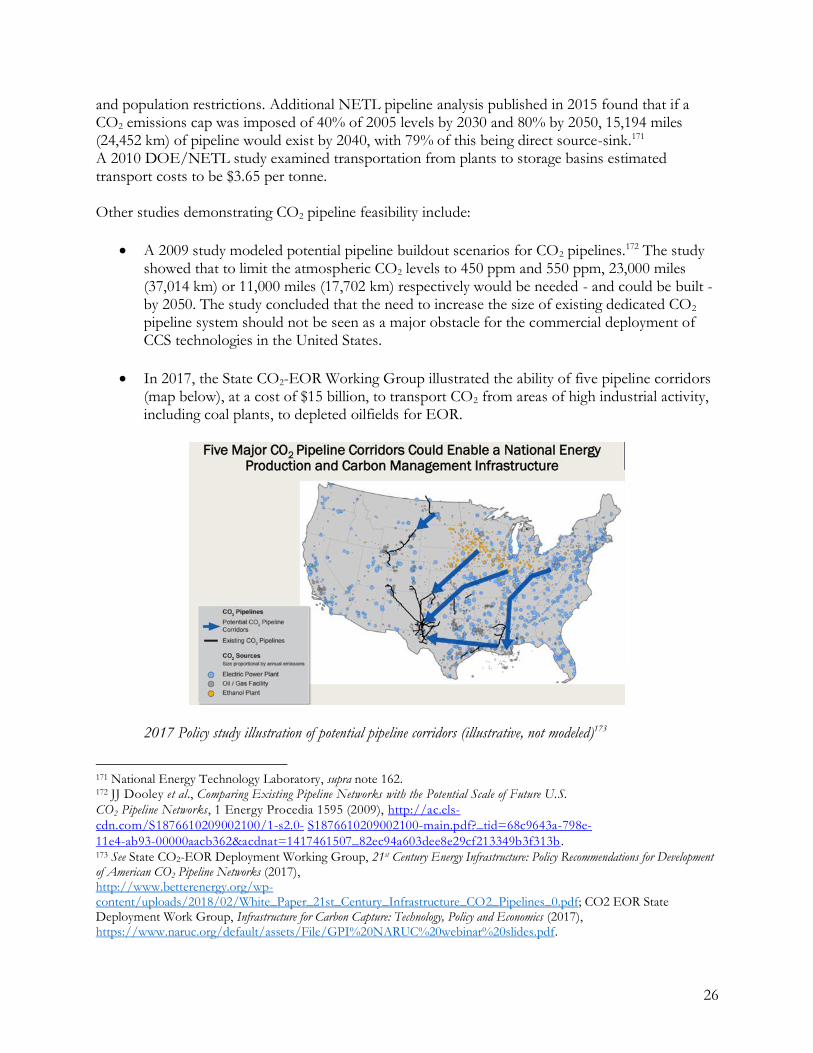
• In 2017, the State CO2-EOR Working Group illustrated the ability of five pipeline corridors (map below), at a cost of $15 billion, to transport CO2 from areas of high industrial activity, including coal plants, to depleted oilfields for EOR.
2017 Policy study illustration of potential pipeline corridors (illustrative, not modeled)173
171 National Energy Technology Laboratory, supra note 162. 172 JJ Dooley et al., Comparing Existing Pipeline Networks with the Potential Scale of Future U.S.
CO2 Pipeline Networks, 1 Energy Procedia 1595 (2009), http://ac.els-
cdn.com/S1876610209002100/1-s2.0- S1876610209002100-main.pdf?_tid=68c9643a-798e-
11e4-ab93-00000aacb362&acdnat=1417461507_82ec94a603dee8e29cf213349b3f313b. 173 See State CO2-EOR Deployment Working Group, 21st Century Energy Infrastructure: Policy Recommendations for Development of American CO2 Pipeline Networks (2017), http://www.betterenergy.org/wp-content/uploads/2018/02/White_Paper_21st_Century_Infrastructure_CO2_Pipelines_0.pdf; CO2 EOR State Deployment Work Group, Infrastructure for Carbon Capture: Technology, Policy and Economics (2017), https://www.naruc.org/default/assets/File/GPI%20NARUC%20webinar%20slides.pdf.

27
• Zelek, et al., (2012) NEMS-CCUS model results found that captured emissions were stored, in general, within 100 miles of the source via direct pipelines.174
• A 2018 Princeton study demonstrates the feasibility of linking Midwest CO2 sources by pipeline, proposing several pipeline corridors (see figure below) that could provide a capacity of 19-30 million tonnes per year linking low cost CO2 sources from ethanol refineries in the Midwest to dedicated geological storage resources in West Texas and the Permian Basin or Wyoming.175
Map of modeled potential carbon dioxide pipelines from Edwards and Celia (2018).176 A 2014 NETL publication describes DOE’s transport cost model designed to estimate the price of CO2 transported, broken out by region, covering all costs, including a return on investment on 12, 16 and 20-inch diameter pipelines.177 The report also cites a variety of previous estimates of cost including, for example, Kinder Morgan’s pipeline cost metrics, shown in the table below.
174 Charles A. Zelek et al., NEMS-CCUS: A Model and Framework for Comprehensive Assessment of CCUS and Infrastructure (2012), https://www.netl.doe.gov/File%20Library/Research/Energy%20Analysis/Publications/CMTC150377-NEMS_CCUS.pdf. 175 Ryan Edwards & Michael Celia, Infrastructure to enable deployment of carbon capture, utilization, and storage in the United States, 115 Proceedings of the National Academy of Sciences of the United States of America E8815 (2018), www.pnas.org/cgi/doi/10.1073/pnas.1806504115. 176 Id. 177 National Energy Technology Laboratory, U.S. Department of Energy, FE/NETL CO2 Transport Cost Model: Description and User’s Manual (2014), https://www.netl.doe.gov/File%20Library/Research/Energy%20Analysis/Publications/co2-transp-cost-model-desc-user-man-v1-2014-07-11.pdf.

28
NEW SOURCE-SINK ANALYSIS INDICATES THAT ALL AFFECTED SOURCES ARE WITHIN A REASONABLE DISTANCE OF A STORAGE BASIN.
In the proposed Affordable Clean Energy Plan (ACE), states are expected to evaluate the “candidate technologies” in establishing a standard of performance for each particular source and may take into consideration the individual characteristics of that source. As we have argued previously in these comments, the ACE rule failed to analyze CCS technology as a BSER and did not include it in the candidate technologies. This failure included considering the availability of geologic carbon storage for the affected sources.
Despite determining that the building block approach was the BSER under the Clean Power Plan, EPA analyzed saline and EOR-based sequestration capacity in the U.S. and existing sources. In the CPP RIA EPA provided a simple map of available sequestration opportunities and pipelines, concluding that:178
“Geologic sequestration (GS) (i.e., long-term containment of a CO2 stream in subsurface geologic formations)
is technically feasible and available throughout most of the United States. (emphasis added).
Clean Air Task Force commissioned a study which built on this map to illustrate the availability of geologic storage for affected plants. The study demonstrates each source can be matched to a reasonable storage site, further supporting inclusion of CCS in the BSER.
178 CPP RIA at 2-34.
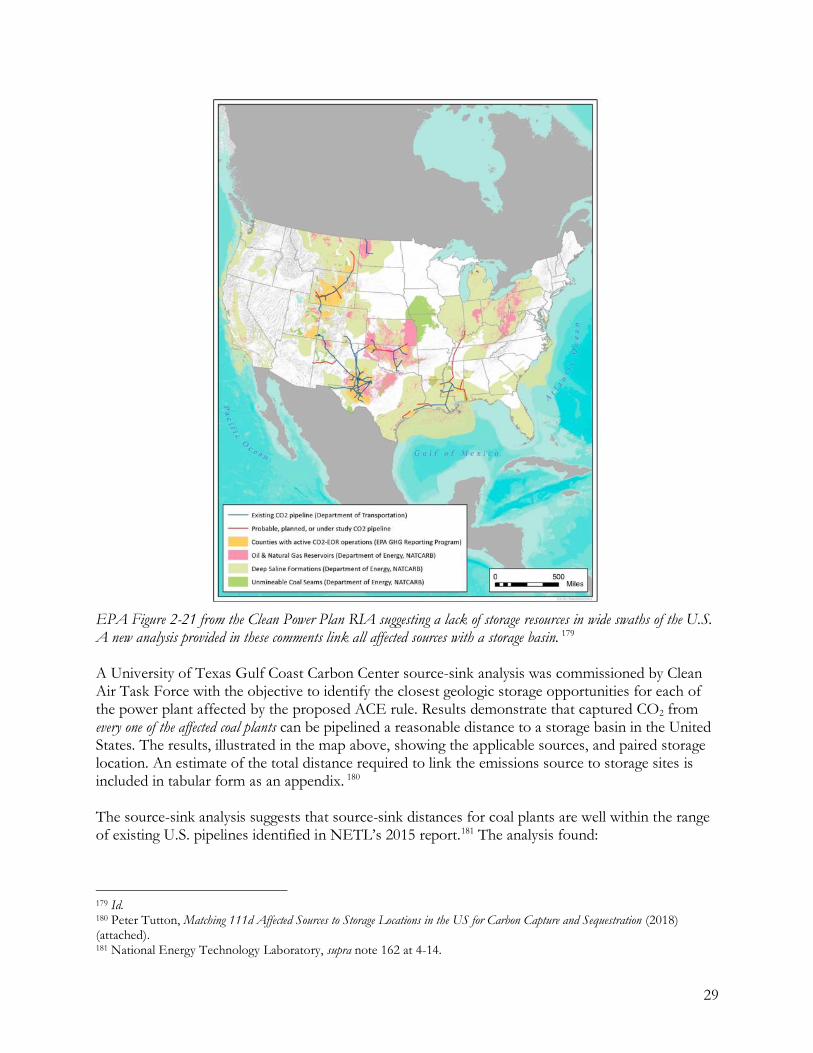
29
EPA Figure 2-21 from the Clean Power Plan RIA suggesting a lack of storage resources in wide swaths of the U.S. A new analysis provided in these comments link all affected sources with a storage basin. 179 A University of Texas Gulf Coast Carbon Center source-sink analysis was commissioned by Clean Air Task Force with the objective to identify the closest geologic storage opportunities for each of the power plant affected by the proposed ACE rule. Results demonstrate that captured CO2 from every one of the affected coal plants can be pipelined a reasonable distance to a storage basin in the United States. The results, illustrated in the map above, showing the applicable sources, and paired storage location. An estimate of the total distance required to link the emissions source to storage sites is included in tabular form as an appendix. 180 The source-sink analysis suggests that source-sink distances for coal plants are well within the range of existing U.S. pipelines identified in NETL’s 2015 report.181 The analysis found:
179 Id. 180 Peter Tutton, Matching 111d Affected Sources to Storage Locations in the US for Carbon Capture and Sequestration (2018) (attached). 181 National Energy Technology Laboratory, supra note 162 at 4-14.

30
• 25% of plants are less than 50 km (31) miles from a potential geologic storage basin.
• 50% the plants are within a distance of 12 km (8 miles) (median value).
• 95% of the plants are within 200 km (125 miles) or less from a geologic sink.
• Only 14 of the 286 plants exceed a 200 km (124 mile) distance, ranging from 201 km (125 mi) to 349 km (216 miles). Of those, only 5 plants exceed 300 km (186 mi).
For comparison:
• The CO2 pipeline from the commercially successful post combustion capture at the Petra Nova power plant extends 82 miles south to the West Ranch Field.
• The CO2 pipeline from Dakota gasification to Weyburn field is 329 km (204 miles) a distance at which only 3 plants subject to the rule exceed.
• In the West Texas Permian Basin, trunk lines range from 183 km (113 mi) to 810 km (502 mi).
• Distribution lines in the Permian range from 6 km (4 mi) to 23 km (14 mi).
• In the Rocky Mountains CO2 pipelines range from 48 km (30 mi) to 371 km. (230 mi).
• In the Gulf Coast pipelines range from 81 km (50 mi) to 550 km (314 mi).
Above: Histogram displaying numbers of sources in 50 km (31 mi) increments from source to sink analysis. For example, the (0, 50) bins are all plants that are 0-50 km from a storage basin, of which there are 209 sources of 286 total sources (73%). Source: P. Tutton for CATF analysis.
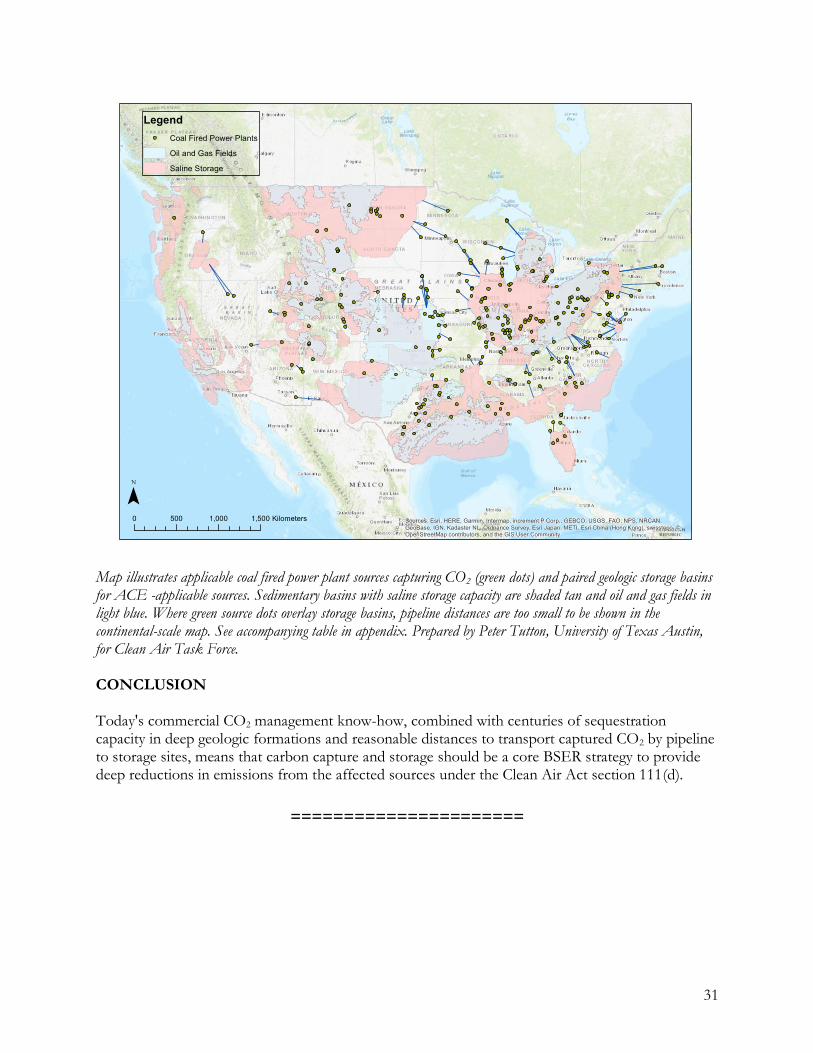
31
Map illustrates applicable coal fired power plant sources capturing CO2 (green dots) and paired geologic storage basins for ACE -applicable sources. Sedimentary basins with saline storage capacity are shaded tan and oil and gas fields in light blue. Where green source dots overlay storage basins, pipeline distances are too small to be shown in the continental-scale map. See accompanying table in appendix. Prepared by Peter Tutton, University of Texas Austin, for Clean Air Task Force. CONCLUSION Today's commercial CO2 management know-how, combined with centuries of sequestration capacity in deep geologic formations and reasonable distances to transport captured CO2 by pipeline to storage sites, means that carbon capture and storage should be a core BSER strategy to provide deep reductions in emissions from the affected sources under the Clean Air Act section 111(d).
======================
32
Matching 111d Affected Sources to Geologic Storage Locations in
the U.S. for Carbon Capture and Sequestration
30 October 2018
Peter Tutton M.S.
Gulf Coast Carbon Center
Bureau of Economic Geology
University of Texas at Austin
10611 Exploration Way,
Austin, Texas
78758
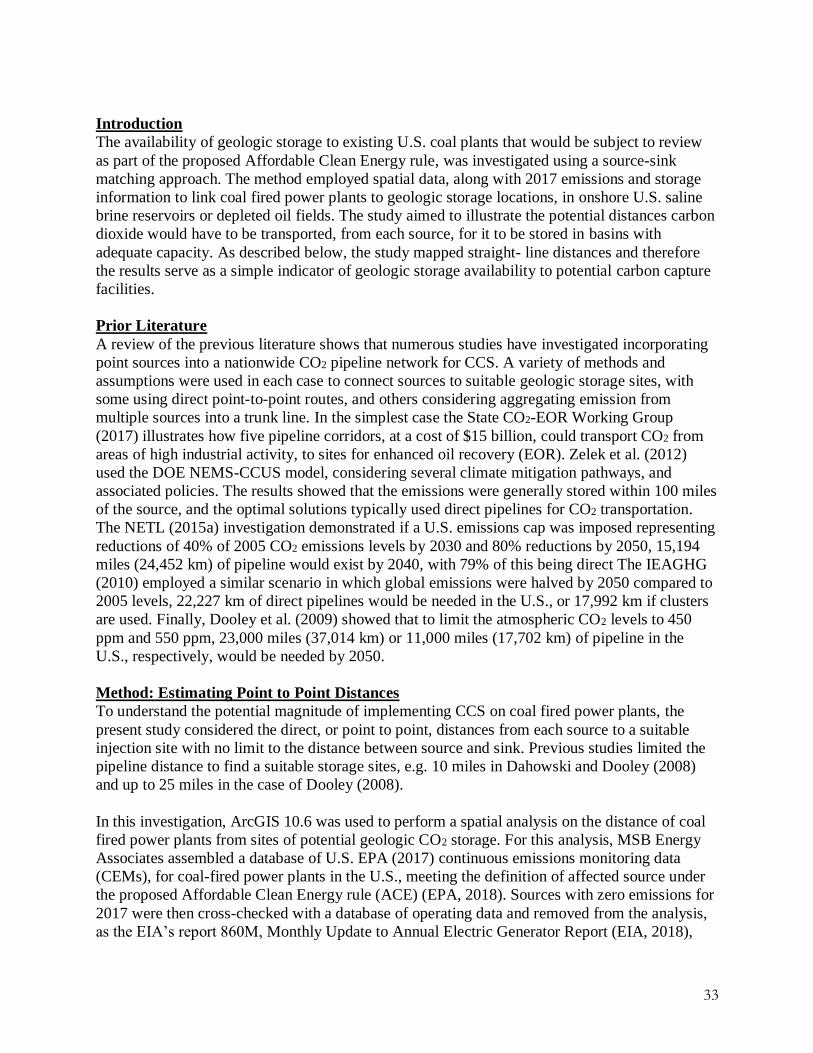
33
Introduction
The availability of geologic storage to existing U.S. coal plants that would be subject to review
as part of the proposed Affordable Clean Energy rule, was investigated using a source-sink
matching approach. The method employed spatial data, along with 2017 emissions and storage
information to link coal fired power plants to geologic storage locations, in onshore U.S. saline
brine reservoirs or depleted oil fields. The study aimed to illustrate the potential distances carbon
dioxide would have to be transported, from each source, for it to be stored in basins with
adequate capacity. As described below, the study mapped straight- line distances and therefore
the results serve as a simple indicator of geologic storage availability to potential carbon capture
facilities.
Prior Literature
A review of the previous literature shows that numerous studies have investigated incorporating
point sources into a nationwide CO2 pipeline network for CCS. A variety of methods and
assumptions were used in each case to connect sources to suitable geologic storage sites, with
some using direct point-to-point routes, and others considering aggregating emission from
multiple sources into a trunk line. In the simplest case the State CO2-EOR Working Group
(2017) illustrates how five pipeline corridors, at a cost of $15 billion, could transport CO2 from
areas of high industrial activity, to sites for enhanced oil recovery (EOR). Zelek et al. (2012)
used the DOE NEMS-CCUS model, considering several climate mitigation pathways, and
associated policies. The results showed that the emissions were generally stored within 100 miles
of the source, and the optimal solutions typically used direct pipelines for CO2 transportation.
The NETL (2015a) investigation demonstrated if a U.S. emissions cap was imposed representing
reductions of 40% of 2005 CO2 emissions levels by 2030 and 80% reductions by 2050, 15,194
miles (24,452 km) of pipeline would exist by 2040, with 79% of this being direct The IEAGHG
(2010) employed a similar scenario in which global emissions were halved by 2050 compared to
2005 levels, 22,227 km of direct pipelines would be needed in the U.S., or 17,992 km if clusters
are used. Finally, Dooley et al. (2009) showed that to limit the atmospheric CO2 levels to 450
ppm and 550 ppm, 23,000 miles (37,014 km) or 11,000 miles (17,702 km) of pipeline in the
U.S., respectively, would be needed by 2050.
Method: Estimating Point to Point Distances
To understand the potential magnitude of implementing CCS on coal fired power plants, the
present study considered the direct, or point to point, distances from each source to a suitable
injection site with no limit to the distance between source and sink. Previous studies limited the
pipeline distance to find a suitable storage sites, e.g. 10 miles in Dahowski and Dooley (2008)
and up to 25 miles in the case of Dooley (2008).
In this investigation, ArcGIS 10.6 was used to perform a spatial analysis on the distance of coal
fired power plants from sites of potential geologic CO2 storage. For this analysis, MSB Energy
Associates assembled a database of U.S. EPA (2017) continuous emissions monitoring data
(CEMs), for coal-fired power plants in the U.S., meeting the definition of affected source under
the proposed Affordable Clean Energy rule (ACE) (EPA, 2018). Sources with zero emissions for
2017 were then cross-checked with a database of operating data and removed from the analysis,
as the EIA’s report 860M, Monthly Update to Annual Electric Generator Report (EIA, 2018),

34
showed them either to be retired or not expected to return to service within the next year as
shown in Table 1. This resulted in a net 286 power plants, emitting a total of 1,213 million
metric tons of CO2 annually which were then matched to suitable storage sites using a method
developed by Tutton (2018).
Table 1. The coal fired power plants removed from the data set due to having zero emissions in
2017. The EIA report 860M (EIA, 2018) was used to determine the status of each plant.
In order to identify geologic basins with adequate capacity to store CO2, this analysis utilized the
DOE NatCarb database (NETL, 2015 b, c) which provides information for both saline
formations, as well as oil and gas fields. NETL estimated the storage capacity of saline
formations using a calculated volumetric capacity approach combining formation thickness and
rock properties, whereas the capacity for oil and gas fields was estimated with the benefit of
prior production data. The NETL database provided the potential magnitude, and locations, of
storage in the U.S. The 50th percentile (median) capacity factor (based on
porosity/thickness/area/storage efficiency) was selected from the NETL database for the storage
capacity of each basin. GIS was used to combine the areal extent of overlapping geologic
resources in order to further delineate storage basins (see map, Figure 6, below). The 50th
percentile (median) geologic storage capacity value of all the cells, were then summed for each
basin.
State County Plant ORIS-
ID
CO2
Emissions,
metric
tons
Status Current to July 2018
CO
Prowers
County Lamar 508 0
(OS) Out of service and NOT expected
to return to service in next calendar year
KY
Hancock
County Coleman 1381 0
(OS) Out of service and NOT expected
to return to service in next calendar year
KY
Webster
County Robert Reid 1383 0
(OS) Out of service and NOT expected
to return to service in next calendar year
MO
Boone
County Columbia 2123 0 (OP) Operating
NJ
Mercer
County
Mercer
Generating
Station 2408 0 Retired
WV
Kanawha
County Kanawha River 3936 0 Retired
MI
Hillsdale
County
Michigan Hub,
LLC 4259 0 Retired
MN
Cook
County
Taconite Harbor
Energy Center 10075 0 2 Units Operating and 1 Retired
NC
Bladen
County
NC Renewable
Power -
Elizabethtown 10380 0
(OS) Out of service and NOT expected
to return to service in next calendar year

35
Delineating oil and gas basins required an alternate approach to aggregate oilfields, represented
by 68,684 separate features in the dataset, into a workable oil and gas storage basin database. To
do this, depleted oil and gas fields within 10 km of each other were identified and combined into
basins, for the purposes of this analysis, and a basin outline was then drawn around all selected
fields. The 50th percentile (median) capacity estimate for each field within the aggregated basin
was then summed to give the overall basin capacity estimate, similar to the NETL basins and
capacities for saline storage.
In order to subdivide basins into potential injection sites, large basins were broken up into grid
cell-based features, each representing 300 million metric tons of storage, with a point placed at
the center (centroid point) of each cell as described below. This was achieved be rasterizing each
basin with a cell size calculated using the following equation (with the 300 representing the 300
million metric tons per cell):
𝐶𝑒𝑙𝑙 𝑆𝑖𝑧𝑒 = √𝐵𝑎𝑠𝑖𝑛 𝐴𝑟𝑒𝑎 ∙ 300
𝐵𝑎𝑠𝑖𝑛 𝐶𝑎𝑝𝑎𝑐𝑖𝑡𝑦
Once the feature had been rasterized it was converted to a point feature, resulting in a point at the
centroid of each raster cell, Figure 1. GIS was then used to match each coal fired power plant to
the nearest basin center of sufficient storage capacity to sequester the plant’s emissions. The
model was run based on a 40-year injection period as a conservative proxy for the remaining
lifetime emissions of each plant.
All the basins with storage greater than the expected project emissions were selected, and the
distance to the closest potential injection site (centroid point) contained within one of these
basins was then output. This rule applied to sources located within basins too. The distance to the
closest centroid, with sufficient capacity, was calculated, and as such sources weren’t allowed to
inject on site.
Figure 3 shows source and sink couples. Due to the magnitude of storage estimates, over 8,000
billion metric tons (NETL, 2015 b, c), some basins have closely spaced centroids giving the
appearance of pipelines terminating at a basin’s border. The expanded map, Figure 4, provides a
more detailed view, and shows that in each case they end at a centroid. Table 2 gives the distance
to the centroid within the basin.

36
(a)
(b)
Figure 1. NatCarb oil and gas data (NETL, 2015c) were converted into centroids as a proxy for
potential injection sites. A similar exercise was done for saline storage basins.
Findings
The results show that there is sufficient storage capacity within the United States to store
centuries of CO2 captured from applicable coal fired power plants. Additionally, the majority of
the plants are located within a reasonable distance of a storage site, with 73% of sources located
under 50 km away, and 95% located under 200 km away. In total, 13,183 km of pipeline would
be needed to individually link each emission source to the closest injection point.
It is important to note that the results are a simple representation of source to sink matching
based on lifetime plant emissions, 50th percentile (median) storage efficiency factor, and a
straight-line distance to the closest centroid within a basin that has adequate capacity. The

37
analysis does not consider routing factors and obstacles, or long interstate regional trunk-lines
(like the 232-mile Denbury Greencore Pipeline or the 273 -mile long Denbury Green pipeline
from Jackson MS to Houston, TX). Features such as trunk-lines may serve to increase the
efficiency of carbon dioxide transport.
Table 2. Percentile of emissions within a given distance of a suitable storage site, considering a
40-year injection period.
Percentile of Sources, % Distance, km
5 2.3
50 12.3
95 199.4
Figure 2. Histogram displaying numbers of sources in 50 km (31 mi) increments from source to
sink analysis. For example, the (0, 50) bins are all plants that are 0-50 km from a storage basin,
of which there are 209 sources of 286 total sources (73%). This only considered CEMS from
plants with non-zero emissions for 2017. Those with zero emission were removed as EIA 860M
(EIA, 2018) showed that these were either retired or unlikely to return to service within the next
year. The cumulative percentage of sources are shown above each bar.

38
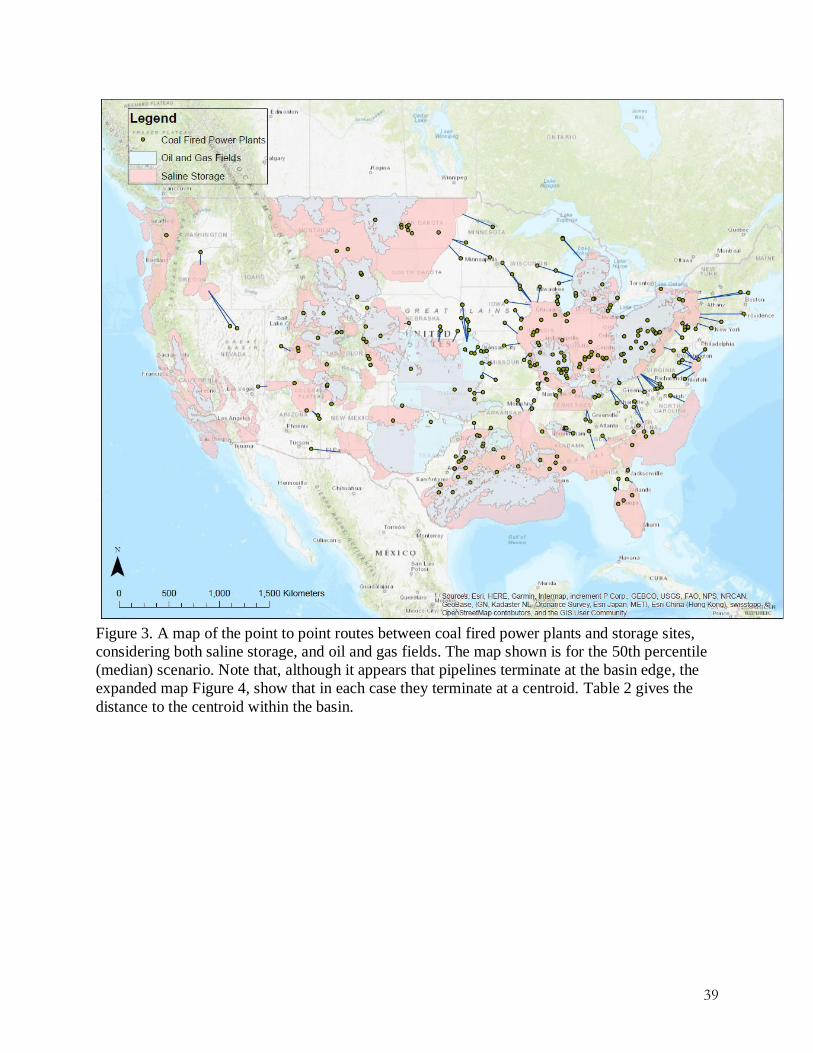
39
Figure 3. A map of the point to point routes between coal fired power plants and storage sites,
considering both saline storage, and oil and gas fields. The map shown is for the 50th percentile
(median) scenario. Note that, although it appears that pipelines terminate at the basin edge, the
expanded map Figure 4, show that in each case they terminate at a centroid. Table 2 gives the
distance to the centroid within the basin.
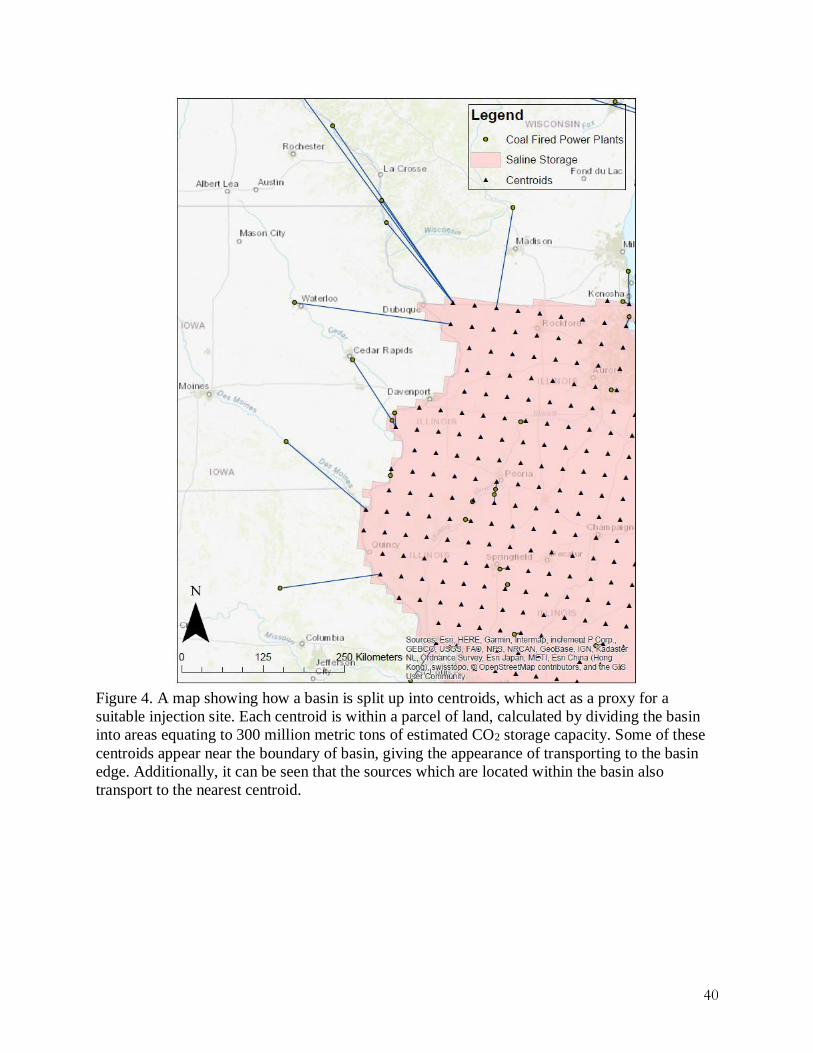
40
Figure 4. A map showing how a basin is split up into centroids, which act as a proxy for a
suitable injection site. Each centroid is within a parcel of land, calculated by dividing the basin
into areas equating to 300 million metric tons of estimated CO2 storage capacity. Some of these
centroids appear near the boundary of basin, giving the appearance of transporting to the basin
edge. Additionally, it can be seen that the sources which are located within the basin also
transport to the nearest centroid.
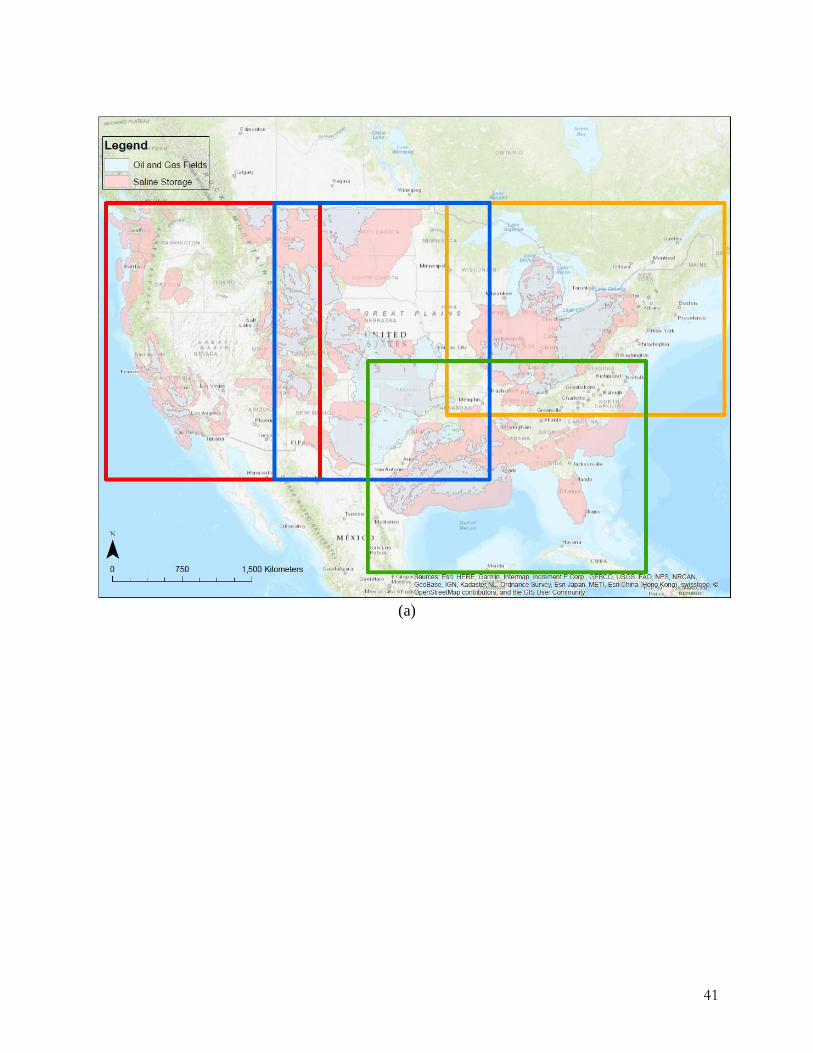
41
(a)
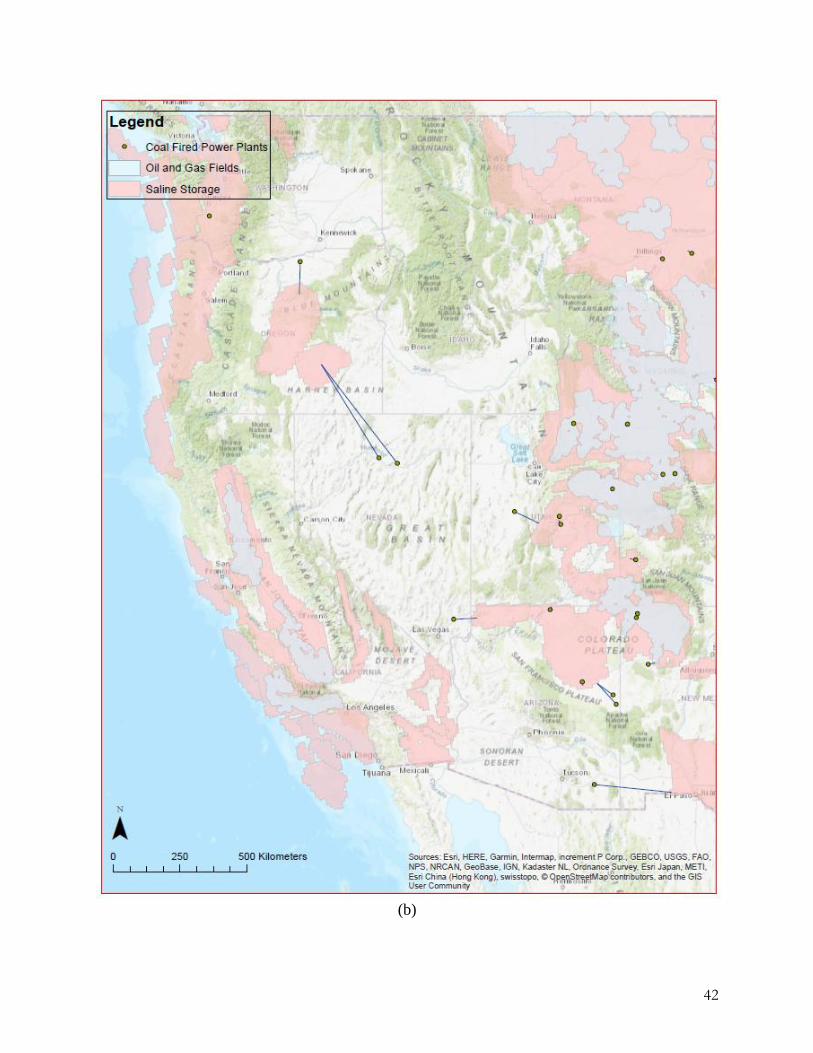
42
(b)

43
(c)

44
(d)
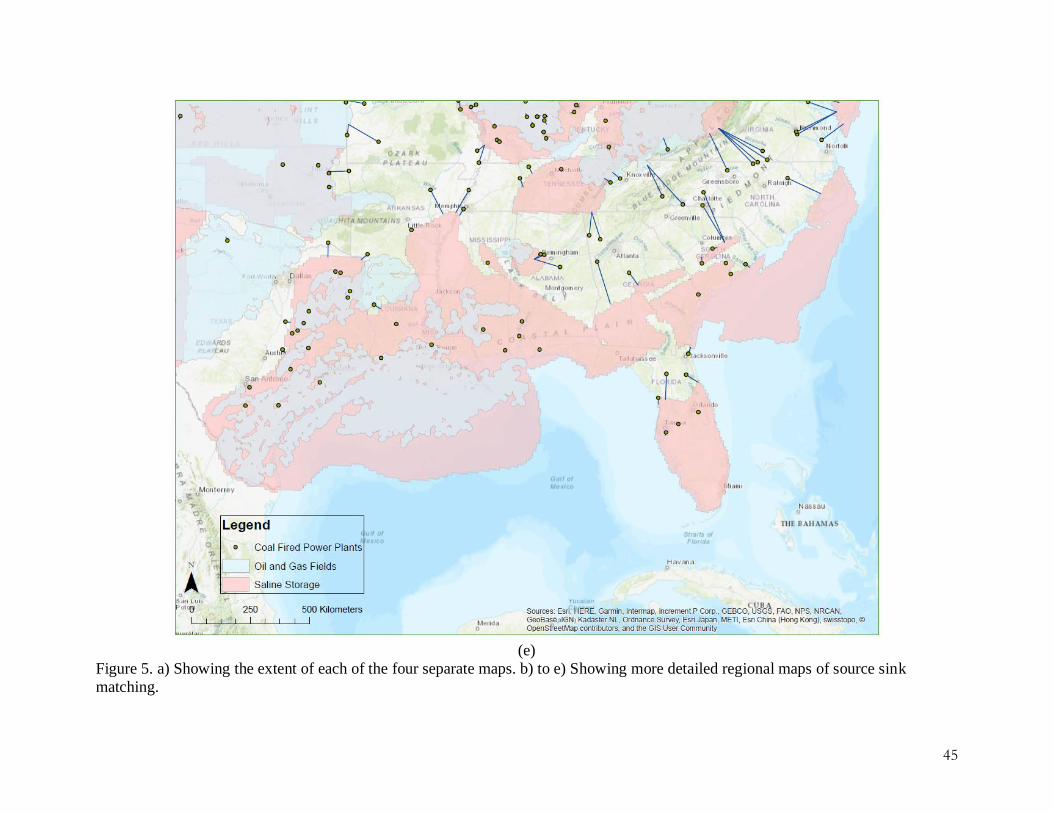
45
(e)
Figure 5. a) Showing the extent of each of the four separate maps. b) to e) Showing more detailed regional maps of source sink
matching.
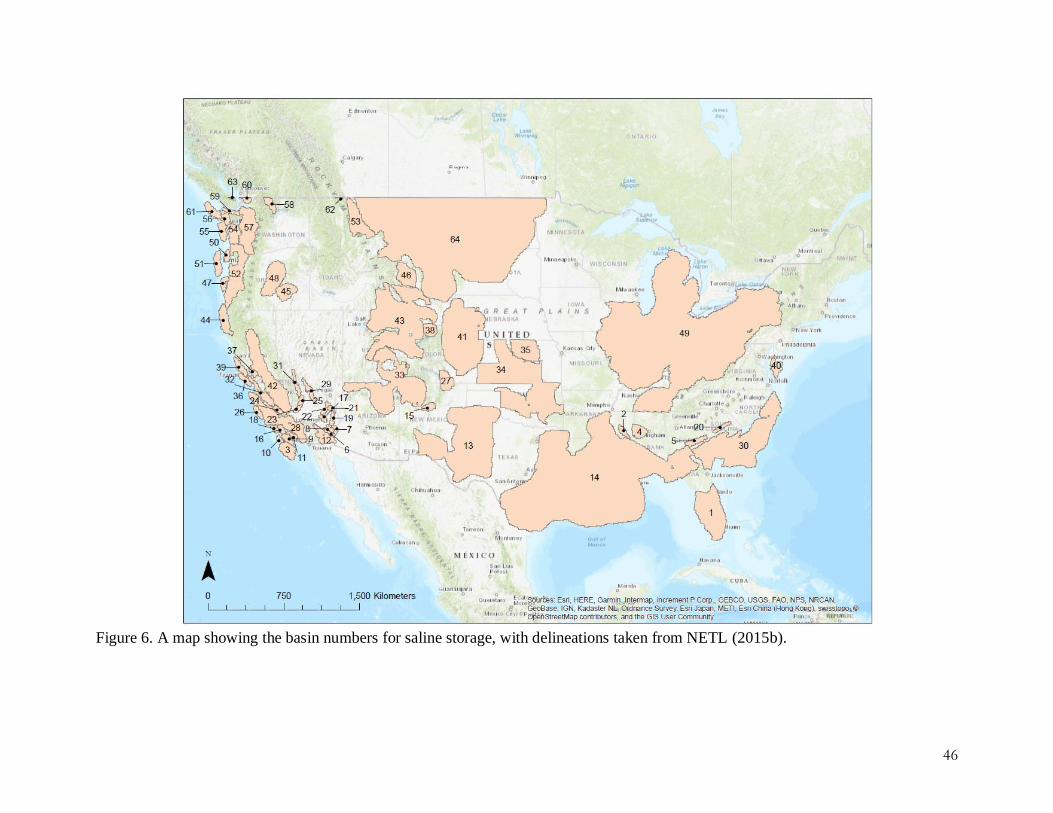
46
Figure 6. A map showing the basin numbers for saline storage, with delineations taken from NETL (2015b).

47
Figure 7. A map showing basin numbers for depleted oil and gas fields, with delineations adapted from NETL (2015c).

48
References
Dahowski, R.T., and Dooley, J.J. 2008. Source/Sink Matching for U.S. Ethanol Plants and
Candidate Deep Geologic Carbon Dioxide Storage Formations. PNNL-17831.
David, J., Herzog, H. 2000. The cost of carbon capture. Fifth International Conference on
Greenhouse Gas Control Technologies, Cairns, Australia.
Dooley, J.J., Dahowski, R.T., Davidson, C.L. 2009. Comparing Existing Pipeline Networks with
the Potential Scale of Future U.S. CO2 Pipeline Networks, Energy Procedia, Volume 1,
Issue 1, pp. 1595-1602.
Energy Information Administration (EIA). 2018. Preliminary Monthly Electric Generator
Inventory (based on Form EIA-860M as a supplement to Form EIA-860). Available at:
https://www.eia.gov/electricity/data/eia860m/
International Energy Agency Greenhouse Gas R&D Programme (IEAGHG). 2010. Development
of a global CO2 pipeline infrastructure, Report: 2010/13.
Middleton, R.S. and Bielicki, J.M. 2009. A scalable infrastructure model for carbon capture and
storage: SimCCS, Energy Policy, Vol. 37, Issue 3, pp. 1052-1060.
National Energy Technology Laboratory (NETL). 2011. Coal-Fired Power Plants in the United
States: Examination of the Costs of Retrofitting with CO2 Capture Technology, Revision
3. DOE/NETL-402/102309.
National Energy Technology Laboratory (NETL). 2015a. A Review of the CO2 Pipeline
Infrastructure in the US. DOE/NETL-2014/1681.
National Energy Technology Laboratory (NETL). 2015b. NATCARB_Saline_10K (v1502).
NATCABR Map Team. Accessed October 2018 at:
https://edx.netl.doe.gov/dataset/natcarb-saline-v1502
National Energy Technology Laboratory (NETL). 2015c. NATCARB_OilGas (v1502).
NATCABR Map Team. Accessed October 2018 at:
https://edx.netl.doe.gov/dataset/natcarb-oilgas-v1502
State CO2-EOR Deployment Work Group. 2017. 21st Century Energy Infrastructure: Policy
Recommendations for Development of American CO2 Pipeline Networks.
Tutton, P. 2018. 'Carbon Capture and Storage Network Optimization Under Uncertainty'. Master
of Science in Energy and Earth Resources. University of Texas at Austin. Unpublished.
U.S. Environmental Protection Agency (EPA). 2017. Continuous Emissions Monitoring Systems
Data. Available at: https://ampd.epa.gov/ampd/
U.S. Environmental Protection Agency (EPA). 2018. EPA Proposal: Affordable Clean Energy
(ACE) Rule Available at: https://www.epa.gov/stationary-sources-air-pollution/proposal-
affordable-clean-energy-ace-rule
Zelek, C.A., Geisbrecht, R.A., Grant, T.C., Goudarzi, L.A., Callahan, K.M., Babuich, W.M.
2012. NEMS-CCUS: A Model and Framework for Comprehensive Assessment of CCUS
and Infrastructure. Carbon Management Technology Conference. CMTC-150377-PP.

49
Table 3. Showing the distances to the closest available storage site, considering both saline
formations, and oil and gas fields. A map of these point to point routes is shown in Figures 3 and
5. The highlighted cell represent scenarios under which a certain power plant stores its emissions
within an oil or gas field. See Figures 6 and 7 for basin numbering. This only considered CEMS
from plants with non-zero emissions for 2017. Those with zero emission were removed as EIA
860M (EIA, 2018) showed that these were either retired or unlikely to return to service within
the next year.
ORIS-ID County Plant CO2 Emissions,
million metric tons Distance to sink (km)
Basin Number
3 Mobile County Barry 3.4 2.2 14
8 Walker County Gorgas 4.6 27.0 14
26 Shelby County E C Gaston 4.0 91.4 4
51 De Soto Parish
Dolet Hills Power Station 2.0 27.7 14
56 Washington
County Charles R Lowman 1.6 4.8 14
59 Hall County Platte 0.4 113.2 34
60 Adams County
Gerald Whelan Energy Center 1.3 83.6 35
87 McKinley County Escalante 1.1 19.1 33
108 Finney County Holcomb 1.1 11.5 34
113 Navajo County Cholla 4.3 10.7 33
127 Wilbarger County
Oklaunion Power Station 1.7 14.8 85
130 Berkeley County Cross 8.5 6.0 30
136 Putnam County Seminole (136) 7.2 51.3 1
160 Cochise County Apache Station 1.7 234.8 13
165 Mayes County
Grand River Dam Authority 0.8 6.7 76
207 Duval
County St. Johns River
Power 5.3 25.0 30
298 Limestone
County Limestone 9.6 3.3 14
469 Adams County Cherokee 1.4 7.4 41
470 Pueblo County Comanche (470) 8.9 19.9 41
477 Boulder County Valmont 0.2 2.5 41
492 El Paso County Martin Drake 1.3 5.5 41
525 Routt
County Hayden 2.8 0.4 43
527 Montrose County Nucla 0.1 16.1 33
564 Orange County
Curtis H. Stanton Energy Center 4.6 2.1 1
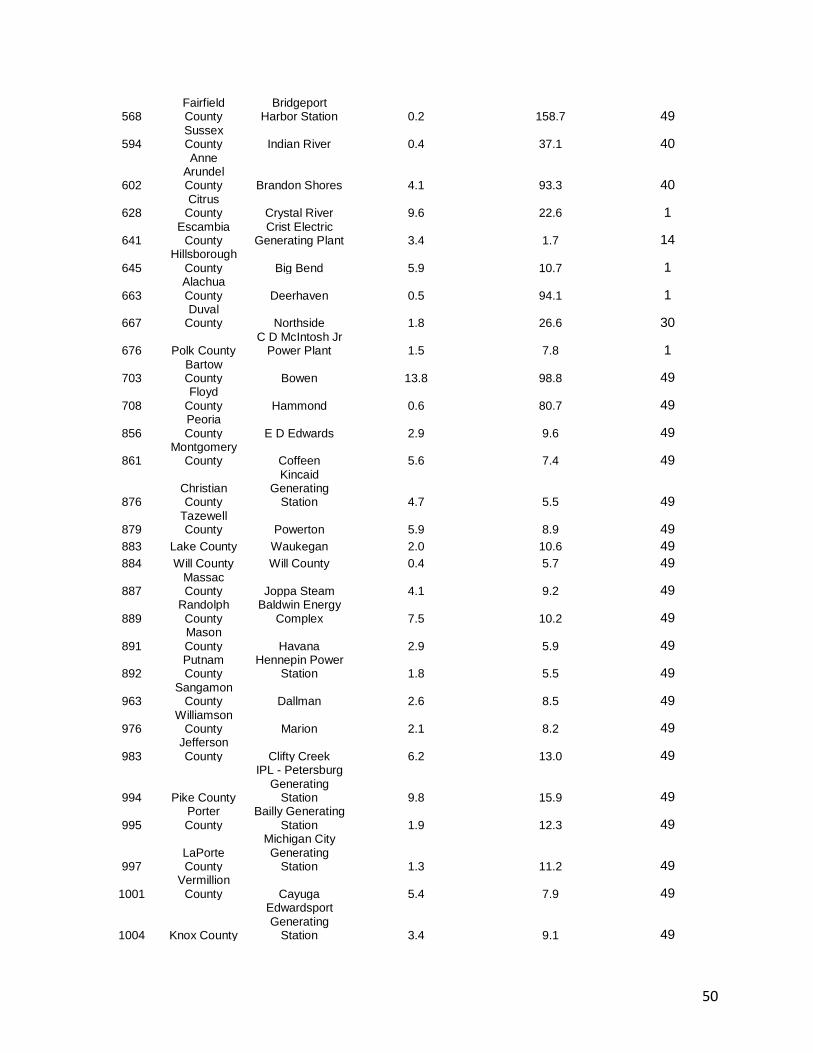
50
568 Fairfield County
Bridgeport Harbor Station 0.2 158.7 49
594 Sussex County Indian River 0.4 37.1 40
602
Anne Arundel County Brandon Shores 4.1 93.3 40
628 Citrus
County Crystal River 9.6 22.6 1
641 Escambia
County Crist Electric
Generating Plant 3.4 1.7 14
645 Hillsborough
County Big Bend 5.9 10.7 1
663 Alachua County Deerhaven 0.5 94.1 1
667 Duval
County Northside 1.8 26.6 30
676 Polk County C D McIntosh Jr
Power Plant 1.5 7.8 1
703 Bartow County Bowen 13.8 98.8 49
708 Floyd
County Hammond 0.6 80.7 49
856 Peoria County E D Edwards 2.9 9.6 49
861 Montgomery
County Coffeen 5.6 7.4 49
876 Christian County
Kincaid Generating
Station 4.7 5.5 49
879 Tazewell County Powerton 5.9 8.9 49
883 Lake County Waukegan 2.0 10.6 49
884 Will County Will County 0.4 5.7 49
887 Massac County Joppa Steam 4.1 9.2 49
889 Randolph County
Baldwin Energy Complex 7.5 10.2 49
891 Mason County Havana 2.9 5.9 49
892 Putnam County
Hennepin Power Station 1.8 5.5 49
963 Sangamon
County Dallman 2.6 8.5 49
976 Williamson
County Marion 2.1 8.2 49
983 Jefferson County Clifty Creek 6.2 13.0 49
994 Pike County
IPL - Petersburg Generating
Station 9.8 15.9 49
995 Porter County
Bailly Generating Station 1.9 12.3 49
997 LaPorte County
Michigan City Generating
Station 1.3 11.2 49
1001 Vermillion
County Cayuga 5.4 7.9 49
1004 Knox County
Edwardsport Generating
Station 3.4 9.1 49

51
1008 Floyd
County R Gallagher 0.2 11.0 49
1012 Warrick County
F B Culley Generating
Station 2.2 10.2 49
1040 Wayne County
Whitewater Valley 0.0 12.3 49
1047 Allamakee
County Lansing 1.1 113.7 49
1073 Linn County Prairie Creek 0.6 89.6 49
1082 Pottawattami
e County Walter Scott Jr. Energy Center 8.1 149.8 76
1091 Woodbury
County George Neal
North 2.3 278.4 76
1104 Des Moines
County Burlington (IA) 1.2 7.8 49
1131 Black Hawk
County Streeter Station 0.0 168.1 49
1167 Muscatine
County Muscatine 1.1 15.3 49
1241 Linn County La Cygne 4.2 9.8 76
1250 Douglas County
Lawrence Energy Center 2.7 12.2 76
1252 Shawnee County
Tecumseh Energy Center 0.4 26.0 76
1355 Mercer County E W Brown 1.6 6.1 49
1356 Carroll County Ghent 10.9 3.9 49
1364 Jefferson County Mill Creek 8.5 12.4 49
1374 Daviess County Elmer Smith 1.9 13.6 49
1378 Muhlenberg
County Paradise 2.8 6.5 49
1379 McCracken
County Shawnee 7.1 8.1 49
1382 Henderson
County HMP&L Station 2 1.3 12.6 49
1384 Pulaski County John S. Cooper 0.5 9.8 49
1393 Calcasieu
Parish R S Nelson 3.0 1.9 14
1552 Baltimore County C P Crane 0.3 96.1 40
1554
Anne Arundel County
Herbert A Wagner 0.2 92.6 40
1571
Prince George's County Chalk Point 0.5 77.3 40
1572 Montgomery
County Dickerson 0.2 77.2 49
1573 Charles County Morgantown 2.4 95.8 40
1619 Bristol County Brayton Point 1.1 302.7 49
1702 Bay County Dan E Karn 2.8 6.5 49
1710 Ottawa County J H Campbell 7.7 9.7 49

52
1733 Monroe County Monroe 15.4 4.5 49
1740 Wayne County River Rouge 1.0 13.3 49
1743 St. Clair County St. Clair 3.7 8.1 49
1745 Wayne County Trenton Channel 2.0 10.3 49
1769 Marquette
County Presque Isle 1.8 200.9 49
1825 Ottawa County J B Sims 0.3 9.5 49
1831 Ingham County Eckert Station 0.5 12.9 49
1832 Eaton
County Erickson 1.2 12.0 49
1843 Marquette
County Shiras 0.3 196.7 49
1893 Itasca County
Boswell Energy Center 7.7 208.7 64
1915 Washington
County Allen S King 2.9 337.0 64
1943 Otter Tail County Hoot Lake 0.3 93.0 64
2076 Jasper County Asbury 1.1 36.0 76
2079 Jackson County Hawthorn 2.8 5.5 76
2080 Henry County Montrose 0.4 51.1 76
2094 Jackson County Sibley 1.5 29.7 76
2103 Franklin County Labadie 15.1 53.5 49
2104 St. Louis County Meramec 1.2 14.5 49
2107 St. Charles
County Sioux 5.1 7.8 49
2167 New Madrid
County New Madrid Power Plant 6.4 63.3 49
2168 Randolph County
Thomas Hill Energy Center 8.0 113.1 49
2240 Dodge County
Lon D Wright Power Plant 0.4 181.0 76
2277 Lancaster
County Sheldon 0.8 90.6 35
2291 Douglas County
North Omaha Station 2.0 166.0 76
2324 Clark County Reid Gardner 0.3 64.8 33
2364 Merrimack
County Merrimack 0.3 297.8 49
2367 Rockingham
County Schiller 0.1 349.1 49
2378 Cape May
County B L England 0.0 113.5 40
2403 Hudson County
Hudson Generating
Station 0.0 105.2 49
2442 San Juan County
Four Corners Steam Elec
Station 6.0 5.0 33

53
2451 San Juan County San Juan 12.2 9.3 33
2527 Yates
County Greenidge
Generation LLC 0.1 11.4 49
2535 Tompkins County
Cayuga Operating
Company, LLC 0.2 9.8 49
2706 Buncombe
County Asheville 1.3 118.7 78
2712 Person County Roxboro 5.8 164.4 49
2718 Gaston County G G Allen 1.0 149.3 20
2721 Cleveland
County Cliffside 5.0 179.0 78
2727 Catawba County Marshall 8.5 188.4 49
2790 Morton County R M Heskett 0.5 6.4 64
2817 Mercer County Leland Olds 4.2 6.7 64
2823 Oliver
County Milton R Young 5.9 4.2 64
2824 Mercer County Stanton 0.2 7.5 64
2828 Jefferson County Cardinal 9.9 14.3 49
2832 Hamilton County
Miami Fort Power Station 6.1 14.7 49
2836 Lorain County
Avon Lake Power Plant 0.5 7.2 49
2840 Coshocton
County Conesville 3.9 14.3 49
2850 Adams County J M Stuart 6.8 8.8 49
2866 Jefferson County W H Sammis 6.4 8.4 49
2876 Gallia
County Kyger Creek 5.9 11.0 49
2952 Muskogee
County Muskogee 7.0 8.2 34
2963 Rogers County Northeastern 2.3 2.9 34
3118 Indiana County Conemaugh 10.6 14.4 49
3122 Indiana County Homer City 5.1 2.2 49
3130 Indiana County Seward 2.5 11.0 49
3136 Armstrong
County Keystone 11.1 15.2 49
3140 York County Brunner Island,
LLC 2.4 77.1 49
3149 Montour County Montour, LLC 2.6 10.8 49
3297 Richland County Wateree 3.1 15.1 20
3298 Berkeley County Williams 2.3 5.2 30
3393 Shelby County Allen 3.6 24.8 14
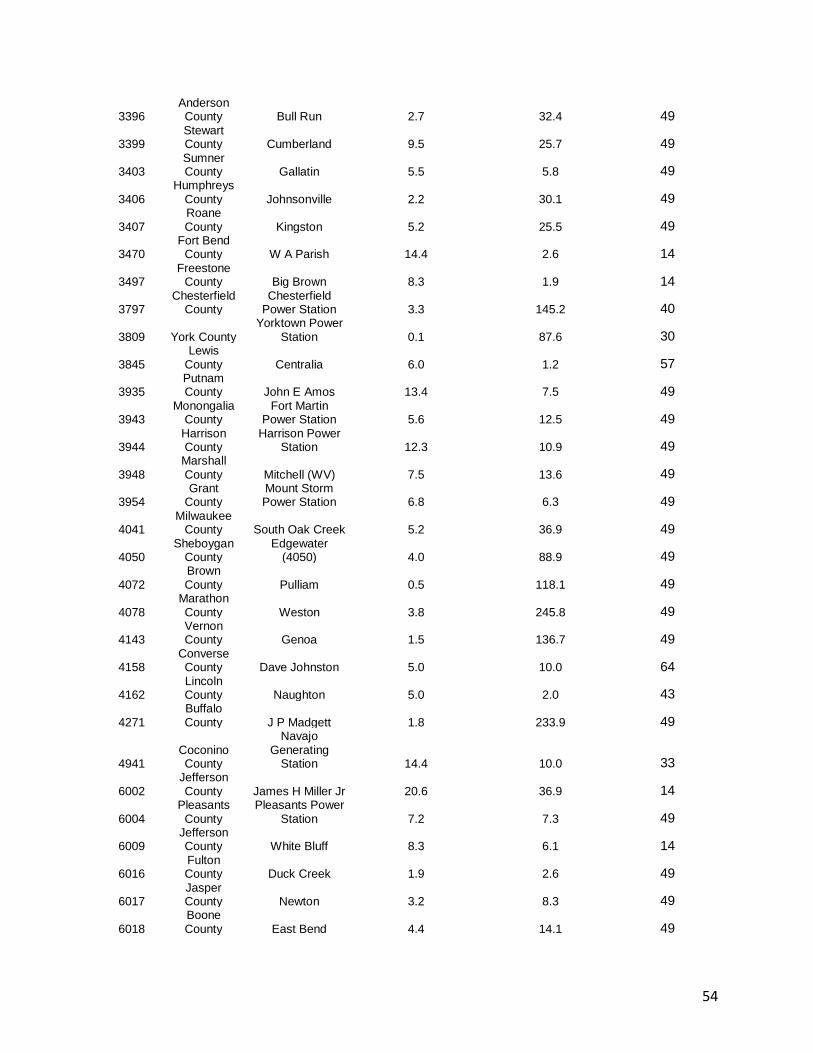
54
3396 Anderson County Bull Run 2.7 32.4 49
3399 Stewart County Cumberland 9.5 25.7 49
3403 Sumner County Gallatin 5.5 5.8 49
3406 Humphreys
County Johnsonville 2.2 30.1 49
3407 Roane County Kingston 5.2 25.5 49
3470 Fort Bend
County W A Parish 14.4 2.6 14
3497 Freestone
County Big Brown 8.3 1.9 14
3797 Chesterfield
County Chesterfield
Power Station 3.3 145.2 40
3809 York County Yorktown Power
Station 0.1 87.6 30
3845 Lewis
County Centralia 6.0 1.2 57
3935 Putnam County John E Amos 13.4 7.5 49
3943 Monongalia
County Fort Martin
Power Station 5.6 12.5 49
3944 Harrison County
Harrison Power Station 12.3 10.9 49
3948 Marshall County Mitchell (WV) 7.5 13.6 49
3954 Grant
County Mount Storm Power Station 6.8 6.3 49
4041 Milwaukee
County South Oak Creek 5.2 36.9 49
4050 Sheboygan
County Edgewater
(4050) 4.0 88.9 49
4072 Brown County Pulliam 0.5 118.1 49
4078 Marathon County Weston 3.8 245.8 49
4143 Vernon County Genoa 1.5 136.7 49
4158 Converse County Dave Johnston 5.0 10.0 64
4162 Lincoln County Naughton 5.0 2.0 43
4271 Buffalo County J P Madgett 1.8 233.9 49
4941 Coconino County
Navajo Generating
Station 14.4 10.0 33
6002 Jefferson County James H Miller Jr 20.6 36.9 14
6004 Pleasants
County Pleasants Power
Station 7.2 7.3 49
6009 Jefferson County White Bluff 8.3 6.1 14
6016 Fulton County Duck Creek 1.9 2.6 49
6017 Jasper County Newton 3.2 8.3 49
6018 Boone County East Bend 4.4 14.1 49

55
6019 Clermont County
W H Zimmer Generating
Station 7.2 7.7 49
6021 Moffat County Craig 8.0 3.9 43
6030 McLean County Coal Creek 8.1 10.2 64
6031 Adams County Killen Station 4.2 13.7 49
6034 St. Clair County Belle River 7.0 8.3 49
6041 Mason County H L Spurlock 6.3 11.5 49
6052 Heard County Wansley (6052) 3.8 155.8 14
6055
Pointe Coupee Parish Big Cajun 2 5.6 2.5 14
6061 Lamar County
R D Morrow Senior
Generating Plant 0.1 0.6 14
6064 Wyandotte
County Nearman Creek 1.1 13.9 76
6065 Platte
County Iatan 9.9 43.1 76
6068 Pottawatomi
e County Jeffrey Energy
Center 11.4 21.5 76
6071 Trimble County Trimble County 7.0 4.9 49
6073 Jackson County
Daniel Electric Generating Plant 2.7 2.5 14
6076 Rosebud County Colstrip 13.8 12.5 64
6077 Lincoln County
Gerald Gentleman
Station 7.5 36.4 41
6082 Niagara County
Somerset Operating Company (Kintigh) 0.3 5.1 49
6085 Jasper County
R M Schahfer Generating
Station 5.8 14.6 49
6089 Richland County Lewis & Clark 0.3 7.8 64
6090 Sherburne
County Sherburne
County 12.5 277.0 64
6094 Beaver County Bruce Mansfield 7.5 11.8 49
6095 Noble
County Sooner 3.7 6.3 34
6096 Otoe County Nebraska City
Station 8.5 88.8 76
6098 Grant
County Big Stone 2.3 119.8 64
6101 Campbell County Wyodak 3.1 7.5 64
6106 Morrow County Boardman 1.7 85.9 57
6113 Gibson County Gibson 16.3 10.8 49

56
6124 Effingham
County McIntosh (6124) 0.0 6.1 30
6136 Grimes County
Gibbons Creek Steam Electric
Station 1.7 2.6 14
6137 Posey County
A B Brown Generating
Station 2.1 12.7 49
6138 Benton County
Flint Creek Power Plant 2.8 62.4 76
6139 Titus County Welsh Power
Plant 5.8 3.4 14
6146 Rusk County Martin Lake 13.8 3.6 14
6147 Titus County Monticello 10.0 2.2 14
6155 Jefferson County Rush Island 8.2 16.3 49
6165 Emery County Hunter 8.2 12.8 33
6166 Spencer County Rockport 10.4 8.7 49
6170 Kenosha County Pleasant Prairie 6.0 7.1 49
6177 Apache County
Coronado Generating
Station 4.6 57.3 33
6178 Goliad County Coleto Creek 3.9 2.5 14
6179 Fayette County Sam Seymour 11.8 1.3 14
6180 Robertson
County Oak Grove 13.3 1.9 14
6181 Bexar
County J T Deely 4.2 4.7 14
6183 Atascosa County San Miguel 3.5 4.5 14
6190 Rapides Parish
Brame Energy Center 2.0 2.1 14
6193 Potter County
Harrington Station 4.7 2.5 13
6194 Lamb
County Tolk Station 4.9 5.6 13
6195 Greene County
John Twitty Energy Center 2.0 112.8 76
6204 Platte
County Laramie River 11.2 12.5 41
6213 Sullivan County Merom 4.8 7.2 49
6248 Morgan County Pawnee 4.0 8.0 41
6249 Georgetown
County Winyah 1.3 17.2 30
6250 Person County Mayo 1.5 171.7 49
6254 Wapello County Ottumwa 4.4 117.2 49
6257 Monroe County Scherer 15.2 52.4 14
6264 Mason County
Mountaineer (1301) 6.7 10.2 49
6469 Mercer County Antelope Valley 6.7 9.5 64

57
6481 Millard County Intermountain 7.6 73.5 43
6639 Webster County R D Green 2.6 12.7 49
6641 Independenc
e County Independence 7.2 90.5 14
6648 Milam County Sandow 4.4 15.8 14
6664 Louisa County Louisa 3.5 7.8 49
6705 Warrick County
Alcoa Allowance Management Inc 3.2 10.5 49
6761 Larimer County
Rawhide Energy Station 2.1 5.1 41
6768 Scott County Sikeston 1.7 31.0 49
6772 Choctaw County Hugo 2.8 51.0 14
6823 Ohio County D B Wilson 3.0 5.9 49
7030 Robertson
County Twin Oaks 2.8 2.9 14
7097 Bexar
County J K Spruce 5.9 4.7 14
7210 Orangeburg
County Cope Station 1.9 21.3 30
7213 Halifax County
Clover Power Station 3.4 162.2 49
7343 Woodbury
County George Neal
South 2.3 275.7 76
7504 Campbell County Neil Simpson II 0.7 7.4 64
7790 Uintah County Bonanza 3.7 3.3 43
7902 Harrison County
H W Pirkey Power Plant 4.5 4.3 14
8023 Columbia County Columbia 7.0 113.6 49
8042 Stokes County Belews Creek 8.4 137.1 49
8066 Sweetwater
County Jim Bridger 11.8 4.9 43
8069 Emery County Huntington 5.1 4.2 43
8102 Gallia
County Gen J M Gavin 14.0 8.7 49
8219 El Paso County Ray D Nixon 1.4 4.7 41
8222 Mercer County Coyote 2.9 7.7 64
8223 Apache County
Springerville Generating
Station 8.2 84.1 33
8224 Humboldt County North Valmy 0.7 300.2 45
8226 Allegheny
County Cheswick 1.4 10.9 49
10113 Schuylkill County
Gilberton Power Company 0.9 29.9 49
10343 Northumberland County
Mt. Carmel Cogeneration 0.5 31.3 49
10384 Edgecombe
County Edgecombe Genco, LLC 0.1 119.2 30

58
10603 Cambria County
Ebensburg Power Company 0.4 9.6 49
10641 Cambria County Cambria Cogen 0.9 8.3 49
50611 Schuylkill County
WPS Westwood Generation, LLC 0.0 50.7 49
50879 Schuylkill County
Wheelabrator - Frackville 0.6 31.1 49
50888 Northampton
County Northampton
Generating Plant 0.3 44.0 49
50974 Venango County
Scrubgrass Generating Plant 0.7 8.6 49
52007 Mecklenburg
County Mecklenburg Power Station 0.2 190.5 30
52071 Milam County Sandow Station 4.5 16.0 14
54081 Richmond
city Spruance Genco,
LLC 0.8 144.6 40
54634 Schuylkill County
St. Nicholas Cogeneration
Project 1.1 26.8 49
55076 Choctaw County
Red Hills Generation
Facility 2.7 8.1 2
55479 Campbell County Wygen I 0.9 7.4 64
55749 Big Horn County
Hardin Generating
Station 0.2 6.9 64
55856 Washington
County
Prairie State Generating
Station 10.9 8.4 49
56068 Milwaukee
County
Elm Road Generating
Station 7.4 36.7 49
56224 Eureka County TS Power Plant 1.0 339.6 45
56319 Campbell County Wygen II 0.9 7.8 64
56456 Mississippi
County Plum Point
Energy Station 3.6 88.5 14
56564 Hempstead
County John W. Turk Jr.
Power Plant 4.0 28.0 14
56596 Campbell County Wygen III 0.9 7.9 64
56609 Campbell County Dry Fork Station 3.3 8.4 64
56611 McLennan
County Sandy Creek
Energy Station 6.1 17.4 14
56671 Monongalia
County Longview Power 4.2 10.8 49
56786 Stutsman County
Spiritwood Station 0.5 7.8 64
56808 Wise County
Virginia City Hybrid Energy
Center 3.2 40.8 49

59