acetylcholine,outerhaircellelectromotility,andthe ... ·...
TRANSCRIPT

Acetylcholine, Outer Hair Cell Electromotility, and theCochlear Amplifier
Peter Dallos,1 David Z. Z. He,1 Xi Lin,1 Istvan Sziklai,2 Samir Mehta,1 and Burt N. Evans1
1Auditory Physiology Laboratory (The Hugh Knowles Center), Departments of Neurobiology and Physiology andCommunication Sciences and Disorders, The Institute for Neuroscience, Northwestern University, Evanston, Illinois60208, and 2Department of Otolaryngology, Semmelweis University, Budapest, Hungary, H-1083
The dominant efferent innervation of the cochlea terminates onouter hair cells (OHCs), with acetylcholine (ACh) being its prin-cipal neurotransmitter. OHCs respond with a somatic shapechange to alterations in their membrane potential, and thiselectromotile response is believed to provide mechanical feed-back to the basilar membrane. We examine the effects of AChon electromotile responses in isolated OHCs and attempt todeduce the mechanism of ACh action. Axial electromotile am-plitude and cell compliance increase in the presence of theligand. This response occurs with a significantly greater latencythan membrane current and potential changes attributable to
ACh and is contemporaneous with Ca21 release from intracel-lular stores. It is likely that increased axial compliance largelyaccounts for the increase in motility. The mechanical responsesare probably related to a recently demonstrated slow efferenteffect. The implications of the present findings related to com-monly assumed efferent behavior in vivo are considered.
Key words: cochlea; efferent; acetylcholine; outer hair cell;electromotility; cell stiffness; calcium; effects of ACh on outerhair cell; cochlear amplifier; microchamber technique; patch-clamp technique; dose–response curves
Its first examination showed inhibitory effects during electricalstimulation of the efferent nerve bundle (Galambos, 1956; Wied-erhold and Kiang, 1970). Small inhibitory effects have also beenseen with contralateral sound stimulation (Buno, 1978; Liberman,1988). Some efficacy in protecting the ear against overstimulation(Rajan, 1988) and small improvements in the detection of signalsin noise (Nieder and Nieder, 1970; Winslow and Sachs, 1987) canalso be demonstrated.The largest effect is obtained with electrical stimulation of
medial olivocochlear fibers, which provide the efferent innerva-tion of cochlear outer hair cells (OHCs). Whether measured inthe compound response of the afferent nerve trunk (Galambos,1956), single fibers (Wiederhold, 1970), inner hair cell (IHC)receptor potentials (Brown and Nuttall, 1984), or basilar mem-brane motion (Dolan and Nuttall, 1994; Murugasu and Russell,1996a), the ultimate effects are the same. These consist of areduction of the response at the best frequency (BF) by some 20dB, no detuning of the BF, and no significant effect on thelow-frequency tail of the response pattern. A recent review onefferents is available (Guinan, 1996).Acetylcholine (ACh) is the principal efferent neurotransmitter
in the cochlea (for review, see Eybalin, 1993; Sewell, 1996). AChreceptors (AChRs) on hair cells show unusual pharmacology,which is unlike either nicotinic or muscarinic AChR but has somecharacteristics of both. A new subunit (a9) of the nicotinic AChRfamily has been cloned recently (Elgoyhen et al., 1994), which
when expressed in oocytes produces functional AChRs and dem-onstrates pharmacological properties similar to those seen in haircells.Because ACh binds to receptors at the synaptic pole of the cell,
the response is a rapid influx of Ca21 through nonspecific cationchannels opened by the ligand. This results in the opening ofcalcium-dependent potassium channels, yielding an increase inthe input conductance of the cell and the efflux of K1, whichhyperpolarizes the cell by a few millivolts. The currents areactivated rapidly, and the potential change reaches a peak in,100msec (Housley and Ashmore, 1991; Erostegui et al., 1994;Blanchet et al., 1996; Evans, 1996). Second messenger activationmay also occur in OHCs (Shigemoto and Ohmori, 1990, 1991;Kakehata et al., 1993), resulting in a slow effect, distinguished byits long time constant, on the order of 20–50 sec. It seems likelythat the slow effect is responsible for the ability of the efferentsystem to provide some protection against acoustic overstimula-tion (Reiter and Liberman, 1995). Sridhar et al. (1995) indicatedthat both slow and fast effects are mediated by the same AChRand both produce inhibition of the cochlear output.Electrical stimulation of the olivocochlear bundle affects only
the medial efferents, and thus the effects are on OHCs (Guinan,1996). OHCs are in a cochlear feedback loop in which theycomprise the effector arm of the “cochlear amplifier” (Dallos,1992). OHCs are assumed to feed cycle-by-cycle force (electro-motile response) to the basilar membrane so that its vibration isamplified at BF. It is generally assumed that efferents reduce theOHC feedback force and thus the gain of the cochlear amplifier.OHC electromotility is a membrane potential-dependent
(Santos-Sacchi and Dilger, 1988) somatic elongation (on hyper-polarization) and contraction (on depolarization) of the cylindri-cally shaped cell (Brownell et al., 1985; Kachar et al., 1986;Zenner et al., 1986; Ashmore, 1987). As the input conductance ofthe cell increases, the receptor current-induced voltage drop on
Received Aug. 12, 1996; revised Jan. 6, 1997; accepted Jan. 9, 1997.This work was supported by grants from the National Institute on Deafness and
Other Communication Disorders, National Institutes of Health. We thank Drs. M.A. Cheatham, P. J. Kolston, C. P. Richter, and J. H. Siegel for their comments on thismanuscript. Step-function responses obtained in the microchamber were provided byDrs. S. Vranic-Sowers and C. P. Richter.Correspondence should be addressed to Peter Dallos, Northwestern University,
2299 North Campus Drive, Evanston, IL 60208.Copyright q 1997 Society for Neuroscience 0270-6474/97/172212-15$05.00/0
The Journal of Neuroscience, March 15, 1997, 17(6):2212–2226

the basolateral (motor-bearing) membrane decreases, and theelectromotile response is reduced; however, this effect is negligi-ble above the cutoff frequency of the OHC membrane (,1 kHz)(Housley and Ashmore, 1992; Santos-Sacchi, 1992) and is unlikelyto modulate cochlear amplification. Furthermore, the voltage-to-length change conversion function (dL-V) of the OHC is nonlin-ear (Evans et al., 1989, 1991; Santos-Sacchi, 1989). As the mem-brane is hyperpolarized, the operating point moves toward lowerslope (gain) on the dL-V function. The gain change, correspond-ing to the expected maximal ;10 mV hyperpolarization is small,approximately 10–20%; however, because the electromechanicalconversion process (motility) is in the feedback path of thecochlear amplifier, even modest reduction in the feedback gaincould radically reduce the total gain (Yates, 1990). It is then theexpectation that ACh should reduce electromotility, in harmonywith the inhibitory influence attributed to cochlear efferents.Interestingly, ACh invariably produces increased gain and mag-
nitude of the motile response in isolated OHCs (Sziklai andDallos, 1993; Sziklai et al., 1996). Because the result of increasedmotility seems incompatible with behavior expected from conduc-tance increase or hyperpolarization and with the generally con-ceived efferent influence, other factors may be important in thecontrol of electromotility by efferents, and these are examined.OHC electromotility has been studied with either the whole-cell
patch technique (Hamill et al., 1981; Ashmore, 1987) or themicrochamber technique (Evans et al., 1989). Our previous find-ings (Sziklai and Dallos, 1993; Sziklai et al., 1996) were obtainedwith the latter. Here both techniques are used to assure that theunexpected result of increased motile response in the presence ofACh is indeed real. Simultaneous measurements of OHC length(dL) and radius (dr) changes with ACh are obtained with themicrochamber technique. As demonstrated below, the effect ofthe ligand on the dL/dr ratio is diagnostic regarding the mecha-nism of ACh action. In the whole-cell patch experiment, weinvestigate whether the ACh effects persist when the cell isvoltage-clamped. To investigate the mechanism of ACh action, wealso measure its effect on Ca21 release from internal stores and onaxial stiffness and electromotility when cell length is mechanicallyconstrained. To compare the results with other ACh effects,dose–response curves are also obtained.Care and use of animals have been approved by the Northwest-
ern University Institutional Review Board and by the NationalInstitutes of Health.Some of these results have been published previously (Dallos et
al., 1996).
MATERIALS AND METHODSCell isolation. OHCs were obtained from the cochleae of young albinoguinea pigs euthanized with sodium pentobarbital. Appropriate segmentsof the organ of Corti were isolated from second, third, and fourth turnsof the cochlea. After light enzymatic digestion for 15 min (1 mg/ml TypeIV Collagenase, Sigma, St. Louis, MO) and gentle pipetting, cells weretransferred to small plastic chambers filled with enzyme-free culturemedium. The normal medium was Leibovitz’s L-15 (Life Technologies,Gaithersburg, MD), supplemented with 15 mM HEPES or HBSS (LifeTechnologies) and adjusted to pH 7.35, 300 mOsm.A Zeiss inverted microscope with 163 objective was used for these
experiments. Cell length and diameter changes, or displacement of thedriven fiber, were measured by the change in the current of a photodiodewhen the magnified image of the ciliated pole of the cell, a full diameter,or the edge of fibers was projected onto it through a rectangular slit. Theposition of the slit in front of the photodiode was adjustable so that theimage of the object could always be projected to the photodiode withoutmoving the cell or the fiber. The position of the image in the slit wasmonitored by a video camera behind it. Two slit-photodiode assemblies
were used for simultaneous length and diameter change measurements.Photocurrent response was calibrated to displacement units by movingthe slit to a fixed distance in front of the photodiode at the beginning ofeach trial. The photodiode measurement system, including postfiltering,had a corner frequency (3 dB down) of 1100 Hz. With some averaging,movement amplitudes as low as 10 nm could be detected routinely. Inmost experiments, 10–20 averages of trials were preset. Experimentswere performed at room temperature (20 6 48C) and videotaped with aPanasonic video recorder.Drug application. ACh was delivered by pressure ejection from a
micropipette (tip diameter 2–3 mm) positioned;20 mm from the synapticpole of the cell. The duration and strength of the pressure pulse werecontrolled (Lin et al., 1993). To prevent leakage of drug from the pufferpipette, the pressure line was vented to open air between pressure pulseapplications. In some early microchamber experiments, the entire bathwas exchanged when drug application was required. In the experiments inwhich fluorescence was measured, ACh was applied slowly to the bath asa bolus. Care was taken to assure that application of the ligand did notalter the position of the cell and influence measurements of motility orstiffness. Calibration was performed before each experimental run, andthus small positional changes, if any, were compensated for.Microchamber methods (Fig. 1A). Healthy-appearing isolated OHCs
(no obvious signs of hair bundle damage, granularity, swelling, or nucleustranslocation) were drawn gently part of the way into a close-fitting glasspipette, the microchamber, with their ciliated pole inside. The micro-chamber was fabricated from 2 mm thin-wall glass tubing (Glass Com-pany of America) by a two-stage microelectrode puller (Narashige, To-kyo, Japan) and heat-polished to an aperture diameter close to that of ahair cell (;8–9 mm). The microchamber, with an access resistance of;0.4–0.5 MV, was mounted in an electrode holder that was held on athree-dimensional (3-D) micromanipulator (Leitz, Wetzlar, Germany).The position and height of the microchamber in the bath were readilyadjustable with the micromanipulator. By moving the microchamber, cellsin the bath could be picked up easily. The experimental bath, whichcontained the isolated OHCs, was placed on the stage of an invertedmicroscope (Zeiss). An Ag/AgCl ground electrode was installed in thebath. The internal medium (L-15) of the microchamber was connected tothe voltage command generator through an Ag/AgCl wire inside themicrochamber. The suction port of the microchamber holder was con-nected to a micrometer-driven syringe to provide positive or negativepressure to draw in or expel the cells. The inserted cell and the micro-chamber formed a resistive seal (4–6 MV) that was mechanically stablebut allowed the cell to be moved in and out of the pipette withoutapparent damage to it. Transcellular potentials were applied across themicrochamber. Negative voltage commands made the bath negative rel-ative to the inside of the microchamber. This results in the depolarizationof the excluded and hyperpolarization of the included cell membranesegments. Voltage command stimuli were generated by a programmablegenerator in an IBM-compatible computer, which also contained the dataacquisition hardware.Voltage-clamp methods (Fig. 1B). OHCs were bathed in HBSS. Their
membrane potentials were clamped using the standard whole-cellvoltage-clamp technique (Hamill et al., 1981). A detailed procedure forgetting tight seals on OHCs has been described elsewhere (Lin et al.,1993). Recording pipettes had access resistance between 4 and 6 MV inthe bath. Access resistance approximately doubled when whole-cell re-cording configuration was established. At least 80% of the access resis-tance was compensated. Capacitance compensation was also applied. Theestimated voltage-clamp time constant is probably ,1 msec (calculatedfrom the access resistance of the pipette and estimated cell capacitance)(Santos-Sacchi, 1992). In most of our recordings, whole-cell currents werebelow 2 nA. The estimated voltage-clamp error, therefore, should not be.5 mV. Pipette internal solution contained (in mM): 120 KF (in someearly experiments) or 120 KCl (in all later experiments), 2 MgCl2, 10EGTA 10, 10 HEPES. The solution was buffered to pH 7.4 with TrizmaBase (Sigma), and osmolarity was adjusted to 300 mOsm with glucose.Whole-cell currents (filtered at 5 kHz) were amplified using patch-clampamplifier Axopatch 200A (Axon Instruments, Foster City, CA). Thecurrents and photodiode signals were acquired by software Clampex(pClamp version 6, Axon Instruments) running on an IBM-compatiblecomputer and a 12 bit D/A and A/D converter (Scientific Solutions,Solon, OH). Photodiode signals were low-pass-filtered at 1600 Hz beforebeing fed to the D/A. Data were analyzed using Clampfit of the pClampsoftware package.Stiffness measurement (Fig. 1C). Glass fibers were pulled from molten
Dallos et al. • ACh and Electromotility J. Neurosci., March 15, 1997, 17(6):2212–2226 2213

glass (1.5 mm) by a microforge (Stoelting, Chicago, IL). The tapered fiberwas 4–6 mm in length and 1–2 mm in tip diameter. We did not measurethe actual stiffness of the fiber, but it was desirable that the compliance ofthe fiber be of the same order as that of the cells. This was ascertained bynoting that the compression of the cell and the displacement of the fiberwere approximately the same. The glass fiber was attached to an electricalpiezo actuator, which was mounted on a 3-D micromanipulator (Narash-ige). OHCs were inserted ;20% into the microchamber with theirciliated pole inside, and the glass fiber was brought into contact with theexcluded synaptic pole of the cell. The fiber was placed perpendicular tothe long axis of the OHC in such a way that the lateral motions of thefiber would compress or relax the cell. Free fiber and cell-loaded fibermotions (fiber-driven cell compression) were measured by focusing thedriven pole of the cell through a slit on a photodiode. Data acquisitionwas performed using an IBM-compatible computer. The probe stimuluswas a series of 5 Hz sinusoidal voltage bursts with a duration of 500 msec.Fluorescence measurements. Isolated OHCs were loaded with an ad-
justed final concentration of 75 mM chlortetracycline (CTC; Sigma)(Caswell, 1971), which has a strong affinity for membrane-associatedCa21 (Chandler and Williams, 1978). The cells were exposed to CTC for20 min. Data obtained using CTC were not converted to the absolutevalue of intracellular Ca21 concentration in this study. OHCs weretransferred from the original bath to the experimental bath via a boro-silicate, wide-mouth transfer pipette. Once the OHC was released intothe experimental bath, it was allowed to settle on the surface of thechamber, where it adhered. Experiments were performed on an invertedmicroscope (Leitz). A xenon light source was used to excite the dye at 405nm, using a standard fluorescein isothiocyanate cube. Readings weretaken using a photometer (MPV Compact, Leitz). A rear-projectedaperture was imaged over the subcuticular region of the OHC from whichrecordings were to be taken. On illumination of the preparation, datacollection was triggered. To reduce photobleaching, a shutter was openedfor 5 sec intervals, at which time a reading was taken. The analog outputsignal was recorded at a sampling rate of 1 kHz and stored to disk on anIBM 486-PC clone.In all the experiments, ACh (Sigma) was perfused slowly into the bath
without disturbing the position of the plated cells. A 1 mM stock solutionwas added to the experimental bath to obtain a final solution concentra-tion of 150 mM. The volume of the experimental bath was ;0.25 ml, andthe volume of the chemicals containing culture medium was adjusted toobtain the appropriate concentration. In some experiments, atropinesulfate (MW 676.8; Sigma) was applied to achieve a final concentration of100 mM.First, fluorescence of OHCs was measured. Readings were taken to
obtain control curves with respect to the extinction of the fluorescence asa function of time. In the second series of experiments, after 1 min of
baseline readings, ACh was added to the bath. Readings were taken atintervals for 2 min after addition of the ACh. Finally, in the last set ofexperiments, atropine was added to the bath. After the atropine wasallowed to diffuse through the bath, the same procedure as in series 2 wasfollowed.
EXPERIMENTAL RESULTSMotile response under current and voltage clampIt is our experience that immediately after whole-cell recordingconditions are established, the zero current potential is low (av-erage, 225 mV; SD 5 9.8 mV in 10 cells), but on equilibrationwith the content of the recording pipette the cell hyperpolarizes toan average value of 255.7 mV (SD 5 7.8 mV). Representativeresults are shown in Figure 2, where voltage clamp data andsteady-state current–voltage (I–V) curves are presented for anisolated OHC.In Figure 2A, the ACh-evoked membrane potential change is
shown over time when the net whole-cell current was clamped at0 nA. The membrane rapidly hyperpolarizes and shows somesubsequent repolarization during the persistence of the ligand.Both the control and post-ACh time patterns and I–V curves (Fig.2B) resemble those published by others for OHCs (Housley andAshmore, 1991; Doi and Ohmori, 1993; Erostegui et al., 1994;Blanchet et al., 1996; Evans, 1996) and hair cells from nonmam-malian vertebrates (turtle: Art et al., 1984, 1985; fish: Steinackerand Rojas, 1988; frog: Housley et al., 1990; bird: Shigemoto andOhmori, 1991; Fuchs and Murrow, 1992).Electromotile responses were measured with the whole-cell
voltage-clamp method in 14 OHCs. Three examples are presentedin Figure 3; an additional example has been published (Dallos etal., 1996, their Fig. 2). Pressure ejection of ACh onto the synapticpole of the cell produced a significant effect on electromotileresponse in 10 cases. The other four cells showed very smallchange in motile response. Figure 3 depicts a sequence of re-sponses to bipolar square-pulse stimuli (top row). In the left-handcolumn electromotile response waveforms are shown. In the cen-ter column these are repeated after ACh application. From thesteady-state portion of the response waveforms, dL-V curves are
Figure 1. A,Video image showing the experimental setup for microchamber measurements. The OHC is inserted into the microchamber with its synapticpole outside. Fractional cell length outside the chamber is designated with q. The diameter of the cell and its cuticular plate are imaged via rectangularslits on photodiodes. The photocurrents are proportional to diameter and length changes, respectively. Command voltage (Vc) is delivered betweenelectrolytes inside and surrounding the microchamber. ACh is delivered to the synaptic pole of the cell. B, Video image showing the experimental setupfor measuring electromotility with the whole-cell patch technique. Cell length changes are measured as in A, and ACh is delivered to the synaptic pole.C, Video image showing the experimental setup for stiffness measurements and for constrained electromotility measurement. A piezo-driven glass fiberis brought up against the synaptic pole of the cell. The cell is inserted into a microchamber with ciliary pole inside and q 5 0.8–0.9. ACh is delivered tothe synaptic pole, and its displacement is measured as in A.
2214 J. Neurosci., March 15, 1997, 17(6):2212–2226 Dallos et al. • ACh and Electromotility
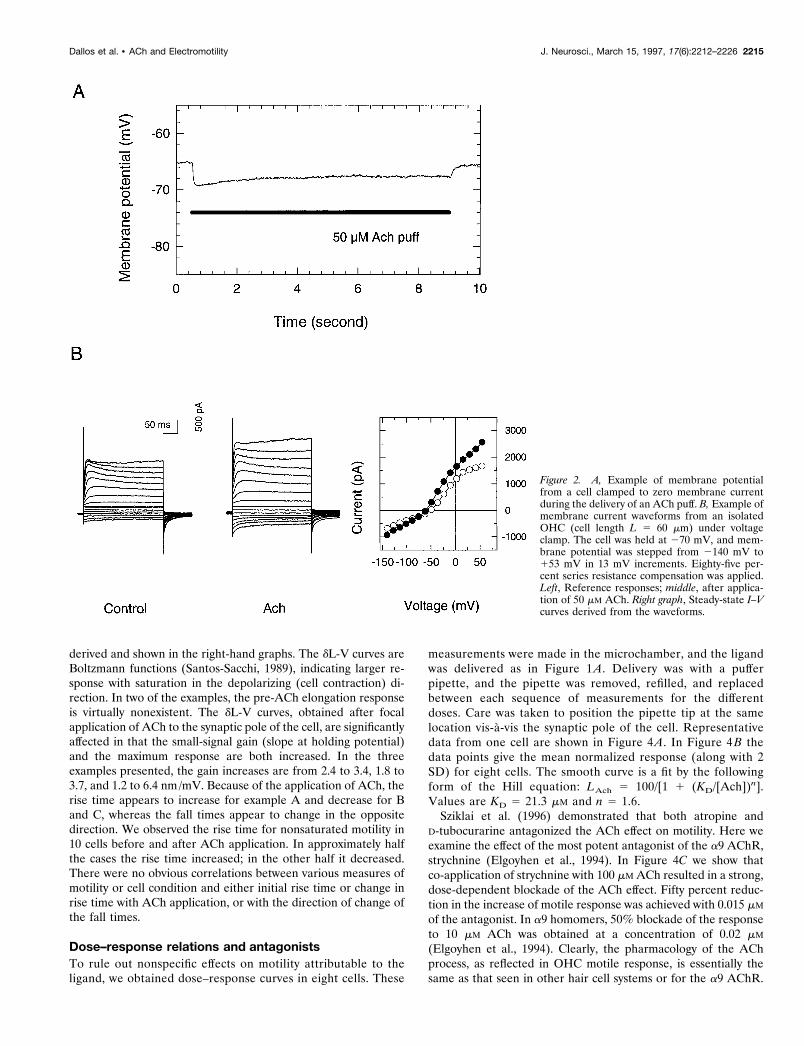
derived and shown in the right-hand graphs. The dL-V curves areBoltzmann functions (Santos-Sacchi, 1989), indicating larger re-sponse with saturation in the depolarizing (cell contraction) di-rection. In two of the examples, the pre-ACh elongation responseis virtually nonexistent. The dL-V curves, obtained after focalapplication of ACh to the synaptic pole of the cell, are significantlyaffected in that the small-signal gain (slope at holding potential)and the maximum response are both increased. In the threeexamples presented, the gain increases are from 2.4 to 3.4, 1.8 to3.7, and 1.2 to 6.4 nm/mV. Because of the application of ACh, therise time appears to increase for example A and decrease for Band C, whereas the fall times appear to change in the oppositedirection. We observed the rise time for nonsaturated motility in10 cells before and after ACh application. In approximately halfthe cases the rise time increased; in the other half it decreased.There were no obvious correlations between various measures ofmotility or cell condition and either initial rise time or change inrise time with ACh application, or with the direction of change ofthe fall times.
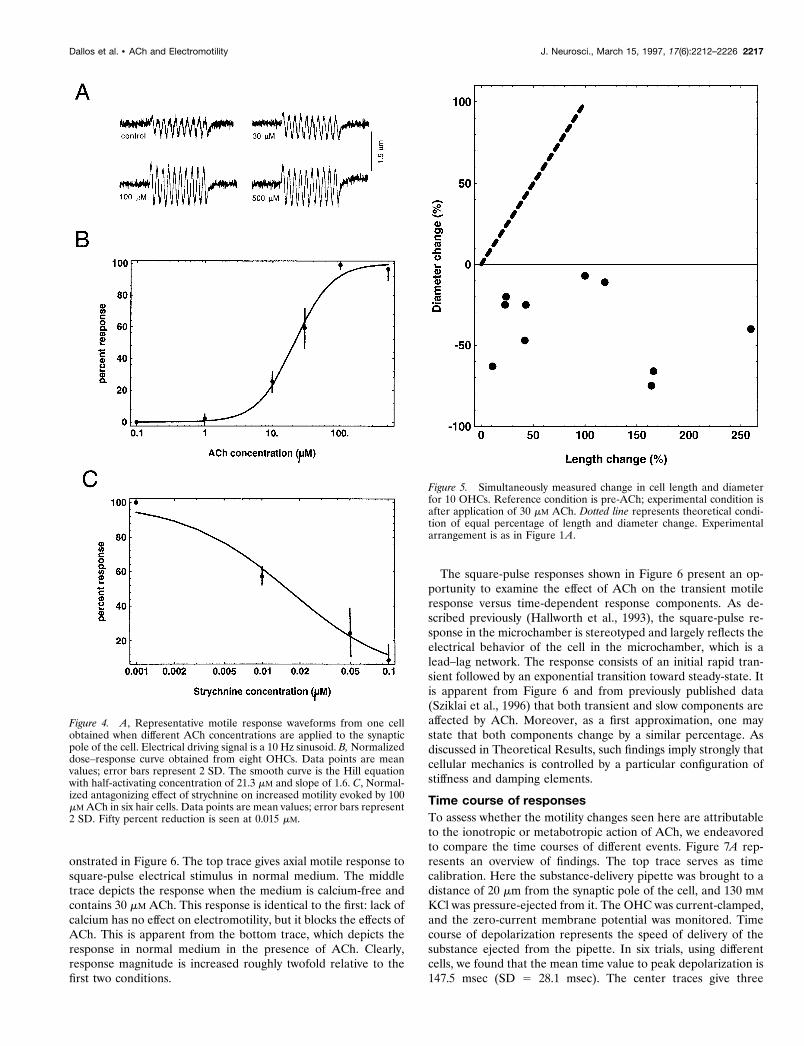
Dose–response relations and antagonistsTo rule out nonspecific effects on motility attributable to theligand, we obtained dose–response curves in eight cells. These
measurements were made in the microchamber, and the ligandwas delivered as in Figure 1A. Delivery was with a pufferpipette, and the pipette was removed, refilled, and replacedbetween each sequence of measurements for the differentdoses. Care was taken to position the pipette tip at the samelocation vis-a-vis the synaptic pole of the cell. Representativedata from one cell are shown in Figure 4A. In Figure 4B thedata points give the mean normalized response (along with 2SD) for eight cells. The smooth curve is a fit by the followingform of the Hill equation: LAch 5 100/[1 1 (KD/[Ach])
n].Values are KD 5 21.3 mM and n 5 1.6.Sziklai et al. (1996) demonstrated that both atropine and
D-tubocurarine antagonized the ACh effect on motility. Here weexamine the effect of the most potent antagonist of the a9 AChR,strychnine (Elgoyhen et al., 1994). In Figure 4C we show thatco-application of strychnine with 100 mM ACh resulted in a strong,dose-dependent blockade of the ACh effect. Fifty percent reduc-tion in the increase of motile response was achieved with 0.015 mMof the antagonist. In a9 homomers, 50% blockade of the responseto 10 mM ACh was obtained at a concentration of 0.02 mM(Elgoyhen et al., 1994). Clearly, the pharmacology of the AChprocess, as reflected in OHC motile response, is essentially thesame as that seen in other hair cell systems or for the a9 AChR.
Figure 2. A, Example of membrane potentialfrom a cell clamped to zero membrane currentduring the delivery of an ACh puff. B, Example ofmembrane current waveforms from an isolatedOHC (cell length L 5 60 mm) under voltageclamp. The cell was held at 270 mV, and mem-brane potential was stepped from 2140 mV to153 mV in 13 mV increments. Eighty-five per-cent series resistance compensation was applied.Left, Reference responses; middle, after applica-tion of 50 mM ACh. Right graph, Steady-state I–Vcurves derived from the waveforms.
Dallos et al. • ACh and Electromotility J. Neurosci., March 15, 1997, 17(6):2212–2226 2215

Length versus radius changeThe electromotile response of OHCs consists of axial (dL) andradial components (dr). As discussed below, joint measurement oftwo variables (dL and dr) produces revealing information.It is reasonable to assume that any influence (by ACh) that occurs
before the activation of the motility motors is expressed equally in dLand dr. Thus, the constancy of the length-to-radius change ratio,before and after application of the ligand, signifies that all effectsoccur before motor action, whereas nonconstancy of the ratio indi-cates effects that happen in or after motor action. This heuristicnotion is developed analytically in Theoretical Results. The experi-mental plan is to measure the dL/dr ratio before and after applica-tion of ACh to the synaptic pole of the cell and to examine itsconstancy or change. In reality, instead of radius change, we mea-sured diameter changes, but the discussion is in terms of dr.Our results are summarized readily. In no case did we find con-
stancy of dL/dr from the pre-ACh to the post-ACh measurement. Infact, the ratio invariably increased. This change came about by an
increase in dL and a decrease in dr. Percentage changes are some-what dependent on stimulus (voltage) level. Data are based onmeasurements in which the pre-ACh axial motile response (dL) was;200–400 nm. The actual voltage dependence was not explored.Motility waveforms of dL and dr were published previously for thepre- and post-ACh situations (Dallos et al., 1996, their Fig. 1). InFigure 5 data are summarized for 10 OHCs. Percentage diameterchange [100(drAch 2 dr)/dr] is plotted against percentage length[100(dLAch 2 dL)/dL] change. Would-be proportionality is repre-sented by the dotted line. It is evident that all length changes arepositive, whereas all diameter changes are negative. If the cells werenot mechanically partitioned by the microchamber, the lack of pro-portionality would imply a volume change. For the partitioned cellsthis is not the case.
Effect of calciumRemoval of Ca21 from the medium that surrounds the synapticpole of the cell completely inhibits the ACh effect. This is dem-
Figure 3. Motility data for three cells stimulated in the whole-cell voltage-clamp mode. Holding potential is at270 mV, and membrane voltage is steppedbetween 2140 mV and185 mV in 15 mV step increments (top traces). Cell motility is measured as in Figure 1B. Left column, Pre-Ach control responses;center column, after ACh application. Cell contraction is plotted down. Right column, Steady-state dL-V plots for the control and ACh conditions. Abscissa,membrane potential; ordinate, motile response (nm). Cell lengths: 51, 53, and 45 mm.
2216 J. Neurosci., March 15, 1997, 17(6):2212–2226 Dallos et al. • ACh and Electromotility
onstrated in Figure 6. The top trace gives axial motile response tosquare-pulse electrical stimulus in normal medium. The middletrace depicts the response when the medium is calcium-free andcontains 30 mM ACh. This response is identical to the first: lack ofcalcium has no effect on electromotility, but it blocks the effects ofACh. This is apparent from the bottom trace, which depicts theresponse in normal medium in the presence of ACh. Clearly,response magnitude is increased roughly twofold relative to thefirst two conditions.
The square-pulse responses shown in Figure 6 present an op-portunity to examine the effect of ACh on the transient motileresponse versus time-dependent response components. As de-scribed previously (Hallworth et al., 1993), the square-pulse re-sponse in the microchamber is stereotyped and largely reflects theelectrical behavior of the cell in the microchamber, which is alead–lag network. The response consists of an initial rapid tran-sient followed by an exponential transition toward steady-state. Itis apparent from Figure 6 and from previously published data(Sziklai et al., 1996) that both transient and slow components areaffected by ACh. Moreover, as a first approximation, one maystate that both components change by a similar percentage. Asdiscussed in Theoretical Results, such findings imply strongly thatcellular mechanics is controlled by a particular configuration ofstiffness and damping elements.
Time course of responsesTo assess whether the motility changes seen here are attributableto the ionotropic or metabotropic action of ACh, we endeavoredto compare the time courses of different events. Figure 7A rep-resents an overview of findings. The top trace serves as timecalibration. Here the substance-delivery pipette was brought to adistance of 20 mm from the synaptic pole of the cell, and 130 mMKCl was pressure-ejected from it. The OHC was current-clamped,and the zero-current membrane potential was monitored. Timecourse of depolarization represents the speed of delivery of thesubstance ejected from the pipette. In six trials, using differentcells, we found that the mean time value to peak depolarization is147.5 msec (SD 5 28.1 msec). The center traces give three
Figure 4. A, Representative motile response waveforms from one cellobtained when different ACh concentrations are applied to the synapticpole of the cell. Electrical driving signal is a 10 Hz sinusoid. B, Normalizeddose–response curve obtained from eight OHCs. Data points are meanvalues; error bars represent 2 SD. The smooth curve is the Hill equationwith half-activating concentration of 21.3 mM and slope of 1.6. C, Normal-ized antagonizing effect of strychnine on increased motility evoked by 100mM ACh in six hair cells. Data points are mean values; error bars represent2 SD. Fifty percent reduction is seen at 0.015 mM.
Figure 5. Simultaneously measured change in cell length and diameterfor 10 OHCs. Reference condition is pre-ACh; experimental condition isafter application of 30 mM ACh. Dotted line represents theoretical condi-tion of equal percentage of length and diameter change. Experimentalarrangement is as in Figure 1A.
Dallos et al. • ACh and Electromotility J. Neurosci., March 15, 1997, 17(6):2212–2226 2217
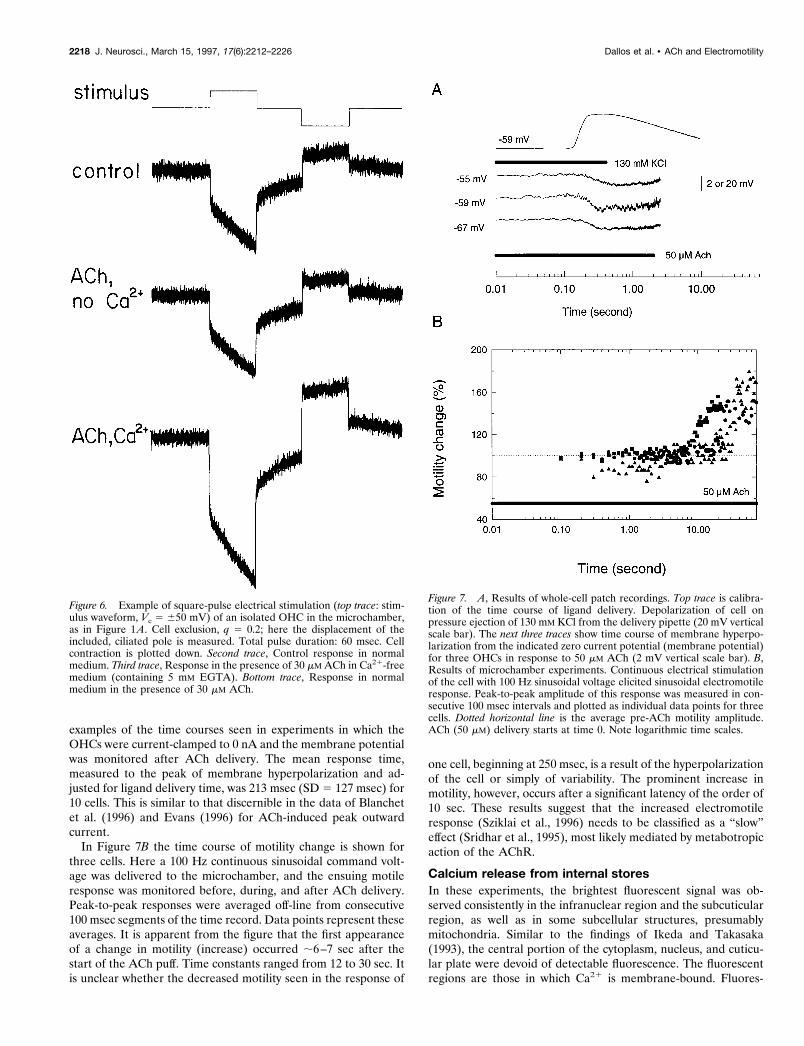
examples of the time courses seen in experiments in which theOHCs were current-clamped to 0 nA and the membrane potentialwas monitored after ACh delivery. The mean response time,measured to the peak of membrane hyperpolarization and ad-justed for ligand delivery time, was 213 msec (SD 5 127 msec) for10 cells. This is similar to that discernible in the data of Blanchetet al. (1996) and Evans (1996) for ACh-induced peak outwardcurrent.In Figure 7B the time course of motility change is shown for
three cells. Here a 100 Hz continuous sinusoidal command volt-age was delivered to the microchamber, and the ensuing motileresponse was monitored before, during, and after ACh delivery.Peak-to-peak responses were averaged off-line from consecutive100 msec segments of the time record. Data points represent theseaverages. It is apparent from the figure that the first appearanceof a change in motility (increase) occurred ;6–7 sec after thestart of the ACh puff. Time constants ranged from 12 to 30 sec. Itis unclear whether the decreased motility seen in the response of
one cell, beginning at 250 msec, is a result of the hyperpolarizationof the cell or simply of variability. The prominent increase inmotility, however, occurs after a significant latency of the order of10 sec. These results suggest that the increased electromotileresponse (Sziklai et al., 1996) needs to be classified as a “slow”effect (Sridhar et al., 1995), most likely mediated by metabotropicaction of the AChR.
Calcium release from internal storesIn these experiments, the brightest fluorescent signal was ob-served consistently in the infranuclear region and the subcuticularregion, as well as in some subcellular structures, presumablymitochondria. Similar to the findings of Ikeda and Takasaka(1993), the central portion of the cytoplasm, nucleus, and cuticu-lar plate were devoid of detectable fluorescence. The fluorescentregions are those in which Ca21 is membrane-bound. Fluores-
Figure 6. Example of square-pulse electrical stimulation (top trace: stim-ulus waveform, Vc 5 650 mV) of an isolated OHC in the microchamber,as in Figure 1A. Cell exclusion, q 5 0.2; here the displacement of theincluded, ciliated pole is measured. Total pulse duration: 60 msec. Cellcontraction is plotted down. Second trace, Control response in normalmedium. Third trace, Response in the presence of 30 mM ACh in Ca21-freemedium (containing 5 mM EGTA). Bottom trace, Response in normalmedium in the presence of 30 mM ACh.
Figure 7. A, Results of whole-cell patch recordings. Top trace is calibra-tion of the time course of ligand delivery. Depolarization of cell onpressure ejection of 130 mM KCl from the delivery pipette (20 mV verticalscale bar). The next three traces show time course of membrane hyperpo-larization from the indicated zero current potential (membrane potential)for three OHCs in response to 50 mM ACh (2 mV vertical scale bar). B,Results of microchamber experiments. Continuous electrical stimulationof the cell with 100 Hz sinusoidal voltage elicited sinusoidal electromotileresponse. Peak-to-peak amplitude of this response was measured in con-secutive 100 msec intervals and plotted as individual data points for threecells. Dotted horizontal line is the average pre-ACh motility amplitude.ACh (50 mM) delivery starts at time 0. Note logarithmic time scales.
2218 J. Neurosci., March 15, 1997, 17(6):2212–2226 Dallos et al. • ACh and Electromotility
cence measurements were taken from the cross-section of the cellbelow the cuticular plate.As with most fluorochromes, the fluorescent signal strength
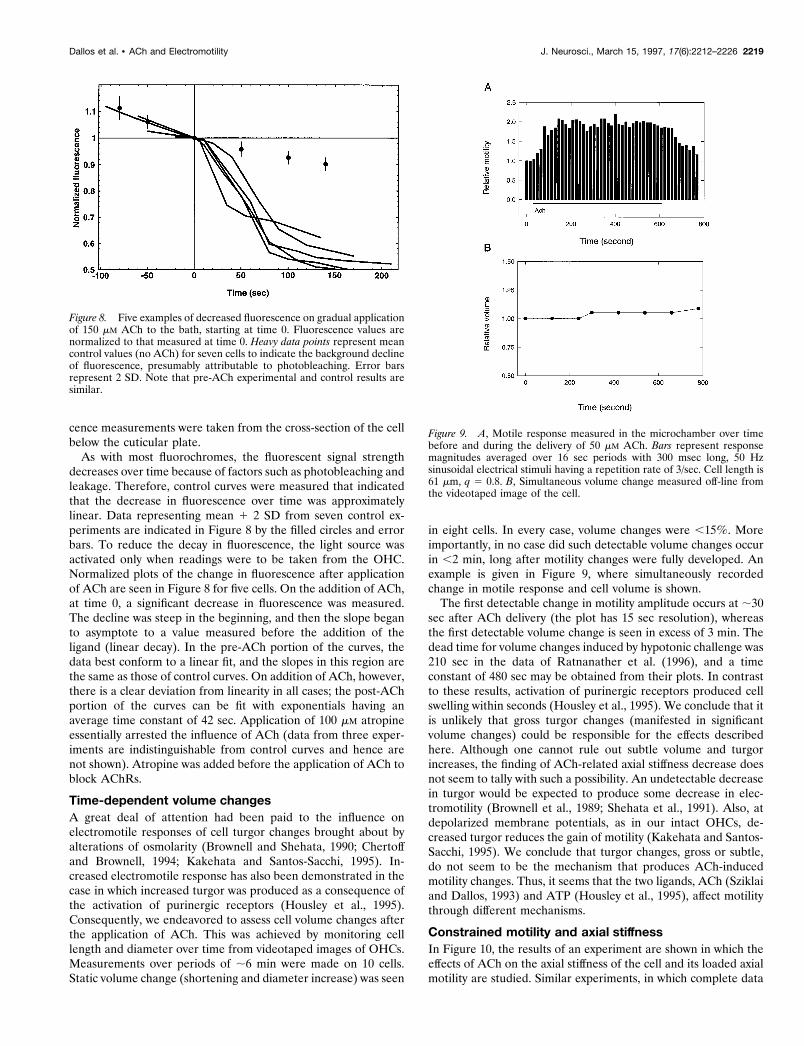
decreases over time because of factors such as photobleaching andleakage. Therefore, control curves were measured that indicatedthat the decrease in fluorescence over time was approximatelylinear. Data representing mean 1 2 SD from seven control ex-periments are indicated in Figure 8 by the filled circles and errorbars. To reduce the decay in fluorescence, the light source wasactivated only when readings were to be taken from the OHC.Normalized plots of the change in fluorescence after applicationof ACh are seen in Figure 8 for five cells. On the addition of ACh,at time 0, a significant decrease in fluorescence was measured.The decline was steep in the beginning, and then the slope beganto asymptote to a value measured before the addition of theligand (linear decay). In the pre-ACh portion of the curves, thedata best conform to a linear fit, and the slopes in this region arethe same as those of control curves. On addition of ACh, however,there is a clear deviation from linearity in all cases; the post-AChportion of the curves can be fit with exponentials having anaverage time constant of 42 sec. Application of 100 mM atropineessentially arrested the influence of ACh (data from three exper-iments are indistinguishable from control curves and hence arenot shown). Atropine was added before the application of ACh toblock AChRs.
Time-dependent volume changesA great deal of attention had been paid to the influence onelectromotile responses of cell turgor changes brought about byalterations of osmolarity (Brownell and Shehata, 1990; Chertoffand Brownell, 1994; Kakehata and Santos-Sacchi, 1995). In-creased electromotile response has also been demonstrated in thecase in which increased turgor was produced as a consequence ofthe activation of purinergic receptors (Housley et al., 1995).Consequently, we endeavored to assess cell volume changes afterthe application of ACh. This was achieved by monitoring celllength and diameter over time from videotaped images of OHCs.Measurements over periods of ;6 min were made on 10 cells.Static volume change (shortening and diameter increase) was seen
in eight cells. In every case, volume changes were ,15%. Moreimportantly, in no case did such detectable volume changes occurin ,2 min, long after motility changes were fully developed. Anexample is given in Figure 9, where simultaneously recordedchange in motile response and cell volume is shown.The first detectable change in motility amplitude occurs at ;30
sec after ACh delivery (the plot has 15 sec resolution), whereasthe first detectable volume change is seen in excess of 3 min. Thedead time for volume changes induced by hypotonic challenge was210 sec in the data of Ratnanather et al. (1996), and a timeconstant of 480 sec may be obtained from their plots. In contrastto these results, activation of purinergic receptors produced cellswelling within seconds (Housley et al., 1995). We conclude that itis unlikely that gross turgor changes (manifested in significantvolume changes) could be responsible for the effects describedhere. Although one cannot rule out subtle volume and turgorincreases, the finding of ACh-related axial stiffness decrease doesnot seem to tally with such a possibility. An undetectable decreasein turgor would be expected to produce some decrease in elec-tromotility (Brownell et al., 1989; Shehata et al., 1991). Also, atdepolarized membrane potentials, as in our intact OHCs, de-creased turgor reduces the gain of motility (Kakehata and Santos-Sacchi, 1995). We conclude that turgor changes, gross or subtle,do not seem to be the mechanism that produces ACh-inducedmotility changes. Thus, it seems that the two ligands, ACh (Sziklaiand Dallos, 1993) and ATP (Housley et al., 1995), affect motilitythrough different mechanisms.
Constrained motility and axial stiffnessIn Figure 10, the results of an experiment are shown in which theeffects of ACh on the axial stiffness of the cell and its loaded axialmotility are studied. Similar experiments, in which complete data
Figure 8. Five examples of decreased fluorescence on gradual applicationof 150 mM ACh to the bath, starting at time 0. Fluorescence values arenormalized to that measured at time 0. Heavy data points represent meancontrol values (no ACh) for seven cells to indicate the background declineof fluorescence, presumably attributable to photobleaching. Error barsrepresent 2 SD. Note that pre-ACh experimental and control results aresimilar.
Figure 9. A, Motile response measured in the microchamber over timebefore and during the delivery of 50 mM ACh. Bars represent responsemagnitudes averaged over 16 sec periods with 300 msec long, 50 Hzsinusoidal electrical stimuli having a repetition rate of 3/sec. Cell length is61 mm, q 5 0.8. B, Simultaneous volume change measured off-line fromthe videotaped image of the cell.
Dallos et al. • ACh and Electromotility J. Neurosci., March 15, 1997, 17(6):2212–2226 2219

sets were obtained in a given cell, were performed on seven cells.Furthermore, stiffness changes attributable to ACh were moni-tored in 14 additional cells, whereas changes in loaded electro-motile response were measured in eight cells. The cells wereinserted into the microchamber with their ciliated poles first, sothat ;80–90% was outside the chamber. A piezo-driven glassfiber was brought up against the synaptic pole (Fig. 1C). Unloadedand loaded fiber motion and unloaded and loaded motility weremeasured with and without ACh in the bath. The top single traceis the motion of the fiber when it does not contact the cell. The leftthree traces are control, and the right three traces are correspond-ing responses in the presence of 50 mM ACh. In this example wefirst note that on pushing the fiber against the cell, its amplitudedecreased to ;40% (Fig. 10, bottom left vs top single trace).Consequently, in this case the stiffness of the fiber is;66% of thatof the cell. Without the mechanical load by the fiber, electromotileamplitude increased ;100% when ACh was applied (Fig. 10,second row). The corresponding change in the loaded condition is62% (Fig. 10, third row). In the fourth row of the figure the axialmotion of the cell is shown as driven by the fiber. Here the cell isnot stimulated electrically. On application of ACh the amplitudeincreased by 62% (the mean change is 69.4%; SD 5 20.5% in 7cells). This implies that the stiffness of the cell decreased becauseof ACh to ;36% of its original value. A quantitative comparisonof ACh results, as manifested in changed electromotile amplitude
and stiffness, provides a consistency check on the model of ACheffect. This is considered in the Discussion.
THEORETICAL RESULTSLength versus radius changesThe electromotile response of OHCs consists of a prominent axialcomponent (dL, shortening and elongation) accompanied by amuch smaller radial component (dr, expansion and contraction)(Ashmore, 1987; Hallworth et al., 1993). In a whole-cell stimula-tion mode the axial and radial components are antiphasic, as thecell maintains constant volume. In the microchamber configura-tion (Dallos et al., 1993; Hallworth et al., 1993), length (dLi anddLo) and radius changes (dri and dro) are antiphasic for bothrespective partitioned cell segments (inside, i, and outside, o, ofthe microchamber), with the cell in toto, maintaining constantvolume. In this configuration any one variable, dLi for example,does not constrain its covariant (dri), because compensatorymovements can occur in the other partitioned cell segment (dLoand dro). Consequently, joint measurement of two variables canproduce revealing information.In previous publications we proposed a simple model for fast
electromotility of OHCs, as expressed in microchamber measure-ments (Dallos et al., 1991, 1993). The model is based on thenotion that motility is powered by the concerted action of a largenumber of voltage-sensing protein molecules associated with the
Figure 10. Experiment as in Figure 1C. Top trace is displacement of free fiber driven by a piezoelectric actuator. Second trace, Electromotileresponse of the cell without the fiber loading it. Third trace, As above but with the fiber attached to the cell. Fourth trace, Loaded fiber motion drivenby the piezoelectric actuator. Left column gives control conditions; right column provides corresponding data after application of 50 mM ACh. Celllength is 60 mm.
2220 J. Neurosci., March 15, 1997, 17(6):2212–2226 Dallos et al. • ACh and Electromotility
cell membrane. It was assumed that the motor is anisotropic inthat its displacement in the axial direction [da 5 F(dV)cosg] isdifferent from that in the circumferential direction [dc 5F(dV)sing]. F(dV) is the displacement of the motor along itshypothetical principal direction g, where the angle may be definedfrom the anisotropy of the displacement as cotg 5 da/dc. Themotor displacement is a stochastic function of the change inmembrane potential dV, expressed as a first-order Boltzmannrelationship:
F ~dV ! 5 do$ @1 1 exp~2adV 1 b! #21 2 @1 1 exp~b! #21% , (1)
where a and b are constants and do is the elementary displacementof the motor in the g direction. Here a somewhat simplifiedversion of the model is used to interpret new observations. In thisinitial discussion damping is ignored, because we attempt to fit themodel to very low frequency phenomena.Let us denote the length of the segment of the cell whose
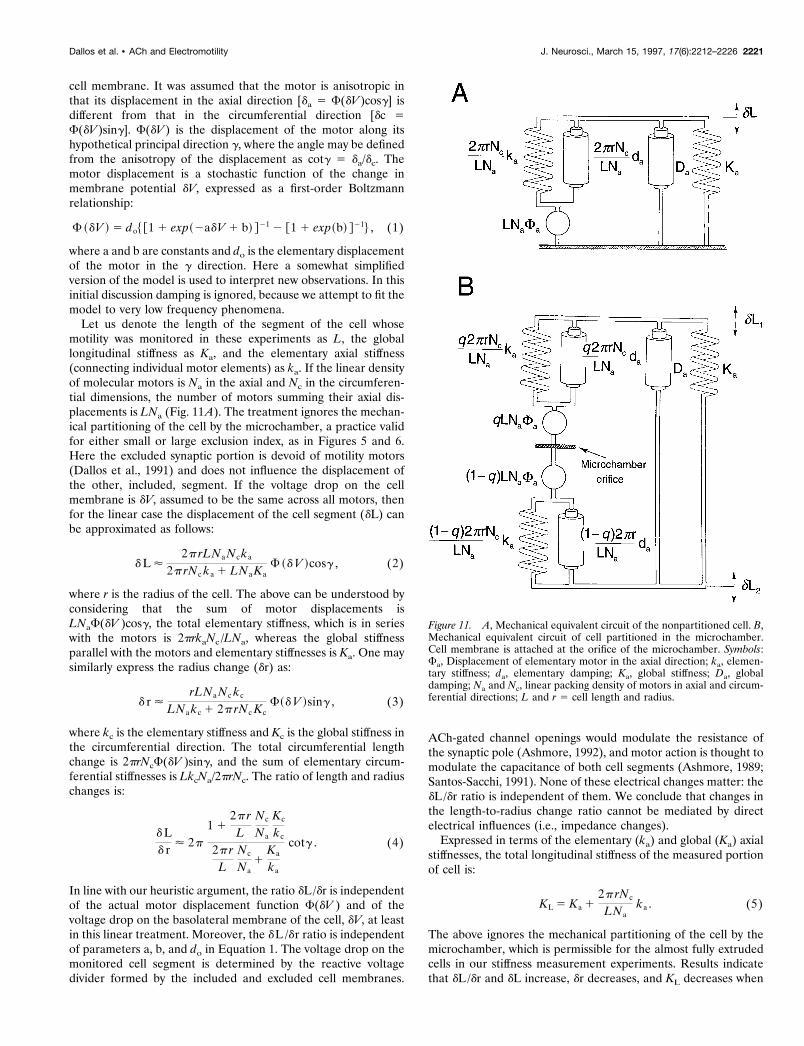
motility was monitored in these experiments as L, the globallongitudinal stiffness as Ka, and the elementary axial stiffness(connecting individual motor elements) as ka. If the linear densityof molecular motors is Na in the axial and Nc in the circumferen-tial dimensions, the number of motors summing their axial dis-placements is LNa (Fig. 11A). The treatment ignores the mechan-ical partitioning of the cell by the microchamber, a practice validfor either small or large exclusion index, as in Figures 5 and 6.Here the excluded synaptic portion is devoid of motility motors(Dallos et al., 1991) and does not influence the displacement ofthe other, included, segment. If the voltage drop on the cellmembrane is dV, assumed to be the same across all motors, thenfor the linear case the displacement of the cell segment (dL) canbe approximated as follows:
dL<2p rLNaNcka
2p rNc ka 1 LNaKaF ~dV !cosg , (2)
where r is the radius of the cell. The above can be understood byconsidering that the sum of motor displacements isLNaF(dV )cosg, the total elementary stiffness, which is in serieswith the motors is 2prkaNc /LNa, whereas the global stiffnessparallel with the motors and elementary stiffnesses is Ka. One maysimilarly express the radius change (dr) as:
d r<rLNaNc kc
LNakc 1 2p rNcKcF~dV !sing , (3)
where kc is the elementary stiffness and Kc is the global stiffness inthe circumferential direction. The total circumferential lengthchange is 2prNcF(dV )sing, and the sum of elementary circum-ferential stiffnesses is LkcNa/2prNc. The ratio of length and radiuschanges is:
dLd r
< 2p
1 12p rLNcNa
Kckc
2p rLNcNa
1Kaka
cotg . (4)
In line with our heuristic argument, the ratio dL/dr is independentof the actual motor displacement function F(dV ) and of thevoltage drop on the basolateral membrane of the cell, dV, at leastin this linear treatment. Moreover, the dL /dr ratio is independentof parameters a, b, and do in Equation 1. The voltage drop on themonitored cell segment is determined by the reactive voltagedivider formed by the included and excluded cell membranes.
ACh-gated channel openings would modulate the resistance ofthe synaptic pole (Ashmore, 1992), and motor action is thought tomodulate the capacitance of both cell segments (Ashmore, 1989;Santos-Sacchi, 1991). None of these electrical changes matter: thedL/dr ratio is independent of them. We conclude that changes inthe length-to-radius change ratio cannot be mediated by directelectrical influences (i.e., impedance changes).Expressed in terms of the elementary (ka) and global (Ka) axial
stiffnesses, the total longitudinal stiffness of the measured portionof cell is:
KL 5 Ka 12p rNcLNa
ka . (5)
The above ignores the mechanical partitioning of the cell by themicrochamber, which is permissible for the almost fully extrudedcells in our stiffness measurement experiments. Results indicatethat dL/dr and dL increase, dr decreases, and KL decreases when
Figure 11. A, Mechanical equivalent circuit of the nonpartitioned cell. B,Mechanical equivalent circuit of cell partitioned in the microchamber.Cell membrane is attached at the orifice of the microchamber. Symbols:Fa, Displacement of elementary motor in the axial direction; ka, elemen-tary stiffness; da, elementary damping; Ka, global stiffness; Da, globaldamping; Na and Nc, linear packing density of motors in axial and circum-ferential directions; L and r 5 cell length and radius.
Dallos et al. • ACh and Electromotility J. Neurosci., March 15, 1997, 17(6):2212–2226 2221

ACh is applied. These conditions can be fulfilled jointly if Ka/kadecreases and g decreases, or if Kc /kc increases along with adecrease of g. The constraint on KL (Eq. 5) shows immediatelythat it is necessary for Ka to decrease. If the number of motorsengaged in axial versus circumferential directions would change,i.e., Nc /Na were altered, then Equation 5 would require a decreasein the ratio, whereas Equations 2 and 3 would not be affectedsignificantly. Thus the large changes in motile response attribut-able to the application of ACh may be obtained by a decrease ing, coupled with a change in anisotropy. The latter implies lessen-ing of the axial stiffness of the cell with the possible concomitantincrease in circumferential stiffness and a possible change in theratio of effective motor densities, Nc /Na. The latter could comeabout through a differential change in coupling between motorsand the cortical lattice. As we show below, the dominant effectseems to be a decrease in Ka.
Interaction of cell stiffness and dampingThe above argument assumed that damping of OHCs is insignif-icant and that the cell can be modeled as a pure compliance. Wenow briefly consider how damping would influence responsedynamics.Consider the equivalent mechanical circuit of a nonpartitioned
cell (Fig. 11A). The aggregate of motors is in series with theaggregate of elementary stiffness elements (ka) and is parallel withthe aggregate of elementary damping elements (da). This complexworks against a load comprising the global stiffness (Ka) anddamping (Da) of the cell. Assuming that da 5 0 (the justificationfor this is developed below), the input stiffness of the cell isexpressed by Equation 5. The motile response may be computedfrom the following transfer function for the linear case:
dL52p rLka NaNc
KaLNa 1 2p rkaNc 1 sDaLNaF ~dV !cosg . (6)
This system has a single time constant:
t 5DaKa
1
1 12p rLNcNa
kaKa
. (7)
The combination of Equations 5 and 7 yields a simple relationbetween t, Da, and KL:
t 5DaKL. (8)
We did not make absolute stiffness measurements; however, theseare available from the literature. Hallworth (1995) recently sum-marized various measurements of the axial stiffness of the OHCs(KL). Although different experimenters obtain a rather broadrange of values, KL 5 1023 N/m is representative. With theassumption that motor density is the same in axial and circumfer-ential directions (Na5 Nc), all constants are now estimated exceptKa, ka, and Da. The first two, however are related via Equation 5.Taking an approximate resting value of Ka 5 2 1024 N/m and ka5 1.5 1023 N/m, the appropriate axial stiffness obtains for a 60 mmlong cell. The determination of Da is postponed until we considerresponses for partitioned cells. Then, if ka and Da are assumed tobe constant, one can examine the influence of Ka on the nature ofthe step-response of dL, as we do below.It is of interest to consider transient and steady-state responses
in partitioned cells. Sziklai et al. (1996) showed that both steady-state and initial transients change after application of ACh. Whenthe cell is inserted into the microchamber with its synaptic poleoutside, so that only the infranuclear region extrudes, then theoutside segment does not possess motility motors (Dallos et al.,1991; Huang and Santos-Sacchi, 1993). Thus, although there is noactive mechanical input contributed by the outside segment, itdoes function as an added mechanical load. One may derive atransfer function based on Figure 11B for the displacement of thecell segment inside the microchamber, using the exclusion coeffi-cient q (Fig. 1A).
dL5
5@qKaLNa 1 2prkaNc 1 s~qDaLNa 1 2prdaNc!#L~12 q!Na
~ka 1 sda!@KaLNa 1 2prkaNc 1 s~DaLNa 1 2prdaNc#
F~dV !cosg . (9)
This transfer function posesses one zero and two real poles. Thestep response derived from it does not have an instantaneoustransient step component, in contrast to all available microcham-ber data (Fig. 6). If the elementary damping is neglected (da 5 0),the transfer function reduces to that shown in Equation 10:
dL5qKaLNa 1 2p rkaNc 1 sqDaLNaKaLNa 1 2p rkaNc 1 sDaLNa
L ~1 2 q!NaF ~ dV ! cosg . (10)
When the cell is partitioned mechanically by the microchamber,the two cell segments both possess arrays of elementary stiffnessand damping elements, assumed to be associated with the ele-mentary molecular motors. The two cell segments are also con-nected by some global internal stiffness and damping (Fig. 11B).If the elementary damping is negligible, analysis of the equivalentmechanical circuit reveals that the frequency response of eithercell segment is all-pass (Eq. 10). This mirrors the all-pass (lag–lead network) nature of the electrical partitioning of the cellmembrane in the microchamber. Previously we assumed that thefrequency response of electromotility measured in the micro-chamber could be completely accounted for by the electricalproperties of the cell membrane and that the mechanical proper-ties of the cell were unlikely to influence the response (Dallos andEvans, 1995). In fact, the microchamber configuration yields bothelectrical and mechanical partitioning, and measurements reflectthis combined all-pass nature. Thus we obtained zero-slope high-frequency asymptote in the frequency response function up to 24kHz (Dallos and Evans, 1995). The step response obtained fromEquation 10, reflecting this all-pass characteristic, possesses aninitial instantaneous transient rise, followed by an exponentialtransition to steady-state, as demonstrated by all of our micro-chamber data.Equation 10 can provide one additional useful result. For a fully
inserted cell (q 5 0), the equation reduces to a form identical tothat derived for the patched whole cell (Eq. 6). The function hasa single pole; hence its step response is a single exponential. Thisresult reflects the fact that for a fully inserted cell there is nolonger mechanical partitioning; however, in the microchamberthere is still electrical partitioning (Dallos and Evans, 1995). InEquation 6 this means that the voltage drop across the motor-bearing membrane (dV) has all-pass properties. It is then possibleto determine the time constant of the mechanical system (Eq. 7)
2222 J. Neurosci., March 15, 1997, 17(6):2212–2226 Dallos et al. • ACh and Electromotility

from step responses obtained in the microchamber at q 5 0. Weexamined a sample of nine onset responses obtained with an A/Dsampling rate of 1 MHz and a D/A sampling rate of 100 kHz andfound that the average t is 48.8 msec (SD 5 14.6 msec). Using KL5 1023 N/m, Equation 8 yields Da 5 5 1028 N sec /m.Analysis suggests that there are two ways to achieve joint
changes seen in both the initial rise (the transient response) andthe steady-state plateau attributable to ACh. As we have shownbefore (Sziklai et al., 1996), in a partitioned cell, both responsecomponents change (also see Fig. 6). The experimental results canbe duplicated if the global damping is small and global stiffnessdecreases are caused by ACh. Alternatively, the results also obtainif global stiffness and damping are both decreased because ofACh. The possibility of elementary stiffness increase, also yieldingresponse changes in the right direction, can be ruled out becauseit would also increase the longitudinal stiffness of the cell, contraryto results (Fig. 10). Using values derived above, ka 5 1.5 1023
N/m, Da 5 5 1028 N sec /m, along with q 5 0.2, L 5 60 mm, r 55 mm, Na 5 Nc 5 80/mm, g 5 158, one can examine the effect ofvarying Ka on transient and steady-state responses. Simulationreveals that both of these components increase approximately thesame amount, with a decrease in global stiffness, Ka, which issimilar to experimental evidence (Sziklai et al., 1996). It is thenconcluded that changes in Ka attributable to ACh are sufficient toaccount for the behavior of step responses.Are the measured stiffness changes sufficient to explain low-
frequency changes in electromotility? In other words, does a givenmeasured change in Ka provide quantitative agreement with thechange in dL, via Equation 2? This question can be answered byreturning to the data shown in Figure 10. Indicate the ratio ofamplitudes of driven fiber motion loaded by the cell to free fibermotion as A1. Then
Kfiber 5 KcellA1
1 2 A1, (11)
where Kfiber is the stiffness of the driving fiber and Kcell is the axialstiffness of the cell (KL in Eq. 5). Denote the ratio of celldeflection driven by the fiber in the presence and in the absenceof ACh as A2. Then one can compute the following relationship:
KACh
cell 5 Kcell1 2 A1A2A2 2 A1A2
. (12)
Next, one measures the ratio of electromotile responses underfiber load in the presence of and without ACh as A3. Then withthe assumption that elementary stiffness does not change (seeabove) and that global stiffness change is solely responsible for thechange in axial motility, one can express:
A3 5Kfiber 1 Kcell
Kfiber 1 KACh
cell
5Kcell
A1Kcell1~12A1!KACh
cell
5A2 .
(13)
This is a powerful prediction, which seems to be fulfilled. FromFigure 10 one measures A1 5 0.4, A2 5 1.6, and A3 5 1.6. Fromsimilar data obtained in four cells, we compute the average A2 as1.52 and the average A3 as 1.54.Finally, one more internal check is available. If A4 is the ratio of
unloaded motility with and without ACh, then, again assumingthat only the global cell stiffness changes:
A4 5Kcell
KACh
cell
. (14)
The right-hand side of the equation is already available fromEquation 12 and yields a value of 2.5. The measured A4 is 2.2,giving acceptable agreement. It is concluded that the global axialstiffness decrease attributable to ACh can account for the low-frequency change in electromotile response.
DISCUSSIONMechanism of the ACh effectFigure 2 shows that I–V curves obtained by us, with or withoutACh, are similar to those of others (Housley and Ashmore,1991; Erostegui et al., 1994; Blanchet et al., 1996; Evans, 1996).The effect of ACh is to increase conductance and hyperpolarizethe cell. Intact cells are generally depolarized, as ascertainedfrom the initial zero-current membrane potential; however,all mechanical effects discussed below are similar in intact(low membrane potential) and patch-clamped cells held atnormal membrane potential (270 mV) (Dallos et al., 1982).The principal effect on electromotility is a significant increasein small-signal gain and an increase in response magnitude.Magnitude increase occurs at all input voltage levels, even ifthe pre-ACh motile response is saturated. All effects are elim-inated if the bathing medium is free of calcium.Nonspecific effects of the ligand can be ruled out by the dem-
onstration of a well defined dose–response relation (Fig. 4A,B),showing half-activation concentration and Hill coefficient similarto those found by others using ACh-activated membrane currentas an index. Thus our values are KD 5 21.3 mM and n 5 1.6. Forcomparison, in various hair cell preparations Housley and Ash-more (1991) obtained KD 5 13.5 mM, n 5 1.9; Shigemoto andOhmori (1991), 19 mM, n5 1.6; and McNiven et al. (1996), 22 mM,n 5 1.7. The corresponding values for the a9 AChR are 10 mM,n 5 1.3 (Elgoyhen et al., 1994). Also, strychnine, a potent antag-onist of the hair cell AChR (Eybalin, 1993) and the a9 receptor(Elgoyhen, 1994), produced effects similar to those shown byothers (Fig. 4C). One concludes that the increased electromotileresponse is mediated by the well studied hair cell AChR.Ligand-produced conductance change of the synaptic mem-
brane alters the voltage drop on the motor-bearing cell mem-brane. In a previous publication (Sziklai et al., 1996), theoreticaldL-V curves were presented, showing the effect of a change inconductance and hence in driving voltage. Assuming that cellularmechanics is linear and that response saturation is attributable tothe stochastic nature of the motor (Dallos et al., 1993) (Eq. 1), achange in driving voltage cannot alter the saturation levels ofsteady-state functions but can only contract and expand themhorizontally: the gain changes but the maximum response doesnot. This is contrary to all data presented, which show that notonly the gain but the maximum (saturated) response increasesbecause of ACh. Consequently, the change in electromotile re-sponse does not occur because of a conductance change. Thesame argument applies to the possibility that ACh influences thegain of the motor molecule (a in Eq. 1). Assuming that Equation1 is a correct model for the motor, a change in gain (a) cannotinfluence the saturated response magnitude. It was also shownthat a change in membrane resistance does not affect the transientresponse, because the high-frequency content transient input volt-
Dallos et al. • ACh and Electromotility J. Neurosci., March 15, 1997, 17(6):2212–2226 2223

age is divided on the capacitive voltage divider formed by includedand excluded cell membranes in the microchamber. Changes intransient responses attributable to ACh are prominent (Fig. 6)(Sziklai et al., 1996), and once again we conclude that they cannotbe mediated by membrane conductance changes. The presence ofboth transient and steady-state changes with ACh, in the contextof the theoretical considerations presented above, also suggeststhat there is essentially no damping in the connection betweenadjacent motor elements and that the total internal damping ofthe cell is small. Conversely, there is probably elastic couplingbetween adjacent motor molecules, and in addition the aggregateof motors works against some global internal stiffness (plus smalldamping) of the cell. It is principally the global stiffness (Ka) thatseems to be controlled by the efferent neurotransmitter.Both fast (rapid changes in membrane current and membrane
potential) and slow ACh effects (motility and stiffness changes)can be elicited in OHCs, regardless of their length (or as a roughcorrelation, cochlear position of origin). Although ACh effects onmotility are greater for shorter (more basal) OHCs (Sziklai et al.,1996), all cells show similar qualitative results. This is in contrastto in vivo experiments, which indicate that slow effects are greatestfor ;14 kHz (Sridhar et al., 1995). Our results suggest that thebasic cellular mechanism that produces the slow effect is presentin all OHCs.The arguments presented above suggest that the principal cause
of increased electromotile response is a decreased global axialstiffness of the OHC. In other words, the aggregate of molecularmotors that drive motility works against a smaller load in thepresence of ACh and thereby produces larger cell excursion for agiven electrical stimulus. The precursor events to these stiffnesschanges are largely clarified (Art et al., 1985; Housley and Ash-more, 1991; Fuchs and Murrow, 1992; Erostegui et al., 1994;Blanchet et al., 1996, Evans, 1996; McNiven et al., 1996). Theimmediate cause of the stiffness decrease, however, is as yetobscure.Activation of the AChR produces a sequence of transient Ca21
influx and subsequent K1 efflux. The latter hyperpolarizes the cellmembrane. These initial events are the straightforward manifes-tations of the ionotropic receptor process of the AChR. The OHCAChR shows unusual a9-type pharmacology (Elgoyhen et al.,1994), and the initial events have further, delayed consequences.Whether AChR acts via G-protein-coupled second messengercascade (Kakehata et al., 1993) or uses calcium as a secondmessenger directly (Sridhar et al., 1995; Murugasu and Russell,1996b), it is almost certain that one step in the metabotropicaction of the AChR is the release of calcium from internal stores.Our demonstration of calcium release from internal stores, with atime course similar to “slow” efferent effects, suggests the possi-bility that the global stiffness decrease is somehow tied to eitherdecreased sequestered Ca21 levels in the cisternal region or to anincreased level of cytosolic calcium. A possible target is the largelyaxial spectrin links between adjacent circumferential actin fila-ments in the cortical lattice (for summary, see Holley, 1996). Apossible mechanism is protein phosphorylation (Sziklai etal., 1997).
Implications for in vivo efferent actionFinally, let us consider that an increased motile response attribut-able to the action of the neurotransmitter ACh seems to becontrary to available data on the influence of the medial efferentsystem on cochlear response, which is inhibitory. Moreover, it isthe consensus that efferent inhibition occurs by the reduction in
the gain of the cochlear amplifier (Kim, 1986; Guinan, 1996). Amajority assume that somatic length change of OHCs (producing“negative damping,” Neely and Kim, 1983) is the effective feed-back variable. The alternative view is that basilar membranereactance (stiffness) changes can account for cochlear amplifica-tion (Allen, 1990; Kolston et al., 1990). Both the classical fast andnewly described slow efferent effects (Sridhar et al., 1995) areinhibitory, and both have been assumed to result from electricalconductance changes in OHCs. Although our data do not examinefast effects, it is clear that the slow effects might be interpreteddifferently: they could be attributable to OHC stiffness change.Yet, assuming that stiffness change of the basilar membrane–organ of Corti system underlies cochlear amplification to produceincreased basilar membrane vibration, local stiffness needs todecrease. It is hazardous to extrapolate from changes in isolatedcells to the complex organ of Corti–basilar membrane feedbacksystem, and the results could be counter-intuitive. Nevertheless,one might assume that both increased motility amplitude anddecreased stiffness would increase basilar membrane vibration.We seem to have a fundamental contradiction between the effectsproduced by the efferent neurotransmitter ACh on isolated OHCsand its alleged influence in vivo. To examine this contradictionprofitably, let us examine what is commonly meant by “efferentinhibition.”Electrical stimulation of the olivocochlear bundle (Guinan,
1996) produces inhibition via both the fast and slow mechanisms.Electrical stimulation is likely to excite most myelinated medialefferent fibers. Thus virtually the entire efferent system is acti-vated, producing a family of effects in most OHCs. This impliesthat with the “standard” means of activating the efferents, the wellknown inhibition arises from a nonselective mass influence bymost OHCs. It is commonly assumed that cochlear amplificationarises from energy delivered to the basilar membrane from agroup of OHCs that are somewhat basal to the location corre-sponding to the stimulus frequency (Neely and Kim, 1983). Shock-activated efferent influence on OHCs is presumably similar atboth locations—indeed, at all locations. The integrated effect ofthese spatially similar efferent inputs is a preferential reduction ofresponse at the BF place. The experiment of Murugasu andRussell (1996b) demonstrated reduction in basilar membranemotion at BF on perfusion of scala tympani with ACh and alsoshowed clearly that the integrated influence of the ligand on awide array of OHCs produces the inhibition at BF. Consideringthe time course of changes seen by Murugasu and Russell(1996b), theirs is obviously a slow effect. It is not readily apparenthow the integration occurs, and the matter has not been examinedin the literature. Whether the individual unit (OHC) is inhibited,which is the general notion, or facilitated, which is suggested bythe present data, has yet to be proven. It is not obvious whetherfacilitation or inhibition may be more effective.Another presumed means of activating the efferent system is
with contralateral sound input (Buno, 1978; Liberman, 1988). It isobserved that contralateral sounds, with frequency content similarto the ipsilateral target sound, can produce small attenuation ofthe response to the latter. This attenuation is probably the resultof sound-evoked activity (Fex, 1962) in medial olivocochlear fi-bers. These fibers show tuning, that is, frequency selectivity, andthey clearly deliver their information to spatially limited segmentsof the ipsilateral cochlea. This implies that whatever the efferentsdo in that target region, it ultimately produces a reduction in theinput of inner hair cells. In other words, cochlear mechanicalresponse is reduced. Contralateral sound presumably influences
2224 J. Neurosci., March 15, 1997, 17(6):2212–2226 Dallos et al. • ACh and Electromotility

the ipsilateral ear via the fast efferent effect. Whether there is aslow contralateral effect is as yet unknown.It is difficult to ascribe an inhibitory influence to the changes in
OHC properties reported here and thus to reconcile the resultswith the in vivo experiment most akin to ours, that of Murugasuand Russell (1996b). Two possible explanations could be invented.First, as alluded to above, the local feedback system in the organof Corti is extremely complex, and we simply do not understandhow spatially distributed changes in some of the elements affectthe overall response. It is thus conceivable that mechanicalchanges in a large group of OHCs produce an overall effectopposite to that intuited from the behavior of a single element.Second, if somatic OHC motility is not the principal variable incochlear amplification, then the present results simply tell a storyabout changes in an epiphenomenon. It has not been ruled outthat voltage-controlled ciliary stiffness changes (Hudspeth, 1989;Evans and Dallos, 1993) are the important mechanism.
REFERENCESAllen JB (1990) Modeling the noise damaged cochlea. In: The mechanicsand biophysics of hearing (Dallos P, Geisler CD, Matthews JW, Rug-gero MA, Steele CR, eds), pp 324–332. Berlin: Springer.
Art JJ, Fettiplace R, Fuchs PA (1984) Synaptic hyperpolarization andinhibition of turtle cochlear hair cells. J Physiol (Lond) 356:525–550.
Art JJ, Crawford AC, Fettiplace R, Fuchs PA (1985) Efferent modula-tion of hair cell tuning in the cochlea of the turtle. J Physiol (Lond)360:397–421.
Ashmore JF (1987) A fast motile response in guinea pig outer haircells: the cellular basis of the cochlear amplifier. J Physiol (Lond)388:323–347.
Ashmore JF (1989) Transducer motor coupling in cochlear outer haircells. In: Mechanics of hearing (Wilson JP, Kemp DT, eds), pp 107–113.New York: Plenum.
Ashmore JF (1992) Mammalian hearing and the cellular mechanisms ofthe cochlear amplifier. In: Sensory transduction (Corey DP, Roper SD,eds), pp 396–412. New York: Rockefeller UP.
Blanchet C, Erostegui C, Sugasawa M, Dulon D (1996) Acetylcholine-induced potassium current of guinea pig outer hair cells: its dependenceon a calcium influx through nicotinic-like receptors. J Neurosci16:2574–2584.
Brown MC, Nuttall AF (1984) Efferent control of cochlear inner hair cellresponses in the guinea-pig. J Physiol (Lond) 354:625–646.
Brownell WE, Shehata WE (1990) The effect of cytoplasmic turgor pres-sure on the static and dynamic mechanical properties of outer hair cells.In: The mechanics and biophysics of hearing (Dallos P, Geisler CD,Matthews JW, Ruggero MA, Steele CR, eds), pp 52–60. Berlin:Springer.
Brownell WE, Bader CR, Bertrand D, de Ribaupierre Y (1985) Evokedmechanical responses of isolated cochlear hair cells. Science227:194–196.
Brownell WE, Shehata WE, Imredy JP (1989) Slow electrically andchemically evoked volume changes in guinea pig outer hair cells. In:Biomechanics of active movement and deformation of cells (Akkas N,ed), pp 493–498. New York: Springer.
Buno W (1978) Auditory nerve fiber activity influenced by contralateralear sound stimulation. Exp Neurol 59:62–74.
Caswell AH (1971) Visualization of membrane bound cations by a fluo-rescent technique. Biochem Biophys Res Commun 55:710–716.
Chandler DE, Williams JA (1978) Intracellular divalent cation release inpancreatic acinar cells during stimulus-secretion coupling: use of chlor-tetracycline as fluorescent probe. J Cell Biol 76:371–385.
Chertoff ME, Brownell WE (1994) Characterization of cochlear outerhair cell turgor. Am J Physiol 266:C467–C479.
Dallos P (1992) The active cochlea. J Neurosci 12:4575–4585.Dallos P, Evans BN (1995) High frequency motility of outer hair cellsand the cochlear amplifier. Science 267:2006–2009.
Dallos P, Santos-Sacchi J, Flock Å (1982) Intracellular recordings fromouter hair cells. Science 218:582–584.
Dallos P, Evans BN, Hallworth R (1991) Nature of the motor element inelectrokinetic shape changes of cochlear outer hair cells. Nature350:155–157.
Dallos P, Hallworth R, Evans BN (1993) Theory of electrically drivenshape changes of cochlear outer hair cells. J Neurophysiol 70:299–323.
Dallos P, He DZZ, Lin X, Evans BN, Sziklai I (1997) Efferent control ofcochlear mechanics: outer hair cells. In: Diversity in auditory mechanics(Lewis ER, Long GR, Leake PA, Narins PM, Steele CR, eds), Singa-pore: World Scientific, in press.
Doi T, Ohmori H (1993) Acetylcholine increases intracellular Ca21 con-centration and hyperpolarizes the guinea-pig outer hair cell. Hear Res67:179–188.
Dolan DF, Nuttall AL (1994) Basilar membrane movement by sound isaltered by electrical stimulation of the crossed olivocochlear bundle.Abstr Assoc Res Otolaryngol 17:356.
Elgoyhen AB, Johnson DS, Boulter J, Vetter DE, Heinemann S (1994)Alpha 9: an acetylcholine receptor with novel pharmacological proper-ties expressed in rat cochlear hair cells. Cell 79:705–715.
Erostegui C, Norris CH, Bobbin RP (1994) In vitro pharmacologic char-acterization of a cholinergic receptor on outer hair cells. Hear Res74:135–147.
Evans MG (1996) Acetylcholine activates two currents in guinea-pigouter hair cells. J Physiol (Lond) 491:563–578.
Evans BN, Dallos P (1993) Mechanomotility and ciliary stiffness changein cochlear outer hair cells. Abstr Assoc Res Otolaryngol 16:116.
Evans BN, Dallos P, Hallworth R (1989) Asymmetries in motile re-sponses of outer hair cells in simulated in vivo conditions. In: Cochlearmechanisms (Wilson JP, Kemp DT, eds), pp 205–206. New York:Plenum.
Evans BN, Hallworth R, Dallos P (1991) Outer hair cell electromotility:the sensitivity and vulnerability of the DC component. Hear Res52:288–304.
Eybalin M (1993) Neurotransmitters and neuromodulators of the mam-malian cochlea. Physiol Rev 73:309–373.
Fex J (1962) Auditory activity in centrifugal and centripetal cochlearfibers in cat. Acta Physiol Scand 55[Suppl 189]:1–68.
Fuchs PA, Murrow BW (1992) Cholinergic inhibition of short (outer)hair cells of the chick’s cochlea. J Neurosci 12:800–809.
Galambos R (1956) Suppression of auditory nerve activity by stimulationof efferent fibers to cochlea. J Neurophysiol 19:424–437.
Guinan Jr JJ (1996) Physiology of olivocochlear efferents. In: The co-chlea (Dallos P, Popper AN, Fay RR, eds), pp 435–502. New York:Springer.
Hallworth R, Evans BN, Dallos P (1993) The location and mechanismof electromotility in guinea pig outer hair cells. J Neurophysiol 70:549–558.
Hamill OP, Marty A, Neher E, Sakmann B, Sigworth FJ (1981) Im-proved patch-clamp techniques for high-resolution current recordingfrom cells and cell-free membrane patches. Pflugers Arch 391:85–100.
Holley MC (1996) Outer hair cell motility. In: The cochlea (Dallos P,Popper AN, Fay RR, eds), pp 386–434. New York: Springer.
Housley GD, Ashmore JF (1991) Direct measurement of the action ofacetylcholine on isolated outer hair cells of the guinea pig cochlea. ProcR Soc Lond [Biol] 244:161–167.
Housley GD, Ashmore JF (1992) Ionic currents in outer hair cells iso-lated from the guinea pig cochlea. J Physiol (Lond) 448:73–98.
Housley GD, Norris CH, Guth PS (1990) Cholinergically inducedchanges in outward currents in hair cells isolated from the semicircularcanal of the frog. Hear Res 43:120–134.
Housley GD, Connor BJ, Raybould NP (1995) Purinergic modulation ofouter hair cell electromotility. In: Active hearing (Flock Å, Ottoson D,Ulfendahl M, eds), pp 221–238. London: Pergamon.
Huang G, Santos-Sacchi J (1993) Mapping the distribution of the outerhair cell motility sensor by electrical amputation. Biophys J65:2228–2236.
Hudspeth JA (1989) How the ear’s works work. Nature 341:397–404.Ikeda K, Takasaka T (1993) Confocal laser microscopical images ofcalcium distribution and intracellular organelles in the outer hair cellsisolated from the guinea pig cochlea. Hear Res 66:169–176.
Kachar B, Brownell WE, Altschuler R, Fex J (1986) Electrokinetic shapechanges of cochlear outer hair cells. Nature 322:365–368.
Kakehata S, Santos-Sacchi J (1995) Membrane tension directly shiftsvoltage dependence of outer hair cell motility and associated gatingcharge. Biophys J 68:2190–2197.
Kakehata S, Nakagawa T, Takasaka T, Akaike N (1993) Cellular mech-anism of acetylcholine induced response in dissociated outer hair cellsof guinea-pig cochlea. J Physiol (Lond) 463:227–244.
Kim DO (1986) Active and nonlinear cochlear biomechanics and the role
Dallos et al. • ACh and Electromotility J. Neurosci., March 15, 1997, 17(6):2212–2226 2225
of outer-hair-cell subsystem in the mammalian auditory system. HearRes 22:105–114.
Kolston PJ, de Boer E, Viergever MA, Smoorenburg GF (1990) Whattype of force does the cochlea amplifier produce? J Acoust Soc Am88:1794–1801.
Liberman MC (1988) Response properties of cochlear efferent neurons:monaural vs. binaural stimulation and the effects of noise. J Neuro-physiol 60:1779–1798.
Lin X, Hume RI, Nuttall AL (1993) Voltage-dependent block by neomy-cin of the ATP-induced whole cell current of guinea-pig outer hair cells.J Neurophysiol 70:1593–1605.
McNiven AI, Yuhas WA, Fuchs PA (1996) Ionic dependence and agonistpreference of an acetylcholine receptor in hair cells. Aud Neurosci2:63–77.
Murugasu E, Russell IJ (1996a) The effect of efferent stimulation onbasilar membrane displacement in the basal turn of the guinea pigcochlea. J Neurosci 16:325–332.
Murugasu E, Russell IJ (1996b) The role of calcium on the effects ofintracochlear acetylcholine perfusion on basilar membrane displace-ment in the basal turn of the guinea pig cochlea. Aud Neurosci2:363–376.
Neely ST, Kim DO (1983) An active cochlear model showing sharptuning and high sensitivity. Hear Res 9:123–130.
Nieder P, Nieder I (1970) Stimulation of efferent olivocochlear bundlecauses release from low level masking. Nature 227:184–185.
Rajan R (1988) Effect of electrical stimulation of the crossed olivoco-chlear bundle on temporary threshold shifts in auditory sensitivity. I.Dependence on electrical stimulation parameters. J Neurophysiol60:549–568.
Ratnanather JT, Zhi M, Brownell WE (1996) The ratio of elastic moduliof cochlear outer hair cells derived from osmotic experiments. J AcoustSoc Am 99:1025–1028.
Reiter ER, Liberman MC (1995) Efferent mediated protection fromacoustic overexposure: relation to “slow” effects of olivocochlear stim-ulation. J Neurophysiol 73:506–514.
Santos-Sacchi J (1989) Asymmetry in voltage-dependent movements ofisolated outer hair cells from the organ of Corti. J Neurosci9:2954–2962.
Santos-Sacchi J (1991) Reversible inhibition of voltage-dependent outerhair cell motility and capacitance. J Neurosci 11:3096–3110.
Santos-Sacchi J (1992) On the frequency limit and phase of outer haircell motility: effects of the membrane filter. J Neurosci 12:1906–1916.
Santos-Sacchi J, Dilger JP (1988) Whole cell currents and mechanicalresponses of isolated outer hair cells. Hear Res 35:143–150.
Sewell WF (1996) Neurotransmitters and synaptic transmission. In: Thecochlea (Dallos P, Popper AN, Fay RR, eds), pp 503–533. New York:Springer.
Shehata WE, Brownell WE, Dieler R (1991) Effects of salicylate onshape, electromotility and membrane characteristics of isolated outerhair cells from guinea pig cochlea. Acta Otolaryngol (Stockh)111:707–718.
Shigemoto T, Ohmori H (1990) Muscarinic antagonists and ATP in-crease the intracellular Ca21 concentration in chick cochlear hair cells.J Physiol (Lond) 420:127–148.
Shigemoto T, Ohmori H (1991) Muscarinic receptor hyperpolarizes co-chlear hair cells of chick by activating Ca21-activated K1 channels.J Physiol (Lond) 442:669–690.
Sridhar TS, Liberman MC, Brown MC, Sewell WF (1995) A novel cho-linergic “slow” effect of efferent stimulation on cochlear potentials inthe guinea pig. J Neurosci 15:3667–3678.
Steinacker A, Rojas L (1988) Acetylcholine modulated potassium chan-nel in the hair cell of the toadfish saccule. Hear Res 35:265–270.
Sziklai I, Dallos P (1993) Acetylcholine controls the gain of the voltage-to-movement converter in isolated outer hair cells. Acta Otolaryngol(Stockh) 113:326–329.
Sziklai I, He DZZ, Dallos P (1996) Effect of acetylcholine and GABA onthe transfer function of electromotility in isolated outer hair cells. HearRes 95:87–99.
Sziklai I, He DZZ, Dallos P (1997) Phosphorylation mediates acetylcholine-induced gain andmagnitude increase ofOHCelectromotility.AbstrAssocResOtolaryngol, in press.
Wiederhold ML (1970) Variations in the effects of electric stimulation ofthe crossed olivocochlear bundle on cat single auditory nerve-fiberresponses to tone bursts. J Acoust Soc Am 48:966–977.
Wiederhold ML, Kiang NYS (1970) Effects of electric stimulation of thecrossed olivocochlear bundle on single auditory-nerve fibers in the cat.J Acoust Soc Am 48:950–965.
Winslow RL, Sachs MB (1987) Effect of electrical stimulation of thecrossed olivocochlear bundle on auditory nerve responses to tones innoise. J Neurophysiol 57:1002–1021.
Yates GK (1990) The basilar membrane nonlinear input-output func-tion. In: The mechanics and biophysics of hearing (Dallos P, GeislerCD, Matthews JW, Ruggero MA, Steele CR, eds), pp 106–113. Berlin:Springer.
Zenner HP, Zimmerman U, Kepp U (1986) High frequency motility ofouter hair cells. Arch Otorhinolaryngol 243:343–344.
2226 J. Neurosci., March 15, 1997, 17(6):2212–2226 Dallos et al. • ACh and Electromotility