achievement, anxiety, self-concept and motivation among
TRANSCRIPT

University of New MexicoUNM Digital Repository
Mathematics & Statistics ETDs Electronic Theses and Dissertations
2-1-2012
Achievement, anxiety, self-concept and motivationamong college algebra students within acooperative learning structureCandace Oluwasanmi
Follow this and additional works at: https://digitalrepository.unm.edu/math_etds
This Thesis is brought to you for free and open access by the Electronic Theses and Dissertations at UNM Digital Repository. It has been accepted forinclusion in Mathematics & Statistics ETDs by an authorized administrator of UNM Digital Repository. For more information, please [email protected].
Recommended CitationOluwasanmi, Candace. "Achievement, anxiety, self-concept and motivation among college algebra students within a cooperativelearning structure." (2012). https://digitalrepository.unm.edu/math_etds/37

i
Candace R. Oluwasanmi Candidate
Mathematics and Statistics
Department
This thesis is approved, and it is acceptable in quality and form for publication:
Approved by the Thesis Committee:
Dr. Kristin Umland , Chairperson
Dr. Alexander Stone
Victoria Kauffman

ii
ACHIEVEMENT, ANXIETY, SELF-CONCEPT AND MOTIVATION AMONG
COLLEGE ALGEBRA STUDENTS WITHIN A COOPERATIVE LEARNING
STRUCTURE
BY
CANDACE OLUWASANMI
B.S., MATHEMATICS
THESIS
Submitted in Partial Fulfillment of the
Requirements for the Degree of
Master of Science
Mathematics
The University of New Mexico
Albuquerque, New Mexico
December, 2011

iii
DEDICATION
תודה לך אלוהים מלך היקום! האב ובנו רוח הקודש אתה הם כל הסיבות שלי!
To my husband Muyiwa, there are not enough words to express what a wonderful
husband you are. Without your love, support and encouragement I know I would not be
where I am today. And I know I would not have enjoyed the ride nearly as much without
you. Mo ni ife re! To my parents, thank you both for doing your best with me and my
brother, I know it wasn‟t easy. To my brother Lawerence, the smart one; you have
continually found new ways to challenge me and therefore have made me a more critical
thinker. By being yourself, through example, you have raised the bar for me, because of
this I expect so much more of myself. Thank you for your love, support and
encouragement throughout my life. To my Aunt LaVern you are not just my godmother
but also my best friend. Thank you for all that you are to me.
A mis buenos amigos Melba Colón Bujosa y Juan Bujosa, que estaban allí para
mí cuando yo más te necesitaba. Gracias por su amor y apoyo. To the late Dr. William
McCarthy, my mentor and friend of twelve years, thank you for wholeheartedly believing
in me and supporting me in so many ways. Through your life you showed me that it is a
great and joyous honor to invest in people. You truly made this world a better place to
live. You are greatly missed.

iv
ACKNOWLEDGEMENTS
To Dr. Kristin Umland, thank you for all the many hours spent advising me and
chairing my committee. And a very sincere thank you for being the most difficult
professor I have ever had. In your wisdom you continued to be an understanding and kind
advisor, yet you resolved to persevere with me through my program to obtain the fullest
yield of my work. I have learned the most from you.
I would also like to thank my other committee members, Dr. Alexander Stone and
Victoria Kauffman, for their time and many contributions to this project as well as my
professional development, even after their retirement.
I would like to heartily acknowledge the long term support of Dr. William
McCarthy, Ed Misquez and Belen Lowery of New Mexico State University. You all have
believed in me and supported me from the very first semester of my baccalaureate
program all the way through the completion of my masters program. You all have done
so much for me. I would not have an education without your support. Thank you.
I would also like to acknowledge Adriana Aceves and Dr. Gary Smith for
enabling me to learn firsthand the practical implementations of cooperative learning; Jim
Dudley, Armida Carbajal, Shirley Rey Lovato and Claudia Gans for their help in
constructing and implementing this project. I would also like to acknowledge Dr.
Olwasanmi, Zoe Johnson and Aaron Baca for their contributions in collecting the data,
which was a great feat in itself. I also acknowledge Dr. Nosedal-Sanchez, Yong Lin and
Glen Stark for their many contributions to the statistical analysis; Laurie Price, and the
other TAs and PTIs who participated; and to Dr. Hell for her helpful suggestions for final
revisions.

v
ACHIEVEMENT, ANXIETY, SELF-CONCEPT AND MOTIVATION AMONG
COLLEGE ALGEBRA STUDENTS WITHIN A COOPERATIVE LEARNING
STRUCTURE
by
Candace Oluwasanmi
B.S., Mathematics, University of New Mexico, 2007
M.S., Mathematics, University of New Mexico, 2011
ABSTRACT
Cooperative learning methods have been shown to increase student achievement
and social skills, therefore these methods have been promoted for the intervention of
falling student achievement. This study was designed to examine the differences between
a traditional lecture classroom structure and a cooperative learning structure in student
achievement, anxiety, self-concept and motivation among College Algebra students. The
sample is a convenience sample since participants were taken from pre-formed sections
of College Algebra at a large urban university. This is a quantitative study, designed as a
2 × 2 factorial quasi-experiment. Using multivariate and univariate analysis of variance
procedures, math achievement, anxiety, self-concept and motivation gains are examined.
In addition, predictions about the target population‟s probability of passing the course for
both treatment and comparison groups are estimated using a logistic regression analysis.
vi
TABLE OF CONTENTS
Approval page ............................................................................................................................ i
Title page ................................................................................................................................... ii
Dedication................................................................................................................................. iii
Acknowledgements .................................................................................................................. iv
Abstract ......................................................................................................................................v
Table of Contents..................................................................................................................... vi
LIST OF FIGURES............................................................................................................... viii
LIST OF TABLES................................................................................................................... ix
CHAPTER 1: INTRODUCTION ............................................................................................1
Contextual Background .......................................................................................................1
Overview of the Study .........................................................................................................3
Structure of the Study ..........................................................................................................4
Overview of Results .............................................................................................................5
CHAPTER 2: REVIEW OF THE LITERATURE ................................................................8
Five Key Elements for Success............................................................................................8
Conventional Implementations of Cooperative Learning ....................................................9
Group Process Behavior ....................................................................................................10
Group Process Behavior and Psychological Factors .........................................................11
CHAPTER 3: METHODS ......................................................................................................14
Research Design.................................................................................................................14
Participants .........................................................................................................................16
Instrumentation and Measurement .....................................................................................16
Procedure ...........................................................................................................................18
Application of the Cooperative Learning Treatment .........................................................20
Timeline of the Study.........................................................................................................22
Scoring and Coding............................................................................................................23
Data Analysis .....................................................................................................................24
CHAPTER 4: RESULTS ........................................................................................................26
Response ............................................................................................................................26
Descriptive Statistics ..........................................................................................................26
Multivariate Analysis of Variance .....................................................................................31
Algebra Preliminary and Final Exams ...............................................................................32
Anxiety Pretest and Posttest...............................................................................................40

vii
Self-Concept Pretest and Posttest ......................................................................................41
Motivation Pretest and Posttest ..........................................................................................43
Logistic Regression ............................................................................................................45
Validity ..............................................................................................................................48
CHAPTER 5: DISCUSSION ..................................................................................................52
Restatement of the Study Purpose .....................................................................................52
Summary of Procedures and Methods ...............................................................................52
Result Implications ............................................................................................................54
Recommendations for Further Research ............................................................................59
APPENDICIES ........................................................................................................................61
APPENDIX A: SUPPLEMENTARY FIGURES .................................................................61
APPENDIX B: SUPPLEMENTARY TABLES....................................................................64
APPENDIX C: ALGEBRA PRELIMINARY EXAM .........................................................69
APPENDIX D: ALGEBRA FINAL EXAM ..........................................................................73
APPENDIX E: ANXIETY INSTRUMENT ..........................................................................78
APPENDIX F: SELF-CONCEPT INSTRUMENT .............................................................79
APPENDIX G: MOTIVATION INSTRUMENT .................................................................80
APPENDIX H: GLOSSARY OF SPECIALIZED TERMS ................................................81
REFERENCES ........................................................................................................................84

viii
LIST OF FIGURES
Figure 4.1 age distributions .......................................................................................................61
Figure 4.2 gender distributions ..................................................................................................61
Figure 4.3 ethnicity distributions ..............................................................................................62
Figure 4.4 distribution of students who tested into College Algebra ........................................62
Figure 4.5 distribution of students who completed intermediate algebra .................................63
Figure 4.6 distribution of student‟s socio-economic status .......................................................63
Figure 4.7 preliminary exam and algebra gain for comparison group ......................................37
Figure 4.8 preliminary exam and algebra gain for treatment group ..........................................37
Figure 4.9 box plot of preliminary exam ...................................................................................39
Figure 4.10 box plot of final exam ............................................................................................39
Figure 4.11 logistic regression equations ..................................................................................47

ix
LIST OF TABLES
Table 4.1 response by population ..............................................................................................64
Table 4.2 Chi-square test for gender .........................................................................................27
Table 4.3 ethnicity by population ..............................................................................................64
Table 4.4 condensed ethnicity cross tabulation .........................................................................28
Table 4.5 Chi-square test for ethnicity ......................................................................................29
Table 4.6 condensed socio-economic status cross tabulation ...................................................30
Table 4.7 Chi-square test for socio-economic status .................................................................30
Table 4.8 multivariate tests .......................................................................................................64
Table 4.9 MANOVA tests between subjects.............................................................................65
Table 4.10 ANOVA tests between subjects for algebra gain ....................................................33
Table 4.11 parameter estimates for algebra gain .......................................................................34
Table 4.12 ANOVA tests between subjects for anxiety gain ....................................................40
Table 4.13 parameter estimates for anxiety gain .......................................................................41
Table 4.14 ANOVA tests between subjects for self-concept gain ............................................42
Table 4.15 parameter estimates for self-concept gain ...............................................................43
Table 4.16 ANOVA tests between subjects for motivation gain ..............................................44
Table 4.17 parameter estimates for motivation gain .................................................................44
Table 4.18 parameter estimates for logistic regression .............................................................47
Table 4.19 test for normality .....................................................................................................67
Table 4.20 tests for homogeneity of covariance matrices .........................................................67
Table 4.21 tests for correlations between instruments ..............................................................68

1
CHAPTER 1
Introduction
Contextual Background
It is well documented that many students from elementary school through
graduate school have an attitude of contempt, fear or aversion towards learning
mathematics (Hersh & John-Steiner, 2011). In conjunction with this negative disposition
to learning mathematics, students are more inclined to avoid active engagement in math
and often concede to poor academic achievement (2011). Common reasons students
provide to account for their poor performance is that they have never been good at math,
or don‟t see the use for it, or they just don‟t like it, and consequently they tend to avoid
taking mathematics courses (2011). Along with these students‟ perceptions of
mathematics, student achievement has decreased in the United States in comparison to
other countries. One study on international mathematics literacy ranked the United States
27th
(of 39 participating countries) in combined mathematics literacy with performance
averages of 20 other countries significantly higher than the United States (Lemke et al.,
2004). Unless appropriate interventions are implemented, the educational outcomes of
students in the United States will continue to fall short.
Academic achievement of College Algebra students at the university involved in
this study is no exception. The average failure rate for College Algebra students from the
fall semester of 1998 to the spring semester of 2009 was 47.6% (Institutional Data). For
many students this is not their first attempt to pass the course. With an average
enrollment of 968 students per semester, this means that if effective intervention is not
implemented in the future, approximately 450 students will fail this course each semester.

2
With many universities and colleges facing similar problems, this university has been
aware of the issue and has attempted to implement interventions over the years. In
addition to instructor office hours, students have been offered many other opportunities
for extra help. Below is a list of supplemental resources and interventions the university
has provided to help increase the success rates for College Algebra students.
1. University sponsored peer-tutoring has been offered since 1980 in multiple sites
across campus and online.
2. Department sponsored one-on-one tutoring is offered by course instructors.
3. Grant supported peer mentors inside the classrooms of many basic freshmen courses,
including College Algebra. Mentors help their students maneuver the particulars of
the university by providing social, cultural, and academic support inside and outside
the classroom which includes, but is not limited to tutoring.
4. Peer-tutoring for minority students sponsored by the College of Engineering.
5. An online interactive homework application integrated with the textbook that shows
examples to similar problems; breaks problems into smaller parts and references the
exact page of the textbook that supports the concept or skill being learned.
Administrators have continued to monitor the success/failure rates of College Algebra
and in recent years decided to try a new approach. During the semester students were
sampled for this study, the mathematics department, working in conjunction with a
university office which supports faculty development, piloted a new cooperative learning
initiative to improve the success rates for College Algebra students. Although this
approach had not previously been implemented in College Algebra generally, it has been
applied within discrete sections of the course as well as other university departments

3
where the study was conducted.
Within the past four decades there have been approximately 1,200 studies
comparing individualistic and/or competitive methods (the standard pedagogical styles)
with cooperative methods to help improve student learning and achievement (Johnson,
Johnson, & Smith 1998; Jacob, 1999). These studies have shown that despite some
obstacles, cooperative learning can be an effective intervention to improve student
achievement. In addition to this positive effect on student achievement, studies on
cooperative learning have provided evidence of psychological and social benefits for
students across various fields of study. This added benefit makes cooperative learning
particularly advantageous. Not only are these benefits an essential quality in the work
place, but interventions known to incorporate a positive influence on student‟s social,
affective and motivational attributes (in addition to increased achievement) are desirable
since they have also been shown to help improve mathematics performance (National
Mathematics Advisory Panel, 2008)
Overview of the Study
This study compared cooperative learning methods and lecture methods
implemented in College Algebra classrooms at a large urban research university. The first
hypothesis is that students in the treatment group (cooperative learning classrooms) will
have lower anxiety, higher achievement, self-concept and motivation compared to the
comparison group (traditional lecture classrooms). Previous research has suggested that
gender differences may exist since gender is a predictor of group interaction styles for
small groups (Valentino, 1988; Webb, 1986). Thus, the second hypothesis is that females

4
in the treatment group will have decreased anxiety and increased self-concept and
motivation when compared to the comparison group. In addition gender differences are
expected within the treatment group. Specifically males in the treatment group are
expected to have a less significant change in anxiety than females in the treatment group,
while a parallel increase between males and females in self-concept and motivation is
expected. Lastly, students in the treatment group are expected to be more likely to pass
the course than students in the comparison group.
Structure of the Study
Students were not randomly assigned to the treatment group or the comparison
group, rather, students registered for a section of College Algebra of their choosing
without any prior knowledge of which sections were to be taught using the cooperative
learning method. Prior to the beginning of the semester, instructors elected to implement
a cooperative learning method or a standard lecture method. Subsequently instructors
were placed into the section numbers that coincided with their schedule. Considering
these conditions already in place, this study is structured as a 2 × 2 factorial quasi-
experiment, where the two independent variables are teaching method and gender,
supplemented with a logistic regression analysis comparing the probability of success in
the course between students in cooperative learning sections and students in lecture
sections. Analysis of variance procedures will compare the means of the treatment and
comparison groups on four dependant variables. To obtain a more clear view of the
participant population, demographic data was collected to help facilitate and monitor
confounds.

5
Ten variables are measured for each participant to investigate whether students in
the treatment group demonstrated lower anxiety, higher achievement, self-concept and
motivation compared to the comparison group. The independent variables for the study
are teaching method and gender for the 2 × 2 factorial analysis and logistic regression
analysis. The dependent variables are the preliminary exam, final exam, anxiety (pretest
and posttest), self-concept (pretest and posttest), motivation (pretest and posttest).
Overview of Results
At the beginning of data collection 566 students consented to participate and
completed pretests. By the end of data collection, the number of participants was 173 in
total, with N = 86 for the treatment group and n = 87 for the comparison group. To
determine if the two groups are comparable, descriptive statistics were collected and
distribution comparisons are made where appropriate. Placement qualifications are
reported and are comparable for the two groups. A two-sample t-test suggested the two
groups are comparable in age distributions. The test is used to compare distributions
of gender, ethnicity and socio-economic status. All three tests indicate the two groups
are comparable with these distributions.
Univariate and multivariate analysis of variance procedures are conducted
on all instrumentation. Backward elimination is applied to obtain a more parsimonious
result for the analysis of variance procedures. Multivariate tests indicate the preliminary
exam, anxiety pretest, self-concept pretest and treatment/comparison group (called group
in subsequent writing) variables are significant, with p-values < .001 for all four
variables. The univariate test for the algebra achievement gain indicates the preliminary

6
exam, self-concept pretest and group variables are significant, with p-values of < .001,
.007 and .005 respectively. The univariate test for anxiety gain indicates the anxiety
pretest, self-concept pretest and group variables are significant, with p-values of < .001,
< .001 and .063 respectively. The univariate test for self-concept gain indicates the self-
concept pretest and group variables are significant, with p-values of .001, and .038
respectively. The univariate test for motivation gain indicates the motivation pretest and
group variables are significant with p-values of .027, and < .001 respectively. The logistic
regression analysis indicates the overall probability of passing the course is greater for
students in the treatment group and is also dependent upon preliminary (algebra pretest)
exam performance.
The study validation is three-fold. First, internal consistency is examined for the
preliminary exam, final exam, anxiety, self-concept and motivation instruments. By
design, all internal consistency assessment values range between 0 and 1, with a value of
one indicating the instrument is consistent 100% of the time. Internal consistencies of the
preliminary exam, final exam, anxiety, self-concept and motivation instruments are
calculated at .48, .71, .92, .98 and .93 respectively. Second, analysis of variance test
assumptions are examined. Analyses indicate the data do not satisfy all test assumptions
of: a simple random sample, (multivariate) normal distribution, homogeneity of
covariance matrices and independence of observations. Finally, the logistic regression
test assumptions are inspected. With the exception of the non-randomization of the
sample, test assumptions are generally satisfied with respect to the assumptions of: a
dichotomous result, statistically independent outcomes, specificity, mutually exclusive

7
and collectively exhaustive categories and a minimum of fifty cases or more per
predictor.

8
CHAPTER 2
Review of the Literature
Cooperative learning is a type of Problem Based Learning, which is a pedagogy
that centers on the student. In a Problem Based Learning course students are divided into
groups of approximately two to five and given a structured task or problem. The students
are then expected to interpret the problem, gather the needed information, identify
possible solutions, evaluate options and present conclusions with the teacher acting only
as a guide (Roh, 2003). At the heart of Problem Based Learning is the cooperative
learning method; which has its tertiary origins from social interdependence, cognitive-
developmental and behavioral learning theories (Johnson, Johnson, & Smith, 1998).
Five Key Elements for Success
Research on cooperative learning methods has increased over the last 40 years,
and they have been shown to be an effective intervention for the success of students in
mathematics (Johnson, Maruyama, Johnson, Nelson, & Skon, 1981; Slavin, 1990;
Townsend & Wilton, 2003). Johnson, Johnson, and Smith derived the following five key
elements critical for successful implementation of the cooperative learning method
(1998).
1. First, the instructor must ensure each student perceives that his/her success is reliant
on the success of the group; this is called positive interdependence and can be
achieved by group rewards, dividing resources among students within the group, or
assigning complementary roles to each group member (Slavin, 1983; Johnson et
al.,1998).
2. The second element is individual accountability. This is where each student should

9
be individually assessed, by quizzes, exams, observations, etc. (Slavin, 1983; Johnson
et al., 1998).
3. The third key element is to create an environment of cooperation, where students
promote each other‟s success within each group. This is done by students helping,
supporting, encouraging and praising classmates‟ efforts face to face (Johnson et al.,
1998).
4. The fourth element needed is social skills, both interpersonal and small-group
(Johnson et al. 1998). The social skills that should be modeled are leadership,
decision making, trust building, communication and conflict management. In short,
students need to be guided to cooperate with each other.
5. Finally the students need to be provided time to work on group processing (Johnson
et al. 1998). Group processing is time students take to evaluate themselves and their
cooperation with each other. They will identify positive and negative actions and
make decisions on what actions to change so that group processes become more
efficient (1998).
Conventional Implementations of Cooperative Learning
Johnson, Johnson and Smith‟s five key elements for success are the foundation of
many common types of cooperative classroom structures. The most commonly
recognized implementations first divide students into assigned heterogeneous groups of
approximately four to six members which are chosen from groups of high, medium and
low achievers, ethnicity, gender and handicap. After groups are formed in class, typically
a Student Team Learning (STL), Jigsaw, Learning Together (LT), Group Investigation or

10
Team Assisted Individualization (TAI) structure is implemented (Slavin, Sharon, Kagan,
Lazarowitz, Webb, & Schmuck, 1985; Slavin, 1990; Jacob, 1999). Within STL, there are,
different methods of implementation consisting of Student Teams-Achievement
Divisions (STAD), Teams-Games-Tournament (TGT), and Jigsaw II, a modification of
the original Jigsaw structure (Slavin, Sharon, Kagan, Lazarowitz, Webb, & Schmuck,
1985; Slavin, 1990; Jacob, 1999). The TAI implementation is of particular interest
because it was developed specifically for implementation in mathematics classes due to
the difficulty of using previously developed standard CL structures (Slavin, Sharon,
Kagan, Lazarowitz, Webb, & Schmuck, 1985).
Group Process Behavior
Apart from of the type of cooperative learning structure an instructor chooses to
implement, student learning and achievement is dependent upon group dynamics. Past
research has shown that student actions within a group, including seating position,
talkativeness, personality and leadership, are important variables for the successful
cooperation of the group (Jaques, 1991). Another study on group process behaviors found
that the outcome task performance (such as the learning and/or achievement of students
on a given task or assignment) of a group is a product of the potential productivity minus
the process loss (Hurley, & Allen, 2007). Potential productivity is a combination of the
resources available to students along with the task demands put upon the students. For
instance, resources may include books, information, preparedness for the course, and
supplies available such as rulers, compasses or calculators; demands put upon the
students may be tasks assigned, teacher expectations, class schedule, etc. Process loss can

11
be thought of as the time taken from student learning and instead is used for the
administration of the teaching method. For instance, students need to take time to form
groups, realize task demands, communicate and coordinate strategies/solutions to
produce a desirable group outcome. In general, the process loss is composed of the
coordination loss, difficulties of coordinating multiple participants and student motivation
loss (2007).
Hurley and Allen, through a qualitative analysis identified seven categories of
student process loss behaviors (2007). The first two categories include preoccupation
with the authority figure, i.e. the professor, or preoccupation with others in the group
(2007). Students were also observed to be off-task in two ways, either passive, i.e.
spacing out, or aggressive, i.e. attempting to distract others from the task (2007). In
addition, three types of controlling behaviors were also identified. Directing-controlling
was demonstrated by students‟ attempts to control or structure roles or behaviors of other
students (2007). Resistant aggressive behaviors were displayed as non-constructive
criticism of other students (2007). Resistant passive aggressive students would exhibit
behaviors that disrupt cooperation within their group (2007).
Group Process Behavior and Psychological Factors
Student behaviors and leadership are derived from personal views and beliefs as
well as environmental reinforcements (Dowd & Kelly, 2005; Jaques, 1991). The process
loss behaviors of preoccupation with the authority or other students can be an indication
of student anxiety with the course content. Here anxiety refers to “feelings of tension that
interfere with the manipulation of numbers and the solving of mathematical problems in a

12
wide variety of ordinary and academic situations” from Tobias (as cited in Townsend, &
Wilton, 2003). Similarly the off-task passive and aggressive behaviors can be resulting
from a lack of motivation. Motivation is “the internal state of the student that arouses,
directs and sustains goal-oriented behavior” (Glynn, Taasoobshirazi, Brickman, 2009).
The three remaining process loss behaviors of directing-controlling, resistant aggressive
and resistant passive aggressive can all be derivatives of a students‟ self-concept relative
to the content area studied, where self-concept refers to “a student‟s beliefs, feelings,
attitudes and/or perceptions regarding one‟s ability to understand and perform tasks in
mathematics” (Townsend, & Wilton, 2003; Gourgey, 1982). However, self-concept,
anxiety and motivation may be contributing to any or all of the seven process loss
behaviors.
Despite the presence of these seven process loss behaviors in cooperative learning
classrooms, students enrolled in these classrooms have demonstrated higher academic
and social gains when compared to students in a competitive and/or an individualistic
structure (Akinoğlu & Tandoğan, 2006; (Johnson & Johnson, 1981; Schmuck &
Schmuck, 1983; Sharan & Sharan, 1976; Slavin, 1983, 1989) as cited in Mulryan, 1995;
Johnson, Maruyama, Johnson, Nelson & Skon, 1981; Valentino, 1988). In addition to
these separate studies, a comparative meta-analysis of 168 studies on cooperative
learning in college revealed that cooperative learning students repeatedly demonstrated
academic gains greater than students in competitive or individualistic classrooms
(Johnson, Johnson & Smith, 1998). Two other studies on tertiary students in the West
Virginia (studying College Algebra) and in New Zealand (studying statistics)
demonstrated lower anxiety in cooperative classrooms (Townsend & Wilton, 2003;

13
Valentino, 1988). Students in New Zealand also experienced higher motivation when
instructors use a cooperative learning method (Townsend & Wilton, 2003). Bouris, Creel
& Stortz found motivation gains are greater in cooperative classrooms in comparison to
traditional classrooms, since there is a direct correlation between motivation and the
active involvement of the learner (1998). Furthermore, students report a higher self-
concept in cooperative classrooms (Townsend, Tuck, Moore, & Wilton, 1998). Other
studies have suggested that math self-concept is related to math anxiety in college
students, and students who exhibit higher anxiety will also demonstrate lower motivation
(Marsh & Tapia, 2002; Gourgey, 1982).

14
CHAPTER 3
Methods
Research Design
The study design is three-fold. From the outset of this project the intention has
been to use a 2(Group) x 2(Gender) factorial design alongside a logistic regression
analysis. The factorial portion of the design utilizes analysis of variance procedures to
determine if there is a difference among (dependent) variable means on Factor 1 (Group)
and Factor 2 (Gender). As the name (2 × 2 factorial design) implies, there are two
categorical choices for each factor. That is, for Factor 1 (Group) students can be either in
the treatment group (cooperative learning) or the comparison group (traditional lecture);
for Factor 2 (Gender) students are classified as either male or female. The factorial design
utilizes a 2 (Group) x 2 (Gender) MANOVA procedure to investigate possible
multivariate effects and interactions. Since sample data and instrumentation do not
maximally satisfy MANOVA test assumptions, a series of ANOVA procedures is
conducted, one on each dependent variable. Backward elimination is then applied to both
multivariate and univariate analysis to obtain a more parsimonious result. Logistic
regression analysis is used to determine if treatment students are more likely to pass the
course, based on relevant predictor variables. However, because the sample was not
randomized, a static-group pretest-posttest structure along with descriptive statistics are
used to clarify and qualify the former analysis (Fraenkel & Wallen, 2009). The static
group analysis is applied to only the algebra instrumentation to further detail treatment
effects on this dependent variable.

15
As in all static-group pretest-posttest experiments, the treatment and comparison
groups are sampled at the same time (Fraenkel & Wallen, 2009). Standard analysis of
static-group experiments involves mapping an individuals‟ pretest score against their
respective posttest gain. In this case, the pretest is the preliminary exam and the posttest
is the final exam; the gain calculated is called the algebra achievement gain. Achievement
gain is calculated by subtracting the students‟ preliminary exam score from their final
exam score (2009). This type of description is preferable because it provides a better
description of the change in individual student performance. It is also worth noting that
for this type of analysis, a student‟s potential for achievement gain is inversely related to
their preliminary exam performance. Because of this inverse relationship, students who
performed very well on the preliminary exam have little opportunity, if any to increase
their performance on the final exam.
Comparing pretest performance to gain does provide a useful description of the
change in individual achievement; although this description is limited since only one
variable is evaluated at a time. Another more comprehensive analysis will be useful in
illuminating main effects and interactions between variables. For this purpose a
MANOVA test was chosen. The MANOVA test examines possible differences among
(dependent variable) mean gains on two factors. A series of ANOVA tests are performed
post-hoc on each dependent variable, to check for differences among mean gains on
Factor 1 and Factor 2. This series of ANOVA tests are included to support MANOVA
results, since the algebra, anxiety, self-concept and motivation instruments are somewhat
intercorrelated. To predict if students in the treatment group are more likely to pass the
course, predictor coefficients are provided using logistic regression.

16
Participants
The target population was all students enrolled in College Algebra at a large
urban university. The accessible population was students enrolled in College Algebra
during fall of 2009, approximately 1,200 students. The treatment and comparison groups
were both sampled from this accessible population. The treatment sample is taken from
the group of students enrolled in any section using cooperative learning methods. The
comparison sample is taken from the group of students enrolled in any traditional lecture
section. A majority (21 sections of 23 total sections) of instructors teaching sections of
College Algebra at the university‟s main campus allowed student recruitment. After
student recruitment was complete, the total number of students consenting to participate
was 566.
Instrumentation and Measurement
This study includes two independent variables, eight dependant variables as well
as demographic measures to help monitor confounds. The independent variables are
group and gender. Group was determined by the teaching method in the class the student
was enrolled in and was established by section number. Section number was reported by
each student and confirmed by the university Registrar. Gender was self-reported through
a demographic survey. Anxiety, self-concept and motivation pretests and posttest were
also self-reported and measured by Likert scale. The math anxiety inventory (see
Appendix E) has a range of total summed scores of 20-80 on the original inventory (Betz,
1978). The math self-concept inventory (see Appendix F) has a range of total summed
scores of 27-135 on the original inventory (Gourgey, 1982). The science motivation

17
questionnaire for non-science majors inventory (see Appendix G) has a range of total
summed scores of 30-150 on the original inventory (Glynn, Taasoobshirazi, Brickman,
2009).
Algebra gain is the (raw percent) gain earned from the algebra preliminary exam
(see Appendix C) to the algebra final exam (see Appendix D), ranging from -100 to 100.
To prevent any scoring inconsistencies, the preliminary and final exams were scored by
scantron at the university‟s Information and Technology Test Scoring department, not by
individual instructors. Results for both algebra exams were rescored in Microsoft Excel
after the end of the semester to ensure accuracy.
The online pretests and posttests were verbatim; however the algebra pretest and
posttest were not. The intent of the preliminary algebra exam is to measure the basic
prerequisite knowledge, providing a baseline measurement of Intermediate Algebra
competency for each student. Familiarity with topics such as linear equations,
inequalities, polynomials, factoring, exponents, radicals, fractional expressions and
equations, quadratic equations, perimeters, areas of simple geometric shapes, logarithms
and problem solving skills is assumed upon entering College Algebra and is tersely
assessed by the preliminary exam (Institutional Data). The intent of the algebra final
exam is to measure College Algebra competency. Upon successful completion,
competency in evaluating equations, functions, graphs, polynomial, rational, exponential,
logarithmic functions and particularly linear and quadratic functions is expected along
with application and problem solving skills involving simple geometric objects
(Institutional Data). While calculating achievement gain is helpful for seeing a change in
individual performance, the exact meaning of achievement is somewhat elusive here

18
since these two exams tested different content knowledge. The preliminary exam tested
for Intermediate Algebra proficiency while the final exam tested for College Algebra
proficiency. Using the same pretests and posttests would have been ideal. However the
preliminary and final exams were the measures in place during data collection. For this
study these two exams are assumed to have similar scale measurements.
Procedure
All twenty-three section instructors of College Algebra at the university‟s main
campus were recruited to participate. Of these, twenty-one section instructors chose to
participate in the study. Instructors were then given a synopsis of the study including
expectations, procedures and rights of students and instructors. During the second week
students were recruited in class, as a group, within each section. Students were given an
oral synopsis of the study‟s purpose, expectations and participant rights during this
recruitment.
After recruitment, students were sent an email invitation directing them to the
online survey. After students logged into the survey site, they were provided with a
written informed consent on the first page. Each student was asked if they agreed and still
wished to participate. Student participation was encouraged through the incentive of extra
credit. The amount of extra credit offered was selected by individual section instructors.
To prevent coercion, an alternative math assignment was offered for the same amount of
extra credit (within each student‟s respective section) to students who wished not to
participate. The synopsis provided on the informed consent page was as nebulous as

19
possible to help minimize students purposely skewing data. The synopsis included the
following:
Research Purpose: “The purpose of this study is to investigate teaching methods to
help improve the quality of mathematics instruction at the university.”
Research Focus: “Teaching methods are the focus of this study.”
Participant Requirements: “Students will need to complete an online demographic
survey, in class preliminary and final exam, and an online entry and exit inventory.”
Informed Consent: “When you login online to take the survey, the first page will be
your informed consent to participate. If you agree, click “Yes” and you will be taken
to the survey. If you do not agree, click “No”, you will be logged out immediately
and your data will not be recorded.”
Notice of ability to drop out of the study: “Participants will reserve the right to skip
any questions they do not wish to answer and/or withdraw from the study without any
adverse consequences.”
Students received individual email invitations to the online surveys on the second
and fifteenth weeks of the semester. Students were given approximately one week to
complete the online surveys. Student responses to the online surveys and in class exams
were maintained for less than one year by the university‟s Information and Technology
department. In addition to the data maintained at the Information and Technology
department, the principal investigator collected and stored students‟ final course grade,
GPA and section number, which were provided by the university‟s Registrar in order to
ensure the accuracy of self-reported data.

20
Application of the Cooperative Learning Treatment
The cooperative learning treatment was applied in two separate ways. The first
treatment application was designed by an experienced cooperative learning instructor
who implemented the application in her section alone. Her design is straight forward.
Students are expected to prepare for class by completing handwritten notes from the
textbook on the section that will be studied in class. A typical class begins with a review
of common mistakes from students‟ previous work and an introduction of the day‟s
concepts and goals. Next students are assigned a list of problems to complete within their
groups, with priority given to a different problem for each group. After students have
collaborated with their peers and the instructor, they present their priority problems to the
entire class. After class, students synthesize their learning by completing an online
homework assignment which reinforces the concepts learned in class. The second
cooperative learning application is more fluid and explicit, since the other twenty section
instructors are considered novice instructors because their experience using cooperative
learning methods is minimal.
To provide support, resources and save preparation time for the novice
cooperative instructors, curriculum was prepared before the beginning of the semester by
mathematics faculty and divided into ten teachable units. Each teachable unit set a mental
stage for the instructor to prepare and guide student learning and provided a listing of
pre-class, in-class and after class activities. Instructor‟s then tailored these teachable units
to design their classes based on the skills and needs of their students. Each teachable unit
also included a list of what students should be able to do after completing the unit and
how the unit contributes to the overall importance and relevancy of the course objectives.

21
In addition, the teachable units included the activities and expectations students should
satisfy in order to demonstrate their mastery of the unit and course objectives.
Students were expected to be prepared for in-class activities by completing
specific reading assignments, homework and quizzes prior to attending class. During
class, students were encouraged to work problems themselves, work and discuss
strategies with peers in small groups and make direct contact with the instructor. After
class, students synthesized their learning by completing an online quiz that assessed their
knowledge of unit objectives. Direction was also provided in the teachable unit to the
instructors, so they could judiciously spend their time in class facilitating the cooperative
learning method and explaining how students should work within their groups. Finally a
schedule suggestion was included in each teachable unit. The schedule recommended
instructors:
1. At the beginning of class, address misconceptions and common mistakes from
previous work.
2. Introduce goals for the next class session and a plan to achieve these goals.
3. At the end of class provide a brief conclusion and summary that integrates the day‟s
concepts and introduces concepts for the next class session.
Although these two applications were not based on any of the common
cooperative classroom structures, they did incorporate Johnson and Johnson‟s five key
elements for success. Positive interdependence was achieved in both applications through
small group work and in some cases was also encouraged by the grading scheme used.
Individual accountability was attained by assigning individual homework, quizzes and
exams. An environment of cooperation was promoted by instructors encouraging and

22
coaching students to further cooperation within groups and between groups whenever
possible. In addition, the experienced instructor (in her section only) also met with each
student individually at the beginning of the semester to get to know each student and to
answer their questions on the class structure. Social skills were promoted in the first
application by the instructor coaching students to work together while in their groups and
were reinforced during student presentations. Social skills were promoted in the second
application by encouraging instructors to coach students to work together while in their
groups. Group processing was encouraged in the first application through an extra credit
incentive by completing a study plan outlining changes in study habits, class participation
and seeking outside help. Group processing time was minimal in the second application
and took place while students discussed strategies with peers and the instructor of how to
solve problems. One important caveat to the second application is that the teachable
units, which encouraged the use of the five key elements for success, were used as
resources which instructor‟s tailored to the skills and needs of their students and did not
necessarily include all activities and guidelines.
Timeline of the Study
Sampling of students took place during the fall semester of 2009. Pretests,
including the in class preliminary exam, online demographic survey, anxiety, self-
concept and motivation instruments were administered during the second week of class.
The latter four instruments were measured concurrently as an online survey. The online
posttest included the anxiety, self-concept and motivation instruments which were
administered during the fifteenth week. Students were given one week to complete both

23
online surveys. The in class final exam was administered on the sixteenth week of the
semester, which completed the data collection for this study.
Scoring and Coding
Upon completion of the data collection, coders confirmed the accuracy of online
survey data, as well as scanned preliminary and final exam data. Subsequently, a list of
participants was sent to the university Registrar‟s office for verification of student section
number, final grade in the course and cumulative GPA. The two data files were then
combined and the names of students replaced with randomly generated numbers to ensure
student privacy. The preliminary and final exams were then rescored in Microsoft Excel
to authenticate accurate scores from the university‟s Test Scoring department. Sampled
student data were then divided into treatment and comparison groups according to section
number. To ensure students were classified into the proper group, the self-reported
section number from the online survey was re-checked against the student‟s section
number reported by the university Registrar.
Next, the number of student responses for the preliminary and final exams was
determined for the two groups. Students not returning both preliminary and final exams
were excluded from the study because a change in achievement could not be determined
without record of these two exams. Student responses for the anxiety, self-concept and
motivation surveys were then imported into SPSS and scored. Scoring of negatively
stated questions on the anxiety survey was reversed so that a lower score on the survey
suggests higher anxiety (Betz, 1978). Scoring on the self-concept survey was also
reversed for negatively worded items, so that a higher score indicates a more favorable

24
mathematical self-concept (Gourgey, 1982). Similarly, negatively stated items on the
motivation survey were reversed scored so that a lower score indicates a less motivated
student (Glynn, Taasoobshirazi, Brickman, 2009).
During recruitment students were directed to skip any questions within the online
survey they did not feel comfortable providing answers to. For this reason there are
occasional missing values within the data set. To help provide a more accurate analysis of
student anxiety, self-concept and motivation, the mean scores for these pretests and
posttests were used instead of a summed scores as in the original instrumentation. The
raw mean scores were also used for the algebra pretest and posttest to calculate the
algebra gain.
Data Analysis
Since randomization was not a part of the research design, descriptive statistics
were collected so that the treatment group can be compared with the comparison group.
The number of students responding to instrumentation is reported in table form. The
percent of students who tested in with an ACT/SAT and/or passed the prerequisite course
are also reported. A two-sample t-test is used to determine if the treatment and
comparison groups have a significant difference in age distributions. The Chi-Square test
is used to determine if there is a significant difference among gender, ethnicity and socio-
economic status distributions between the treatment and comparison groups.
The MANOVA is chosen over multiple univariate analysis procedures for two
primary reasons. The MANOVA procedure reduces the risk of a Type I error over
performing multiple univariate procedures. In addition the MANOVA accounts for

25
correlations between variables and can look for interactions between these variables.
These relationships are an important aspect of analysis and is unseen by multiple
univariate tests. Because sample data do not ideally satisfy MANOVA test assumptions,
this test is followed by a series of ANOVAs. The ANOVA tests are intended to
supplement and moderate MANOVA results since correlations between dependent
measures are not ideal. In addition descriptive statistics are provided to facilitate a
monitor of possible confounding factors. Finally, predictor coefficients to estimate the
probability of students passing the course are provided using logistic regression.

26
CHAPTER 4
Results
Response
Approximately 51% of the treatment and 22% of the comparison groups
completed both preliminary and final exams. See Table 4.1 in Appendix B for the
response by population. This begs the question: are these two groups inherently different?
Perhaps students in the treatment group have distribution differences in age, gender,
ethnicity or socio-economic status. Perhaps the treatment group has more students who
prepared for the course in high school. Maybe more of the treatment group completed
intermediate algebra, the prerequisite to College Algebra. The following descriptive
statistics examine whether the treatment and comparison groups are comparable in these
aspects and, if possible, how they compare to the university‟s general population.
Descriptive Statistics
Age
Response was high for the age demographic, with only two students in the
comparison group not reporting their age, thus n = 85. However, all students in the
treatment group reported their age, thus N =86. The mean age for the treatment group is
19.55 years with a standard deviation of 3.445. The mean age for the comparison group is
19.22 years with a standard deviation of 3.093. A two sample t-test is calculated at t =
.645 with a sig. (2-tailed) of p = .520. So there is no evidence to support that the mean
ages are significantly different among the treatment and comparison groups. See Figure

27
4.1 in Appendix A, for a graph of age distributions. No additional bias should be
contributed since the two groups are comparable in age.
Gender
The treatment and comparison groups have slightly different distributions of male
and female students (see Figure 4.2 in Appendix A). The treatment group is composed of
63% female and 37% male students while the comparison group is composed of 54%
female and 46% male students. Among the general population of 19,610 (undergraduate)
students enrolled in fall 2009, 55% are female and 45% are male (Institutional Data). So
the comparison group appears to be a closer reflection of the institution‟s gender
proportion than the treatment group. Despite this, the question still remains: is there a
significant difference between these two distributions?
Response was high for this demographic with only one student in the comparison
group not reporting his/her gender, thus n = 86. However, all students in the treatment
group reported their gender accordingly, N = 86. The Chi-Square test is used to determine
if there is a significant distribution difference among males and females between the
treatment and comparison groups. Results show the Pearson Chi-Square = 1.542, with a
(2-sided) p-value of .214. So there is not evidence to support a significant difference of
gender distributions between the treatment and comparison groups. Accordingly, gender
should not introduce additional bias to the study.
Chi-Square Tests
Value df Sig. (2-sided)
Pearson Chi-Square 1.542a 1 .214
N of Valid Cases 172
a. 0 cells (.0%) have expected count less than 5. The minimum expected count is 35.00.
Table 4.2 Chi-square test for gender distributions

28
Ethnicity
There are some differences among the two largest ethnic groups between the
treatment and comparison groups; see Figure 4.3 in Appendix A. For the ethnic
composition of the institution (for undergraduate students at main campus during fall of
2009) alongside the treatment and comparison groups see Table 4.3 in Appendix B
(Institutional Data). Since it is unclear if these differences are significant, the Chi-Square
test is used to check for significant distribution differences among ethnic groups between
the treatment and comparison groups. Due to restrictions on cell counts for the Chi-
Square test, the African American and Native American categories are compressed into
one category while the Asian/Pacific Islander and Other ethnicity categories are
compressed into another for this test. Results show the Pearson Chi-Square = 1.562, with
a (2-sided) p-value of .668. So there is not evidence to support a significant difference of
ethnicity distributions between the treatment and comparison groups. Therefore, ethnicity
should not introduce additional bias to the study.
(Condensed) Ethnicity Cross Tabulation
Ethnicity
Total
African and
Native American Caucasian Hispanic
Asian/Pacific Islander
& Other
Comparison
Treatment
6 34 39 8 87
6 41 31 8 86
Total 12 75 70 16 173
Table 4.4 Condensed ethnicity cross tabulation.

29
Chi-Square Tests
Value df Sig. (2-sided)
Pearson Chi-Square 1.562a 3 .668
N of Valid Cases 173
a. 0 cells (.0%) have expected count less than 5. The minimum expected count is 5.97.
Table 4.5 Chi-square test for ethnicity.
Placement qualifications
There are two main avenues for placement into College Algebra. The first avenue
is to test directly into College Algebra by either an ACT or SAT exam. Fifty-nine percent
of students in the treatment group and 61% of students in the comparison group tested
into College Algebra (see Figure 4.4 in Appendix A). So the treatment and comparison
groups are similar to each other. The second avenue for placement is for students to
complete Intermediate Algebra, the prerequisite course. Approximately 37% of the
treatment group and 39% of the comparison group completed Intermediate Algebra as a
prerequisite (see Figure 4.5 in Appendix A). So the treatment and comparison samples
are again quite comparable.
Socio-Economic Status
The comparison and treatment groups have a similar distribution of students
among each socio-economic class, except for the lowest. There is a difference between
the treatment and comparison groups among students whose family income is less than
$30,000 per year. In the comparison group, 18% of students reported having a family
income of less than $30,000 per year, while 28% of students in the treatment group
reported this to be their family income. This is of some concern since there may be more
students within the treatment group maintaining scholarships or other merit based

30
funding as a necessity to staying in school and therefore may be more motivated to
perform well in the course. See Figure 4.6 in Appendix A for a more detailed description
of the socio-economic status within both the treatment and comparison groups.
To determine if there is a significant distribution difference of socio-economic
class between the treatment and comparison groups the Chi-Square test is used. Due to
restrictions on cell counts for the Chi-Square test, the over $250,000 and no response
categories were compressed into one category labeled “Other” for this test. Results show
the Pearson Chi-Square = 3.229, with a (2-sided) p-value of .520. So there is not
evidence to support a significant difference of socio-economic status distributions
between the treatment and comparison groups. As a result, socio-economic status should
not introduce additional bias to the study.
Condensed SES Cross Tabulation
Condensed SES
Total
Less than
30,000 30,000-60,000
60,000-
100,000
100,000-
250,000 Other
Comparison 16 24 19 19 9 87
Treatment 24 23 19 15 5 86
Total 40 47 38 34 14 173
Table 4.6 Condensed socio-economic status cross tabulation.
Chi-Square Tests
Value df Sig. (2-sided)
Pearson Chi-Square 3.229a 4 .520
N of Valid Cases 173
a. 0 cells (.0%) have expected count less than 5. The minimum expected count is 6.96.
Table 4.7 Chi-square test for socio-economic status.

31
Multivariate Analysis of Variance
A 2 × 2 MANOVA was conducted on the dependent variables to determine if the
treatment and comparison groups achieved differently, and if gender effects and/or
interactions are present. In an effort to obtain a more parsimonious result, backward
elimination is applied (recursively) to the MANOVA analyses. This model selection
algorithm only eliminated variables which contributed either a negligible or no effect for
results. The variables not eliminated were the preliminary exam, anxiety pretest, self-
concept pretest and group which all have a p-value of < .001 for the multivariate tests.
The effect size was moderate for the preliminary exam with the partial = .523. The
effect size was somewhat moderate for the anxiety and self-concept pretests with the
partial = .440 and the partial = .435 respectively. For the group, the effect size was
small, with the partial = .150. As shown in Table 4.8 in Appendix B, these four
variables do have a statistically significant effect between subjects (to varying degrees)
on achievement, anxiety, self-concept and motivation gains (Table 4.9 in Appendix B).
Since gender and interactions were eliminated by the backward elimination
process, they did not have a significant effect between subjects. Results show that
preliminary exam performance does have a significant effect on achievement gain with p
< .001 and a moderate effect size with the partial = .495. Results show that anxiety
pretest performance does have a significant effect on anxiety gain with p < .001 and a
smaller effect size with the partial = .242. Results show that self-concept pretest
performance does have a significant effect on achievement, anxiety and self-concept
gains with p = .054, p < .001 and p = .002 respectively. However effect sizes were small

32
for achievement, anxiety and self-concept with the partial = .022, the partial = .146
and the partial = .054 respectively.
Results show that the group variable had the most consistent effects on all four
dependent variables; albeit with small effect sizes for the between subjects tests. The p-
values are calculated at p = .005, p = .064, p = .030 and p = .001 for achievement,
anxiety, self-concept and motivation gains respectively. Given a larger sample size, a
random sample, or a change in other dynamic factors, such as instructor experience with
cooperative learning, etc. the p-value for anxiety may approach statistical significance
more closely. Group effect sizes were small for the achievement, anxiety, self-concept
and motivation variables with the partial = .045, the partial = .020, the partial
= .028 and the partial = .068 respectively.
Algebra Preliminary and Final Exams
As a follow-up to the MANOVA test, an ANOVA was conducted on the mean
algebra gains against the preliminary exam and the anxiety pretest, self-concept pretest
and motivation pretest, group and gender to determine if there is a difference in
achievement. Backward elimination was also used to obtain a more parsimonious result.
This model selection algorithm only eliminated variables which contributed a negligible
or no effect for results. Anxiety pretest, motivation pretest, gender and interactions were
not significant contributors to achievement gain. The variables not eliminated were the
preliminary exam, self-concept pretest and group which have p-values of < .001, .007
and .005 respectively. The effect size was moderate for the preliminary exam with the
partial = .498. Effect size was small for the self-concept and group variables with the

33
partial = .043 and the partial = .047 respectively. Results concur with multivariate
tests for the preliminary exam, self-concept pretest and group variables.
Tests of Between-Subjects Effects
Dependent Variable: Gain from Preliminary to Final Exam
Source Type III
Sum of
Squares df Mean Square F Sig.
Partial Eta
Squared
Corrected Model 34300.494a 3 11433.498 58.497 .000 .509
Intercept 33815.463 1 33815.463 173.010 .000 .506
Preliminary Exam 32714.593 1 32714.593 167.378 .000 .498
Self-Concept
pretest
1471.321 1 1471.321 7.528 .007 .043
Group 1612.816 1 1612.816 8.252 .005 .047
Error 33031.664 169 195.454
Total 68493.360 173
Corrected Total 67332.158 172
a. R Squared = .509 (Adjusted R Squared = .501)
Table 4.10 ANOVA tests between subjects for algebra gain.
Parameter estimates indicate a negative relationship between the preliminary
exam and algebra achievement gain with B = -.799 and p < .001. This is tenable since the
greater achievement on the preliminary exam, the less opportunity there is to gain points.
Conversely, if a student earns a low score on the preliminary exam, they then have a
greater opportunity to increase achievement gain. Parameter estimates indicate the self-
concept pretest has a positive relationship with achievement gain where B = .151 and p =
.007. In addition, parameter estimates indicate a positive relationship between
achievement gain and the treatment group with B = 6.158 and p = .005.

34
Parameter Estimates
Dependent Variable: Gain from Preliminary to Final Exam
Parameter
B Std. Error Sig.
Intercept 59.651 4.440 .000
Preliminary Exam -.799 .062 .000
Self-Concept Pretest .151 .055 .007
Comparison Group 0a . .
Treatment Group 6.158 2.144 .005
Table 4.11 Parameter estimates for algebra gain.
Figures 4.7 and 4.8 map each participant‟s preliminary exam score (x-axis)
against their respective achievement exam gain (y-axis). Achievement gain is calculated
by taking the raw percent grade on the final exam and subtracting the raw percent grade
on the preliminary exam. Note any marker falling below the x-axis indicates the final
exam score is lower than the respective preliminary exam score. For example, a student
earning 100% on the preliminary exam was unable to increase their grade on the final
exam and therefore can only have a corresponding y-value on or below the x-axis. In the
case where this student earns less than 100% on the final, the student marker on the
scatter plots will have negative gain, meaning their final exam score was lower than their
preliminary exam score. If a student earned the same grade on the final and preliminary
exams their marker will be on the x-axis which indicates a gain of zero.
Reference lines are provided for Figures 4.7 and 4.8, so one can easily see the
percentage of achievement gain earned from the preliminary to final exam. For example,
if a student earned a score of 50% on the preliminary exam, this student then had the
opportunity to increase their gain on the final exam by 50 points. In this case, the student
35
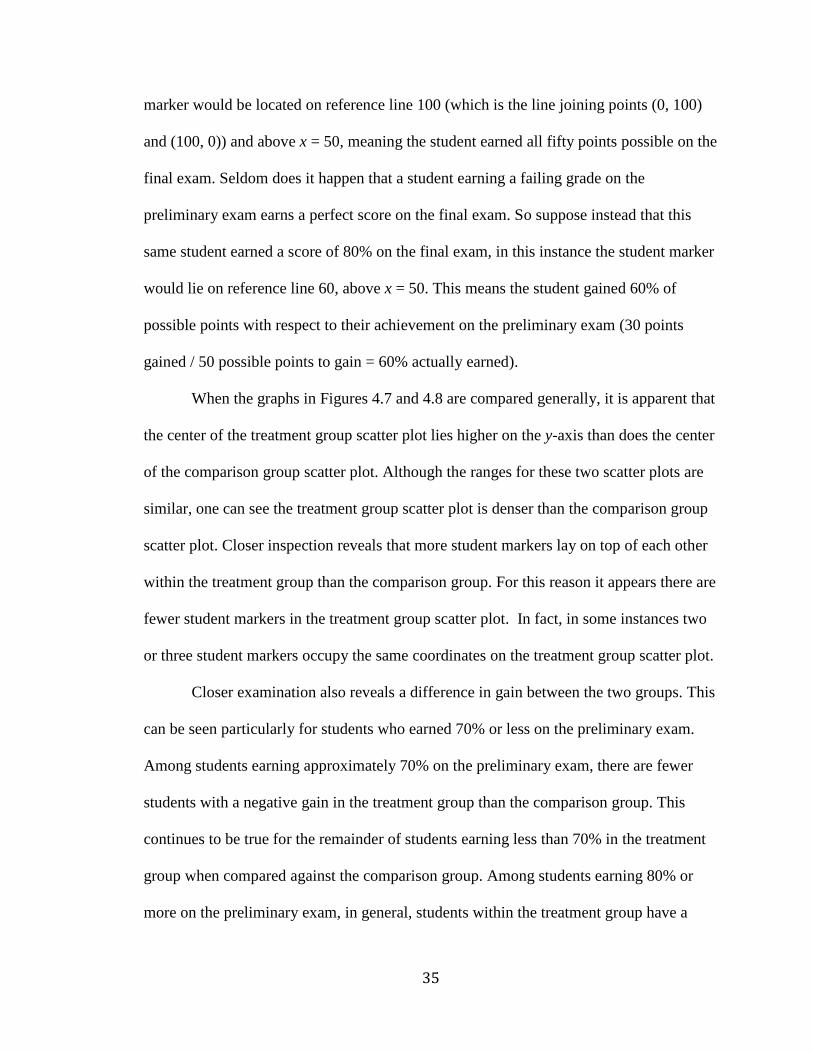
marker would be located on reference line 100 (which is the line joining points (0, 100)
and (100, 0)) and above x = 50, meaning the student earned all fifty points possible on the
final exam. Seldom does it happen that a student earning a failing grade on the
preliminary exam earns a perfect score on the final exam. So suppose instead that this
same student earned a score of 80% on the final exam, in this instance the student marker
would lie on reference line 60, above x = 50. This means the student gained 60% of
possible points with respect to their achievement on the preliminary exam (30 points
gained / 50 possible points to gain = 60% actually earned).
When the graphs in Figures 4.7 and 4.8 are compared generally, it is apparent that
the center of the treatment group scatter plot lies higher on the y-axis than does the center
of the comparison group scatter plot. Although the ranges for these two scatter plots are
similar, one can see the treatment group scatter plot is denser than the comparison group
scatter plot. Closer inspection reveals that more student markers lay on top of each other
within the treatment group than the comparison group. For this reason it appears there are
fewer student markers in the treatment group scatter plot. In fact, in some instances two
or three student markers occupy the same coordinates on the treatment group scatter plot.
Closer examination also reveals a difference in gain between the two groups. This
can be seen particularly for students who earned 70% or less on the preliminary exam.
Among students earning approximately 70% on the preliminary exam, there are fewer
students with a negative gain in the treatment group than the comparison group. This
continues to be true for the remainder of students earning less than 70% in the treatment
group when compared against the comparison group. Among students earning 80% or
more on the preliminary exam, in general, students within the treatment group have a

36
smaller negative gain in comparison to the comparison group. The overall impression is
students within these two groups earning comparable grades on the preliminary exam
have a greater gain (to varying degrees) on the final exam in the treatment group than do
students in the comparison group, with the greatest gain earned by students having the
greatest opportunity for improvement. In other words, there is a negative association
between grade earned on the preliminary exam and gain increase, which is larger in the
treatment group than the comparison group.

37
Figure 4.7 Preliminary exam and algebra gain for comparison group
Figure 4.8 Preliminary exam and algebra gain for treatment group

38
The box plots in Figure 4.9 for the preliminary exam show both the treatment and
comparison groups have the same median values. However the spread between the first
and third quartiles is somewhat different with the range of the treatment group shifted
slightly lower than the comparison group. The mean values on the preliminary exam for
the treatment group is 66.99% while the mean for the comparison group is 67.55%. The
overall implication is the treatment and comparison groups began statistically identical.
Inspection of the box plots in Figure 4.10 for the final exam shows the median is higher
for the treatment group than for the comparison group. In addition, the spread of the first
and third quartiles is shifted higher, indicating greater achievement compared to the
comparison group. The most notable difference among these two box plots is the
difference in median. The median of the treatment group surpassed the comparison group
by ten points. The mean of the final exam for the treatment group is 72.51% while the
mean for the comparison group is 67.21%. Comparing Figure 4.9 to Figure 4.10 clearly
indicates the treatment did increase overall achievement outcomes.

39
Figure 4.9 Box plot of preliminary exam
Figure 4.10 Box plot of final exam
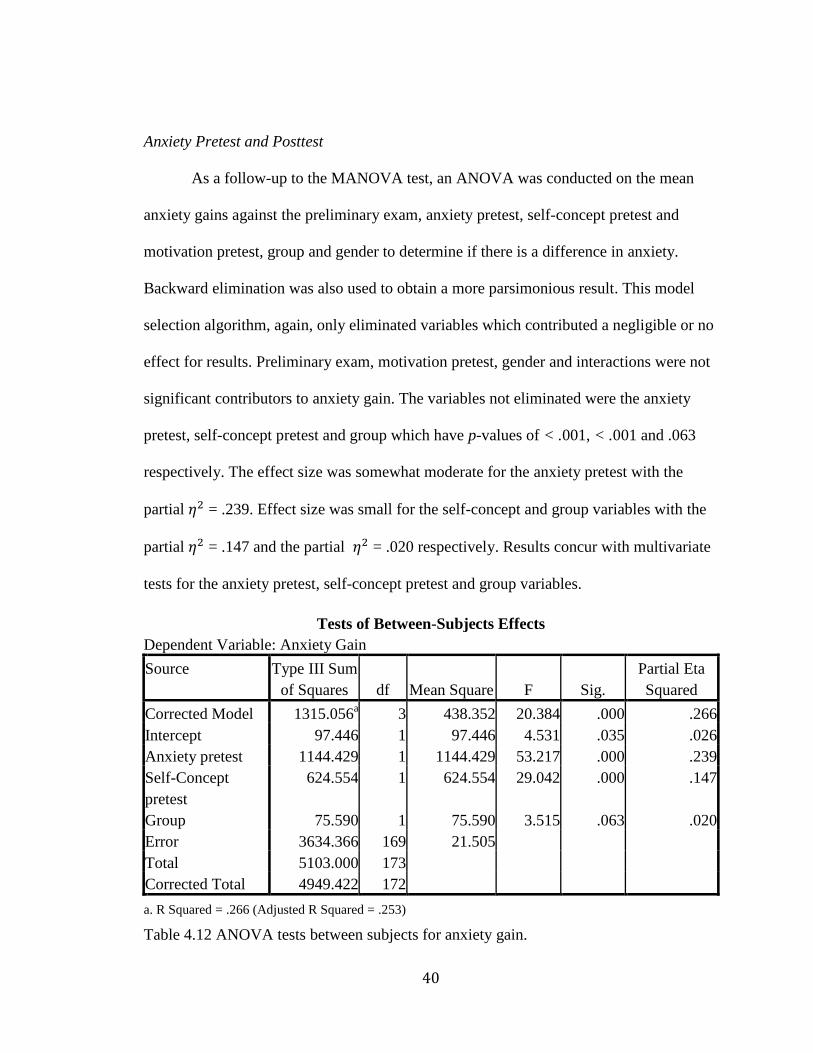
40
Anxiety Pretest and Posttest
As a follow-up to the MANOVA test, an ANOVA was conducted on the mean
anxiety gains against the preliminary exam, anxiety pretest, self-concept pretest and
motivation pretest, group and gender to determine if there is a difference in anxiety.
Backward elimination was also used to obtain a more parsimonious result. This model
selection algorithm, again, only eliminated variables which contributed a negligible or no
effect for results. Preliminary exam, motivation pretest, gender and interactions were not
significant contributors to anxiety gain. The variables not eliminated were the anxiety
pretest, self-concept pretest and group which have p-values of < .001, < .001 and .063
respectively. The effect size was somewhat moderate for the anxiety pretest with the
partial = .239. Effect size was small for the self-concept and group variables with the
partial = .147 and the partial = .020 respectively. Results concur with multivariate
tests for the anxiety pretest, self-concept pretest and group variables.
Tests of Between-Subjects Effects
Dependent Variable: Anxiety Gain
Source Type III Sum
of Squares df Mean Square F Sig.
Partial Eta
Squared
Corrected Model 1315.056a 3 438.352 20.384 .000 .266
Intercept 97.446 1 97.446 4.531 .035 .026
Anxiety pretest 1144.429 1 1144.429 53.217 .000 .239
Self-Concept
pretest
624.554 1 624.554 29.042 .000 .147
Group 75.590 1 75.590 3.515 .063 .020
Error 3634.366 169 21.505
Total 5103.000 173
Corrected Total 4949.422 172
a. R Squared = .266 (Adjusted R Squared = .253)
Table 4.12 ANOVA tests between subjects for anxiety gain.

41
Parameter estimates indicate a negative relationship between the anxiety pretest
and anxiety gain with B = -.663 and p < .001. This is tenable since the greater baseline
anxiety, the less opportunity there is to increase anxiety. Conversely, if a student begins
with less anxiety, they then have a greater opportunity to increase anxiety gain. Parameter
estimates indicate the self-concept pretest has a positive relationship with anxiety gain
with B = .158 and p < .001. In addition, parameter estimates indicate a positive
relationship between anxiety gain and the treatment group with B = 1.341 and p = .063.
Parameter Estimates
Dependent Variable: Anxiety Gain
Parameter
B Std. Error Sig.
Intercept 1.602 .551 .004
Comparison Group 0a . .
Treatment Group 1.341 .715 . 063
Anxiety Pretest -.663 .091 .000
Self-Concept Pretest .158 .029 .000
Table 4.13 Parameter estimates for anxiety gain.
Self-Concept Pretest and Posttest
As a follow-up to the MANOVA test, an ANOVA was conducted on the mean
self-concept gains against the preliminary exam, anxiety pretest, self-concept pretest and
motivation pretest, group and gender to determine if there is a difference in self-concept.
Backward elimination was also used to obtain a more parsimonious result. This model
selection algorithm, again, only eliminated variables which contributed a negligible or no
effect for results. Preliminary exam, anxiety pretest, motivation pretest, gender and
interactions were not significant contributors to self-concept gain. The variables not
eliminated were the self-concept pretest and group which have p-values of .001 and .038

42
respectively. Effect size was small for the self-concept pretest and group variables with
the partial = .066 and the partial = .025 respectively. Results concur with
multivariate tests for the anxiety pretest, self-concept pretest and group variables.
Tests of Between-Subjects Effects
Dependent Variable: Self-Concept Gain
Source Type III Sum
of Squares df Mean Square F Sig.
Partial Eta
Squared
Corrected Model 3613.461a 2 1806.730 9.227 .000 .098
Intercept 747.100 1 747.100 3.815 .052 .022
Self-Concept
pretest
2335.723 1 2335.723 11.928 .001 .066
Group 852.990 1 852.990 4.356 .038 .025
Error 33288.632 170 195.815
Total 37494.000 173
Corrected Total 36902.092 172
a. R Squared = .098 (Adjusted R Squared = .087)
Table 4.14 ANOVA tests between subjects for self-concept gain.
Parameter estimates indicate a negative relationship between the self-concept
pretest and self-concept gain with B = -.188 and p = .001. This is tenable since the greater
baseline self-concept, the less opportunity there is to increase self-concept. Conversely, if
a student begins with a lower self-concept, they then have a greater opportunity to
increase their self-concept gain. In addition, parameter estimates indicate a positive
relationship between self-concept gain and treatment group, with B = 4.479 and p = .038.

43
Parameter Estimates
Dependent Variable: Self-Concept Gain
Parameter
B Std. Error Sig.
Intercept .156 1.524 .918
Comparison Group 0a . .
Treatment Group 4.479 2.146 .038
Self-Concept pretest -.188 .055 .001
Table 4.15 Parameter estimates for self-concept gain.
Motivation Pretest and Posttest
As a follow-up to the MANOVA test, an ANOVA was conducted on the mean
motivation gains against the preliminary exam, anxiety pretest, self-concept pretest and
motivation pretest, group and gender to determine if there is a difference in motivation.
Backward elimination was also used to obtain a more parsimonious result. This model
selection algorithm, again, only eliminated variables which contributed a negligible or no
effect for results. Preliminary exam, anxiety pretest, self-concept pretest, gender and
interactions were not significant contributors to motivation gain. The motivation pretest
and group variables were not eliminated which have p-values of .027 and < .001
respectively. Effect size was small for the motivation pretest and group variables with the
partial = .028 and the partial = .073 respectively. These results are supplementary
to the MANOVA since the motivation pretest was eliminated from the multivariate
analysis during the backward elimination process.

44
Tests of Between-Subjects Effects
Dependent Variable: Motivation Gain
Source Type III Sum
of Squares df Mean Square F Sig.
Partial Eta
Squared
Corrected
Model
10789.249a 2 5394.624 8.778 .000 .094
Intercept 502.293 1 502.293 .817 .367 .005
Motivation
pretest
3060.642 1 3060.642 4.980 .027 .028
Group 8239.416 1 8239.416 13.407 .000 .073
Error 104474.300 170 614.555
Total 130191.000 173
Corrected Total 115263.549 172
a. R Squared = .094 (Adjusted R Squared = .083)
Table 4.16 ANOVA tests between subjects for motivation gain.
Parameter estimates indicate a negative relationship between the motivation
pretest and motivation gain with B = -.224 and p = .027. This is tenable since the greater
baseline motivation, the less opportunity there is to increase motivation. Conversely, if a
student begins with less motivation, they then have a greater opportunity to increase
motivation gain. Parameter estimates indicate the treatment group has a negative
relationship with motivation gain with B = -13.823 and p < .001.
Parameter Estimates
Dependent Variable: Motivation Gain
Parameter
B Std. Error Sig.
Intercept -.190 7.577 .980
Comparison Group 0a . .
Treatment Group -13.823 3.775 . 000
Motivation pretest -.224 .100 .027
Table 4.17 Parameter estimates for motivation gain.

45
Logistic Regression
Logistic regression is used to determine if students in the treatment group have a
greater probability of passing the course than students in the comparison group. Passing
the course is defined by the student earning credit for the course and receiving an overall
grade of C or better. Since preliminary exam performance does have a significant effect
on students passing, it was included as a predictor in the logistic regression model.
Results show a significant difference for the treatment group with a regression coefficient
of = 1.140 and the corresponding p-value of .005. Results also show a significant
difference for the preliminary exam with a regression coefficient of = 0.024 with a
corresponding p-value of .029. Since both and are positive coefficients, both the
group and preliminary exam predictors contribute positively to students‟ probability of
passing the course. Because the overall probability of passing the course is dependent
upon preliminary exam performance, which is a continuous variable, the probability of
passing cannot be interpreted by group membership alone. The overall probability for
each student can be calculated by the following formula (see Figure 4.11 for a graph of
these equations):
Where
*Note that for computational purposes, the treatment group = 1 and the comparison group = 0.

46
For instance, the probability of two students, one from each group, earning 67% on the
preliminary exam (the mean preliminary exam score for both the treatment and
comparison groups) have the following probabilities of passing the course:
Comparison Group:
Treatment Group:
So this means, a student who earned the average preliminary exam score in the
comparison group has an estimated 63% probability of passing the course. Similarly, a
student who earned the average preliminary exam score in the treatment group has an
estimated 84% probability of passing the course. So there is evidence to suggest that
students within the treatment group do have a greater probability of passing the course
(dependent upon their preliminary exam score) than students within the comparison
group.
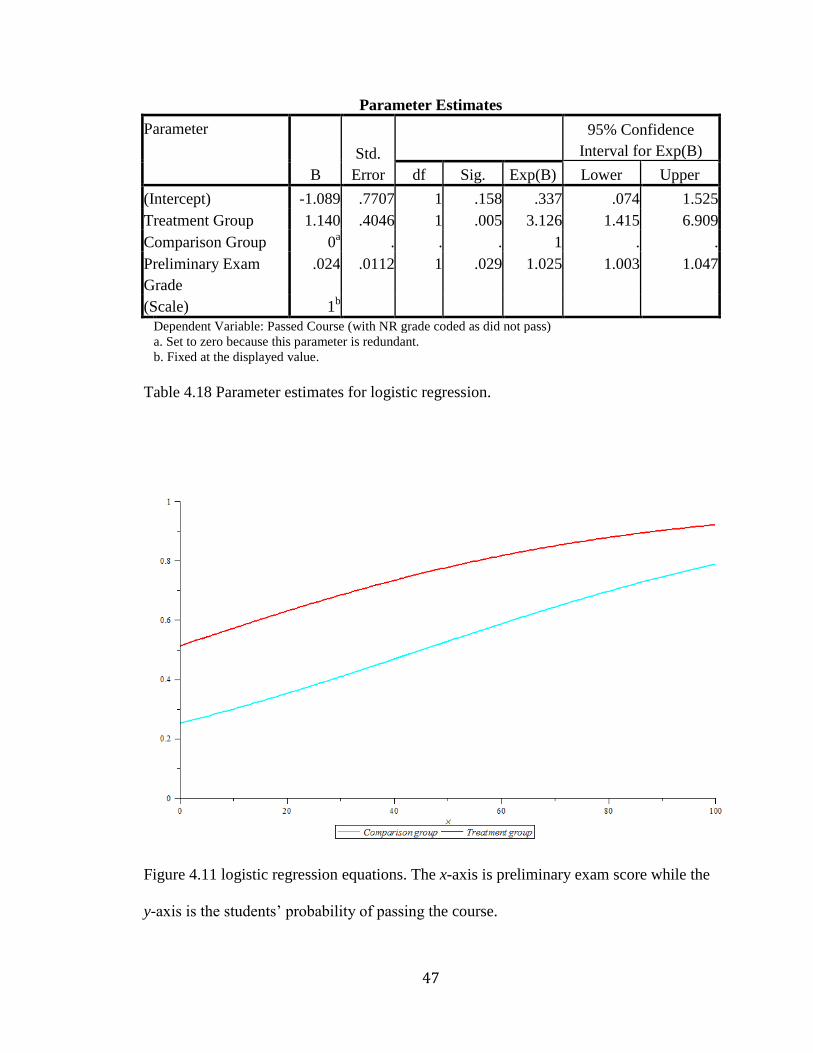
47
Parameter Estimates
Parameter
B
Std.
Error
95% Confidence
Interval for Exp(B)
df Sig. Exp(B) Lower Upper
(Intercept) -1.089 .7707 1 .158 .337 .074 1.525
Treatment Group 1.140 .4046 1 .005 3.126 1.415 6.909
Comparison Group 0a . . . 1 . .
Preliminary Exam
Grade
.024 .0112 1 .029 1.025 1.003 1.047
(Scale) 1b
Dependent Variable: Passed Course (with NR grade coded as did not pass)
a. Set to zero because this parameter is redundant.
b. Fixed at the displayed value.
Table 4.18 Parameter estimates for logistic regression.
Figure 4.11 logistic regression equations. The x-axis is preliminary exam score while the
y-axis is the students‟ probability of passing the course.

48
Validity
Two assessments were used to determine the internal consistency of the
instrumentation. The Kuder-Richardson approach, particularly the KR21 test, is used to
calculate reliability of the preliminary and final algebra exams (Fraenkel and Wallen,
2009). Reliability estimates for the preliminary and final exams are calculated at .48 and
.71, respectively. The alpha coefficient is used to determine reliability of the anxiety,
self-concept and motivation instruments. The alpha coefficient is calculated from the
general form of the Kuder-Richardson KR20 test (2009).The reliability coefficient
(Chronbach’s alpha) for the math anxiety, self-concept and motivation instruments are
reported at α = .92, α = .98 and α = .93, respectively (Betz, 1978; Gourgey, 1982; Glynn,
Taasoobshirazi, Brickman, 2009). The reliability estimates for the algebra exams are as
expected. The reliability of the preliminary exam is low for an in-class exam; however
this is expected since the exam has only thirteen questions. Reliability estimates for the
anxiety, self-concept and motivation exams are high (the range for both the KR20 and
KR21 tests are 0-1).
The MANOVA test assumes sample data satisfies three conditions prior to
analysis. The first assumption is that sample data is multivariate normally distributed
(Bryant et al., 2000). Both the Kolmogorov-Smirnov and Shapiro-Wilk tests for
univariate normality indicate the algebra instrument is normally distributed, however the
anxiety, self-concept and motivation instruments are not for the treatment group (see
Table 4.19 in Appendix B). These tests also indicate that the algebra, anxiety and
motivation instruments are normally distributed; however, the self-concept instrument is
not for the comparison group. Therefore the sample data is not multivariate normally
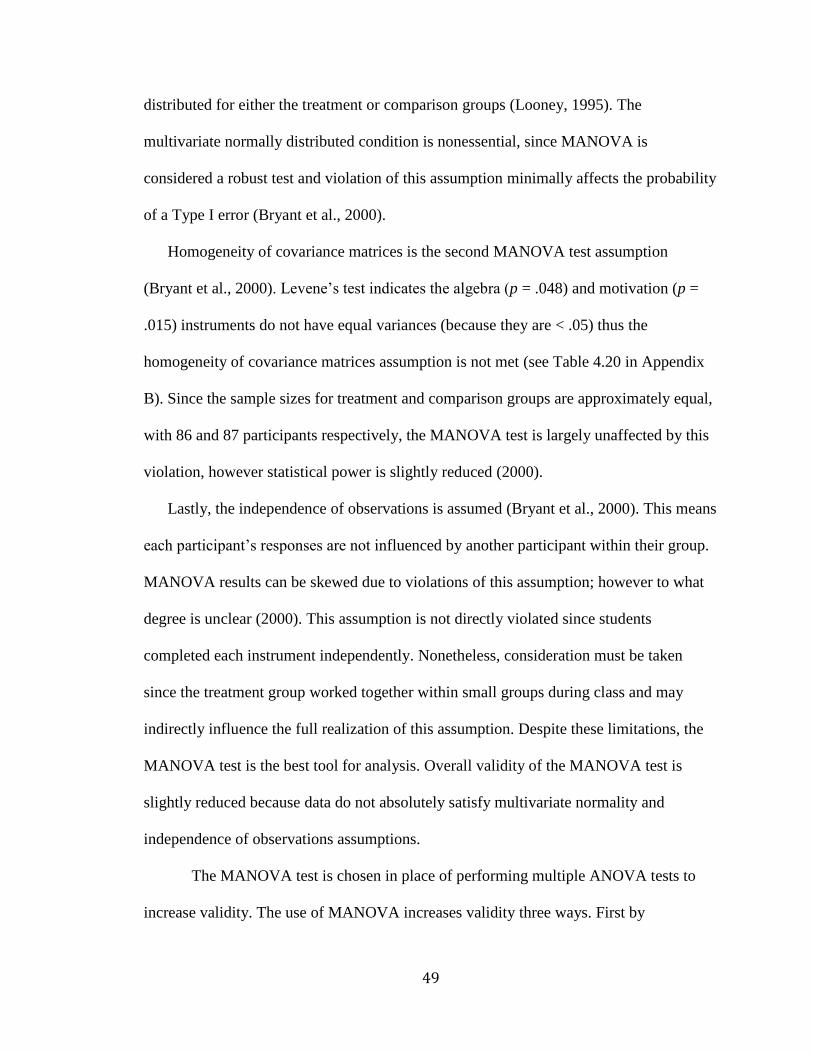
49
distributed for either the treatment or comparison groups (Looney, 1995). The
multivariate normally distributed condition is nonessential, since MANOVA is
considered a robust test and violation of this assumption minimally affects the probability
of a Type I error (Bryant et al., 2000).
Homogeneity of covariance matrices is the second MANOVA test assumption
(Bryant et al., 2000). Levene‟s test indicates the algebra (p = .048) and motivation (p =
.015) instruments do not have equal variances (because they are < .05) thus the
homogeneity of covariance matrices assumption is not met (see Table 4.20 in Appendix
B). Since the sample sizes for treatment and comparison groups are approximately equal,
with 86 and 87 participants respectively, the MANOVA test is largely unaffected by this
violation, however statistical power is slightly reduced (2000).
Lastly, the independence of observations is assumed (Bryant et al., 2000). This means
each participant‟s responses are not influenced by another participant within their group.
MANOVA results can be skewed due to violations of this assumption; however to what
degree is unclear (2000). This assumption is not directly violated since students
completed each instrument independently. Nonetheless, consideration must be taken
since the treatment group worked together within small groups during class and may
indirectly influence the full realization of this assumption. Despite these limitations, the
MANOVA test is the best tool for analysis. Overall validity of the MANOVA test is
slightly reduced because data do not absolutely satisfy multivariate normality and
independence of observations assumptions.
The MANOVA test is chosen in place of performing multiple ANOVA tests to
increase validity. The use of MANOVA increases validity three ways. First by

50
concurrently analyzing both independent and dependent variables, the test investigates
any possible multivariate effects and/or interactions occurring within the sample. In
addition, the MANOVA accounts for possible correlation effects among dependent
variables. The final advantage is that the MANOVA test reduces the risk of a Type I
error, over conducting multiple ANOVA tests. Since a multivariate effect was found,
multiple ANOVA tests were conducted post-hoc. These ANOVA procedures do not pose
an additional threat to increasing the probability of falsely rejecting the null hypothesis
when qualified by the MANOVA test (Bryant et al., 2000).
In addition to former assumptions of the MANOVA test, this test also requires
dependent measures be statistically correlated (Bryant et al., 2000). The Pearson’s
correlation coefficient (r) is calculated post-hoc and is of interest (see Table 4.21 in
Appendix B). The algebra and self-concept instruments are minimally correlated with
Pearson‟s r =.225, and significance (2-tailed) of .008. The motivation and self-concept
instruments are slightly more correlated with Pearson‟s r = .598, and significance (2-
tailed) of p < .001. The anxiety instrument is not significantly correlated with other
dependent measures. Among the correlated dependent measures results are at best
considered low, reducing test validity. Because of this, multiple ANOVA procedures
were conducted on each dependent variable to clarify and substantiate MANOVA test
results.
Since analysis of variance test assumptions are not maximally satisfied, it will be
beneficial to consider descriptive statistics for the two groups. Because of this, and since
sampled groups were taken from pre-formed sections, a change in individual student
achievement was considered. Since no random selection or random assignment was

51
applied, the sample introduces a subject characteristic bias which can skew observed
relationships (Fraenkel, & Wallen, 2009). Therefore, individual student performance is
examined by comparing individual student pretest (algebra) scores to gains earned. This
analysis is used because it reduces the possibility that participant‟s individual
characteristics will skew observations, increasing internal validity (2009). In addition to
this descriptive data, logistic regression is used to determine which of the two groups are
more likely to pass the course.
Similar to the analysis of variance procedures, the absence of randomization affects
the logistic regression validity however; variables under analysis are dichotomous as
assumed (Bryant et al., 2000). The second assumption that outcomes are statistically
independent is satisfied since students cannot pass and fail the course simultaneously
(2000). In an endeavor to satisfy the specificity assumption, the backward elimination
method (used for the analysis of variance procedures) is helpful for selecting relevant
predictors. As usual, it is uncertain if this assumption is absolutely satisfied (2000). The
fourth test assumption is that categories under analysis are mutually exclusive and
collectively exhaustive (2000). This condition is satisfied since participants were enrolled
in either a treatment or comparison section but not both simultaneously. Lastly, a sample
of approximately fifty cases or more per predictor is assumed (2000). The sample for this
study is sufficient to satisfy this test assumption. It is important to note that the external
validity is by no means far-reaching since the sample was not randomized. This study is
only applicable to the accessible population of this particular university.

52
CHAPTER 5
Discussion
Restatement of the Study Purpose
This study was conducted to examine the effects of a cooperative learning
treatment on College Algebra students. Thee hypotheses were examined. First, the
treatment group was expected to have lower anxiety, higher achievement, self-concept
and motivation compared to the comparison group. Second, gender differences were
expected within the treatment group. Specifically, the females in the treatment group
were expected to have a more significant change in anxiety than males in the treatment
group. In addition, the males and females in the treatment group were expected to have a
parallel increase in self-concept and motivation. Finally, students in the treatment group
were expected to be more likely to pass the course than students in the comparison group.
Summary of Procedures and Methods
Students were recruited during the second week of the semester, following which
they were sent an email invitation to the combined informed consent and online survey at
the beginning and end of the semester. The treatment and comparison groups were both
sampled from students enrolled in College Algebra during the fall semester of 2009. The
total number of students consenting to participate was 566 from an accessible population
of approximately 1,200 students. This study included gender and group (treatment or
comparison) as the only two independent variables. There were eight dependant
variables, namely the preliminary algebra exam, final algebra exam, anxiety, self-concept

53
and motivation pretests and posttests. In addition demographic data was included to
investigate possible differences among the two groups.
After the data collection process was completed, coders confirmed the accuracy of
the eight dependent instruments. Student section number was then verified with the
university Registrar. Students were subsequently divided into two groups, either
treatment or comparison according to their course section number. To authenticate
accurate scoring of the preliminary and final exams, these two instruments were then
rescored by the PI. Students not returning both preliminary and final exams were then
excluded from the study; accordingly the final number of participants was 173 students in
total. There were occasional missing values within the final data set since students were
directed to skip any questions they did not feel comfortable answering. In an effort to
provide the most accurate analysis possible, the mean score of all five instruments was
used in analysis instead of the summed scores used for the original anxiety, self-concept
and motivation instruments.
The study design utilized three discrete methods to examine data. To determine if
there was a significant difference on the dependent variable gains, for the treatment and
comparison groups, a 2(Group) × 2(Gender) factorial design was used for both
multivariate and univariate analyses. Since data did not optimally satisfy test
assumptions, descriptive statistics were provided to augment the analysis of variance
procedures. Finally, logistic regression analysis was used to determine if students in the
treatment group were more likely to pass the course than students in the comparison
group. To help interpret results, internal reliability tests were conducted on each
instrument. In addition, test assumptions were statistically examined where possible, to

54
determine the validity and power of the analysis of variance and logistic regression
procedures.
Result Implications
Eighty-six students (51% of the initial participants) in the treatment group
completed both preliminary and final exams, while 87 students (22% of the initial
participants) in the comparison group completed both exams. In addition to the five
instruments collected, participants also reported their age, gender, ethnicity, type of
placement into the course and family socio-economic status on a demographic survey. A
two sample t-test was conducted on the age distributions of the two groups. The test
calculated t = .645 with a sig. (2-tailed) of p = .520, so there was no evidence to support a
significant age distribution difference between the two groups. The Chi-Square test was
used to determine if there was a significant difference in the gender, ethnicity and socio-
economic distributions. The test calculated = 1.542, with a (2-sided) p-value of .214
for gender, so there was no evidence to support a significant difference of gender
distributions. The Chi-Square test for ethnicity calculated = 1.562, with a (2-sided) p-
value of .668, so there was no evidence to support a significant difference of ethnicity
distributions. The Chi-Square test for socio-economic status calculated = 3.229, with
a (2-sided) p-value of .520, so there was no evidence to support a significant difference of
socio-economic status distributions. Approximately 37% of the treatment group and 39%
of the comparison groups completed Intermediate Algebra prior to entering College
Algebra. Despite the non-random sample, the treatment and comparison groups did not
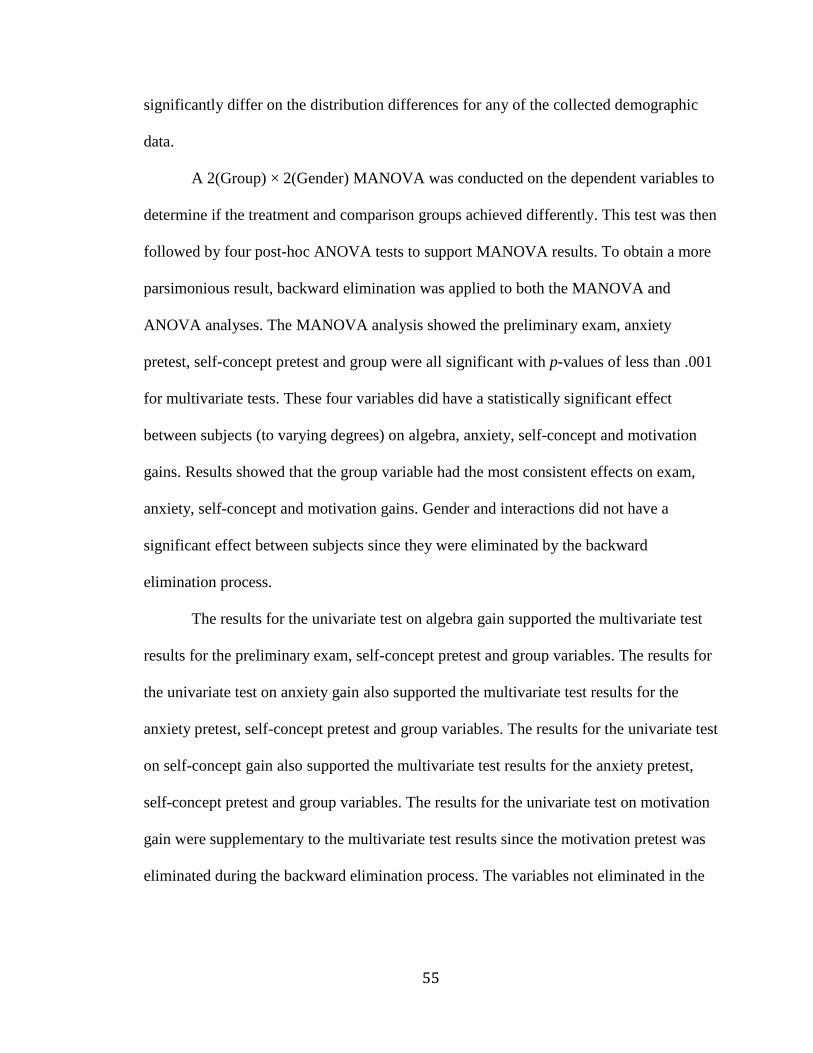
55
significantly differ on the distribution differences for any of the collected demographic
data.
A 2(Group) × 2(Gender) MANOVA was conducted on the dependent variables to
determine if the treatment and comparison groups achieved differently. This test was then
followed by four post-hoc ANOVA tests to support MANOVA results. To obtain a more
parsimonious result, backward elimination was applied to both the MANOVA and
ANOVA analyses. The MANOVA analysis showed the preliminary exam, anxiety
pretest, self-concept pretest and group were all significant with p-values of less than .001
for multivariate tests. These four variables did have a statistically significant effect
between subjects (to varying degrees) on algebra, anxiety, self-concept and motivation
gains. Results showed that the group variable had the most consistent effects on exam,
anxiety, self-concept and motivation gains. Gender and interactions did not have a
significant effect between subjects since they were eliminated by the backward
elimination process.
The results for the univariate test on algebra gain supported the multivariate test
results for the preliminary exam, self-concept pretest and group variables. The results for
the univariate test on anxiety gain also supported the multivariate test results for the
anxiety pretest, self-concept pretest and group variables. The results for the univariate test
on self-concept gain also supported the multivariate test results for the anxiety pretest,
self-concept pretest and group variables. The results for the univariate test on motivation
gain were supplementary to the multivariate test results since the motivation pretest was
eliminated during the backward elimination process. The variables not eliminated in the

56
univariate analysis were the motivation pretest and group, which were both significant for
motivation gain.
Since the multivariate and univariate tests did indicate significant differences for
the former variables, parameter estimates were also given along with the univariate
analyses to indicate the type of relationships present. Parameter estimates indicated the
preliminary exam had a negative association with the algebra gain, which was expected.
Parameter estimates also indicated the self-concept pretest had a positive association with
algebra achievement gain, which was unexpected. In addition the treatment group did, as
expected, have a positive association with algebra achievement gain. The treatment group
did demonstrate higher achievement than the comparison group as hypothesized.
The second univariate test examined anxiety gain. Parameter estimates indicated
the treatment group had a positive association with the anxiety gain, which was expected
since a higher score on the anxiety test indicates lower anxiety. These estimates also
indicated the anxiety pretest had a negative association with anxiety gain, which was also
an expected result. In addition the self-concept pretest unexpectedly had a positive
association with anxiety gain. The treatment group did demonstrate lower anxiety than
the comparison group as hypothesized.
The third univariate test examined self-concept gain. Parameter estimates
indicated the treatment group had a positive association with the self-concept gain, which
was expected since a higher score on the self-concept test indicates higher self-concept.
These estimates also indicated the self-concept pretest had a negative association with
self-concept gain, which was also an expected result. The treatment group did
demonstrate higher self-concept than the comparison group as hypothesized.

57
The final univariate test examined motivation gain. Parameter estimates indicated
the treatment group had a negative association with the motivation gain, which was
unexpected since a higher score on the motivation test indicates higher motivation. These
estimates also indicated the motivation pretest had a negative association with motivation
gain, which was an expected result. The treatment group did not demonstrate higher
motivation than the comparison group as hypothesized.
A logistic regression analysis was conducted with the preliminary exam and
treatment group as predictor variables to determine if students in the treatment group had
a greater probability of passing the course than students in the comparison group. Results
indicated a significant difference for the treatment group and preliminary exam predictors
with p-values of .005 and .029 respectively. Since both predictor coefficients were
positive, both the treatment group and preliminary exam predictors contributed positively
to students‟ probability of passing the course. As hypothesized students in the treatment
group were more likely to pass the course than students in the comparison group.
The internal consistency assessments indicated the preliminary exam, final
algebra exam, anxiety instrument, self-concept instrument and motivation instrument
reliabilities were .48, .71, .92, .98 and .93 respectively. Since the range of consistency
assessments is zero to one, reliabilities for the anxiety, self-concept and motivation
instruments were quite good, however the final algebra exam, and particularly the
preliminary exam were relatively low. Risk of a Type I error was slightly increased for
the analysis of variance procedures since the data were not entirely normally distributed.
In addition power was slightly reduced since the data did not have homogeneous
covariance matrices. Dependent measures were moderately correlated except for the

58
anxiety instrument, which reduced test validity for the multivariate analysis. However
post-hoc univariate analyses did support multivariate results. Satisfied test assumptions
for the logistic regression analysis were: assumptions of statistically independent
outcomes, mutually exclusive and collectively exhaustive categories and sample size. It is
unclear if the specificity assumption was completely satisfied. Randomization was not
part of the study design however it was assumed by analysis of variance and logistic
regression procedures.
Examination of the demographic data indicated the treatment and comparison
groups did have similar distributions of age, gender, ethnicity, placement qualifications
and socio-economic status. This demographic information was valuable since data did
not optimally satisfy test assumptions for the MANOVA, ANOVA and logistic
regression procedures. However the multivariate procedures were reasonably unaffected
by assumption violations since this procedure is considered robust. In addition use of the
backward elimination method increased the power of the analysis of variance procedures.
Analysis of variance procedures indicated the treatment group did have lower
anxiety, higher achievement and self-concept as hypothesized and demonstrated by
Townsend, Tuck, Moore, & Wilton‟s and Valentino‟s studies. However, the treatment
group demonstrated lower motivation which was contrary to the hypothesis and previous
studies such as Bouris, Creel & Stortz found. Perhaps this motivation loss was due to
Hurley and Allen‟s process loss which includes student motivation loss due to difficulties
administering the treatment coupled with minimally experienced cooperative learning
instructors (2007). The backward elimination method indicated that no gender differences
were significant which was also contrary to previous studies. This result was also

59
contrary to the hypothesis that females in the treatment group would have a more
significant change in anxiety than males in the treatment group. Logistic regression
analysis did indicate that the treatment group had a greater probability of passing the
course than students in the comparison group, as hypothesized.
Recommendations for Further Research
More work still needs to be done on cooperative learning and its effects on
student outcomes. This study resulted in two unexpected outcomes which should be
examined more closely. First, the self-concept pretest was positively correlated with
algebra gain. Previous research has shown that students in cooperative classrooms did
demonstrate higher self-concept. However studies on correlations of mathematics
achievement and self-concept among individualistic, competitive and cooperative
structures are still needed to examine why these variables are related and what conditions
may change this relationship.
The second unexpected outcome of this study was that the treatment group did not
demonstrate higher motivation than the comparison group as hypothesized and previously
found in other studies. Although this effect may be explained by Hurley and Allen‟s
process loss along with novice cooperative learning instructors (2007). Perhaps a study
examining the relationship between the five key elements for success and motivation,
which may change according to the method or amount each key element is applied in the
treatment. Since twenty of the twenty-one sections were taught by novice instructors then
perhaps a study comparing student outcomes and instructor experience with cooperative
learning methods may shed some light on more effective applications. In addition to these
60
recommendations, perhaps a similar study to this project with a stronger design may also
be in order.
As with most social science research, a random sample is difficult to obtain
however remains the ideal to be strived for. The external validity and population
generalizability of the current study would be increased if a random sample was drawn
from the accessible population. Ecological generalizability would also be improved if the
sample was taken from a random selection of schools during a regular semester. Perhaps
a similar study that utilizes a cross-sectional or cohort design would have a more
parsimonious result and reveal variable interactions better.

61
APPENDIX A
Figure 4.1 Histogram of age by year. Years that have zero values are not displayed.
Figure 4.2 Bar graph of gender distributions for treatment and comparison groups.
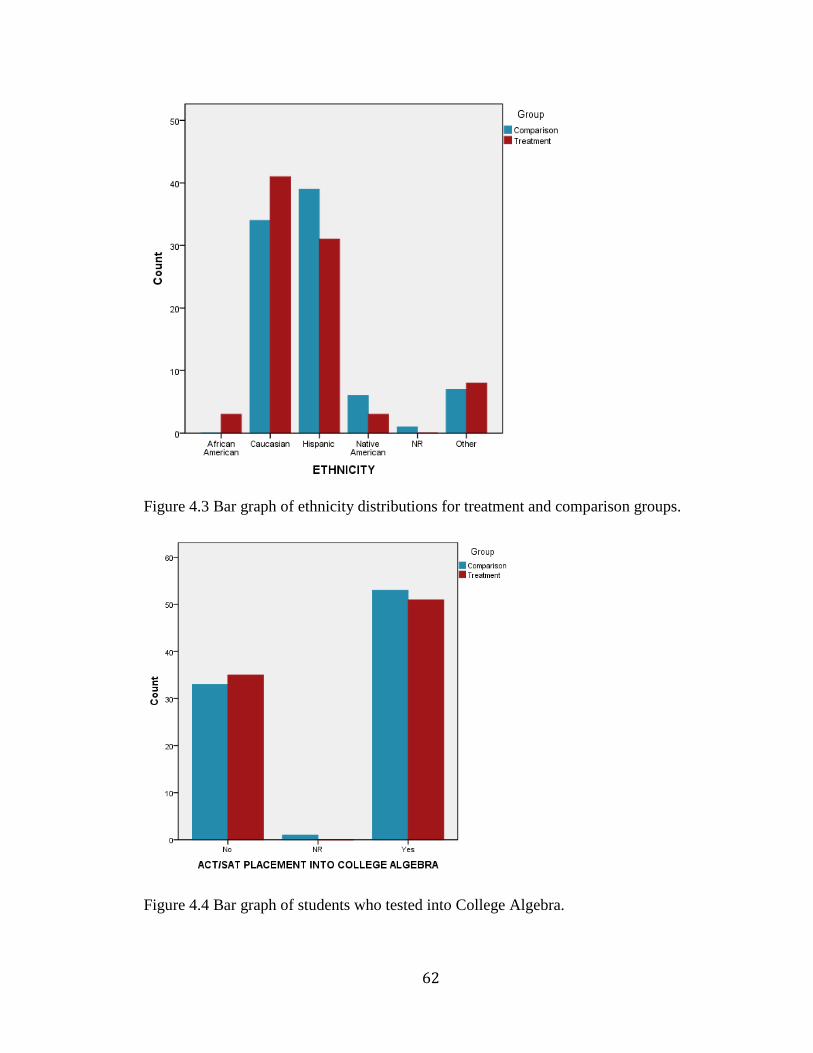
62
Figure 4.3 Bar graph of ethnicity distributions for treatment and comparison groups.
Figure 4.4 Bar graph of students who tested into College Algebra.

63
Figure 4.5 Bar graph of students who took intermediate algebra.
Figure 4.6 Bar graph of socio-economic distributions.

64
APPENDIX B
Tables
Response by population
Instrument Total Sample Treatment Comparison
Preliminary OR Final Exam 227 50 177
Preliminary AND Final Exam 173 86 87
Online Pretest 566 169 397
Online Posttest 357 118 239
Table 4.1 Participant response by population.
Ethnicity by population
Ethnicity Institution in general Treatment Comparison
African American 3.4% 4% 0%
Asian/Pacific Islander 3.9% NR NR
Native American 6.7% 4% 7%
Hispanic 37% 36% 45%
Caucasian 43.2% 48% 39%
No Response 4.8% 0% <1%
Other 1% 9% 8%
*NR denotes not a reported value
Table 4.3 Ethnicity by population.
Multivariate Analysis of Variance
Multivariate Tests b
Effect
Value F Hypothesis df Error df Sig.
Partial Eta
Squared
Intercept Pillai's Trace .548 49.932a 4.000 165.000 .000 .548
Wilks' Lambda .452 49.932a 4.000 165.000 .000 .548
Hotelling's Trace 1.210 49.932a 4.000 165.000 .000 .548
Roy's Largest Root 1.210 49.932a 4.000 165.000 .000 .548
PRELIM Pillai's Trace .523 45.202a 4.000 165.000 .000 .523
Wilks' Lambda .477 45.202a 4.000 165.000 .000 .523

65
Hotelling's Trace 1.096 45.202a 4.000 165.000 .000 .523
Roy's Largest Root 1.096 45.202a 4.000 165.000 .000 .523
ANXT_PRE Pillai's Trace .440 32.398a 4.000 165.000 .000 .440
Wilks' Lambda .560 32.398a 4.000 165.000 .000 .440
Hotelling's Trace .785 32.398a 4.000 165.000 .000 .440
Roy's Largest Root .785 32.398a 4.000 165.000 .000 .440
SC_PRE Pillai's Trace .435 31.726a 4.000 165.000 .000 .435
Wilks' Lambda .565 31.726a 4.000 165.000 .000 .435
Hotelling's Trace .769 31.726a 4.000 165.000 .000 .435
Roy's Largest Root .769 31.726a 4.000 165.000 .000 .435
GROUP Pillai's Trace .150 7.252a 4.000 165.000 .000 .150
Wilks' Lambda .850 7.252a 4.000 165.000 .000 .150
Hotelling's Trace .176 7.252a 4.000 165.000 .000 .150
Roy's Largest Root .176 7.252a 4.000 165.000 .000 .150
a. Exact statistic
b. Design: Intercept + PRELIM + ANXT_PRE + SC_PRE + GROUP
Table 4.8 Multivariate tests.
Tests of Between-Subjects Effects
Source Dependent Variable Type III
Sum of
Squares df
Mean
Square F Sig.
Partial Eta
Squared
Corrected
Model
Gain from
Preliminary to Final
Exam
34318.241a 4 8579.560 43.659 .000 .510
Anxiety Gain 1328.358b 4 332.090 15.407 .000 .268
Self-Concept Gain 4053.805c 4 1013.451 5.183 .001 .110
Motivation Gain 9770.518d 4 2442.630 3.890 .005 .085
Intercept Gain from
Preliminary to Final
Exam
33655.671 1 33655.671 171.266 .000 .505
Anxiety Gain .211 1 .211 .010 .921 .000
Self-Concept Gain 465.786 1 465.786 2.382 .125 .014

66
Motivation Gain 3865.178 1 3865.178 6.155 .014 .035
PRELIM Gain from
Preliminary to Final
Exam
32325.959 1 32325.959 164.499 .000 .495
Anxiety Gain 13.302 1 13.302 .617 .433 .004
Self-Concept Gain 153.367 1 153.367 .784 .377 .005
Motivation Gain 799.786 1 799.786 1.274 .261 .008
ANXT_PRE Gain from
Preliminary to Final
Exam
17.747 1 17.747 .090 .764 .001
Anxiety Gain 1157.312 1 1157.312 53.694 .000 .242
Self-Concept Gain 249.051 1 249.051 1.274 .261 .008
Motivation Gain 542.300 1 542.300 .864 .354 .005
SC_PRE Gain from
Preliminary to Final
Exam
738.879 1 738.879 3.760 .054 .022
Anxiety Gain 619.329 1 619.329 28.734 .000 .146
Self-Concept Gain 1884.441 1 1884.441 9.638 .002 .054
Motivation Gain 1285.616 1 1285.616 2.047 .154 .012
GROUP Gain from
Preliminary to Final
Exam
1559.284 1 1559.284 7.935 .005 .045
Anxiety Gain 74.731 1 74.731 3.467 .064 .020
Self-Concept Gain 939.855 1 939.855 4.807 .030 .028
Motivation Gain 7641.064 1 7641.064 12.169 .001 .068
Error Gain from
Preliminary to Final
Exam
33013.918 168 196.511
Anxiety Gain 3621.064 168 21.554
Self-Concept Gain 32848.288 168 195.526
Motivation Gain 105493.031 168 627.935
Total Gain from
Preliminary to Final
Exam
68493.360 173
Anxiety Gain 5103.000 173
Self-Concept Gain 37494.000 173
Motivation Gain 130191.000 173

67
Corrected
Total
Gain from
Preliminary to Final
Exam
67332.158 172
Anxiety Gain 4949.422 172
Self-Concept Gain 36902.092 172
Motivation Gain 115263.549 172
a. R Squared = .510 (Adjusted R Squared = .498)
b. R Squared = .268 (Adjusted R Squared = .251)
c. R Squared = .110 (Adjusted R Squared = .089)
d. R Squared = .085 (Adjusted R Squared = .063)
Table 4.9 Tests between subjects.
Tests of Normality
Group Kolmogorov-Smirnov
a Shapiro-Wilk
Statistic df Sig. Statistic df Sig.
Algebra Gain Comp .071 87 .200* .983 87 .302
Treat .048 86 .200* .992 86 .905
Anxiety Gain Comp .070 87 .200* .990 87 .756
Treat .098 86 .040 .979 86 .165
Self-Concept Gain Comp .109 87 .012 .972 87 .057
Treat .120 86 .004 .967 86 .026
Motivation Gain Comp .065 87 .200* .983 87 .302
Treat .152 86 .000 .916 86 .000
a. Lilliefors Significance Correction
* This is a lower bound of the true significance.
Table 4.19 Tests for normality.
Levene's Test of Equality of Error Variancesa
F df1 df2 Sig.
Algebra Gain 2.710 3 115 .048
Anxiety Gain .210 3 115 .889
Self-Concept Gain .755 3 115 .521
Motivation Gain 3.625 3 115 .015
Tests the null hypothesis that the error variance of the dependent variable is equal across groups.
a. Design: Intercept + Group + Gender + Group * Gender
Table 4.20 Test for the homogeneity of covariance matrices.

68
Correlations
Algebra ExamGain
Self-Concept
Gain Motivation Gain
Anxiety
Gain
Algebra
Exam Gain
Pearson Correlation 1 .225**
.077 .023
Sig. (2-tailed) .008 .366 .786
N 173 140 141 143
Self-
Concept
Gain
Pearson Correlation .225**
1 .598**
-.017
Sig. (2-tailed) .008 .000 .851
N 140 140 139 120
Motivation
Gain
Pearson Correlation .077 .598**
1 .001
Sig. (2-tailed) .366 .000 .992
N 141 139 141 120
Anxiety
Gain
Pearson Correlation .023 -.017 .001 1
Sig. (2-tailed) .786 .851 .992
N 143 120 120 143
**. Correlation is significant at the 0.01 level (2-tailed).
Table 4.21 Test for correlations between instruments.

69
APPENDIX C
In class algebra preliminary exam:
Version A
1.
is equal to:
a)
b)
c)
d)
2. If x = -2 and y = -1, then
is equal to:
a) 16
b) -4
c) 4
d) No real solution
3. If x = -3 and y = 5, then is equal to:
a) 26
b) 4
c) -14
d) 14
4. The radical is written in simplified form is:
a)
b)
c)
d)
5. is equal to:
a)
b)
c)
d)
6. The simplified form of
is:
a)
b)
c)
d)

70
7. The simplified form of
is:
a) -18
b) 9
c)
d) Cannot be simplified
8. Approximated to the nearest tenth, is equal to:
a) 4.4
b) 4.1
c) 4.2
d) 2.2
9. If A, B and C are points on a number line with coordinates -3, -2 and 5, respectively,
then the distance between A and C is:
a) 2
b) 0
c) -5
d) 8
10. The product is equal to:
a)
b)
c)
d)
11. The domain of the variable x in the expression
is:
a)
b)
c)
d)
12. The complete factorization of is:
a)
b)
c) d) Cannot be factored
13. When is divided by the answer is:
a) , R 1
b)
c)
d) , R -8
Version B

71
1.
is equal to:
a) 2
b)
c)
d)
2. If x = -1 and y = -2, then
is equal to:
a) -2
b) -4
c)
d) No real solution
3. If x = -2 and y = -4, then is equal to:
a) 2
b) 8
c) -24
d) -8
4. The radical , written in simplified form is:
a)
b)
c)
d)
5. The factors of are:
a)
b)
c)
d)
6. The simplified form of
is:
a)
b)
c)
d)
7. The simplified form of
is:
a) 8
b) 12

72
c)
d) Cannot be simplified
8. Approximated to the nearest tenth, is equal to:
a) 4.8
b) 3.6
c) 6.2
d) 5.8
9. If A, B and C are points on a number line with coordinates -5, -2 and -1 respectively,
then the distance between A and C is:
a) 6
b) 4
c) -6
d) 3
10. The product is equal to:
a)
b)
c)
d)
11. The domain of the variable x in the expression
is:
a)
b)
c)
d)
12. The complete factorization of is:
a)
b)
c) d) Cannot be factored
13. When is divided by x – 3, the solution is:
a) , R 5
b) , R 1
c)
d)

73
APPENDIX D
In class algebra final exam:
1. The solution(s) to the equation
is/are:
a) x = 3, x= 1
b) x = -3
c) x = -3, x = -1
d) x = 1
2. The logarithm
is equivalent to:
a)
b) -2
c) 3
d)
3. The solution(s) to the equation is/are:
a) x = 4, x= 1
b) x = 1
c) x = 0
d) x =
4. The graph of the basic exponential equation
a) has a vertical asymptote of x = 0
b) has a horizontal asymptote of y = 0
c) has an x-intercept at (1, 0)
d) has a y-intercept at (0, -1)
5. The function is increasing over the interval:
a) (-∞, -2) b) (-∞, 2) c) (-2, ∞) d) (2, ∞)
6. Sam has 400 yards of fencing and wishes to enclose a rectangular area. Express the
area as a function of the width. After you find the width that gives the maximum area,
find the maximum area. The maximum area is:
a) 400 yds.²
b) 160,000 yds.²
c) 10,000 yds.²
d) 40,000 yds.²
7. The inverse of is:
a)
b)
c)
d)

74
8. The vertex of the quadratic function is:
a) (-3, 46)
b) (3, -22)
c) (-3, 50)
d) (3, -4)
9. The one true statement about the graph of the function is:
a) It is an increasing function with three x-intercepts.
b) Its only intercept is the point (0, 0).
c) It is a parabola, opening up, with a vertex at (0, 0).
d) It passes through the point (-2, -4).
For questions 10-13: Let
10. The vertical asymptote of g(x) is:
a) x = 2
b) x = -1
c) y = x - 2
d) x = 0
11. The horizontal asymptote of g(x) is:
a) x = 3, x= 1
b) x = -3
c) x = -3, x = -1
d) x = 1
12. The x-intercept(s) of g(x) is/are:
a) y = x - 2
b) y = 0
c) y = 1
d) y = 2
13. g(-2) =
a) 0
b) Undefined
c) 4
d)
14. Given the one-to-one function f
, the range of its inverse is is:
a) y ≠ 1
b) y ≠0, y ≠
c) y ≠ 0
d) y ≠
e) all y

75
15. If the data (0, 2), (1, 3), (3, 10), (4, 15), (1, 2), (3, 8), (2, 5) & (4, 18) is modeled as an
exponential relationship, the best equation is:
a) b) c) d)
16. The graph of the equation is:
a) a parabola, opening down, with a vertex at
.
b) a parabola, opening up, with a vertex at
.
c) a straight line with slope of -2 and a y-intercept of 1.
d) none of the above
17. In order to compute her tax, Janet must subtract $5,000 from her income, then divide
the result by 3.781356. According to that formula, an income of $41,500 would result
in a tax of:
a) $138,019.49
b) $9,652.62
c) $3,711.49
d) $5,974.90
18. Sid's Sub Sales are modeled by the function S , were S
represents sales per day (in dollars) and x equals the number of different choices he
provides his customers. If Sid is set up to provide at most 25 choices of sandwich, in
order to maximize his daily sales, he should provide about:
a) 6 choices
b) 12 choices
c) 18 choices
d) 25 choices
19. Quimi starts from home at 8 am riding 11 mph on his bike. Thirty minutes later, his
sister Adela starts down the same road riding 13 mph. Adela would catch up to Quimi
at:
a) 9:25 a.m.
b) 10:00 a.m.
c) 11:15 a.m.
d) 12:05 p.m.
20. The amount of money Jeremy should invest now in order for his account to be worth
$15,000 after 5 years at 3.5% yearly interest, compounded monthly, is about:
a) $13,250
b) $12,595
c) $17,864
d) $12,630

76
21. A biologist began an experiment with a population of 500 insects. After 4 days had
gone by, there were 650 insects. Assuming natural exponential growth, the doubling
time for this insect population is about:
a) 1100 days
b) 10 days, 14 hours
c) 6 days, 8 hours
d) 12 days
For questions 22-24, let and
22. g(f(x)) =
a)
b)
c)
d)
23. f(g(-2)) =
a)
b) 8
c) -
d) -16
24.
a) -4
b) 0
c)
d) Undefined
25. When a gas station sold 600 gallons of gas per day, its operating costs were $750.
When it sold 1150 gallons of gas a day, its operation costs were $975. Assuming a
linear relationship between gas sold (x) and operating costs (y), the gas station
manager calculates that when 1000 gallons are sold per day, the operating costs
would be:
a) $750.00
b) $913.64
c) $950.25
d) $2150.00
26. The solution(s) to the equation
is/are:
a)
b)

77
c)
d)
27. For the function
, the average rate of change from x = -2 to x = 3 is:
a)
b)
c)
d) -1
28. The graph of the piecewise-defined function
a) has x-intercepts at (-1, 0) and (1, 0).
b) is symmetrical about the x-axis.
c) has a vertical asymptote of x = 2.
d) includes the point (2, -3).
29. The graph of the function
a) has been shifted 2 to the right and flipped upside-down.
b) includes the point (0, -9).
c) has a vertical asymptote of x = 1.
d) cannot be graphed.
30. The graph of the function
a) is increasing over the interval (-1, ∞).
b) is symmetrical about the y-axis.
c) has a horizontal asymptote of y = 3.
d) includes the point (-1, -1).

78
APPENDIX E
Math anxiety inventory (Betz, 1978). Note that this inventory is a modified version of the
Fennema Sherman Mathematics Anxiety Scale (Betz, 1978; Fennema & Sherman, 1976,
1986 as cited in Bessant, K., 1995). The 4-item Likert scale used to measure this
instrument is almost never - sometimes - often - almost always. Items that were reverse
scored are marked with an “R”.
1. It wouldn‟t bother me at all to take more math courses.
2. I have usually been at ease during math tests.
3. I have usually been at ease in math courses.
4. I usually don‟t worry about my ability to solve math problems.
5. I almost never get uptight while taking math tests.
6. I get really uptight during math tests. R
7. I get a sinking feeling when I think of trying hard math problems. R
8. My mind goes blank and I am unable to think clearly when working mathematics. R
9. Mathematics makes me feel uncomfortable and nervous. R
10. Mathematics makes me feel uneasy and confused. R

79
APPENDIX F
Math self-concept inventory (Gourgey, 1982).The 5-item Likert scale used to measure
this instrument is disagree strongly - disagree somewhat - undecided - agree somewhat -
agree strongly. Items that were reverse scored are marked with an “R”.
1. It takes me much longer to understand mathematical concepts than the average
person. R
2. I have never felt myself incapable of learning math.
3. I have a mental block when it comes to math. R
4. I have a good mind for math.
5. I can understand a math problem then it must be an easy one. R
6. It has always seemed as if math required brain cells I didn‟t have. R
7. I can understand math better than most people.
8. Whenever I am exposed to math, I feel that it is beyond me. R
9. I don‟t ask questions in math classes because mine sound so stupid. R
10. I have no more trouble understanding math than any other subject.
11. I just don‟t have a mathematical mind. R
12. When I have difficulties with math, I know I can handle them if I try.
13. My mathematical ability is above average.
14. I have never been able to think mathematically. R
15. I always feel like a dummy in my math classes. R
16. I don‟t have a good enough memory to learn math. R
17. I get very tense when I see a math problem because I know I will not be able to do it.
R 18. I never feel like a mathematical incompetent.
19. Whenever I do math problems, I am sure that I have made a mistake. R
20. I feel secure in my ability to do math.
21. If my eating depended on my ability to do math, I would undoubtedly starve to death.
R 22. I have no facility with numbers. R
23. When I have to take math, I worry about whether I can pass. R
24. When I have to do math problems, I do not worry about whether I will be able to do
them.
25. Whenever I do math problems, I end by giving up in despair. R
26. I never worry about failing math.
27. When I do math, I feel confident that I have done it correctly.

80
APPENDIX G
Science motivation inventory by Glynn and Koballa 2006 (as cited in Glynn,
Taasoobshirazi, Brickman, 2009). Note that the original inventory said “science” instead
of “math”. The 5-item Likert scale used to measure this instrument is never - rarely -
sometimes-usually - always. Items that were reverse scored are marked with an “R”.
1. I enjoy learning the math.
2. The math I learn relates to my personal goals.
3. I like to do better than other students on the math tests.
4. I am nervous about how I will do on the math tests. R
5. If I am having trouble learning the math, I try to figure out why.
6. I become anxious when it is time to take a math test. R
7. Earning a good math grade is important to me.
8. I put enough effort into learning the math.
9. I use strategies that ensure I learn the math well.
10. I think about how learning the math can help me get a good job.
11. I think about how the math I learn will be helpful to me.
12. I expect to do as well as or better than other students in the math course.
13. I worry about failing the math tests. R
14. I am concerned that the other students are better in math. R
15. I think about how my math grade will affect my overall grade point average.
16. The math I learn is more important to me than the grade I receive.
17. I think about how learning the math can help my career.
18. I hate taking the math tests. R
19. I think about how I will use the math I learn.
20. It is my fault, if I do not understand the math.
21. I am confident I will do well on the math labs and projects.
22. I find learning the math interesting.
23. The math I learn is relevant to my life.
24. I believe I can master the knowledge and skills in the math course.
25. The math I learn has practical value for me.
26. I prepare well for the math tests and labs.
27. I like math that challenges me.
28. I am confident I will do well on the math tests.
29. I believe I can earn a grade of “A” in the math course.
30. Understanding the math gives me a sense of accomplishment.

81
APPENDIX H
Glossary of specialized terms.
A
Alpha coefficient: see “Cronbach Alpha”
Anxiety refers to “feelings of tension that interfere with the manipulation of numbers and
the solving of mathematical problems in a wide variety of ordinary and academic
situations” from Tobias (as cited in Townsend, & Wilton, 2003)
B
C
Cronbach Alpha: “An internal consistency or reliability coefficient for an instrument
requiring only one test administration.” (Fraenkel & Wallen, 2009)
D
E
Effect Size: “An index used to indicate the magnitude of an obtained result or
relationship.” (Fraenkel & Wallen, 2009) Usually ranges between zero and one.
Environment of Cooperation Is when students promote each other‟s success within
each group (Johnson et al., 1998).
External Validity: “Is the degree to which results are generalizable or applicable, to
groups and environments outside the research setting” (Fraenkel & Wallen, 2009)
F
Factorial Design: “An experimental design that involves two or more independent
variables (at least one of which is manipulated) in order to study the effects of the
variables individually, and in interaction with each other, upon a dependent variable.”
(Fraenkel & Wallen, 2009)
Five Key Elements for Success Five elements critical for successful implementation of
the cooperative learning method which include positive interdependence, individual
accountability, environment of cooperation, social skills and group processing (Johnson
et al., 1998).
G
Group Processing Is the time students take to evaluate themselves and their cooperation
with each other (Johnson et al., 1998).
H
I
Individual Accountability When each student is individually assessed, by quizzes,
exams, observations, etc. (Johnson et al., 1998).

82
J
K
Kuder-Richardson Approaches: “Procedures for determining an estimate of the
internal consistency reliability of a test or other instrument from a single administration
of the test without splitting the test into halves.” (Fraenkel & Wallen, 2009)
Kuder-Richardson KR21 Test: This test assumes that instrument items are of equal
difficulty. The formula used to calculate this reliability coefficient is:
where K:= the number of items on the test, M:= the mean of the set of test scores and
SD:= the standard deviation of the set of test scores. (Fraenkel & Wallen, 2009)
L
M
Motivation “is the internal state of the student that arouses, directs and sustains goal-
oriented behavior” (Glynn, Taasoobshirazi, Brickman, 2009)
N
O
Outcome Task Performance: Is a product of the potential productivity minus the
process loss (Hurley, & Allen, 2007).
P
Partial Eta Squared: Denotes effect size. See effect size.
Pearson Correlation Coefficient (r): “An index of correlation appropriate when the data
represent either interval or ratio scales; it takes into account each pair of scores and
produces a coefficient between 0.00 and either ±1.00.” (Fraenkel & Wallen, 2009)
Positive Interdependence When each student perceives that his/her success is reliant on
the success of the group (Johnson et al., 1998).
Potential productivity: Is a combination of the resources available to students along
with the task demands put upon the students (Hurley, & Allen, 2007).
Problem Based Learning Is a teaching method that centers on the student. Students are
divided into groups of approximately two to five and given a structured task or problem.
The students are then expected to interpret the problem, gather the needed information,
identify possible solutions, evaluate options and present conclusions with the teacher
acting only as a guide (Roh, 2003).
Process Loss: Is the time taken from student learning and used for the administration of
the teaching method (Hurley, & Allen, 2007).
Q
Quasi-Experimental Design: “A type of experimental design in which the researcher
does not use random assignment of subjects to groups.” (Fraenkel & Wallen, 2009)
R
83
Reliability Coefficient: “An index of the consistency of scores on the same instrument.
There are several methods of computing a reliability coefficient, depending on the type of
consistency and characteristics of the instrument.” (Fraenkel & Wallen, 2009)
S
Self-Concept “refers to a student‟s beliefs, feelings, attitudes and/or perceptions
regarding one‟s ability to understand and perform tasks in mathematics” (Townsend, &
Wilton, 2003; Gourgey, 1982)
Social Skills Includes both modeling interpersonal and small-group social skills
including leadership, decision making, trust building, communication and conflict
management, in short, students need to be guided to cooperate with each other. (Johnson
et al., 1998).
T
Type I Error: “Rejecting the null hypothesis when it is true; also called an alpha error.”
(Bryant et al., 2000) and (Fraenkel & Wallen, 2009)
Type II Error: “The failure to reject a null hypothesis that is false; also called a beta
error.” (Fraenkel & Wallen, 2009)
U
V
W
X
Y
Z

84
REFERENCES
Akinoğlu, O. & Tandoğan, R. Ö., (2006). The effects of problem-based active learning in
science education on students‟ academic achievement, attitude and concept learning.
Eurasia Journal of Mathematics, Science & Technology Education, 3(1), 71-81.
Betz, N. E., (1978). Prevalence, distribution, and correlates of math anxiety in college
students. The Journal of Counseling Psychology, 25(5), 441-448.
Bouris, R., Creel, H., Stortz, B. (1998). Improving student motivation in secondary
mathematics by the use of cooperative learning. Master‟s Action Research Project,
Saint Xavier University and IRI/Skylight.
Bryant, F. B., Durlak, J. A., Grimm, L. G., Klem, L., Licht, M. H., Rodgers, W., …
Yarnold, P. R. (2000). Reading and understanding multivariate statistics. American
Psychological Association. Washington, D.C.
Dowd, E. T. & Kelly, F. D., (2005). Adlerian psychology and cognitive-behavior therapy:
Convergences. Journal of Individual Psychology, 36(2), 119-135.
Fraenkel, J. R. & Wallen, N. E., (2009). How to design and evaluate research in
education. McGraw-Hill. New York.
Glynn, S. M., Taasoobshirazi, G., Brickman, P. (2009). Science motivation questionnaire:
Construct validation with non-science majors. Journal of Research in Science
Teaching, 46(2), 127-146.
Gourgey, A. F., (1982). Development of a scale for the measurement of self-concept in
mathematics. New York: New York University. (ERIC Document reproduction
service No ED 223702).
85
Hersh, R., & John-Steiner, V., (2011). Loving and hating mathematics: Challenging the
myths of mathematical life. Princeton University Press. Princeton, NJ.
Hurley, E. A., & Allen, B. A., (2007). Asking the how questions: Quantifying group
processes behaviors. The Journal of General Psychology, 134(1), 5-21.
Jacob, E., (1999). Cooperative learning in context. State University of New York Press.
Albany.
Jaques, D., (1991). Learning in groups. Kogan Page. London.
Johnson, D. W., Johnson, R.T., & Smith, K. A., (1998). Cooperative learning returns to
college: What evidence is there that it works? Change, 27-35.
Johnson, D. W., Maruyama, G., Johnson, R., Nelson, D., & Skon, L., (1981). Effects of
cooperative, competitive, and individualistic goal structures on achievement: A meta-
analysis. Psychological Bulletin, 89(1), 47-62.
Lemke, M., A., Pahlke, E., Partelow, L., Miller, D., WIlliams, T., Kastberg, D. &
Jocelyn, L. (2004). International outcomes of learning in mathematics literacy and
problem solving: PISA 2003 results from the U.S. perspective. (NCES 2005-003).
Washington, DC: U.S. Department of Education, National Center for Education
Statistics. Website: http://nces.ed.gov/pubs2005/2005003.pdf
Looney, S. W., (1995). How to use tests for univariate normality to assess multivariate
normality. The American Statistician, 49(1), 64-70.
Marsh, G. E. II, Tapia, M. (2002). Feeling good about mathematics: are there sex
differences? Paper presented at the Annual Meeting of the Mid-South Educational
Research Association. (ERIC Document reproduction service No ED SE067528).

86
Mulryan, C. M., (1995). Fifth and sixth graders‟ involvement and participation in
cooperative small groups in mathematics. The Elementary School Journal, 95(4),
297-310.
National Mathematics Advisory Panel, (2008). Foundations of Success: A Final Report,
U. S. Department of Education,
http://www.ed.gov/about/bdscomm/list/mathpanel/report/final-report.pdf
Townsend, M. & Wilton, K. (2003). Evaluating change in attitude towards mathematics
using the „then-now‟ procedure in a cooperative learning programme. British Journal
of Educational Psychology. 473-487.
Townsend, M. A. R., Moore, D. W., Tuck, B. F. & Wilton, K.M., (1998). Self-concept
and anxiety in university students studying social science statistics within a co-
operative learning structure. Educational Psychology, 18(1), 41-54.
Roh, K. H. (2003). Problem-based learning in mathematics. ERIC Clearinghouse for
Science Mathematics and Environmental Education. Columbus OH. ED 482725
Slavin, R. E. (1983). When does cooperative learning increase student achievement?
Psycological Bulletin, 94(3), 429-445.
Slavin, R. E. (1990). Cooperative learning: Theory, research and practice. Prentice Hall.
New Jersey.
Slavin, R., Sharan, S., Kagan, S., Lazarowitz, R. H., Webb, C. & Schmuck, R., (1985).
Learning to cooperate, cooperating to learn. Plenum Press. New York.
Valentino, V. R., (1988). A study of achievement, anxiety, and attitude toward
mathematics in college algebra students using small-group interaction methods.

87
(Unpublished doctoral dissertation). West Virginia University, Morgantown West
Virginia.
Webb, N. M., (1986). Peer interaction and learning in small groups. International Journal
of Educational Research, 13, 21-39.