achievement in american schools - hoover institution 1930 1940 1950 1960 ... in black america,6 ......
TRANSCRIPT

chapter 3
Achievement in American Schools
Herbert J. Walberg
Yield, yield per acre, and crop quality tell agronomists and farmersmuch about results. Reduction of mortality and morbidity chieflyconcern epidemiologists and physicians. Similarly, learning or in-creases in achievement are or should be the chief aims of educa-tors. Achievement here means the knowledge and skills studentslearn in the usual school subjects, particularly as measured onstandardized multiple-choice, essay, and other examinations.
Parents, legislators, and other educational consumers are con-cerned with other matters as well, but their views of a school’sdesirability are usually based substantially on how well they thinkchildren learn. Parents know that test scores will often be amongthe chief determinants of success in gaining admission to selectiveuniversities. Firms employ examinations to screen for knowledge-able and skilled workers. Citizens want well-educated young peo-ple who contribute to the economy and society and who cancompetently vote and serve on juries.
Students should be able to read, write, calculate, and reasonskillfully; they should possess deep and wide knowledge of stan-dard subject matter. So we need to measure achievement to assesshow well students perform and how well schools are preparingthem for subsequent education, careers, citizenship, and other as-pects of their future lives.
43
.......................... 8774$$ $CH3 09-10-01 10:07:09 PS

44 Herbert J. Walberg
Assessing achievement and where American students stand arebig tasks. Should we expect schools to attain higher levels ofachievement? Or should we consider how much they progress in agiven year? Since poverty and related factors can limit children’slearning, how can we compare schools in different communitiesthat contain differing percentages of poor and rich parents?
This chapter answers these and related questions. It shows thatstandardized tests provide an effective, efficient means for assess-ing students and schools. For this reason, nations, states, andschool districts are turning to such tests to compare schools andevaluate their progress.
Since policymakers, parents, and citizens are keenly interestedin achievement, this chapter shows how U.S. students’ progresscompares with that in other countries and how their achievementlevels have changed for roughly the past quarter-century. In addi-tion, we should consider the efficiency of schools in raisingachievement in relation to how much they spend and to changinglevels of students’ abilities.
Unfortunately, as shown below, achievement has remained gen-erally stagnant with occasional, short, and apparently random up-and-down trends despite steadily and substantially rising expendi-tures and greater levels of potential student abilities. Findings frominternational achievement surveys, moreover, show that Americanstudents compare unfavorably with those in other economicallyadvanced countries in how much they learn in school, despite thefact that American schools expend more money on students thando schools in most other countries. The problem is not attributableto lower school graduation rates in other countries. The UnitedStates, once prideful of high school graduation rates, has fallenbehind the average graduation rate of affluent countries.
Achievement Stagnation in the United States
A review of how U.S. test scores have been changing reveals littleprogress in solving the achievement problem. Reading scores, forexample, show no upward trend 1984 through 1996 (see chart 1).Similar to the trends in chart 1, compilations of trends in varioussubjects and grade levels of children on National Assessment of
.......................... 8774$$ $CH3 09-10-01 10:07:09 PS

Chart 1. Reading Scores of 17-, 13-, and 9-Year-Olds
350
300
250
200
150
100
50
0
1975 1980 1985 1990 1995 2000
17 13 9
Source: U.S. Department of Education, Digest of Education Statistics, 1998, p. 129.
.......................... 8774$$ $CH3 09-10-01 10:07:09 PS

46 Herbert J. Walberg
Education Progress scores show the same essentially flat trends.Although a small upward trend may detected for some years andgrade levels, small downward trends may be found for others.1
In mathematics from 1988 through 1996 for students in schoolswith high and low concentrations of poverty, achievement scoresfor both groups of schools has been stagnant for the whole timeperiod (see chart 2).2 During this period, partly in response to ANation at Risk and other alarming reports, the schools enactedmany varied reforms. Yet achievement levels failed to rise. In pri-vate sector industries, we expect to see steady improvements andeven breakthroughs attributable to competition, improving tech-nology, and other innovations. Quality should rise while costs de-cline. Why haven’t the schools similarly improved?
Rising Expenditures on K–12 Schools
Rising expenditures on public schools have long failed to increaseachievement. The expenditures on public schools have risen sub-stantially and steadily during the period from 1920 through 1997(see chart 3). They have continued to rise in the recent period whenachievement scores for random samples of students have becomeavailable and show worrisome generally flat trends of low scoreswith fitful blips.3
Achievement Gaps
Many studies show that children in poverty often achieve less inschool than children in middle-class families. For the past quarter-
1. Source: U.S. Department of Education, Digest of Education Statistics 1998(Washington, DC.: Department of Education, 1999), p. 129. See also Stedman’sextensive compilations showing similar test score trends discussed in a subse-quent section of this chapter (see note 27).
2. The time period chosen was intended to measure results of changes in TitleI policy during the period. Office of Planning and Evaluation Service, PromisingResults, Continuing Challenges: The Final Report of the National Assessment ofTitle I (Washington, D.C.: U.S. Department of Education Office of the UnderSecretary, 1999)
3. Source: U.S. Department of Education, Digest of Education Statistics,1998 (Washington, DC.: Department of Education, 1999), p. 35.
.......................... 8774$$ $CH3 09-10-01 10:07:10 PS

47Achievement in American Schools
Chart 2. Trends in Math Performance among 9-Year-OldPublic School Students in Low- and High-Poverty Schools
250
200
150
100
50
01988 1990 1992 1994 1996
LOW 228 237 236 239 238
HIGH 208 213 206 215 217
GAP 20 24 30 24 21
Source: U.S. Department of Education, 1999, p. 6. The scale ranges from 0 to 500; high povertyschools had 76–100 percent students eligible for free lunch, low-poverty 0–25 percent. Digest of Educa-tion Statistics, 1998
century, the federal government has concentrated about $130 bil-lion on Title 1/Chapter I programs on reducing the gap betweenchildren in poverty and other children. Despite expenditures at acurrent rate of about $8 billion, the gap between schools with highconcentrations of children in poverty and other schools has re-mained the same (see chart 2). The huge expenditures appear tohave done little good in reducing the gap.
.......................... 8774$$ $CH3 09-10-01 10:07:10 PS

Chart 3. Total per Pupil Expenditures in PublicElementary and Secondary Schools, 1919 to 1998 in
Constant 1997–98 Dollars
$8,000
7,000
6,000
5,000
4,000
3,000
2,000
1,000
0
1920 1930 1940 1950 1960 1970 1980 1990 2000
Source: U.S. Department of Education, 1999, p. 35.
.......................... 8774$$ $CH3 09-10-01 10:07:11 PS

49Achievement in American Schools
The Black and Hispanic Gaps in Achievement
Since the early 1970s, the National Assessment of EducationalProgress (NAEP) and other groups have reported that on averageblack and Hispanic students have persistently and substantiallyscored below white students. For any given subject or group, thevarious trends are flat, encouraging, or discouraging; and no con-sistent overall trend since 1970 emerges from the many compari-sons that have been made. In reading, for example, NAEP datareveal that black seventeen-year-olds had improved to the pointthat their scores were equal to white thirteen-year-olds by 1990,but there were no further improvements during the decade of the1990s.4 The patterns for different subjects and groups are similarlycomplex and cannot be easily summarized, but scholars agree thatthe differences among groups are large and enduring.
Scholars have expended much more effort in trying to explainthe black gap than the Hispanic gap, but a consensus is yet toemerge. The anthropologist John Ogbu, for example, argued thatthe gap is ultimately attributable to the forced immigration andslavery of African Americans’ ancestors.5 Others argue that histor-ically deficient education systems in the deep South and inferiorschools for rural blacks in southern states harmed achievement,which generation after generation has yet to recover, even afterblacks migrated to big industrial cities in the North during theWorld War I and II years.
In Losing the Race: Self-Sabotage in Black America,6 Universityof California at Berkeley faculty member John McWhorter reviewssome of these possibilities but concludes that black ‘‘victimology’’is today’s primary reason that blacks achieve less than whites. Inhis view as a black faculty observer at the university, a cult of
4. Jay R. Campbell, Catherine M. Hombo, and John Mazzeo, NAEP 1999Trends in Academic Progress (Washington, D.C.: National Center for EducationStatistics, 2000).
5. See, for example, ‘‘Variability in Minority School Performance: A Problemin Search of an Explanation,’’ Anthropology and Education Quarterly 18, no. 4(1987): 312–34.
6. New York: Free Press, 2000.
.......................... 8774$$ $CH3 09-10-01 10:07:11 PS

50 Herbert J. Walberg
victimology transforms a problem to be solved into a persistentblack identity of anti-intellectualism, separatism, and cultural dis-connect from learning. Recent letters to the editor of Wilson Quar-terly, however, have sharply disputed his view.7
Large-scale surveys suggest to me that the achievement gap forboth blacks and Hispanics may be substantially attributable topoverty and the inefficiency of large-city school systems where mi-nority groups are concentrated.8 Although there are more poorwhites than poor blacks and poor Hispanics, the poverty ratesamong these minority groups are higher. Sociologists have shownthat the differences among whites and minority students of thesame socioeconomic status (SES) are relatively small,9 which sup-ports this explanation.
In addition, socioeconomically related differences in achieve-ment-stimulating child-rearing patterns between middle-class par-ents and those in poverty are huge. In a rare and carefulobservational study, psychologists found that higher SES parentsspent more minutes per hour interacting with their children andspoke to them more frequently. On average, higher SES parentsspoke about two thousand words an hour to their children; wel-fare parents, only about 500. By age four,
An average child in a professional family would have accumulatedexperience with almost 45 million words, an average child in a work-ing-class family would have accumulated experience with 26 millionwords, and an average child in a welfare family with 13 millionwords.10
Higher SES parents, moreover, used
more different words, more multi-clause sentences, more past and fu-ture verb tenses, more declaratives, and more questions of all kinds.
7. Autumn 2000, pp. 6–78. Herbert J. Walberg and Herbert J. Walberg III, ‘‘Losing Local Control, ’’
Educational Researcher, June/July 1994, 13 (8), 23–29.9. For a recent collection of sociological articles on this complex subject, see
Christopher Jencks and Meredith Phillips, editors, The Black-White Test ScoreGap (Washington, D.C.: Brookings Institution, 1998).
10. Betty Hart and Todd R. Risley, Meaningful Differences in the EverydayExperience of Young American Children (Baltimore, Md.: Paul Brooks Publish-ing, 1995), p. 198.
.......................... 8774$$ $CH3 09-10-01 10:07:12 PS

51Achievement in American Schools
The professional parents also gave their children more affirmativefeedback and responded to them more often each hour they were to-gether.11
The researchers estimated that, by age four, professional parentsencouraged their children with positive feedback 750,000 times,about six times as often as did welfare parents. The welfare par-ents, on the other hand, had discouraged their children with nega-tive feedback about 275,000 times, about two and a half timesthe amount employed by professional parents.12 Such parentingbehaviors predicted about 60 percent of the variation in vocabu-lary growth and use of three-year-olds. Vocabulary is the mostimportant single predictor of school success.
A second reason for the minority gaps is inefficiency of big-cityschool systems that have employed ineffective federal programssuch as Title 1/Chapter 1 and bilingual education. Because of theirsize and greater accountability to federal and state governmentsthan to local citizens and parents, moreover, big-city systems ap-pear relatively indifferent to students and parents. They havegained a well-known and often deserved image of failure. Suchbig-city achievement gaps, apparent indifference, and inefficiencyhelp explain minority parents’ strong desire to choose their chil-dren’s schools including those in the parochial and independentsectors.
Achievement Stagnates Despite Children’s Rising Abilities
Long before the era when achievement stagnation was docu-mented, students’ abilities rose massively and steadily, and theycontinue to rise. From 1918 through 1995, school children’s aver-age IQ steadily rose 25 points.13 This steep rise put the typical
11. Ibid., pp. 123–24.12. Ibid., p. 200.13. James R. Flynn, ‘‘IQ Gains over Time,’’ in Ulric Neisser, ed., The Rising
Curve: Long-Term Gains in IQ and Related Measures (Washington, D.C.: Amer-ican Psychological Association, 1998), p. 37, figure 2. Test makers renormed IQtests to make them more difficult over the period to reset them to a populationaverage of 100. Flynn discounted these renormings and adjusted the average IQestimates to make them comparable throughout the period for which scores are
.......................... 8774$$ $CH3 09-10-01 10:07:12 PS

52 Herbert J. Walberg
1995 child at the 95th percentile of the 1918 distribution. Thesechanges plus rising expenditures, better programs, and moreskilled teaching should have led to ever-higher levels of academiclearning. But, as shown in previous sections, this isn’t so. Achieve-ment stagnated.
International Comparisons of Achievement
The 1983 report to the U.S. secretary of education, A Nation atRisk,14 first alerted policymakers and citizens that U.S. studentsachieve poorly compared to those in other economically advancedcountries. Since then, as discussed below, more definitive interna-tional surveys have shown that the situation is even graver thanoriginally thought. Not only do American students achieve poorlybut they fall further behind the longer they are in school.
Value-Added Achievement Comparisons
The challenge in comparing schools is like comparing runners whobegin a race from different starting points. To know runners’speeds or rates, we would need to measure how far they run in agiven time period. Similarly, to compare the effectiveness ofschools, we need to ask how much their students improve inachievement over a given time period, which is what is meant by‘‘value-added gains.’’ Children come to one school, for example,already reading, whereas children in another school are far lesswell prepared. To have the full picture, of course, we should knowtheir gains as well as their scores at the end of any given grade. Thegains, however, are particularly important for assessing schoolsbecause they are more fully attributable to the school’s effective-ness in educating students than are their final achievement levels,which may have been largely determined by their family socioeco-
available. Now, as widely reported in psychological journals, the tendency forintelligence test scores to rise is called the ‘‘Flynn effect.’’
14. The National Commission for Excellence in Education (Washington,D.C.: U.S. Department of Education, 1983).
.......................... 8774$$ $CH3 09-10-01 10:07:13 PS

53Achievement in American Schools
nomic status, child-rearing conditions in the home, and other ex-ternal factors, especially those that influence the children’sdevelopment before they start school.
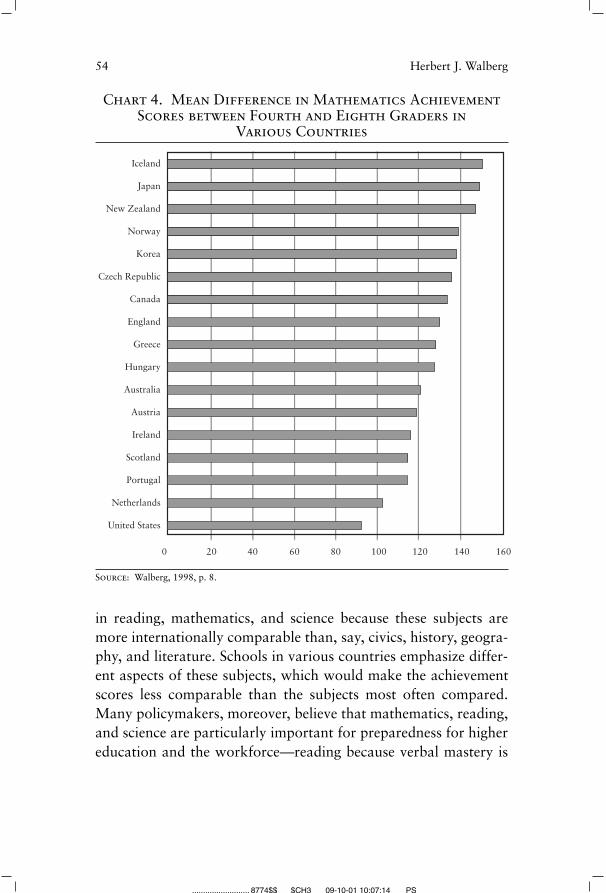
Because of widespread interest in such comparisons throughoutthe world, the Paris-based Organization for Economic Cooperationand Development (OECD) began comprehensive reporting of suchvalue-added improvements for economically advanced countries inAsia, Europe, and North America.15 As an example, chart 4 showsthe mathematics value-added achievement gains made by studentsin twenty-four countries from the fourth to the eighth grade.16 Ofthe countries surveyed, the United States made the smallest gain.
Unfortunately, this result for U.S. schools is typical of the othercomparisons of presently available data. In reading, science, andmathematics through eighth grade, U.S. schools ranked last in fourof five comparisons of achievement progress. In the fifth case, theyranked second to last. Between eighth grade and the final year ofsecondary education, U.S. schools slipped further behind those inother countries. Because they made the least progress, U.S. second-ary schools recently ranked last in mathematics attainment andsecond to last in science, a result that does not accord well withthe National Education Goals Panel objective set about a decadeago that American students will be first in the world in mathemat-ics and science.17 Actually they are last or near last among studentsin other OECD countries.
Policymakers commission international surveys of achievement
15. As of 1998, all recent value-added comparisons are in my report for theThomas B. Fordham Foundation, Spending More while Learning Less (Washing-ton, D.C.: Thomas B. Fordham Foundation, July 1998). The original data maybe found in the periodic reports of the Organization for Economic Cooperationand Development’s Education at a Glance (Paris: OECD, 1996, 1997, 1998, and1999). The charts in this chapter illustrating the country comparisons are basedon information in the 1997 report, pages 101 and 306.
16. Strictly speaking, these scores are the differences in random samples ofstudents in fourth and eighth grade at a single point in time.
17. For the accomplishment or nonaccomplishment of various national goals,see reports of the panel such as The National Educational Goals Report: Buildinga Nation of Learners. (Washington, D.C.: U.S. Government Printing Office,1998).
.......................... 8774$$ $CH3 09-10-01 10:07:13 PS
54 Herbert J. Walberg
Chart 4. Mean Difference in Mathematics AchievementScores between Fourth and Eighth Graders in
Various Countries
Iceland
Japan
New Zealand
Norway
Korea
Czech Republic
Canada
England
Greece
Hungary
Australia
Austria
Ireland
Scotland
Portugal
Netherlands
United States
0 20 40 60 80 100 120 140 160
Source: Walberg, 1998, p. 8.
in reading, mathematics, and science because these subjects aremore internationally comparable than, say, civics, history, geogra-phy, and literature. Schools in various countries emphasize differ-ent aspects of these subjects, which would make the achievementscores less comparable than the subjects most often compared.Many policymakers, moreover, believe that mathematics, reading,and science are particularly important for preparedness for highereducation and the workforce—reading because verbal mastery is
.......................... 8774$$ $CH3 09-10-01 10:07:14 PS

55Achievement in American Schools
an essential skill in nearly all subjects and economic and sociallife, mathematics and science because they indicate readiness forfurther study in demanding fields such as engineering and medicineas well as work in high-tech, fast-growing, competitive sectors ofmodern economies.
Graduation and Completion Rates
When international achievement surveys began some thirty-fiveyears ago, U.S. policymakers aimed to graduate all students fromsecondary school. In fact, greater percentages of U.S. students thengraduated from secondary school than those from other economi-cally advanced countries. Because greater percentages of U.S. stu-dents remained in school, they were included in the surveys,whereas more students comparable in age in other countries haddropped out, leaving a comparative elite. Thus, it might have beenargued that poor American school achievement at the end of sec-ondary school was partly excusable years ago because a less selec-tive American group was being compared with more selectivegroups in other countries.18
In the meantime, however, European and other OECD coun-tries made serious and successful efforts to keep more students insecondary school and graduate them. On average, schools in thesecountries now succeed better than do U.S. schools. The most re-cent OECD comparison shows that the United States ranks seven-teenth among twenty-three OECD countries in the graduationrates (percentages of secondary school graduates to the total popu-
18. Perhaps the early results were not excusable because the twelfth gradecomparisons were somewhat questionable in that they were based on Americanand other students taking college preparatory mathematics. The U.S. studentsseemed to be a similarly select group of students to those elsewhere. Some com-parisons, moreover, were made of only the top 10 percent of students. Even inthese early comparisons, our ‘‘best and brightest’’ still did not do well. In anycase, as explained above, recent comparisons of a somewhat more select group ofAmerican students with less select groups in other countries show that Americanstudents do worst or near worst in secondary school and have fallen furthestbehind during the school years.
.......................... 8774$$ $CH3 09-10-01 10:07:14 PS

56 Herbert J. Walberg
lation at the typical age of graduation).19 The average percentagesof students aged 14–17 and 18–19 enrolled in education were alsohigher in OECD countries than in the United States.20
Thus, U.S. schools have fallen behind the graduation and enroll-ment rates of other economically advanced countries. This trendshows that the poor achievement progress of U.S. schools isn’tattributable to educating a less selective group of students.
Productivity: Achievement in Relation to Expenditures
In considering country comparisons of achievement, it is impor-tant to know how much they spend on each student. Schoolsshould not only be effective but efficient or productive given theamounts of money they spend. The OECD regularly reports perstudent expenditures on primary and secondary schools.21 Amongtwenty-two countries, U.S. expenditures on primary schools22
were third highest after Switzerland and Austria (see chart 5).They were also third highest for secondary schools. Thus, U.S. perstudent expenditures were among the highest, yet our achievementprogress was generally worst.
For a country that leads the world in the competitiveness andproductivity of many old and new industries, it is shocking that
19. Education at a Glance (Paris: OECD), 2000, p. 147. The U.S. percentageof 74 is lower than the average of 79. The average, however, includes several lessaffluent, recent entrants into the OECD such as Mexico, Portugal, Spain, andTurkey with graduation rates as low as 30 percent.
20. Organization for Economic Cooperation and Development, EducationPolicy Analysis (Paris: OECD, 1997), pp. 14 and 98. OECD, Education PolicyAnalysis, 1998, p. 75.
21. See my previously footnoted report Spending More while Learning Lessor recent editions of the OECD’s Education at a Glance. The figures reported areOECD adjusted for purchasing power parity. See Eric Hanushek’s chapter in thisvolume for a detailed analysis of expenditures.
22. In writing on comparative education, the term primary usually refers tothe first school, aside from preschool, that children usually attend, which is inmany countries the first six years of schooling. This roughly corresponds to whatAmericans often call grade schools or elementary schools, although there aremany U.S. variations such as grades 1–6, 1–5, and the more traditional 1–8.Secondary schools are the second schools students attend, which in the UnitedStates are usually referred to as high schools, junior high schools, or middle schools.
.......................... 8774$$ $CH3 09-10-01 10:07:15 PS

57Achievement in American Schools
Chart 5. Expenditure per Student for Primary Educationin Public and Private institutions
Switzerland
Austria
United States
Sweden
Denmark
Italy
Japan
Finland
United Kingdom
Germany
Belgium
France
Netherlands
Australia
Spain
New Zealand
Ireland
Korea
Czech Republic
Hungary
Mexico
Turkey
0 $1,000 $2,000 $3,000 $4,000 $5,000 $6,000 $7,000
Source: Walberg, 1998, p. 11.
American schools are so inefficient. Among the consequences isthat schools fail to pull their weight in improving the quality ofAmerican life. Their graduates are less literate, less skillful, lessinformed as citizens, voters, and workers than they should be. Be-cause they constitute a large sector of the economy, schools area drag on American progress and wastefully consume resources.Citizens are not receiving value for their tax dollars. In such fieldsas science, mathematics, engineering, computer science, nursing,
.......................... 8774$$ $CH3 09-10-01 10:07:16 PS

58 Herbert J. Walberg
and medicine, we must import better-prepared, well-educatedworkers from other countries, particularly South and East Asia.23
Why the Defenders of the Status Quo are Wrong
Scholars originally uncovered the substantial U.S. achievementgap about three decades ago. As discussed above, recent researchhas confirmed the early findings and suggests that Americanachievement problems are actually worse than long thought. De-spite the huge amount of evidence, three writers have dismissedthe validity of the unrelenting findings. Gerald Bracey24 often takesthis view in his monthly column for Phi Delta Kappan, a widelycirculated education journal. David C. Berliner and Bruce J. Biddlewrote The Manufactured Crisis: Myths, Fraud, and the Attack onAmerica’s Public Schools.25
The Positions of the Critics
Because they have achieved some prominence, these writers de-serve to be answered with respect to how their work has beenpublished and their arguments. Gerald Bracey publishes much ofhis criticism of the achievement surveys in columns and annualeducation reports in the journal of Phi Delta Kappa, a society withthe expressed purpose of promoting and defending public educa-tion. Indeed, the title of Bracey’s annual reports contains thewords ‘‘Public Education.’’26 Neither his work nor Berliner and
23. Immigration is to be celebrated. We are of course a nation of immigrantsand their descendants, and we still benefit much from new arrivals. That doesnot mean, however, that that American students cannot or should not have tolearn or that schools should be excused for poor results.
24. See, for example, ‘‘The 10th Bracey Report on the Condition of PublicEducation,’’ Phi Delta Kappan, October 2000, pp. 133–144. In this and otherreports, Bracey describes how he has long called reporters to urge on them hisdismissal of education research findings critical of public schools.
25. New York: Perseus Press, 1996.26. Bracey doesn’t hesitate to employ ad hominem argumentation. He, for
example, has been allowed to give ‘‘Rotten Apple Awards’’ to presidents fromboth political parties, reporters from nationally circulated newspapers, andprominent scholars for criticizing education. Because Bracey is given the first,last, and regular word in the journal, few people correct his faulty arguments.
.......................... 8774$$ $CH3 09-10-01 10:07:16 PS

59Achievement in American Schools
Biddle’s book has gone through scholarly peer reviewing as wouldbe required in journal publication in education, psychology, andthe social sciences.
On the other hand, the data in reports summarized above onachievement changes in the United States over roughly the lastthirty years are collected by the Educational Testing Service andsimilar agencies for the U.S. Department of Education. The plansfor data collection and reporting undergo intense scholarly andgovernment scrutiny. The national press covers the reports in de-tail, often on the front page of such respected papers as the NewYork Times and the Wall Street Journal.
The international comparisons come from perhaps the mostwidely respected international statistical data agency in the world,the Organization for Economic Cooperation and Development, ofwhich about thirty advanced countries in Asia, Western Europe,and North America are voluntary members who seek to learn fromone another through cooperative data collection and analysis howto improve the education, medical, industrial, tax, and other sys-tems.
Could or would the many scholars, thirty national govern-ments, and such premiere national and international agencies‘‘manufacture’’ fraudulent data just to please the alleged nefariousconspirators who seek to make U.S. schools look unjustifiablybad? Would this not result in congressional hearings, exposes, androlling heads of education malefactors?
The Substance of the Critics’ Arguments
In five refereed publications of the twenty thousand-memberAmerican Educational Research Association and in a distinguishedpublication series of one of the oldest and most prestigious thinktanks, the Brookings Institution, Lawrence C. Stedman 27 evalu-
27. ‘‘International Achievement Differences: An Assessment of a New Per-spective,’’ Educational Researcher 26, no. 3 (1997): 4–15; ‘‘Incomplete Explana-tions: The Case of U.S. Performance in the International Assessments ofEducation,’’ Educational Researcher 23, no. 7 (1994): 24–32; ‘‘An Assessment ofthe Contemporary Debate over U.S. Achievement,’’ in D. Ravitch, ed., Brookings
.......................... 8774$$ $CH3 09-10-01 10:07:16 PS

60 Herbert J. Walberg
ated the contentions of Bracey, Berliner, and Biddle (BBB) thatAmerican education is unfairly or even conspiratorially portrayedby the NAEP and international achievement surveys. His manydetailed examples showing they are wrong cannot be describedhere, but several of Stedman’s major points are well worth summa-rizing.
The main flaw in BBB’s writings, as Stedman points out, is selec-tive evidence that suits their defense of the status quo for publicschools. Actual evidence is crucial to their argument; but, insteadof reviewing all of it, they select a few data points for a few yearsin a few subjects. They fail to point out, for example, that NAEPhigh school science scores remain lower than they were in 1969.BBB concentrate, moreover, mostly on trends, which they say, cor-rectly, are fairly stable, but they ignore the levels of achievement,which are mostly low, especially the longer American students arein school.
As Stedman further points out, BBB correctly criticized the mythof a very recent general achievement decline, but they left out thesharp 1970s decline on many high school tests and ignored thecontradictory evidence of the 1980s. BBB claimed that the currentgeneration of students outperforms prior ones on ‘‘virtually all’’commercial standardized achievement tests—a contention refutedby major reviews of historical trends on such tests, including Sted-man’s.
BBB dwelt on Scholastic Aptitude Test comparisons, but theseare nearly useless for comparing achievement scores across time.The SAT, as its name implied, is an aptitude test used for collegeselection, not an achievement test for measuring student progress.Rather than constituting a random sample as in the NAEP, thegroup taking the SAT is voluntary and the fractions of studentsthat take it at given times and states vary substantially, therebyvitiating any comparisons among them.
Papers on Education Policy (Washington, D.C.: Brookings Institution, 1998), pp.53–121; ‘‘Respecting the Evidence: The Achievement Crisis Remains Real,’’ re-view of ‘‘The Manufactured Crisis,’’ Education Policy Analysis Archives 4, no.7: http://olam.ed.asu.edu/epaa/v4n7.html; L. C. Stedman, ‘‘The AchievementCrisis Is Real,’’ review of ‘‘The Manufactured Crisis,’’ Education Policy AnalysisArchives 4, no. 1 (1996): http://olam.ed.asu.edu/epaa/v4n1.html.
.......................... 8774$$ $CH3 09-10-01 10:07:17 PS

61Achievement in American Schools
BBB try to excuse U.S. students’ poor performance on thegrounds that they don’t study what is on the international tests.But, as Stedman points out, they base this contention on only onestudy of eighth-grade math data from 1981–82, and the data didnot support their claim, nor do more recent studies.
Stedman also points out that BBB claim the international assess-ments improperly compared the broad mass of U.S. students toan overseas elite attending highly selective schools. This is an oldcriticism from the earliest studies. As discussed above, the averageOECD country now has greater percentages of age-eligible youthin and graduating from secondary school than does the UnitedStates.
Finally, aside from Stedman’s points, BBB do not deal with anyof the new research reviewed above. This research shows that, de-spite greater levels of spending and rising student abilities, achieve-ment has not risen. In addition, recent value-added analyses showAmerican students improve less than do students in other coun-tries despite the generally higher American levels of per studentexpenditures.
Achievement Tests
For those who have long been away from schools, it may be usefulto know about the current means of measuring achievement. Inkeeping with the spirit of this book, it may be useful to overviewsome of the major means and issues of testing students’ achieve-ment.28
Considerable research shows that frequent testing with essayquestions, short-answer, and multiple-choice tests leads to higherachievement because students prepare more frequently and regu-larly to be evaluated and because frequent tests provide more in-formation to both teachers and students about their strengths and
28. A forty-one-page booklet further explaining current testing policies isHerbert J. Walberg, Geneva D. Haertel, and Suzanne Gerlach-Downie, Assess-ment Reform: Challenges and Opportunities (Bloomington, Ind.: Phi DeltaKappa, 1994).
.......................... 8774$$ $CH3 09-10-01 10:07:17 PS

62 Herbert J. Walberg
weaknesses.29 Teachers may also observe and rate their students’performance in class. They may assign, for example, laboratoryexercises in science, physical measurements in geometry, and es-says in history and literature. Then they may judge or rate thequality of the resulting work. For additional assessment and feed-back, teachers may also check their students’ homework and eithergrade or comment on it. Such assessments may be termed teacher-aligned or integrated with instruction because they correspond tocontent of the immediate lessons being taught.
Standardized Tests
For several reasons, such teacher assessments do not serve well inlarge-scale surveys of achievement intended to provide informa-tion on how students, schools, districts, state, and even nationscompare with one another, how they compare with establishedstandards, or how achievement is changing over time. Tests in-tended for this purpose are ‘‘standardized’’ in that the conditionsand timing of the tests are nearly identical for all students. Manysports and the international Olympics employ similar standardizedconditions so that athletes’ performances can be fairly comparedno matter where they are and whatever the date of their perform-ances.
Standardized tests widely sample the subject matter. In this re-spect, they are like national voter and consumer surveys that sam-ple, say, a thousand people, to provide information on the entireadult population with a probable sample error of less than severalpercentage points.30 Sample surveys provide information quickly,
29. With a colleague, I compiled 275 effect sizes of frequent testing, home-work, mastery learning, direct instruction, and other educational methods andconditions. They serve as indicators of which methods and conditions have thelargest impacts on achievement. Along with costs and other considerations, sucheffects can serve as the basis of formulating policies likely to improve achieve-ment. See Herbert J. Walberg and Jin-Shei Lai, ‘‘Meta-Analytic Effects for Pol-icy,’’ in Gregory J. Cizek, ed., Handbook of Educational Policy (San Diego,Calif.: Academic Press), pp. 419–52.
30. This refers only to sampling error with respect to the time of the surveyand the question asked. If the questions differ or the times differ from the in-tended forecast, such surveys, of course, may be grossly inaccurate.
.......................... 8774$$ $CH3 09-10-01 10:07:18 PS

63Achievement in American Schools
efficiently, and cheaply. So, too, can thirty to sixty multiple-choicequestions about a broad subject constituted by thousands of factsand ideas.
Sample surveys differ from a census aimed at getting informa-tion from every single member of the population. Analogously,test designers usually cannot take an achievement census by askingall conceivable questions about a subject. So they may divide thesubject into various skills and areas of content, then sample withineach, just as survey designers employ stratified sampling, that is,sampling within cities, suburbs, and rural areas in the several geo-graphic regions of the nation.
Objective, Multiple-Choice Tests
So that aspects of the subject may be sampled in a short time,achievement surveys generally employ multiple-choice examina-tions. Thirty items may be administered in the amount of timerequired to answer a single essay question. Multiple-choice ques-tions afford a much larger sample of students’ knowledge andskills than do essay questions. They are also fairer to students be-cause their scores do not depend heavily and arbitrarily onwhether they happened to have concentrated or not on only onenarrow aspect of the subject.
Standardized tests are fairer in another sense: skilled essayistscan write impressively on many topics without really having mas-tered them. We may, of course, be interested in writing ability andrequire an essay to measure it, although multiple-choice tests caneven provide a quicker, more objective, and, some argue, moreaccurate estimate of writing ability.31
Other things being equal, essays in neat handwriting get better
31. A obstacle in measuring writing ability is getting agreement from expertson definitions, especially for anything that goes beyond the conventional mattersof spelling, grammar, and appropriate word usage. If there were greater consen-sus about cohesion, coherence, concision, organization, and elegance as compo-nents of style, graders and computers might more reliably and validly markessays. See Joseph M. Williams, Style: Ten Lessons in Clarity and Grace (Read-ing, Mass: Addison-Wesley, 2000).
.......................... 8774$$ $CH3 09-10-01 10:07:19 PS

64 Herbert J. Walberg
grades. Also, the same essay may be given wildly different marksby different graders or the same grader on two occasions. On theother hand, with perfect objectivity, machines can quickly andcheaply score thousands of multiple-choice tests and also producedetailed diagnostic reports on individual and group strengths andweaknesses.
A final reason that multiple-choice tests are preferred in large-scale achievement surveys is that ‘‘constructed response’’ tests re-quiring essays, laboratory equipment, calculators, and the likeusually add little information value to students’ scores on objectivetests. The score on the multiple-choice test often serves as a betterpredictor of an essay grader’s mark than another essay grader’smark of the same examination. So, for large-scale surveys, thelarge extra cost of essay examinations is usually unwarranted bythe marginal information they may provide (except, as pointed outabove, possibly when educators want to encourage and measureessay writing as separate from knowledge and skills in a subjectsuch as history, literature, or science).
Test Criticism
Defenders of the status quo often wrongly criticize multiple-choicetests as ‘‘multiple-guess tests.’’ On a test with four options peritem, we would, for example, expect students to guess about 25percent of the answers correctly if they knew nothing about thesubject. Guessing, however, can be taken into consideration inscoring, either by various guessing corrections or grading relativeto other students. In any case, this criticism is beside the pointsince standardized test scores are rarely reported as the percentageof items correct.
Some critics attack multiple-choice tests for measuring recogni-tion rather than recall or construction of the right answer. Newobjective test formats allow answer-sheet recording of recalled orconstructed answers that may be objectively machine scored. Inany case, recognition, recall, and construction are usually veryhighly correlated. It may be impossible to find someone who cancorrectly recognize the facts in a subject such as biology or history
.......................... 8774$$ $CH3 09-10-01 10:07:20 PS

65Achievement in American Schools
but can neither recall any nor reason about them. An old colleagueof mine once asked Einstein’s collaborator, who disliked objectivetests, to find the student among a national sample of several hun-dred who had best answered a high school physics problem set. Itturned out that that student had also attained the highest score onthe objective test of physics knowledge and skills.
Little wonder that even our oldest professions such as law andmedicine employ multiple-choice tests for admission and certifica-tion, as do graduate colleges and MBA programs for admissiondecisions. If these demanding fields employ multiple-choice tests,to what do schools aspire that cannot be similarly measured?32
Promising Solutions for Raising Achievement
For the reasons stated above, politicians, businesspeople, citizens,and parents are greatly concerned about the inefficiency of thepublic schools and their threat to the economy and society. Manybusiness leaders describe their problems in getting competentworkers, capable of reading, calculating, and learning new mate-rial.
The crisis is most acute in technology, an important growth areaof the economy. The Information Technology Association ofAmerica reported that 1.6 million new information workers wouldbe needed by the end of the year 2000 but that 850,000 positionswill go unfilled. According to its survey, technical-support repre-sentatives, database developers, and programmers are the threepositions in greatest demand.33
Achievement Standards
In response to the continuing education crisis, legislators are set-ting forth two kinds of accountability, both employing achieve-
32. Many examples of multiple-choice items that measure both knowledgeand ‘‘higher order cognitive skills’’ can be found in textbooks on testing such asAnthony Nitko’s Educational Assessment of Students (Englewood Cliffs, N.J.:Prentice-Hall, 1996).
33. Rachel Emma Silverman, ‘‘Employers Face Dearth of IT Workers as De-mand Exceeds Supply, Data Shows,’’ Wall Street Journal, April 10, 2000, p. A1.
.......................... 8774$$ $CH3 09-10-01 10:07:21 PS

66 Herbert J. Walberg
ment tests to measure results. The first is more rigorous statestandards with achievement tests as indicators of success and fail-ure. Students who cannot meet these standards may be retained ingrade or fail to graduate from high school. Schools with suffi-ciently high failure rates risk being closed. States are phasing inthese standards and giving schools some time to gear curricula andinstruction to the standards. Because the effects of poverty andother factors are difficult to overcome, it would also seem wiseto use value-added achievement scores in any index of a school’ssuccess, at least for a time.
Such ‘‘high-stakes’’ achievement test schemes, however, arehardly foolproof. The tests may be technically flawed. The stan-dards may be arbitrarily high or low. Test security may bebreached. Schools may teach narrowly to the tests or only to thetypes of content or problems known to be tested; they may ignoreother worthy education goals. Better design and administration oftesting programs can overcome these problems but may requiresteadfastness, money, and experience.
School Choice
The second form of accountability makes schools more directlyaccountable to parents rather than school boards who may notrepresent citizens and parents well or have management skills tohold educators accountable. Among the variations of this form arecharter schools that give private boards public funds to educatestudents that come to them. In another form, scholarships aregiven directly to parents, who may spend them at parochial, inde-pendent, and for-profit schools of their choice. Charter schoolsand scholarships provide a greater diversity of curricula, ap-proaches to education, and means of instruction. They also pro-vide for greater competition among providers and choice forcustomers, that is, parents, children, and youth.
The ideals of choice and competition have led to wondrous re-sults for consumers in nearly all other sectors of the economy inthe United States and elsewhere. Since funds for charter schoolsand public scholarships come from public sources, it is reasonable,
.......................... 8774$$ $CH3 09-10-01 10:07:21 PS

67Achievement in American Schools
perhaps even necessary during the experimental period of, say, thenext five years, to employ achievement tests to measure their prog-ress.
Legislatures or their appointed commissions might insist that, tocontinue, charter schools and schools that receive publicly fundedscholarship students meet a minimum level of standards as mea-sured by independently designed achievement tests. So as to avoidthe deadening hand of government regulation, the standard mightbe the average achievement test scores of public schools in the statein the usual school subjects plus knowledge of the Declaration ofIndependence, the U.S. Constitution, and important state docu-ments.
Alternatively, the marketplace provides the ultimate account-ability to customers. Unhappy ones can walk away. They canavoid providers of goods and services that make them dissatisfied.For this reason, charter and scholarship schools might only be re-quired to engage in state-mandated testing for a limited period—say, five years—until their worth is clearly demonstrated inachieved results.
CONCLUSION
Despite huge amounts of research over many years on what bestpromotes learning, American schools lurch from fad to fad. Theyfail to make evidence the basis of practice in the manner of busi-ness, medicine, agriculture, law, and other fields. As a conse-quence, American schools produce the worst achievement resultsat the third-highest expenditures among economically advancedcountries. Achievement scores have remained stagnant, moreover,despite substantially rising expenditures, rising children’s abilities,and many reforms. Substantial amounts of money for special pro-grams, more than $120 billion, have failed to reduce the achieve-ment gap between poor and middle-class children. The schoolsfail to employ new technologies for learning or even to employtraditional technologies well. Current demands for standards, ac-countability, incentives, and choice described briefly in this chapterand at length in the other chapters are clearly warranted.
.......................... 8774$$ $CH3 09-10-01 10:07:22 PS