achieving a resilient and agile grid - america's electric ... · achieving a resilient and...
TRANSCRIPT

Achieving a Resilient and Agile Grid By Craig Miller, Maurice Martin, David Pinney, and George Walker
Version 1.0
April 30, 2014

The National Rural Electric Cooperative Association The National Rural Electric Cooperative Association (NRECA), founded in 1942, is the national service organization supporting more than 900 electric cooperatives and public power districts in 47 states. Electric cooperatives own and operate more than 42 percent of the distribution lines in the nation and provide power to 40 million people (12 percent of the population). NRECA’s Cooperative Research Network (CRN) harnesses research and development to benefit its electric co-op members in four key ways: • Improve productivity, • Control costs, • Increase service excellence, and • Keep pace with emerging technologies. CRN strives to deliver new products and services best suited to the particular needs of electric co-ops. CRN communicates with its members through its Web site (www.cooperative.com/crn), online and printed reports, newsletters, Web conferences, and seminars. In addition, CRN staff present at several annual events, including NRECA’s TechAdvantage Conference & Expo, the NRECA/Touchstone Energy “Connect” marketing conference, and Touchstone Energy’s New & Emerging Technologies (NET) Conference. For more information about these events and CRN’s participation, visit the Conferences & Training section of www.cooperative.com. For questions about CRN, call 703.907.5843. Achieving a Resilient and Agile Grid © 2014 National Rural Electric Cooperative Association. Reproduction in whole or in part strictly prohibited without prior written approval of the National Rural Electric Cooperative Association, except that reasonable portions may be reproduced or quoted as part of a review or other story about this publication. Legal Notice This work contains findings that are general in nature. Readers are reminded to perform due diligence in applying these findings to their specific needs as it is not possible for NRECA to have sufficient understanding of any specific situation to ensure applicability of the findings in all cases. Neither the authors nor NRECA assume liability for how readers may use, interpret, or apply the information, analysis, templates, and guidance herein or with respect to the use of, or damages resulting from the use of, any information, apparatus, method, or process contained herein. In addition, the authors and NRECA make no warranty or representation that the use of these contents does not infringe on privately held rights. This work product constitutes the intellectual property of NRECA and its suppliers, as the case may be, and contains confidential information. As such, this work product must be handled in accordance with the CRN Policy Statement on Confidential Information. Questions Maurice Martin, CRN Program Manager [email protected]
1
Achieving a Resilient and Agile Grid
The electrical grid of the United States is an amazing engineering achievement; perhaps the pinnacle of engineering. In a recent book, the National Academy of Engineering named electrification as the greatest single achievement of the 20th century.1 Ernest Moniz, the Secretary of Energy, recently described the grid as “a continent-spanning machine, of immense complexity, which is at its best when it is invisible.”2
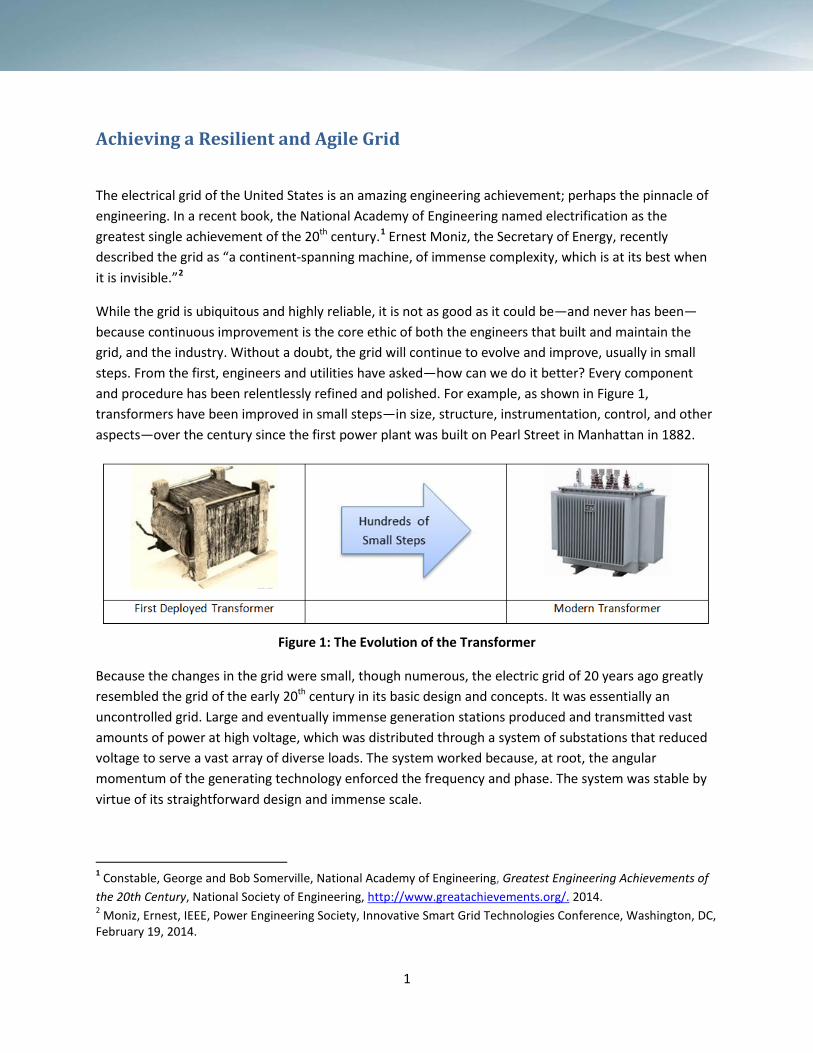
While the grid is ubiquitous and highly reliable, it is not as good as it could be—and never has been—because continuous improvement is the core ethic of both the engineers that built and maintain the grid, and the industry. Without a doubt, the grid will continue to evolve and improve, usually in small steps. From the first, engineers and utilities have asked—how can we do it better? Every component and procedure has been relentlessly refined and polished. For example, as shown in Figure 1, transformers have been improved in small steps—in size, structure, instrumentation, control, and other aspects—over the century since the first power plant was built on Pearl Street in Manhattan in 1882.
Figure 1: The Evolution of the Transformer
Because the changes in the grid were small, though numerous, the electric grid of 20 years ago greatly resembled the grid of the early 20th century in its basic design and concepts. It was essentially an uncontrolled grid. Large and eventually immense generation stations produced and transmitted vast amounts of power at high voltage, which was distributed through a system of substations that reduced voltage to serve a vast array of diverse loads. The system worked because, at root, the angular momentum of the generating technology enforced the frequency and phase. The system was stable by virtue of its straightforward design and immense scale.
1 Constable, George and Bob Somerville, National Academy of Engineering, Greatest Engineering Achievements of the 20th Century, National Society of Engineering, http://www.greatachievements.org/. 2014. 2 Moniz, Ernest, IEEE, Power Engineering Society, Innovative Smart Grid Technologies Conference, Washington, DC, February 19, 2014.

2
Beginning in the 1970s, a new technology began to enter electrical operations. The development of powerful and increasingly less costly computing technology and then network technology opened the door to control of grid components.3 Initially, these controls simply automated the manual processes common in the purely electro-mechanical grid. Over time, however, the grid has evolved to more truly automated controls and some elements of automated decision making. This evolution will continue as the truly smart grid is constructed.
The potential to develop a controlled, actively managed grid is coming at a fortunate time. The rapid and accelerating deployment of distributed and especially renewable technology is challenging the operation of the grid at the edge. Locally, power from these sources can challenge the power of the integrated grid and lead to problems with voltage, phase, and angle. Many futurists envision a grid built of smaller, independent or quasi- independent generating entities such as microgrids. This “grid of grids” is not a better model than an integrated grid everywhere and at all times, but there is no doubt that the integration of locally more autonomous generating units is a real and growing problem. Also, there are some advantages to having access to and control of distributed generating resources. Advanced control technology, and particularly next-generation power electronics, will be very useful in first accommodating and then taking advantage of emergent approaches to distributed generation, storage, and load control.
The grid is changing in response to new requirements, and also in response to the increasing potential of advanced sensors, controls, and analytics. This paper looks at what a potential future grid could achieve and the technologies that could make such achievements possible. There are many other papers available on the future grid. Some of these extrapolate from current and emerging technology, focusing on what changes are likely to be achieved in the future. In other words, these papers speculate about what the grid is likely to look like in the coming years, not on what is ultimately possible. This represents a missed opportunity. Change is necessary, and there is now an explosive growth in the tools that will allow us to manage the grid with more agility and precision. Rather than focusing on the simple, the near term, and the readily achieved, we should spend some time thinking about what we would like the grid to look like to drive R&D and allow us to achieve more than we would through simple evolution.
We must be realistic, however, and dream with an understanding of what is possible. Our speculation must be rooted in a real understanding of the direction and limits of the root control, information, and power electronics technology, and the formidable challenge of changing a “continent-spanning machine of immense complexity.”
3 Technically, the first remotely controlled technology for the grid was telephonic switch control in 1932, offered by Automatic Electric. This telephonic control technology was developed by others (most notably Westinghouse), into the 1970s, but this pre-computer, analog technology offered only an incremental improvement in grid control.

3
Reflecting this dichotomy—the need for vision and the need for grounding—this paper has two parts. The first paints a picture of how the grid should work. The second discusses the challenges in realizing the agile grid and how they can be overcome. At this point, the “solution” is high level. The devil, of course, is in the endless details.
My hope for this paper is not to propose the answer, but to advance a discussion among a community of smart people. The best leader I ever met had a motto: “All of us are smarter than any of us.”
4
Part 1 Concepts for the Future Grid –
Reliable and Agile
5
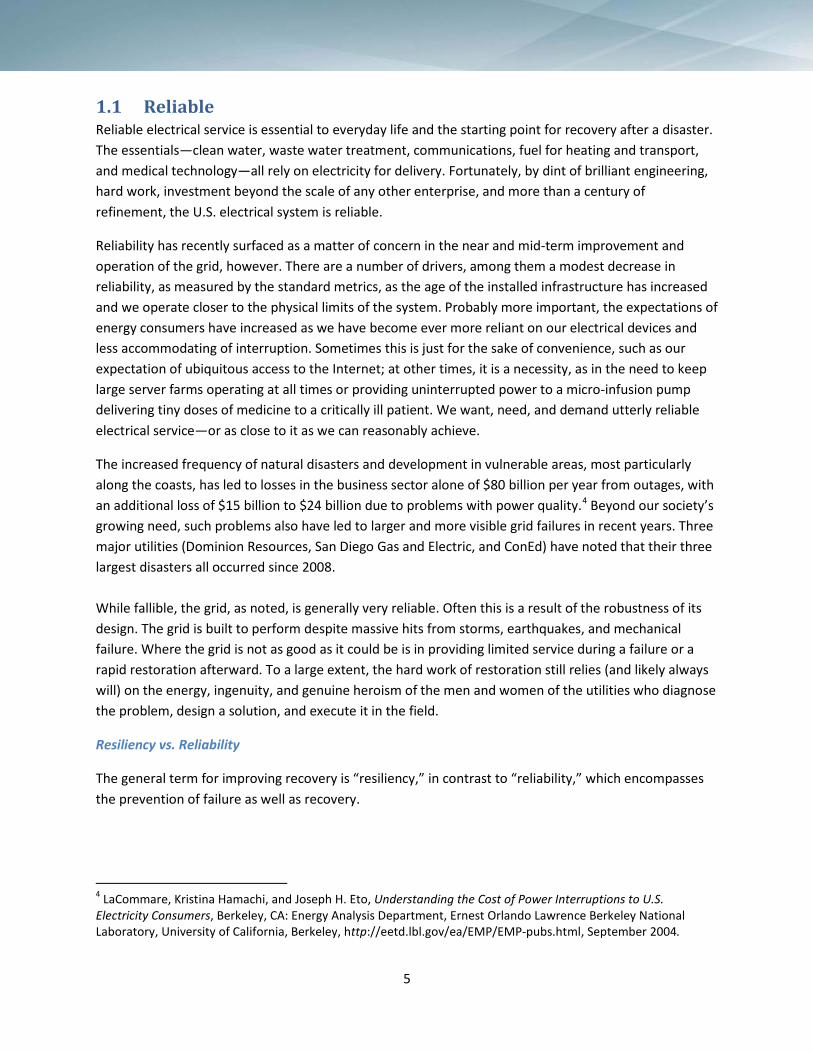
1.1 Reliable Reliable electrical service is essential to everyday life and the starting point for recovery after a disaster. The essentials—clean water, waste water treatment, communications, fuel for heating and transport, and medical technology—all rely on electricity for delivery. Fortunately, by dint of brilliant engineering, hard work, investment beyond the scale of any other enterprise, and more than a century of refinement, the U.S. electrical system is reliable.
Reliability has recently surfaced as a matter of concern in the near and mid-term improvement and operation of the grid, however. There are a number of drivers, among them a modest decrease in reliability, as measured by the standard metrics, as the age of the installed infrastructure has increased and we operate closer to the physical limits of the system. Probably more important, the expectations of energy consumers have increased as we have become ever more reliant on our electrical devices and less accommodating of interruption. Sometimes this is just for the sake of convenience, such as our expectation of ubiquitous access to the Internet; at other times, it is a necessity, as in the need to keep large server farms operating at all times or providing uninterrupted power to a micro-infusion pump delivering tiny doses of medicine to a critically ill patient. We want, need, and demand utterly reliable electrical service—or as close to it as we can reasonably achieve.
The increased frequency of natural disasters and development in vulnerable areas, most particularly along the coasts, has led to losses in the business sector alone of $80 billion per year from outages, with an additional loss of $15 billion to $24 billion due to problems with power quality.4 Beyond our society’s growing need, such problems also have led to larger and more visible grid failures in recent years. Three major utilities (Dominion Resources, San Diego Gas and Electric, and ConEd) have noted that their three largest disasters all occurred since 2008. While fallible, the grid, as noted, is generally very reliable. Often this is a result of the robustness of its design. The grid is built to perform despite massive hits from storms, earthquakes, and mechanical failure. Where the grid is not as good as it could be is in providing limited service during a failure or a rapid restoration afterward. To a large extent, the hard work of restoration still relies (and likely always will) on the energy, ingenuity, and genuine heroism of the men and women of the utilities who diagnose the problem, design a solution, and execute it in the field.
Resiliency vs. Reliability
The general term for improving recovery is “resiliency,” in contrast to “reliability,” which encompasses the prevention of failure as well as recovery.
4 LaCommare, Kristina Hamachi, and Joseph H. Eto, Understanding the Cost of Power Interruptions to U.S. Electricity Consumers, Berkeley, CA: Energy Analysis Department, Ernest Orlando Lawrence Berkeley National Laboratory, University of California, Berkeley, http://eetd.lbl.gov/ea/EMP/EMP-pubs.html, September 2004.

6
Two Sides to Resiliency
There are two basic aspects to resiliency—the human/process and the electrical/electronic. The human/process side addresses the marshaling and deployment of skilled crews and material to plan and execute the vast array of actions needed to restore power to devastated areas. It is a common practice in the utility industry to provide “mutual assistance,” sending skilled work crews from intact utilities to an affected one. This sharing of crews is essential, since electrical work is a specialized skill and cannot be delegated either to unskilled labor or skilled labor from other trades. The technology of the grid is not commonly understood, and working on power lines is genuinely dangerous. Simply dispatching a crew, however, is not enough. The crew needs to be transported, licensed, housed, fed, and deployed effectively. None of these is easy in an area leveled by a hurricane or tornado.
The other side of resiliency is the electrical/electronic. The question here is what the grid itself can do, or be made to do, to provide a higher level of limited service during an outage and accelerate a restoration. This question is the focus of this essay. What is addressed here is how information and advanced distribution automation technology can help to improve the recovery from faults.
1.2 A Tale of Two Feeders
Before delving into the problem of the actual engineering and mathematics of how to build a more resilient grid, this section illustrates how a resilient grid might operate if the requisite algorithms, control, and feeder automation were fully developed and deployed. The realization of this example will take considerable time, effort, and innovation.
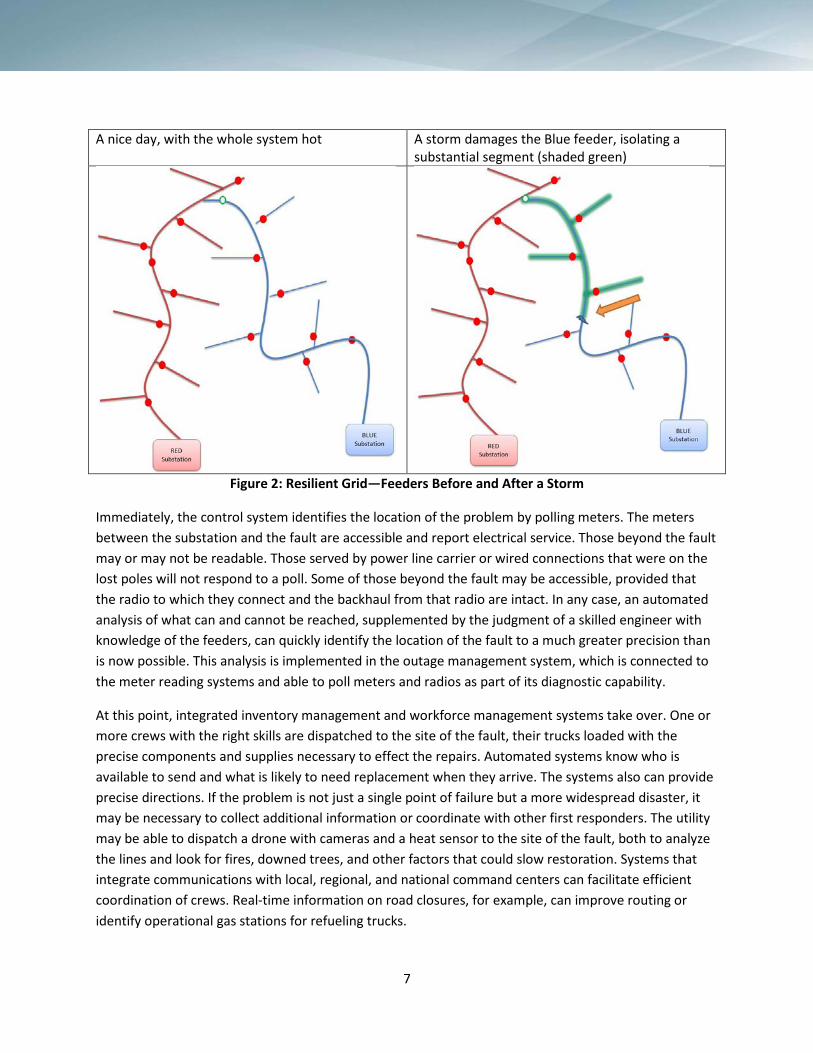
Imagine that it’s a beautiful day at our imaginary utility and everything is operating normally. We’re looking at two feeders, labeled red and blue in Figure 2, both of which are “hot.” All of the lines are shaded red, showing that they are hot and operating at a normal voltage. Switches on the feeders appear as circles, filled if the switch is closed and not filled if it is open. The two feeders are connected at the point marked with a green circle, but the switch is open, so the two feeders are operating independently.
Late in the afternoon, a bad storm comes through; it includes lightning and a localized tornado, which severs the Blue feed, tearing out several poles. Power is immediately dropped to a long section of the Blue feeder, as shown by the green shading. Most of the customers in this area are small commercial and residential accounts that certainly will be inconvenienced by the loss of power but can manage without lasting damage or impact beyond their own premises.
7
A nice day, with the whole system hot A storm damages the Blue feeder, isolating a substantial segment (shaded green)
Figure 2: Resilient Grid—Feeders Before and After a Storm
Immediately, the control system identifies the location of the problem by polling meters. The meters between the substation and the fault are accessible and report electrical service. Those beyond the fault may or may not be readable. Those served by power line carrier or wired connections that were on the lost poles will not respond to a poll. Some of those beyond the fault may be accessible, provided that the radio to which they connect and the backhaul from that radio are intact. In any case, an automated analysis of what can and cannot be reached, supplemented by the judgment of a skilled engineer with knowledge of the feeders, can quickly identify the location of the fault to a much greater precision than is now possible. This analysis is implemented in the outage management system, which is connected to the meter reading systems and able to poll meters and radios as part of its diagnostic capability.
At this point, integrated inventory management and workforce management systems take over. One or more crews with the right skills are dispatched to the site of the fault, their trucks loaded with the precise components and supplies necessary to effect the repairs. Automated systems know who is available to send and what is likely to need replacement when they arrive. The systems also can provide precise directions. If the problem is not just a single point of failure but a more widespread disaster, it may be necessary to collect additional information or coordinate with other first responders. The utility may be able to dispatch a drone with cameras and a heat sensor to the site of the fault, both to analyze the lines and look for fires, downed trees, and other factors that could slow restoration. Systems that integrate communications with local, regional, and national command centers can facilitate efficient coordination of crews. Real-time information on road closures, for example, can improve routing or identify operational gas stations for refueling trucks.
8
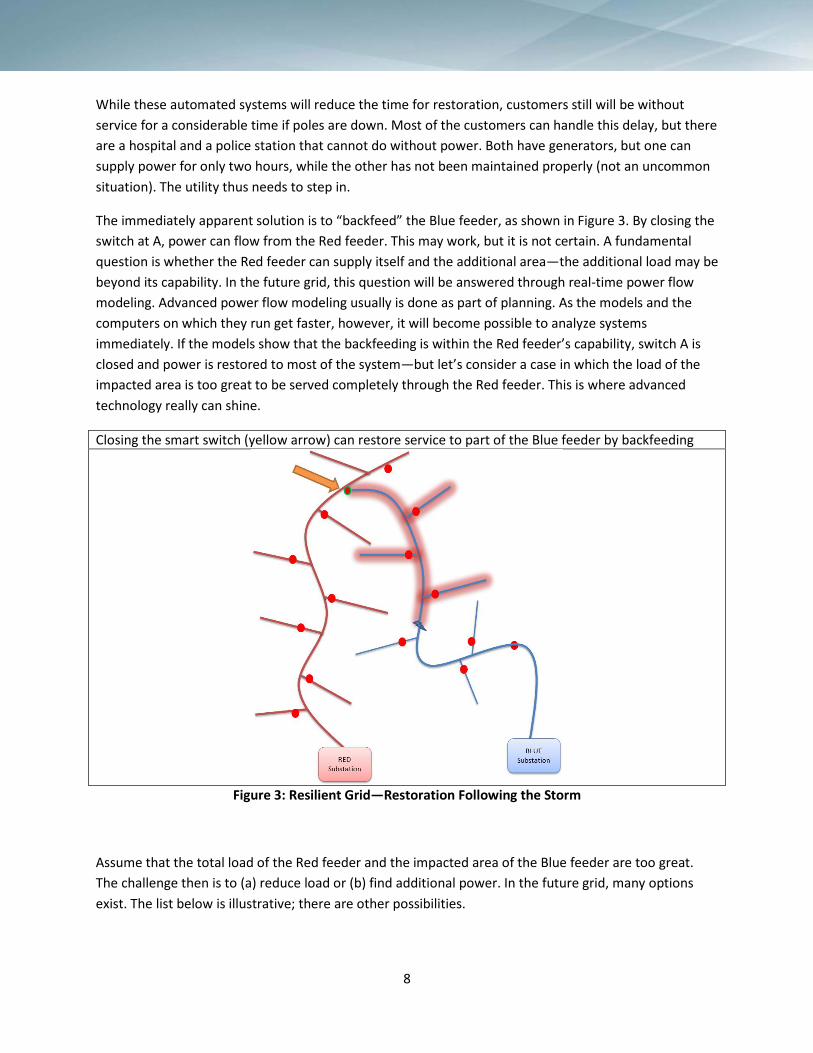
While these automated systems will reduce the time for restoration, customers still will be without service for a considerable time if poles are down. Most of the customers can handle this delay, but there are a hospital and a police station that cannot do without power. Both have generators, but one can supply power for only two hours, while the other has not been maintained properly (not an uncommon situation). The utility thus needs to step in.
The immediately apparent solution is to “backfeed” the Blue feeder, as shown in Figure 3. By closing the switch at A, power can flow from the Red feeder. This may work, but it is not certain. A fundamental question is whether the Red feeder can supply itself and the additional area—the additional load may be beyond its capability. In the future grid, this question will be answered through real-time power flow modeling. Advanced power flow modeling usually is done as part of planning. As the models and the computers on which they run get faster, however, it will become possible to analyze systems immediately. If the models show that the backfeeding is within the Red feeder’s capability, switch A is closed and power is restored to most of the system—but let’s consider a case in which the load of the impacted area is too great to be served completely through the Red feeder. This is where advanced technology really can shine.
Closing the smart switch (yellow arrow) can restore service to part of the Blue feeder by backfeeding
Figure 3: Resilient Grid—Restoration Following the Storm
Assume that the total load of the Red feeder and the impacted area of the Blue feeder are too great. The challenge then is to (a) reduce load or (b) find additional power. In the future grid, many options exist. The list below is illustrative; there are other possibilities.

9
(1) Use sectionalizing switches to drop services temporarily to portions of the feeder. This could be done in certain parts of the Blue feeder or the impacted area, but would not cut power to the hospital and police station. Presumably, the curtailment of service could be rotated among different materials if the outage persists, and the utility web site could publish the curtailment schedule in advance so that customers can understand what is going on and plan accordingly. In every case, the high-performance power flow modeling capability can be used to analyze the impact of each action before it is implemented to be sure that the grid is not damaged. Automated systems that know where the crews are working also could ascertain that no lines are energized in these areas; the systems then could be integrated with the line crews’ computer to require formal confirmation that the lines are safe before any power is turned on.
(2) Do not provide service to customers with backup generators. Customers with such generators can have their service interrupted, either as a group or on a rotating basis. Contractual arrangements can be made in advance.
(3) With appropriate advanced engineering in place, use some backup generators to power either a local or temporary microgrid.
(4) Use renewables to provide additional power to the combined Red feeder and backfeed portion of the Blue feeder.
(5) If needed, use smart meter disconnect capabilities to cut off individual customers on a rotating basis.
(6) Use a combination of technologies (capacitor banks, conventional voltage regulators, and emerging solid state devices for VAR control) to lower the voltage across the system dynamically.
No utility has the flexibility to do all of these, but most have one or more of the listed control options. Over time, more capabilities will be added as utilities take greater advantage of emerging smart grid technology.

10
1.3 Agile
The previous section introduced the concept of an agile, managed grid that can be reconfigured to provide better service under fault conditions, quicker restoration, and more efficient operation under normal conditions. Building a system with all of the controls envisioned in “A Tale of Two Feeders” would be a huge technical leap at this point,5 but nothing it describes is physically impossible or requires any fundamental engineering breakthroughs. Realization is an admittedly challenging exercise in integration and refinement.
The vision is easy. The problem, of course, is that no utility can operate as envisioned. The challenge of building such an agile grid is not insurmountable, however. Its realization rests on three core functions.
Figure 4: Core Functions for Building the Agile Grid
The agile grid depends on (1) knowing the precise state of the grid (configuration and immediate state); (2) advanced analytics to derive control strategy from the state data and forecasts; and (3) controls, such as reclosers, VAR control, and disconnect-capable meters.
Work needs to be done to improve the state of the art in each of these areas and to integrate the functions. Many companies are developing advanced switching and power electronics in the “Precise Controls” function. We are on the cusp of the integration of solid state power electronics6 into grid operations. This will allow agile Volt/VAR control. Using more conventional technology, utilities are developing multiple techniques for conservation voltage reduction. Smart feeder switching, automated load tap changers, meters with disconnect capability, and other smart controls have become a routine part of smart grid deployment, gradually increasing the ability of utilities to control and tune electrical flows. Most significantly, distributed generation is exploding, both globally and in the U.S., from both renewable and fossil sources, as shown in Figure 5 below. Distributed generation, in conjunction with advanced grid control and power electronics, is laying the technical foundation for the agile grid.
5 One co-op commentator described the idea as “fantastical”—and not in a good way. 6 Kanellos, Michael, Next for the Grid: Solid State Transformers, Online article, Greentechmedia, http://www.greentechmedia.com/articles/read/next-for-the-grid-solid-state-transformers, March 15, 2011.
Advanced Analytics
Precise
Knowledge of State of Grid
Precise
Controls

11
Part 2 Eleven R&D Efforts for Achieving the
Next-Generation Grid
12
As stated above, nothing described in the vision for the next-generation grid is impossible. While no fundamental engineering breakthroughs are required, research and development will be needed in certain engineering domains.
This section lists and explains 11 essential R&D efforts needed to achieve the next-generation grid:
1. Distributed Generation 2. Microgrids 3. Segmentability, Agile Control 4. Fractal Construction 5. An Internet You Can Trust 6. Advanced VAR Control and Solid State Power Electronics 7. Advanced Architecture 8. Improving Standards 9. Real Big Data Capabilities 10. High-Performance Communications 11. Advanced Analytics
2.1 Distributed Generation
Smart grid technology, declining costs of renewable and distributed generation, cheap high-power computing, and lower-cost high-bandwidth communications are making analytically driven and agile control of the grid technologically possible. Technical feasibility is not enough for realization, however; there must be a driver. In this case, there are three:
1) Growing interest in renewable and distributed energy 2) Interest in improving resiliency in the wake of disasters 3) Public resistance to large projects for generation and transmission
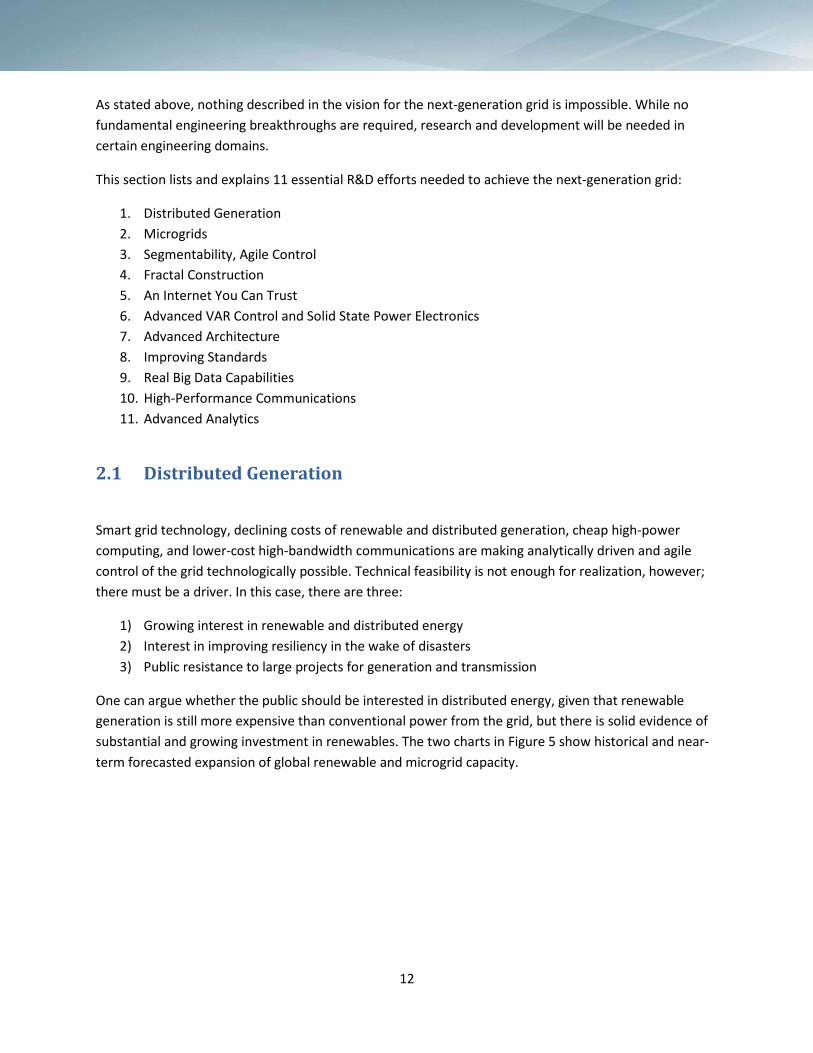
One can argue whether the public should be interested in distributed energy, given that renewable generation is still more expensive than conventional power from the grid, but there is solid evidence of substantial and growing investment in renewables. The two charts in Figure 5 show historical and near-term forecasted expansion of global renewable and microgrid capacity.
13
Global Renewable Capacity (2009–2015)
Figure 5: Global Renewable and Microgrid Capacity. Source: Pike Research
In relation to global capacity, all of these are small numbers. China, for example, installed about 50,000 MW of new coal plants in 2012 alone.7 However, global renewable capacity has sustained a compound annual growth rate of 19% for six years, with no sign of slowing (see Figure 6); that high rate of growth, compounded over a longer period, can make renewables an important factor in global capacity.
This growth demands some accommodation. The injection of power at the edge of the grid, at a highly variable rate outside of utility control, presents a challenging technical problem that cannot be addressed without substantial investments in upgrades to the grid involving traditional and emerging 7 Yang, Ailun, World Resources Institute, October 17, 2013.

14
smart grid technology. The question is not whether new investment is needed; rather, it is whether that investment should be based on the conventional, hierarchical design paradigm or should incorporate principles that allow segmented operation.
Figure 6: U.S. PV Installation Forecast.
Source: National Renewable Energy Laboratory, 2013 Global Status Report

15
2.2 Microgrids The agile grid, as envisioned above, can be viewed as a collection of microgrids that can work independently or in an integrated way, though it was presented above as more hierarchical. The true smart grid, however, would be difficult to achieve using the integrated microgrids as the starting point. Microgrids are developed independently; there are no overall standards, or even widely accepted principles, for how microgrids should be constructed and operated. The integration of disparate microgrids on an individual basis would be a complicated and expensive exercise, with considerable technical and cyber risk due to the custom electrical and communications work and software.
There is substantial and growing interest in microgrids for several reasons (for one, the compound annual growth rate of microgrids in the U.S. over the next decade is expected to be almost 13%), but there has been much less work in microgrid integration and coordination, except at the individual project level. The focus has been primarily on the generation aspect, coupled with some distribution technology, to supply a local area, rather than on making the microgrid an asset to the broader grid as a source of power and control. Microgrids can play an important role as a transitional stage to the agile grid and a continuing role in the operation of the fully built-out version.
Current microgrids generally are focused on the needs of the developer—often military, institutional, or large industrial—rather than on the grids’ needs, leading to a technical emphasis on generation rather than control and integration. The agile grid will require a shift in the development of microgrids from a developer and generation focus to one in which the broader grid’s interest is an equal factor, recognizing that a robust, shared agile grid is in everyone’s interest. Even without this refocus, microgrids have to be considered as a major factor in the next generation of the grid.
Utilities and the government are looking to microgrids to improve the resiliency of the grid. Segmentation of the grid into smaller operating units limits the impact of equipment-related, weather-related, or other failures. Microgrids also provide for a more agile approach to restoration and maintenance of reduced service during the period after grid failures. In addition, microgrids are of interest to utilities because of the simple fact that so many are being built by current utility customers. They a are growing reality that must be addressed, not just as small, detached grids, but as part of an integrated and more reliable whole.
Three scenarios are modeled in the graph below —a high penetration case, a low penetration case, and a medium case, termed “base.” The factors that influence the rate of penetration include, among others, subsidies for renewable power, trends in the cost of renewable generation, governmental investment in grid resiliency, or more rapid improvement in the technology for microgrid integration.

16
Figure 7: Microgrids Are Projected to Proliferate Rapidly, with the U.S. in the Lead
Microgrids must be considered in utility planning both because they are a reality and potentially useful. There are two issues—constructing a microgrid and controlling it in a way so it can operate in conjunction with the broader grid. Of these two issues, the second is by far the more interesting. Building a microgrid is not, by any means, a simple task, but many organizations are building microgrids, testing designs and equipment, and sharing their experiences. Many of them are being built by the military, and these projects are documented and published. Many engineering firms are offering microgrid design services, and a number of companies are beginning to develop microgrids with commercial partners, such as colleges, thus adding capital and engineering experience. Building microgrids is no longer a new challenge—it is becoming routine.

17
In the plenary of the 2014 IEEE PES Innovative Smart Grid Technologies Conference, Lee Krevat, the Director of Smart Grid Initiatives for San Diego Gas and Electric (SDGE), said “We know that the grid of the future is a collection of federated microgrids.” SDGE is not literally thinking that the central utility will disappear, but that the grid will be an aggregation of control areas capable of both independent and integrated operation. In a prior white paper (“Towards an Agile Grid”), I presented a highly speculative and general model of how the grid could segment into smaller operating units in response to stress and reassemble into an integrated grid. This vision is not realizable at present, but there are no insurmountable technical barriers that cannot be addressed through diligent engineering and incremental development. The concept is reprised, below.
The root problem is the control of the microgrid, not the generation. Distributed generation, without the ability to island and control multiple assets (distribution, load, storage, etc.), does not constitute a microgrid. A microgrid is, at root, not entirely about the generator, but about the control systems. An enormous amount of work has gone into the technology of distributed generation. Substantially less work has been done on the coordination of control systems.
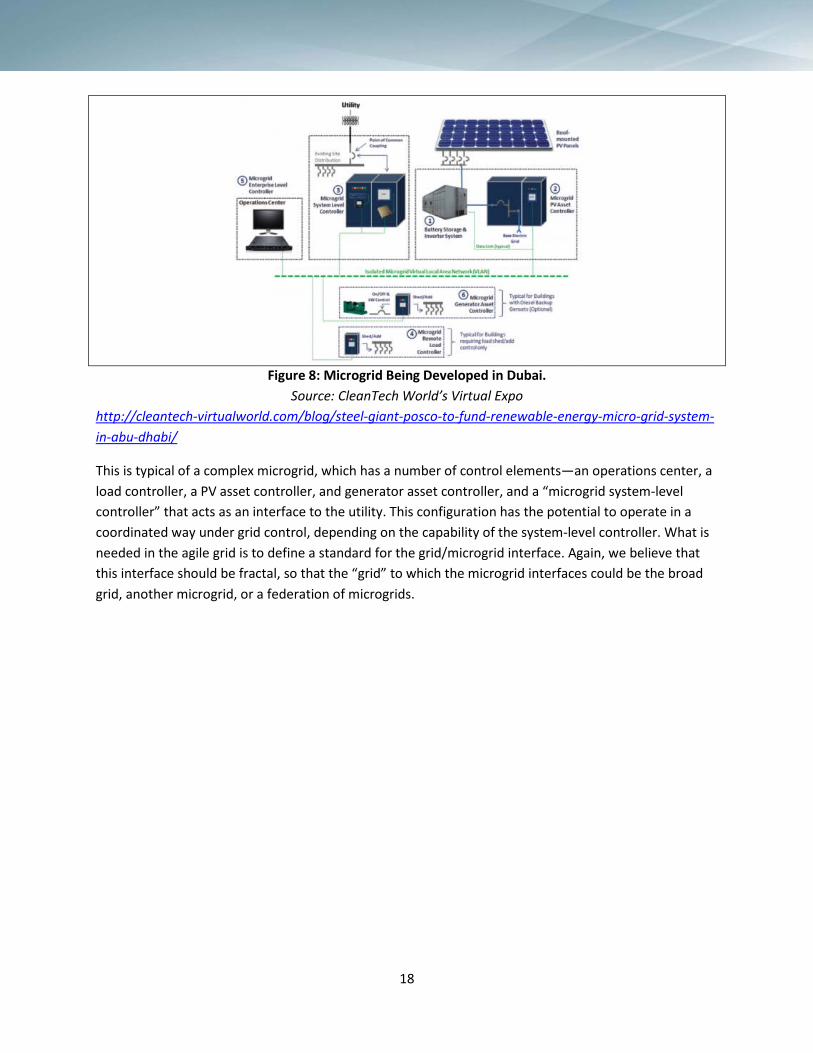
A general picture of a smart grid is shown below in Figure 8. The system pictured has a number of control units, including a small operations center, an interface to the utility, a PV asset controller, and load control technology at the microgrid and premises levels. Effectively, this is a picture of a small grid—a fully realized, manageable microgrid. Engineering this grid is not simple but, as noted previously, many examples can be drawn from engineering companies that are developing and refining their capabilities. Substantially less work has been done on the development of the control systems for a federated grid. The basic control model for a utility is that of a single, hierarchical control system. Current systems do not allow for deep integration and coordinated operation of independent control systems. Stripped of the “fractal” buzzword, the concept is that the control systems at different scales should have the same architecture, so that standard methods for integration can be developed.
18
Figure 8: Microgrid Being Developed in Dubai.
Source: CleanTech World’s Virtual Expo http://cleantech-virtualworld.com/blog/steel-giant-posco-to-fund-renewable-energy-micro-grid-system-in-abu-dhabi/
This is typical of a complex microgrid, which has a number of control elements—an operations center, a load controller, a PV asset controller, and generator asset controller, and a “microgrid system-level controller” that acts as an interface to the utility. This configuration has the potential to operate in a coordinated way under grid control, depending on the capability of the system-level controller. What is needed in the agile grid is to define a standard for the grid/microgrid interface. Again, we believe that this interface should be fractal, so that the “grid” to which the microgrid interfaces could be the broad grid, another microgrid, or a federation of microgrids.
19
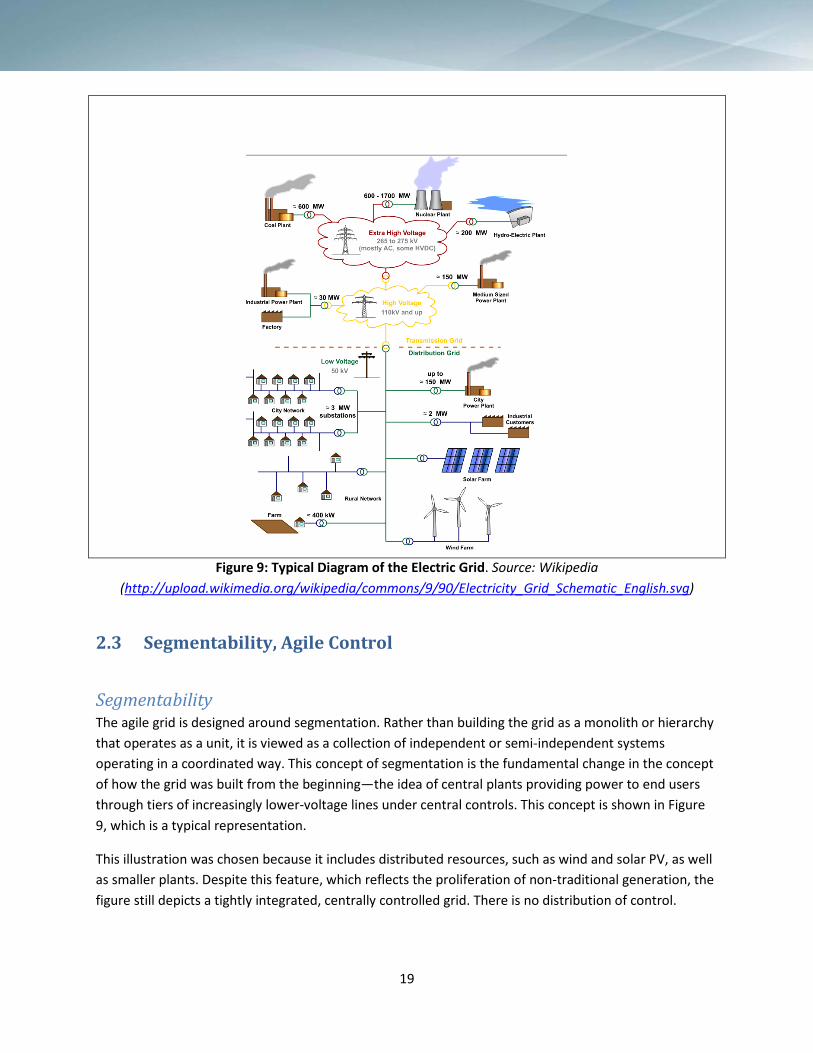
Figure 9: Typical Diagram of the Electric Grid. Source: Wikipedia
(http://upload.wikimedia.org/wikipedia/commons/9/90/Electricity_Grid_Schematic_English.svg)
2.3 Segmentability, Agile Control
Segmentability The agile grid is designed around segmentation. Rather than building the grid as a monolith or hierarchy that operates as a unit, it is viewed as a collection of independent or semi-independent systems operating in a coordinated way. This concept of segmentation is the fundamental change in the concept of how the grid was built from the beginning—the idea of central plants providing power to end users through tiers of increasingly lower-voltage lines under central controls. This concept is shown in Figure 9, which is a typical representation.
This illustration was chosen because it includes distributed resources, such as wind and solar PV, as well as smaller plants. Despite this feature, which reflects the proliferation of non-traditional generation, the figure still depicts a tightly integrated, centrally controlled grid. There is no distribution of control.

20
Over time, we can see the grid taking on a different nature—one in which the central utility will account for a lower fraction of the total generation and yield some measure of control. Consider this actual scenario: a large ranch in Texas raises livestock and, of course, accumulates very large quantities of manure. Its owners use this manure to create methane, which powers a generator that provides a fraction of the ranch’s power requirements. Usually, the power generated is sufficient to allow the ranch to deliver power back to the grid, so the cooperative can view the ranch as a generator. It is an ill-controlled and relatively unreliable generator, however. Several times a year, the ranch ships a large number of market-ready cattle, at which time the manure supply naturally drops and the ranch becomes a power consumer, albeit and fortunately, not at a full level of consumption. Accommodation of such a substantial source/load is problematic for the central utility, and the challenge is made much more difficult by that lack of utility control—the ranch, appropriately, decides when to ship cattle, and there is no obligation to coordinate with or even inform the co-op.
A segmented grid topology may look like the one depicted in Figure 10. In this example, the lower-voltage (50kW) portion of the hierarchical grid shown previously is replicated several times. While all of these would be designed to operate autonomously, they also would be interconnected.
A Segmented Grid
A, B, and C are grids (mini or micro) that can operate autonomously but are connected
Figure 10: Diagram of a Segmented Grid
Why should the small grids—microgrids and minigrids—be connected? The answers are efficiency and reliability. The traditional very large, hierarchical grid was developed for solid reasons. The efficiency of a larger, connected grid is always at least as efficient as the sum of the constituent grids. An industrial load in Segment C can obtain power from the generators in Segment C, but if C is connected to A and B,

21
the option exists of taking power from a cheaper source in those segments. Obviously, reliability can be improved by interconnection, since a utility can compensate for the loss of a generator in one segment by drawing power from another segment. However, the interconnection also can lead to failures. Electricity flow is dynamic. A sudden surge in a segment can send power into another segment, tripping protective relays or, even worse, damaging equipment. This sort of surge was a fundamental contributing factor to several recent widespread outages.
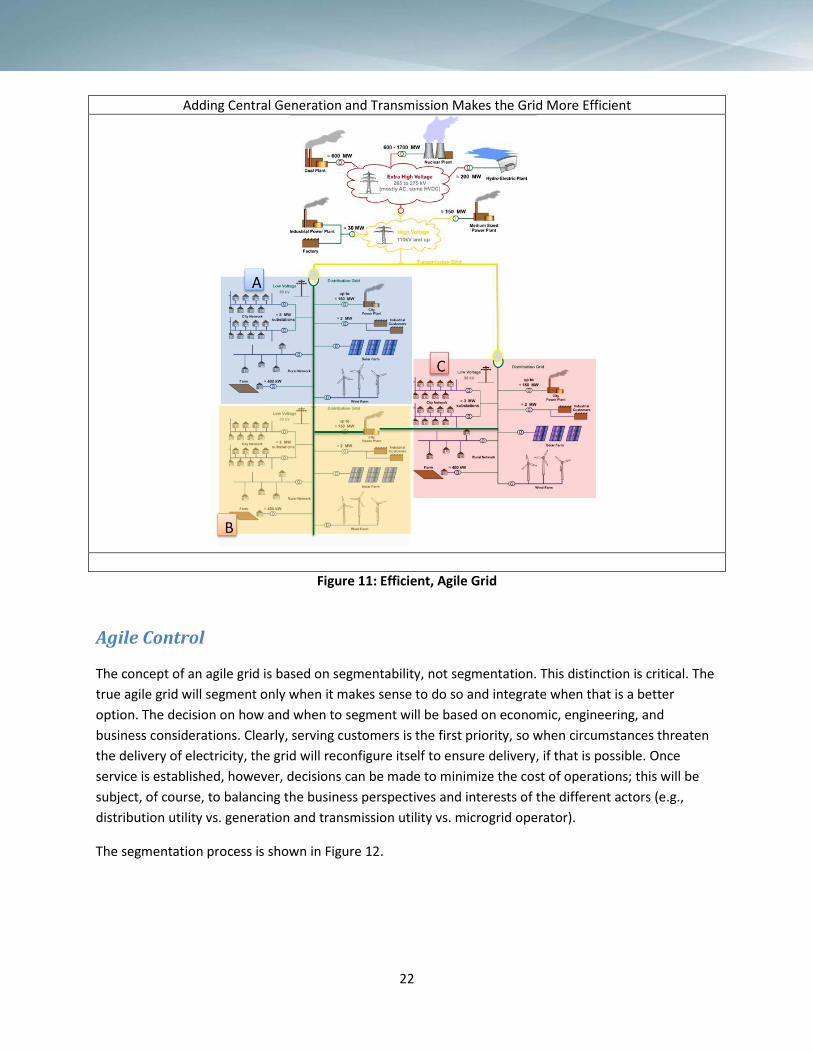
While Segments A, B, and C can operate either independently or in concert, there is still a considerable advantage to large central generating facilities. They are exceedingly reliable and efficient, having been refined over more than century and managed by experienced organizations. Accordingly, the illustration in Figure 11 is a more realistic topology, in which there is still a substantial generation and transmissions component. How does this differ from the first model presented—the traditional hierarchical model? Simply, the agile grid is designed so that the segments can operate independently when it is appropriate for them to do so.
22
Adding Central Generation and Transmission Makes the Grid More Efficient
Figure 11: Efficient, Agile Grid
Agile Control
The concept of an agile grid is based on segmentability, not segmentation. This distinction is critical. The true agile grid will segment only when it makes sense to do so and integrate when that is a better option. The decision on how and when to segment will be based on economic, engineering, and business considerations. Clearly, serving customers is the first priority, so when circumstances threaten the delivery of electricity, the grid will reconfigure itself to ensure delivery, if that is possible. Once service is established, however, decisions can be made to minimize the cost of operations; this will be subject, of course, to balancing the business perspectives and interests of the different actors (e.g., distribution utility vs. generation and transmission utility vs. microgrid operator).
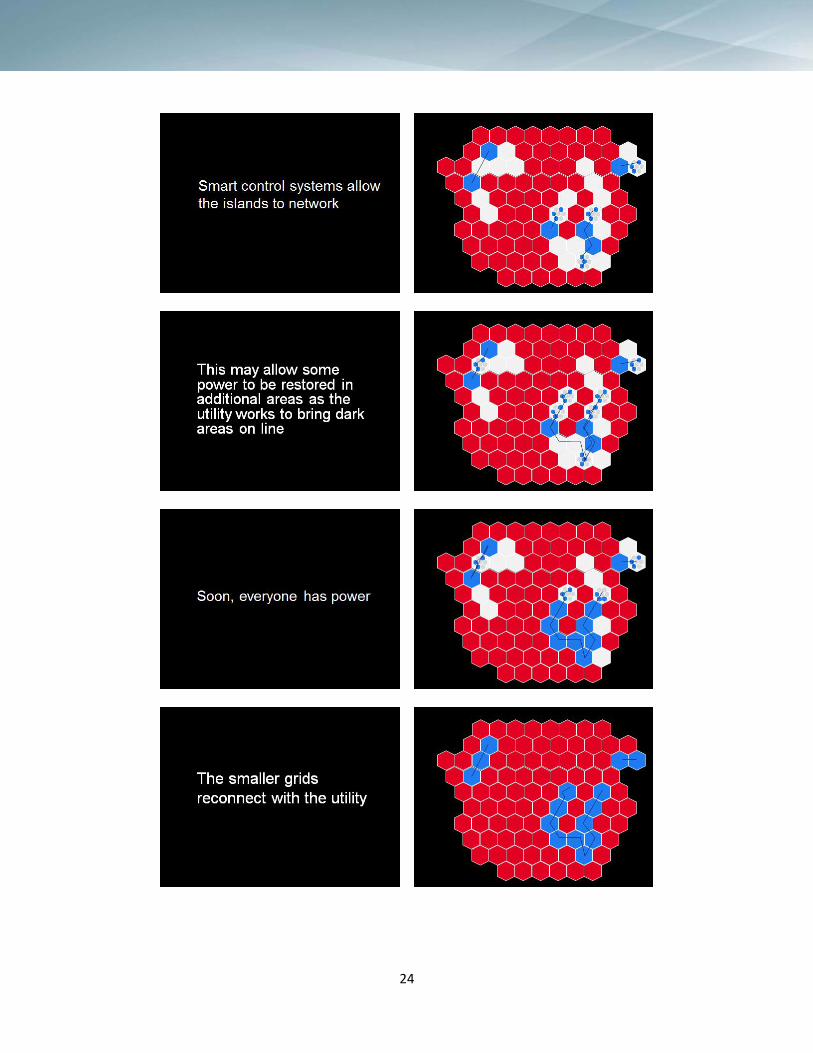
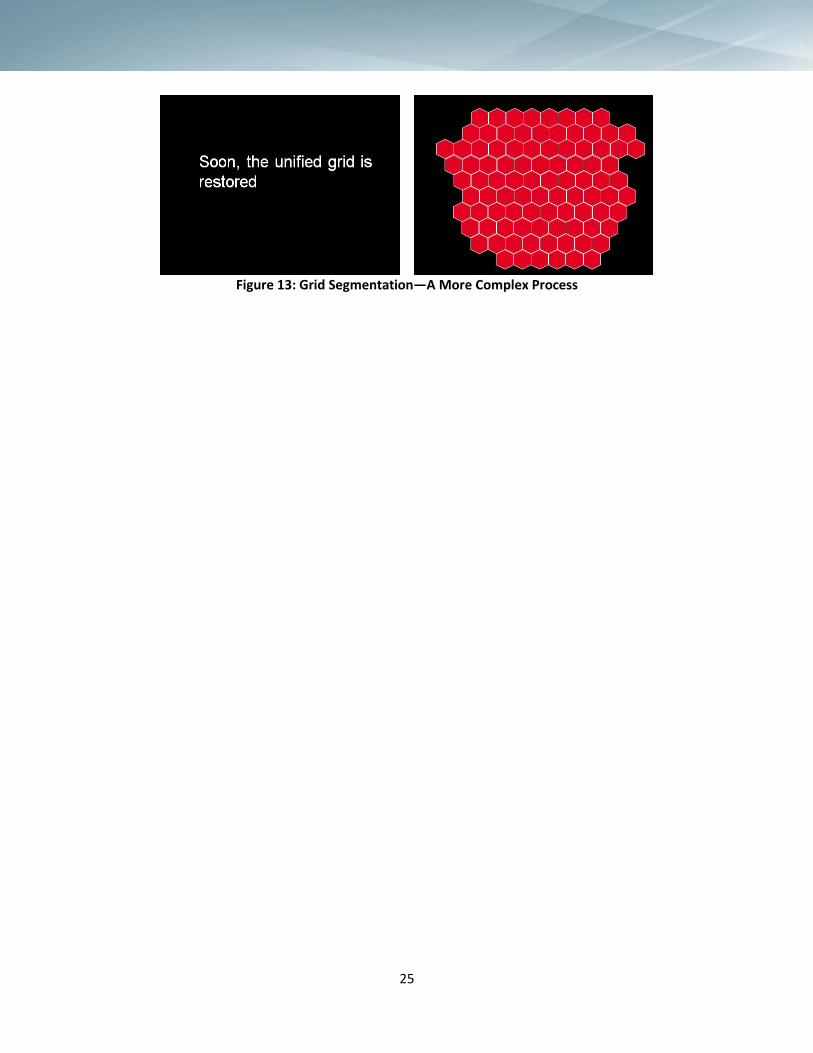
The segmentation process is shown in Figure 12.

23
Figure 12: Grid Segmentation Process
In a more complex example, the operation might proceed as follows:
24
25
Figure 13: Grid Segmentation—A More Complex Process
26
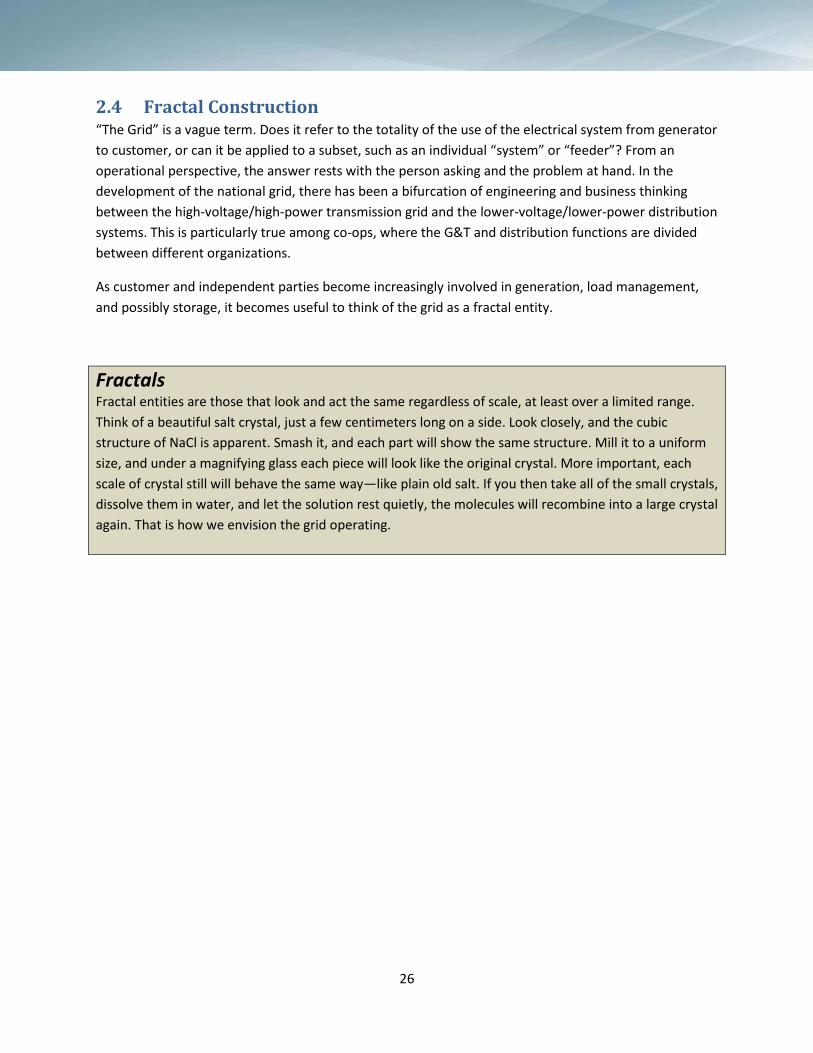
2.4 Fractal Construction “The Grid” is a vague term. Does it refer to the totality of the use of the electrical system from generator to customer, or can it be applied to a subset, such as an individual “system” or “feeder”? From an operational perspective, the answer rests with the person asking and the problem at hand. In the development of the national grid, there has been a bifurcation of engineering and business thinking between the high-voltage/high-power transmission grid and the lower-voltage/lower-power distribution systems. This is particularly true among co-ops, where the G&T and distribution functions are divided between different organizations.
As customer and independent parties become increasingly involved in generation, load management, and possibly storage, it becomes useful to think of the grid as a fractal entity.
Fractals Fractal entities are those that look and act the same regardless of scale, at least over a limited range. Think of a beautiful salt crystal, just a few centimeters long on a side. Look closely, and the cubic structure of NaCl is apparent. Smash it, and each part will show the same structure. Mill it to a uniform size, and under a magnifying glass each piece will look like the original crystal. More important, each scale of crystal still will behave the same way—like plain old salt. If you then take all of the small crystals, dissolve them in water, and let the solution rest quietly, the molecules will recombine into a large crystal again. That is how we envision the grid operating.

27
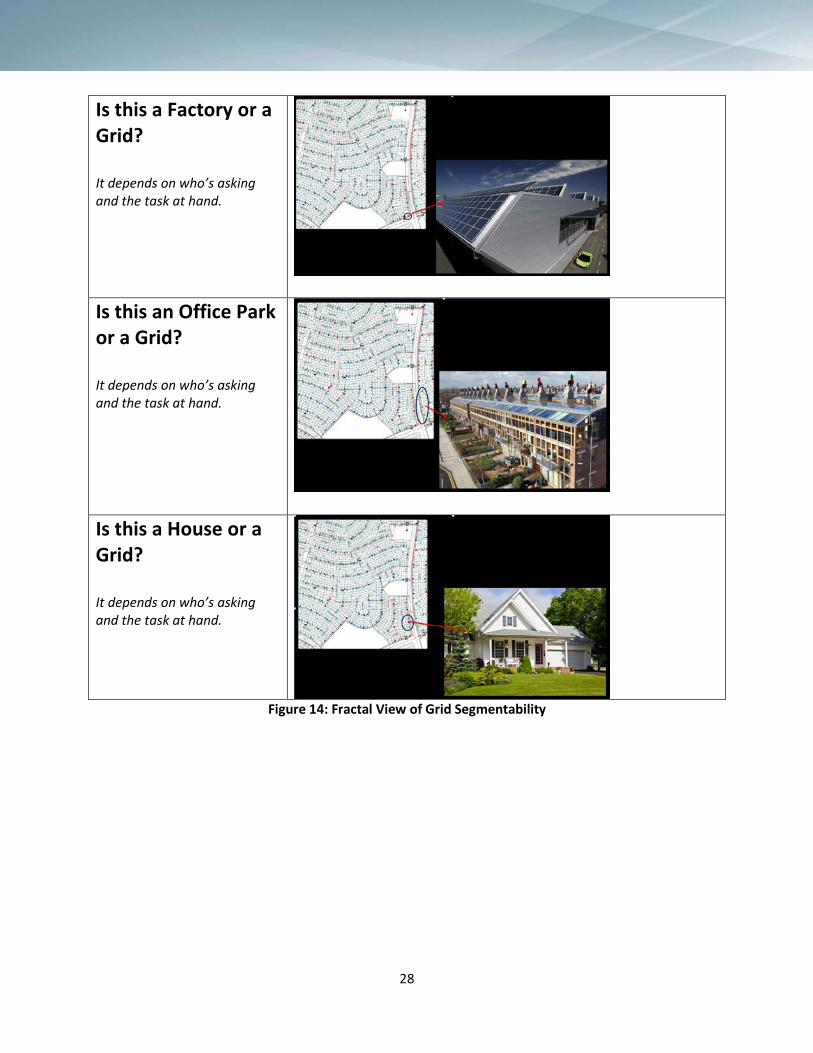
In essence, we see the future grid as a “grid of grids.” Take a look at Figure 14 … and then a closer look.
A Grid of Grids
Looking Closer
Looking Closer
28
Is this a Factory or a Grid? It depends on who’s asking and the task at hand.
Is this an Office Park or a Grid? It depends on who’s asking and the task at hand.
Is this a House or a Grid? It depends on who’s asking and the task at hand.
Figure 14: Fractal View of Grid Segmentability

29
The grid clearly looks fractal, but at this time it does not behave fractally. Different methods are used to manage the transmission grid, the distribution grid, microgrids, and load at a location. This circumstance makes the realization of the agile grid much more complicated. A piece of the grid may isolate itself (island) and operate autonomously for a while, but reconnection is not simple or automatic, and the methods of reconnection and synchronization are very deployment specific.
Over time, we must drive toward standard methods of creating temporary subgrids, coordinating their operation, connecting them to each other, and reconnecting them to the broader grid. Ideally, the modus operandi will be the same regardless of scale, so that the same technology (at least at the control/software level) applies. Of course, the electrical components necessarily will vary by scale. The system of a fractal grid should be based on four principles:
Principles of Fractal Operation (Ideal)
• All segments of the grid operate with the same information and control model—regardless of scale
• Every segment of the grid has a decision-making capability • The means for exchange of peer-to-peer information are defined clearly in standards • The rules for when to divide and when to combine are defined clearly

30
2.5 An Internet You Can Trust
One of the most contentious issues in building utility systems is whether and to what extent to use the Internet. Every utility uses the Internet to some degree. Minimally, utilities use it for their web sites, email, and software maintenance, but most are wary—at least to some degree—of using the Internet for mission-critical applications like SCADA control, even as they embrace Internet Protocols (IP) for use on private utility-owned networks. IP succeeds because it is a robust and flexible protocol; it is so widely adopted that the supporting software and hardware (from routers to switches and servers) are produced and used in such large quantities that they are inexpensive and hardened through use and competition to the point of extreme reliability. Further, this triumph of standardization around open standards is an enviable model for electric utilities, having led to quality control of software and user interfaces. For example, routers have become so standard that installing one at home has become a simple task, accomplished by millions of people with no technical training or understanding of the technical protocols. The Internet is, without a doubt, the cheapest, most flexible, and most ubiquitous means of exchanging electronic information. It would be wonderful if utilities simply could use the Internet to manage all business and operational functions with certainty as to its reliability and security. Unfortunately, that certainty is lacking. The problem lies in the concept of the Internet and its development as a commercial entity. The concept of packet-switched networks originated in academia. The first packet-switched transmission can be identified with certainty as a message sent from Professor Leonard Kleinrock's laboratory at UCLA to SRI (then the Stanford Research Institute). From there, however, the path forward became complex and chaotic, with many researchers contributing and learning from each other. Two milestones are certain. In 1969, ARPANE8 expanded to four nodes running TCIP/IP, effectively becoming the first Internet. This work was led by Vinton Cerf and Robert Kahn at Stanford. Much later, in 1989, Tim Burners Lee conceived the World Wide Web, which opened the Internet to general use. As originally conceived, the Internet was intended to further the transfer of information among scholars and researchers. After the web was conceived and HTML language came into widespread use, the Internet exploded across the world, having been repurposed for a vast range of commercial, entertainment, and other applications. Today, exchange of research documents and industrial control are not listed among the top 25 uses of the Internet in any survey. These general applications—from sending email to shopping to entertainment (the top three uses)—have very different requirements from those of industrial controls. Security is an issue in all applications,
8 ARPANET was a modest (by modern standards) network developed by the Advanced Research Projects Agency to develop, test, and prove packet-switching technology.
31
since its lack can lead to loss of personal information or corruption of a commercial process, but utilities must deal with a different sensitivity to risk. Corruption of the grid’s control system can have immense and life-threatening implications. Also, there are basic differences in reliability and latency requirements. Every Internet user has experienced a temporary degradation of service and may be annoyed but not greatly inconvenienced by having to reload a page occasionally. The Internet does an excellent job of fulfilling the requirements of the most common applications, but the mere inclusion of a “reload” function in all major browsers is a prima facie indication of the barrier faced in using the Internet for very critical industrial applications. It should be remembered, though, that the Internet is a young technology that is still developing.
Despite the problems with the current generation Internet, the potential for ubiquitous, flexible, high-performance networks is irresistible. Internet protocols on a public and professionally managed network are the future of industrial as well as commercial and social communications. The challenge is how to make the Internet utterly reliable and secure.
The Internet will be improved in three ways:
(1) Industry as a priority
Currently, the revenue from the Internet is overwhelmingly driven by consumer-serving applications. Delivery of commerce, content, and social connections are very big business, and the Internet is being built for that purpose. For example, the most recent high-profile Internet deal between Netflix and Comcast was to provide direct access to Comcast’s network to improve Netflix’s streaming speed. No utility has or can present such a deal to an Internet provider. Over time, however, the low-hanging fruit of the Internet will be fully addressed and divided up among a smaller number of larger surviving providers. At that point, the providers will turn to smaller, more challenging markets. One or more will start to build out industrial-grade applications. A number of companies are advertising “business-class” Internet service, but a less than exhaustive search seems to indicate that their offerings are not technically much different than consumer offerings, except in bandwidth.

32
(2) Improvement of the current Internet
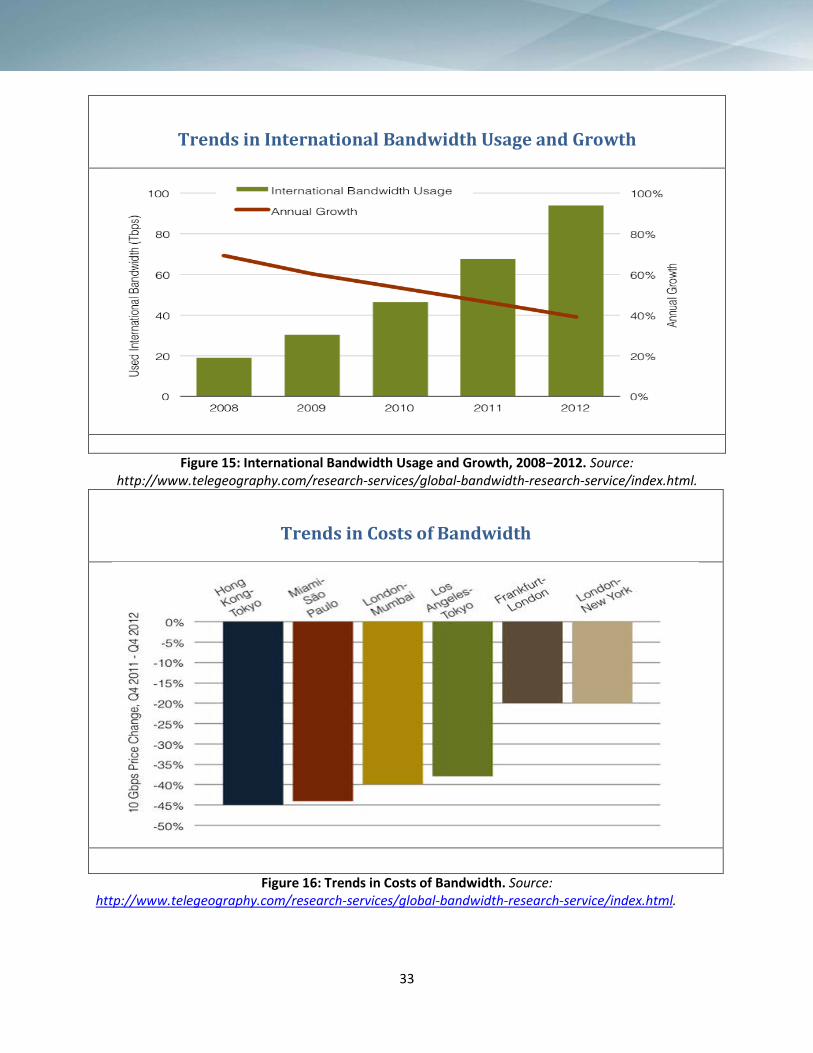
Over time, Internet providers and technology developers have been improving the current Internet. This is reflected in international bandwidth usage and growth (Figure 15), and the cost per unit of bandwidth (Figure 16). Although the decline in rates is leveling out, it is continuing. This decline is partly a function of market factors, but also is due to improvements in the technology and business process for installing and operating Internet infrastructure.
Stepping back, the Internet actually can be viewed as a function of five factors:
1. Speed – Speed is measured by MBPs. Speed is increasing rapidly. 2. Extent – The Internet is being extended to more areas, and service speed is being upgraded. 3. Security – To a large extent, security is regarded as the responsibility of the application
builder and users through the use of technology from vendors such as Microsoft and Kaspersky. ISP licenses specifically absolve the Internet provider from liability for security problems.
4. Latency – Latency is the delay from the start of a request over the Internet to the start of processing. Low latency is a requirement for real-time industrial operations. The current Internet is not designed for low latency, latency performance numbers are not published, and there are few if any public efforts to reduce latency.
5. Reliability – Reliability is the fraction of time that the Internet is available or the number of lost packets, including very short interruptions that barely would be noticed in commercial transactions or streaming entertainment. As with latency, performance numbers are hard to come by, and reliability generally is not cited when marketing Internet services.
The Internet indeed is improving in speed and extent. General providers of Internet services market the basis of these factors, and new investments generally are directed at improving speed and the extent of availability. However, progress is lagging in latency and reliability—and these are the two factors specifically necessary for high-performance industrial applications.
33
Trends in International Bandwidth Usage and Growth
Figure 15: International Bandwidth Usage and Growth, 2008−2012. Source: http://www.telegeography.com/research-services/global-bandwidth-research-service/index.html.
Trends in Costs of Bandwidth
Figure 16: Trends in Costs of Bandwidth. Source: http://www.telegeography.com/research-services/global-bandwidth-research-service/index.html.
34
These trends show that the Internet is getting faster and cheaper, which is good, but there is a difference between what utilities need and what consumers need. Two statistics that utilities need involve reliability of service, as measured by the frequency and duration of outages and latency. Unfortunately, Internet providers do not make available the data on service interruption, for obvious reasons. There are limited data on latency; latency is high deviation, depending on location, time of day, weather, system maintenance, and other factors. Thus, it is difficult to make a comprehensive Internet-wide statement about latency trends, but there seem to be no data showing a convincing improvement. Typical commercial and personal Internet use is more tolerant of long latency than industrial control systems, so there likely will not be an improvement in this regard as long as industrial applications remain a fringe market.
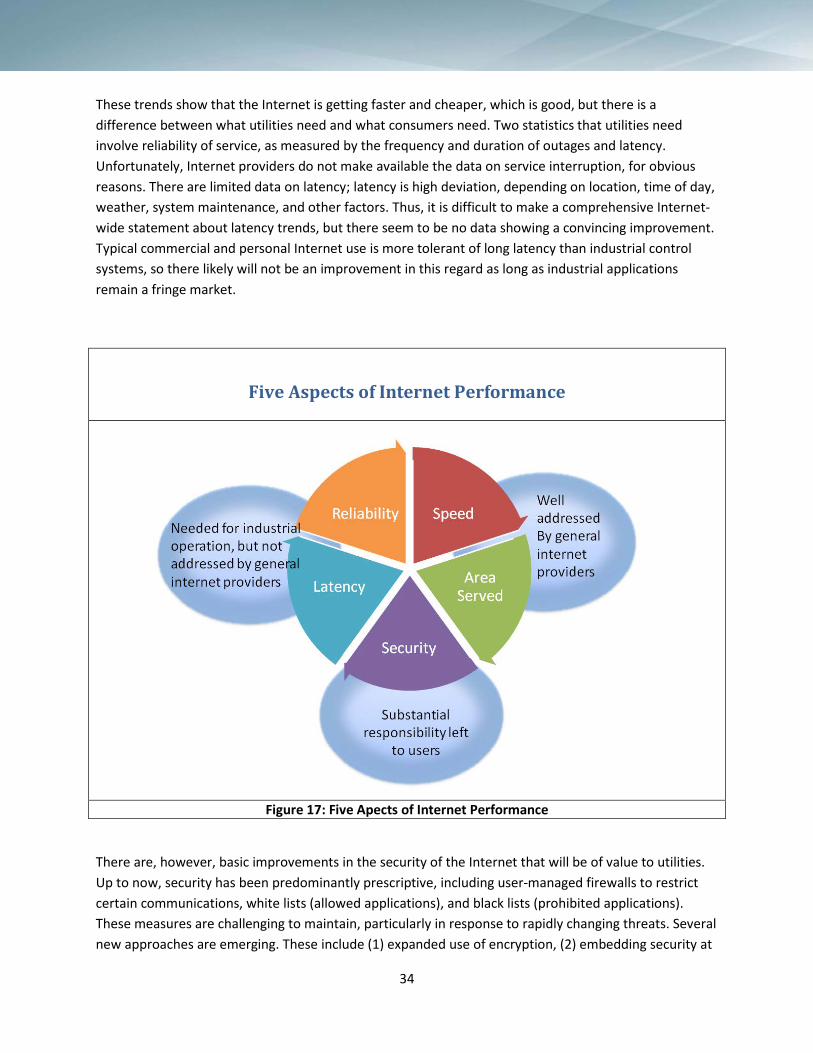
Five Aspects of Internet Performance
Figure 17: Five Apects of Internet Performance
There are, however, basic improvements in the security of the Internet that will be of value to utilities. Up to now, security has been predominantly prescriptive, including user-managed firewalls to restrict certain communications, white lists (allowed applications), and black lists (prohibited applications). These measures are challenging to maintain, particularly in response to rapidly changing threats. Several new approaches are emerging. These include (1) expanded use of encryption, (2) embedding security at

35
the level of the silicon in routers and switches, (3) data diodes, (4) industrial firewalls, and (5) passive monitoring, among other emergent technologies.
Even though the Internet overall is getting faster, cheaper, and more secure, the focus in development still is consumer applications, so improvement is lacking in a few critical areas—particularly in reducing the instance of outages and, less critically, latency.
(3) Reinventing the Internet
A number of organizations are intent on developing a new version of the Internet that is suitable for industrial applications. Among these are the following:
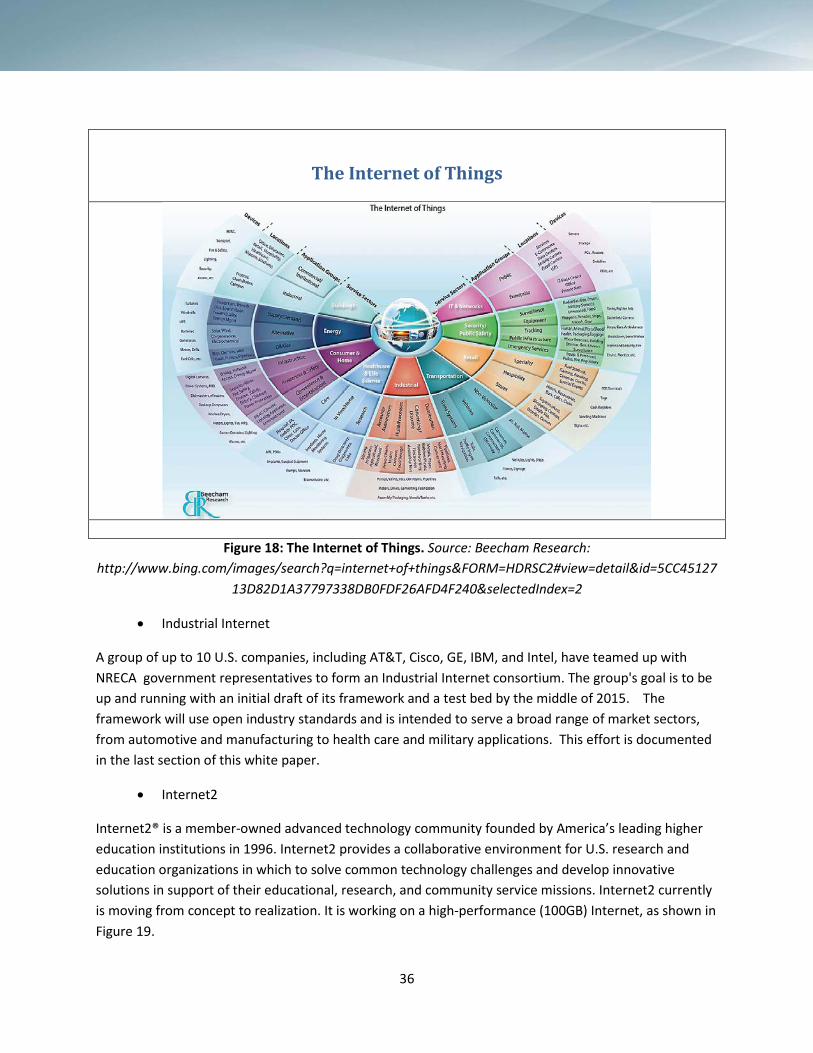
• The Internet of Things
The Internet of Things (IOT) originally was conceived in the 1990s by Kevin Ashton of MIT, who focused on giving devices addresses; and Bill Joy (co-founder of Sun Microsystems), who focused on a network to make use of addressable devices. While the IOT was hyped early on (remember fantasies about network-connected toasters?), development has lagged. The ideas have regained currency, however, with a focus on more practical issues, such as security, home HVAC automation, and integration of industrial processes. The IOT has no central leadership; rather, there is a rapid ongoing proliferation of major and smaller companies pursuing diverse approaches to the networking of objects.
There is no unique and “official” model or picture of the IOT, but the one in Figure 18 from Beecham Research is the most beautiful and comprehensive.
36
The Internet of Things
Figure 18: The Internet of Things. Source: Beecham Research: http://www.bing.com/images/search?q=internet+of+things&FORM=HDRSC2#view=detail&id=5CC45127
13D82D1A37797338DB0FDF26AFD4F240&selectedIndex=2
• Industrial Internet
A group of up to 10 U.S. companies, including AT&T, Cisco, GE, IBM, and Intel, have teamed up with NRECA government representatives to form an Industrial Internet consortium. The group's goal is to be up and running with an initial draft of its framework and a test bed by the middle of 2015. The framework will use open industry standards and is intended to serve a broad range of market sectors, from automotive and manufacturing to health care and military applications. This effort is documented in the last section of this white paper.
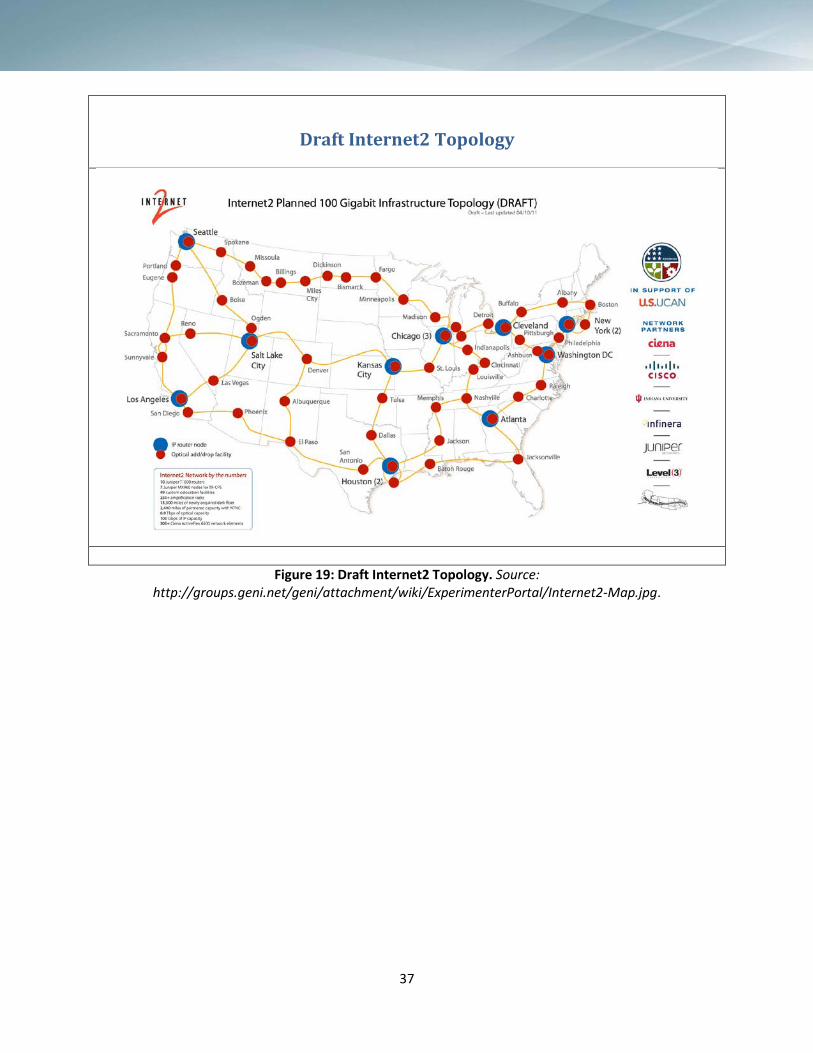
• Internet2
Internet2® is a member-owned advanced technology community founded by America’s leading higher education institutions in 1996. Internet2 provides a collaborative environment for U.S. research and education organizations in which to solve common technology challenges and develop innovative solutions in support of their educational, research, and community service missions. Internet2 currently is moving from concept to realization. It is working on a high-performance (100GB) Internet, as shown in Figure 19.
37
Draft Internet2 Topology
Figure 19: Draft Internet2 Topology. Source: http://groups.geni.net/geni/attachment/wiki/ExperimenterPortal/Internet2-Map.jpg.
38
2.6 Advanced VAR Control and Solid State Power Electronics
On a radial distribution system, solid state transformers have the potential to increase power quality, ease grid operations, and enable the seamless integration of renewable assets through precise, agile regulation on the secondary system. Solid state transformers also have the potential to eliminate many of the operational challenges in operating a grid. They can:
• Regulate service voltage to isolate and protect the consumer from low-voltage conditions on the primary system and transients on the secondary system
• Present a low impedance to the load to quash current harmonics at the source • Isolate and protect the distribution system from any harmonics and faults on the secondary
system • Make synchronous operation between network segments unnecessary
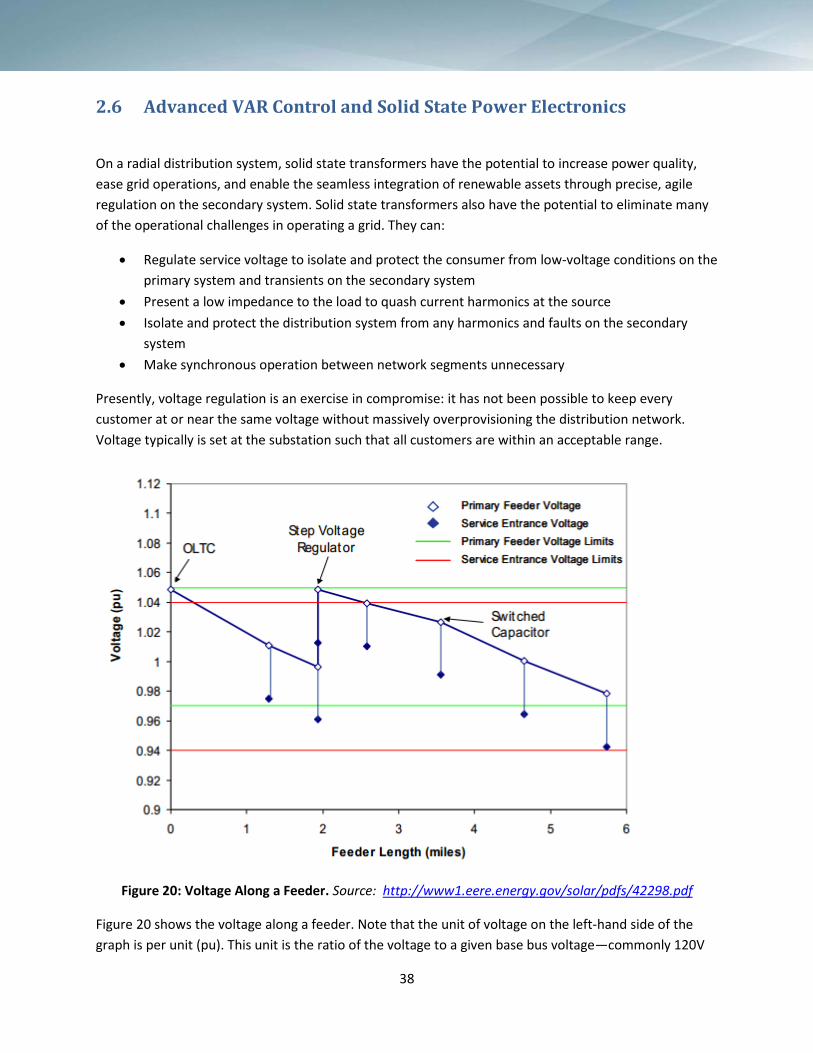
Presently, voltage regulation is an exercise in compromise: it has not been possible to keep every customer at or near the same voltage without massively overprovisioning the distribution network. Voltage typically is set at the substation such that all customers are within an acceptable range.
Figure 20: Voltage Along a Feeder. Source: http://www1.eere.energy.gov/solar/pdfs/42298.pdf
Figure 20 shows the voltage along a feeder. Note that the unit of voltage on the left-hand side of the graph is per unit (pu). This unit is the ratio of the voltage to a given base bus voltage—commonly 120V
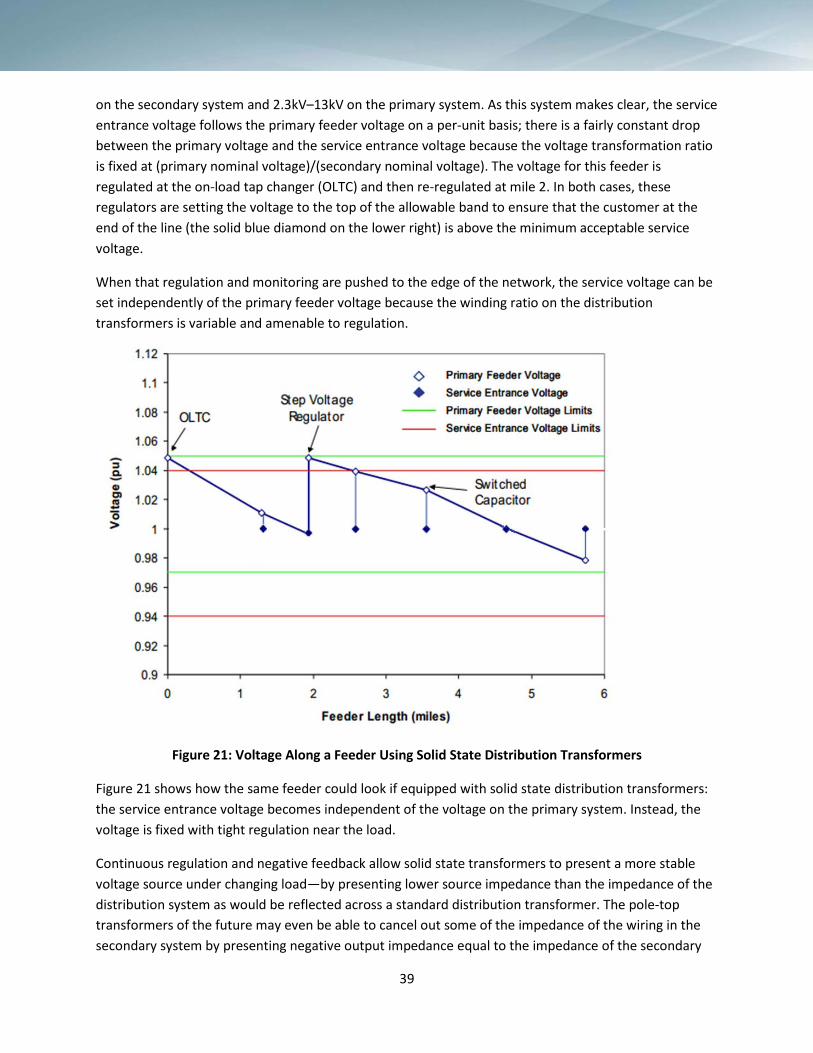
39
on the secondary system and 2.3kV–13kV on the primary system. As this system makes clear, the service entrance voltage follows the primary feeder voltage on a per-unit basis; there is a fairly constant drop between the primary voltage and the service entrance voltage because the voltage transformation ratio is fixed at (primary nominal voltage)/(secondary nominal voltage). The voltage for this feeder is regulated at the on-load tap changer (OLTC) and then re-regulated at mile 2. In both cases, these regulators are setting the voltage to the top of the allowable band to ensure that the customer at the end of the line (the solid blue diamond on the lower right) is above the minimum acceptable service voltage.
When that regulation and monitoring are pushed to the edge of the network, the service voltage can be set independently of the primary feeder voltage because the winding ratio on the distribution transformers is variable and amenable to regulation.
Figure 21: Voltage Along a Feeder Using Solid State Distribution Transformers
Figure 21 shows how the same feeder could look if equipped with solid state distribution transformers: the service entrance voltage becomes independent of the voltage on the primary system. Instead, the voltage is fixed with tight regulation near the load.
Continuous regulation and negative feedback allow solid state transformers to present a more stable voltage source under changing load—by presenting lower source impedance than the impedance of the distribution system as would be reflected across a standard distribution transformer. The pole-top transformers of the future may even be able to cancel out some of the impedance of the wiring in the secondary system by presenting negative output impedance equal to the impedance of the secondary

40
system. The use of a negative output impedance to cancel secondary impedance is conceptually a very fast, fine- grained implementation of load drop compensation—like an OLTC on a transformer with thousands of taps. By simply speeding up the load drop compensation and moving the regulation nearer to the load, we may build a grid that makes unprecedented quality of service possible amid noisy loads and un-forecasted intermittent generation. The technique may allow utilities to deliver electric service that isolates loads from the current harmonics of other loads almost completely.
At the generating plant and substation, solid state transformers have the potential to make steering power as fast and easy as regulating voltage. They also make synchronous operation between utilities optional. In addition, if a distribution utility were to migrate its substation transformers to solid state, it could also migrate to a DC primary system and gain a 41% increase in system capacity while reducing its copper losses.
Existing devices on the market for solid state power distribution, such as the thyristor-switched capacitor banks from Varantec, also include telemetry capabilities.
A migration to solid state transformers makes many of the operational challenges for the fractal grid—voltage regulation, load isolation, agile power steering, and telemetry—into challenges for product engineering. Having this kind of “easy button” for grid operations could be a strategic boon to small utilities that cannot afford or recruit technical staff. It is yet to be seen whether the technology matures such that this potential can be realized.
Continuous Asset Health and System Health Monitoring Technologies
The grid of the future will be run with the assistance of continuous data acquisition and processing that feeds predictive analytics. As Moore’s Law and Nielsen’s Law drive the cost of computing resources and telemetry to approach zero, it is becoming less expensive to continuously monitor grid health indicators than to check them at periodic intervals. For instance, instead of checking on the oil health of a transformer every three years, as many utilities do now, some utilities are outfitting their transformers with sensors that monitor oil health continuously but only send an alert when and if there is a problem. Thus, utility communications do not bog down with messages from transformers that repeatedly assert their good health. These cheap, event-driven sensors are beginning to allow our utilities to produce and process staggering amounts of data by throwing away everything not relevant to utility operations at the point of collection. This shift from centralized to distributed data collection and analysis is allowing utilities to analyze a staggering amount of data without ever thinking about it, thus allowing millions of analyses to bloom even in the absence of a high data rate communications system.
Event-Driven Voltage Monitoring
Continuous, event-driven monitoring of end-of-line voltages already is allowing Dominion Voltage to ensure high power quality while driving down consumer demand with an aggressive conservation voltage reduction regime.

41
Dominion Voltage uses smart meters to report immediately whenever the service voltage is outside of an established range. That voltage range is set at the control center, which tells the sensor what to look for. The meter monitors the service entrance voltage 100% of the time but only reports if the voltage falls outside of its prescribed limits. Dominion arrived at this ultra-fast architecture after encountering the insufficiency of its communications system to support backhauling voltage readings from all of its meters at fixed 15-minute intervals. Given unlimited communications bandwidth, the utility could have made the system work with “high frequency” interval data but would have missed the opportunity to shave up to 15 minutes off of the response time. The shift from polling to event-driven architecture allowed the effective sampling rate of the system to go up—and the latency to go down—by three orders of magnitude. The technologies mentioned below rely on staggeringly high ratios of data ingested to information transmitted.
RF Sensors
RF sensors continuously survey the AM radio band on the distribution system to locate arcing. This is possible because arcing current generates static in the AM radio bands. General purpose AM radios and special purpose directional radios have long been used to find arc faults on the distribution system, but historically this has been a manual process conducted by humans policing the lines. The directional radios now coming to market are intended to be fixed assets on the distribution system, virtually policing the lines on a continuous basis and generating an alert only upon detection of arc current. While it would be extremely difficult to justify the expense of assigning personnel to police the entire distribution system for arc current every day, a network of distributed RF sensors may make 24/7 continuous policing of the distribution system feasible, thus enabling utilities to detect, locate, and characterize arc faults the moment they occur.
Distribution Fault Anticipators
Distribution fault anticipators inspect current and voltage waveforms continuously for indicators of impending component failures. They can provide intelligence on the type of problem and its likely location on the distribution system. This allows utility personnel time to inspect, repair, or replace failing grid assets before they cause a reliability event.
Autonomous Vehicles
Autonomous vehicles of every conceivable variety—from imaging satellites to robots that climb on distribution lines—are being considered for use in monitoring the grid to enable preventative maintenance and rapid incident response. In particular, autonomous aircraft are receiving enormous attention because of their potential to collect imaging for preventative vegetation management and detect arc faults with radios.

42
2.7 Advanced Architecture
An Abstraction Model for the Future Grid The next question is how to build the control system to enable an agile grid. Segmentation in generation is the starting point, and there are many technical issues related to the management, creation, integration, separation, reintegration, synchronization, and coordination of the segments of the grid. Substantial work is being done in the area of microgrids, ranging from the practical implementation of independent or quasi-independent microgrids, typically around a single modest generator, to work on the theoretical foundations in areas such as the synchronization of independent oscillators.9 The focus here is not the mechanics of synchronization, but on the higher-level problem of how to make the decision about when to segment/reintegrate and when, how, and in what order to initiate adaptive measures, such as feeder switching, load shedding, and CVR.
This strategic perspective is basically about decision making, and decision making can be viewed as an information hierarchy, of which there are innumerable variants. One of these is shown in Figure 22.
Figure 22: Information Hierarchy for Agile Grid Control
This is a useful construct for thinking about the technology that needs to be developed to make the agile grid work, as shown in Table 1.
9 c.f. Grzegorzyca, G., “Synchronization of Islands: Criteria, Procedures, and Technical Requirements and Systems,” Power Engineering and Automation Conference (IEEE), September 8–9, 2011.

43
Table 1: Technology Needed for the Agile Grid
Layer Needed Action Layer Control options technology, such as:
• Smart feeder switches • Direct load control • Capacitor banks for CVR • Voltage regulators • Storage
High-reliability communications systems to distribute control information and confirm action
Decision Layer High-end modeling, executed in real time, connected to SCADA
Understanding Layer • Predictive analysis and modeling to understand the behavior or segmentation of the grid under normal and stress conditions
• Static and, more important, dynamic power flow analysis (OMF, GridLAB-D, OpenDSS)
• Planning for disruption and recovery Information Layer • High-performance data system (beyond
relational) • Cloud-based systems for information
collection and sharing Data Layer Sensor networks
Innovations are needed at every level, as shown in Figure 23.
Figure 23: Innovations Needed for the Agile Grid
44
With the systems in place to collect and share information, model grid behavior, and distribute control commands and received feedback, what remains is a large and very complex problem in control theory.
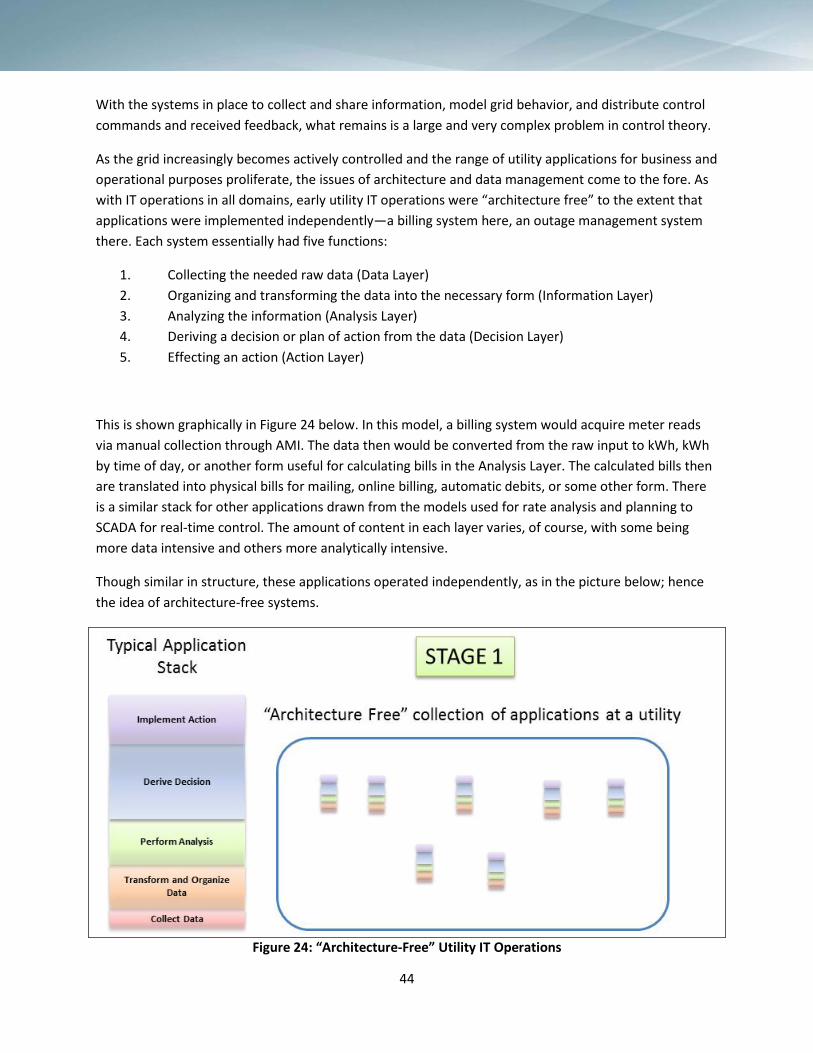
As the grid increasingly becomes actively controlled and the range of utility applications for business and operational purposes proliferate, the issues of architecture and data management come to the fore. As with IT operations in all domains, early utility IT operations were “architecture free” to the extent that applications were implemented independently—a billing system here, an outage management system there. Each system essentially had five functions:
1. Collecting the needed raw data (Data Layer) 2. Organizing and transforming the data into the necessary form (Information Layer) 3. Analyzing the information (Analysis Layer) 4. Deriving a decision or plan of action from the data (Decision Layer) 5. Effecting an action (Action Layer)
This is shown graphically in Figure 24 below. In this model, a billing system would acquire meter reads via manual collection through AMI. The data then would be converted from the raw input to kWh, kWh by time of day, or another form useful for calculating bills in the Analysis Layer. The calculated bills then are translated into physical bills for mailing, online billing, automatic debits, or some other form. There is a similar stack for other applications drawn from the models used for rate analysis and planning to SCADA for real-time control. The amount of content in each layer varies, of course, with some being more data intensive and others more analytically intensive.
Though similar in structure, these applications operated independently, as in the picture below; hence the idea of architecture-free systems.
Figure 24: “Architecture-Free” Utility IT Operations

45
In short order, in utilities as in other systems, it became apparent that certain processes required multiple applications that had to be integrated, at least to the extent of exchanging information, as in Figure 25. Initially, the exchange was through files ( ), ) and later, through databases ( ). ).
Figure 25: Information Exchange Through Files or Databases
In the 1990s, it became a common practice to build systems centered around databases. The goal was usually a single central data store and the complete elimination of direct connection. This was rarely, if ever, achieved, however. A more usual configuration was a large central database that exchanged information between full-stack applications, a number of smaller databases, and some persistent file-based exchanges, as indicated in Figure 26.
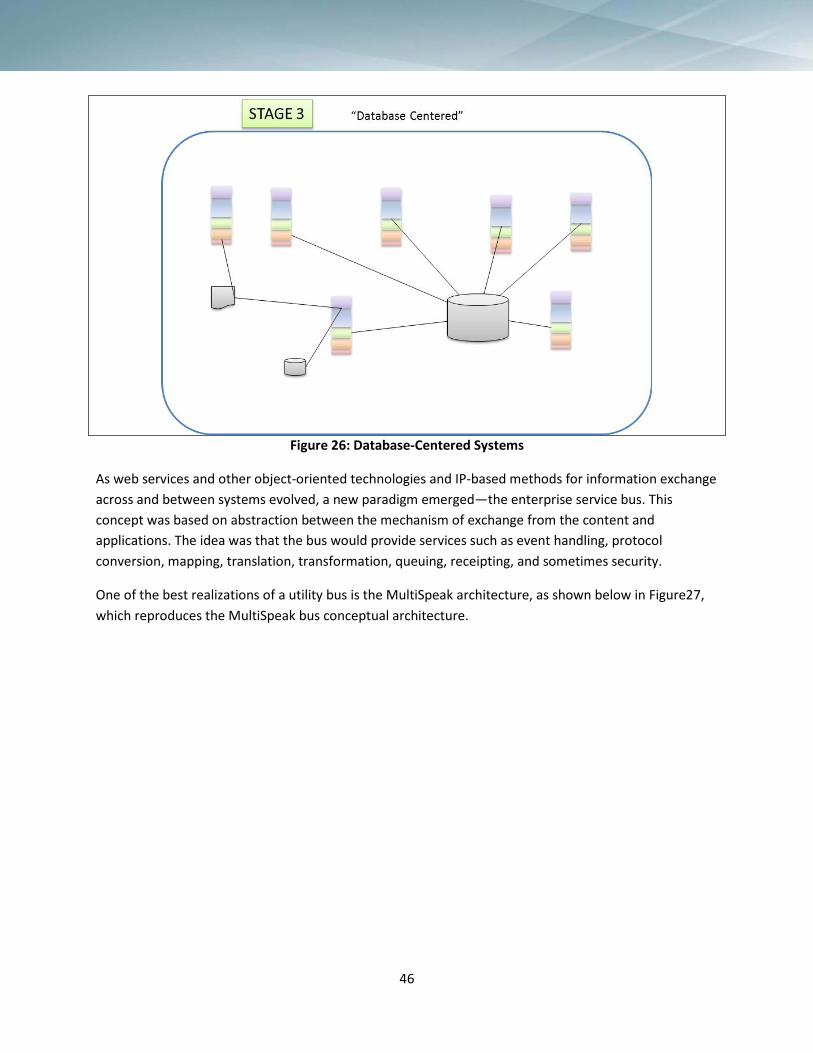
46
Figure 26: Database-Centered Systems
As web services and other object-oriented technologies and IP-based methods for information exchange across and between systems evolved, a new paradigm emerged—the enterprise service bus. This concept was based on abstraction between the mechanism of exchange from the content and applications. The idea was that the bus would provide services such as event handling, protocol conversion, mapping, translation, transformation, queuing, receipting, and sometimes security.
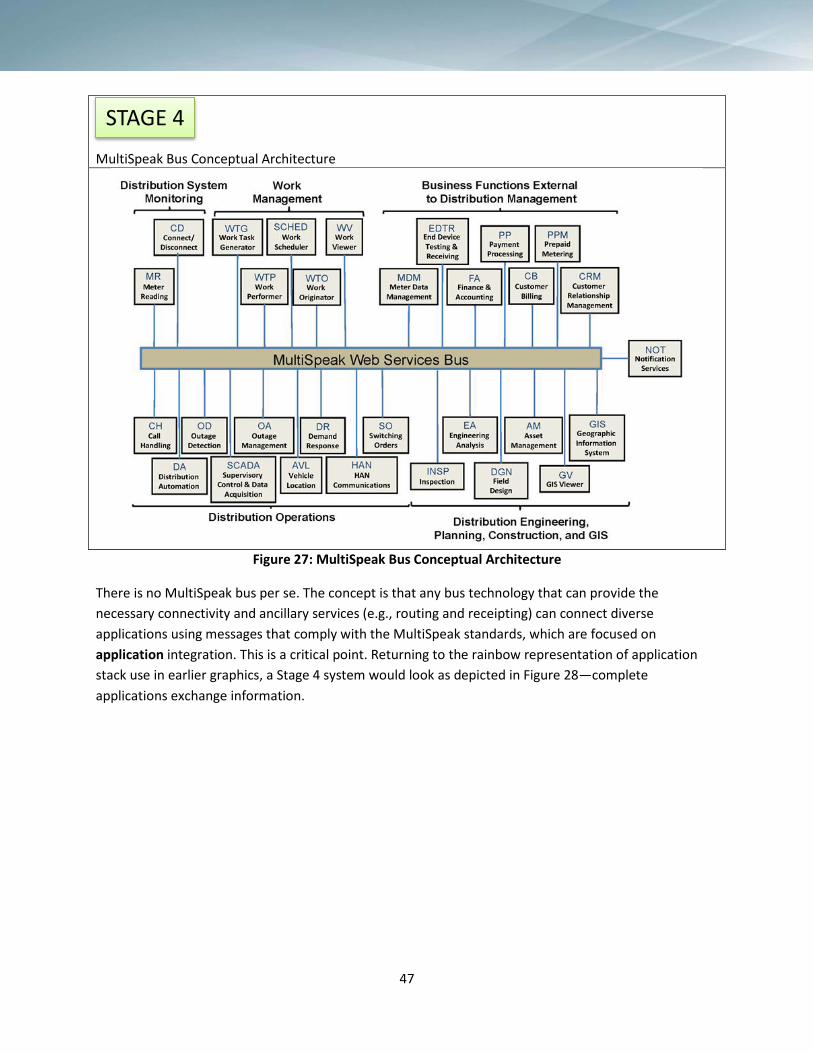
One of the best realizations of a utility bus is the MultiSpeak architecture, as shown below in Figure27, which reproduces the MultiSpeak bus conceptual architecture.
47
MultiSpeak Bus Conceptual Architecture
Figure 27: MultiSpeak Bus Conceptual Architecture
There is no MultiSpeak bus per se. The concept is that any bus technology that can provide the necessary connectivity and ancillary services (e.g., routing and receipting) can connect diverse applications using messages that comply with the MultiSpeak standards, which are focused on application integration. This is a critical point. Returning to the rainbow representation of application stack use in earlier graphics, a Stage 4 system would look as depicted in Figure 28—complete applications exchange information.
STAGE 4
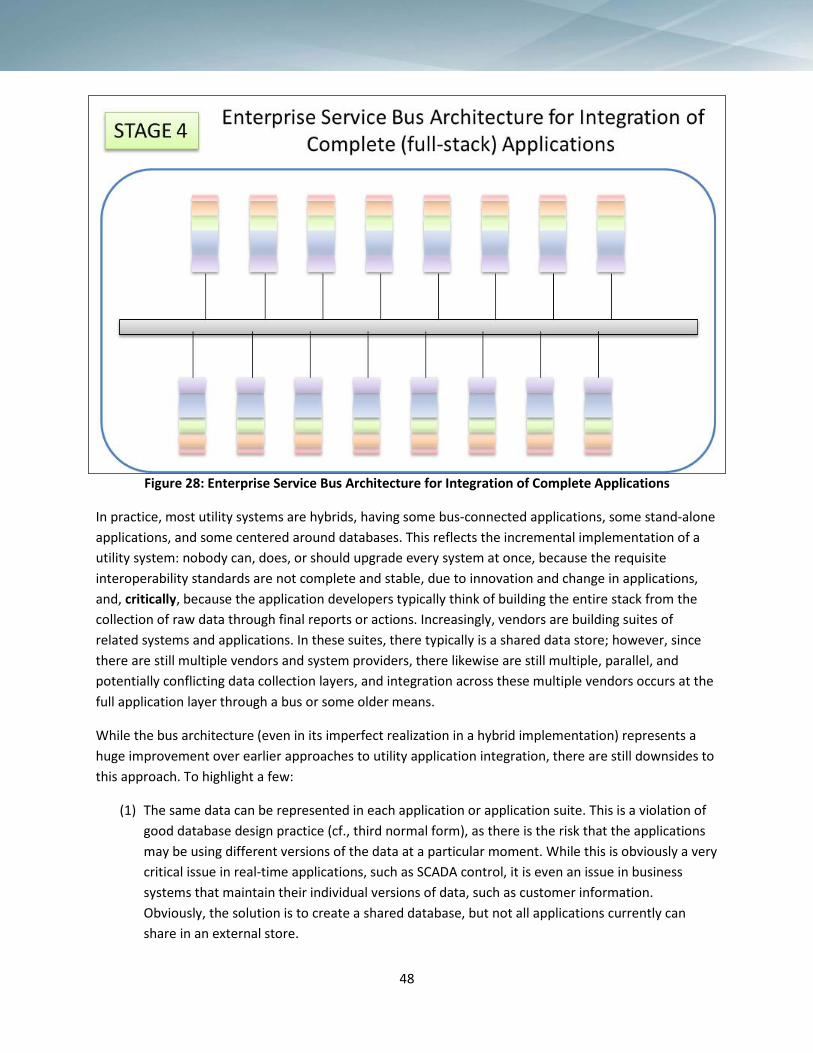
48
Figure 28: Enterprise Service Bus Architecture for Integration of Complete Applications
In practice, most utility systems are hybrids, having some bus-connected applications, some stand-alone applications, and some centered around databases. This reflects the incremental implementation of a utility system: nobody can, does, or should upgrade every system at once, because the requisite interoperability standards are not complete and stable, due to innovation and change in applications, and, critically, because the application developers typically think of building the entire stack from the collection of raw data through final reports or actions. Increasingly, vendors are building suites of related systems and applications. In these suites, there typically is a shared data store; however, since there are still multiple vendors and system providers, there likewise are still multiple, parallel, and potentially conflicting data collection layers, and integration across these multiple vendors occurs at the full application layer through a bus or some older means.
While the bus architecture (even in its imperfect realization in a hybrid implementation) represents a huge improvement over earlier approaches to utility application integration, there are still downsides to this approach. To highlight a few:
(1) The same data can be represented in each application or application suite. This is a violation of good database design practice (cf., third normal form), as there is the risk that the applications may be using different versions of the data at a particular moment. While this is obviously a very critical issue in real-time applications, such as SCADA control, it is even an issue in business systems that maintain their individual versions of data, such as customer information. Obviously, the solution is to create a shared database, but not all applications currently can share in an external store.
49
(2) Redundant data collection uses more bandwidth, which is becoming a limiting factor in future utility operation. While the replication also uses other resources unnecessarily (e.g., processing capacity or storage), this is less limiting than the strain on bandwidth.
(3) This lack of deeper integration creates a security risk by expanding the attack surface and blocking an integrated, utility-wide approach to system security.
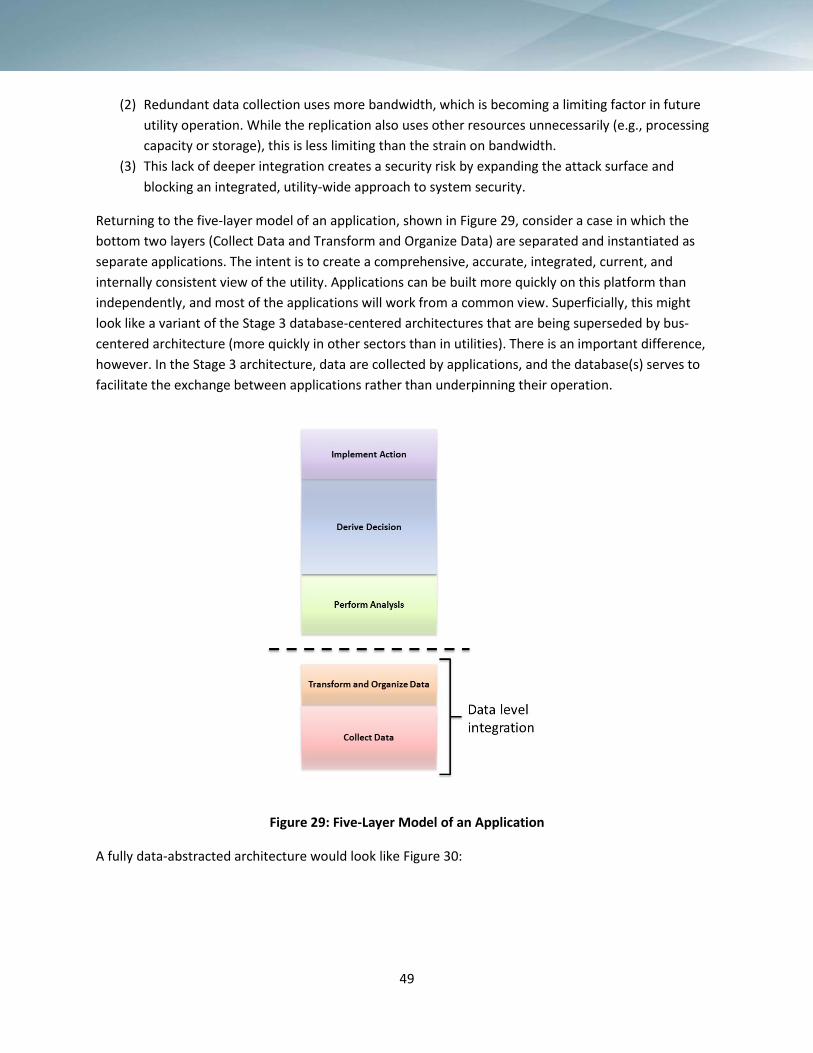
Returning to the five-layer model of an application, shown in Figure 29, consider a case in which the bottom two layers (Collect Data and Transform and Organize Data) are separated and instantiated as separate applications. The intent is to create a comprehensive, accurate, integrated, current, and internally consistent view of the utility. Applications can be built more quickly on this platform than independently, and most of the applications will work from a common view. Superficially, this might look like a variant of the Stage 3 database-centered architectures that are being superseded by bus-centered architecture (more quickly in other sectors than in utilities). There is an important difference, however. In the Stage 3 architecture, data are collected by applications, and the database(s) serves to facilitate the exchange between applications rather than underpinning their operation.
Figure 29: Five-Layer Model of an Application
A fully data-abstracted architecture would look like Figure 30:
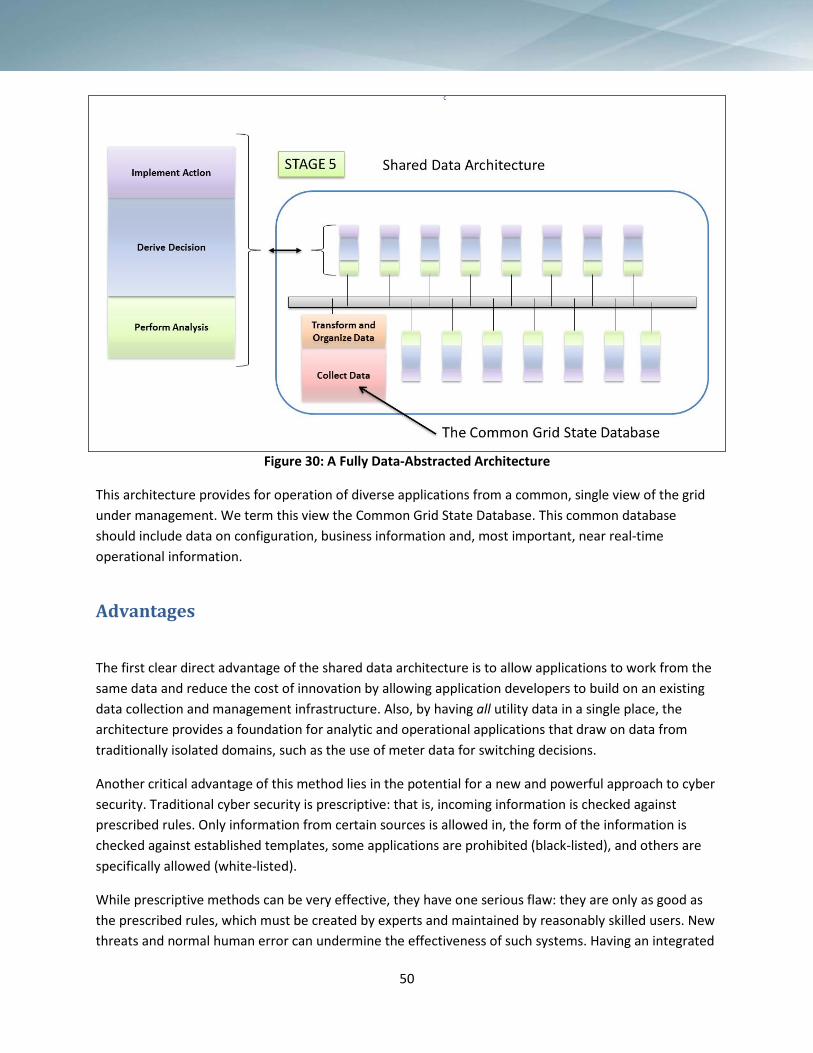
50
Figure 30: A Fully Data-Abstracted Architecture
This architecture provides for operation of diverse applications from a common, single view of the grid under management. We term this view the Common Grid State Database. This common database should include data on configuration, business information and, most important, near real-time operational information.
Advantages
The first clear direct advantage of the shared data architecture is to allow applications to work from the same data and reduce the cost of innovation by allowing application developers to build on an existing data collection and management infrastructure. Also, by having all utility data in a single place, the architecture provides a foundation for analytic and operational applications that draw on data from traditionally isolated domains, such as the use of meter data for switching decisions.
Another critical advantage of this method lies in the potential for a new and powerful approach to cyber security. Traditional cyber security is prescriptive: that is, incoming information is checked against prescribed rules. Only information from certain sources is allowed in, the form of the information is checked against established templates, some applications are prohibited (black-listed), and others are specifically allowed (white-listed).
While prescriptive methods can be very effective, they have one serious flaw: they are only as good as the prescribed rules, which must be created by experts and maintained by reasonably skilled users. New threats and normal human error can undermine the effectiveness of such systems. Having an integrated
51
view of the system suggests a complementary approach to security which, when used in conjunction with the prescriptive systems, can provide much enhanced security. We term this other approach “reactive.” Basically, the Comprehensive Grid State Database provides an overarching picture of the grid at any moment, and for some time prior.
Looking not at prescribed rules, but at the actual state of the grid, it is possible to develop applications that look at the following:
(1) Internal consistency; for example: • Are the reporting entities consistent with the grid and network design? • Are the observed voltages consistent with the load, transformer setting, and switch settings?
(2) Consistency of physical and policy rules; for example: • Are the loads and energy use reported by smart meters consistent with typical residential
usage? • Does a control instruction (e.g., a change in state from a smart meter) come from a person who
typically issues such instructions? (3) Deviations from normal grid operation or information flows, in which the normal is derived
mathematically by observation of normal operations and trends over a period of time
The core concept in the complementary, reactive approach to security is to base detection of possible compromise (physical or cyber) on continuing examination of operations from an analytical and modeling perspective, and integration of algorithms for machine learning. In essence, we are moving toward a truly “smart” grid in the sense of incorporating machine intelligence. The foundation, though, is the reliable and timely flow of comprehensive state information. If the Comprehensive Grid State Database is based on open standards, then many individuals and organizations can engage in the development and improvement of security applications, thus creating a rapidly adaptive system of defense.
52
2.8 Improving Standards
One of the core challenges to a realization of the smart grid, let alone the fractal grid, is the exchange and management of information. Clearly, the volume of data is increasing (estimates range from a factor of 10,000 to 100,000), but changes in the types of information being exchanged also are occurring. Specification of the formats for the exchanges is a particular challenge. Any two technology developers can agree fairly easily on a method to exchange information, or developers of “hub”-type applications, such as meter data management systems, can write interfaces or adaptors to many other technologies—for example, to different kinds of meters. Beyond that level, some middle-ware companies (e.g., TIBCO) have as their core business the development of systems with integrated adaptors to connect multiple disparate systems.
All of these approaches are, in the end, inferior workarounds. The efficient and reliable solution is based on well-established interoperability standards. Interoperability standards:
1. Provide detailed specifications for hardware and software developers to design against, thus cutting development costs and reducing errors
2. Facilitate healthy competition among technology developers by making it possible to swap one component for another, since they have the same (standard) inputs and outputs
3. Improve security
Most important, interoperability standards are based on open discussions of what information really needs to be exchanged to accomplish a specific function, rather than the idiosyncratic views of one organization. Considering the information required for future as well as current functionality lays the foundation for the extension of functionality as control concepts and technical capabilities mature. This extensibility can become lost in the details of specific product design.
Setting Standards
The standards-setting process is long, tedious, and expensive, but the result embodies an enormous amount of hard thinking from parties with different perspectives and knowledge bases. In the area of the fractal grid, the most important standards bodies are the following:
1. The International Electrotechnical Commission (IEC) 2. The Institute of Electrical and Electronics Engineers (IEEE) 3. MultiSpeak
Of these, MultiSpeak seems to be the most agile and fast moving. While sometimes a slow, consensus-driven approach is advantageous for the development and, in particular, the adoption of standards, the concepts for the fractal grid are evolving rapidly, and an agile standards body is essential—as long as it strikes the right balance between agility and rigor.
53
Assessment Of the two interface specification standards examined—MultiSpeak and IEC—it appears that, given the slow development cycles, long implementation times, and lack of adoption—especially within the cooperative community—IEC’s is not the standard of choice. MultiSpeak, on the other hand, is very popular with co-ops, and we are seeing an increasing number of municipal utilities beginning to adopt this standard.
At this point, we must make an observation about the future of these standards and ask a question about the future of any of them, given that tools and technologies now available are capable of handling and managing large amounts of unstructured data, such as social networks. What really makes sense going forward is to consider looking at any future architecture as an “Internet of Things.” Part of the problem with any interface specification is that it attempts to structure data to achieve interoperability when all that really is needed are the data. We are proposing to take a hard look at ways to take advantage of NoSQL data stores, Service Fabrics, and Distributed Data Services; flatten out the data from a hierarchical relationship to more of a peer-to-peer network; and move from Structured Data to Connected Data when this makes sense, doing so incrementally over time.
OSGi and OMG are gaining ground rapidly in other industries with similar if not identical needs. It would appear that we need to take a hard look at the right path for the future—we may be not only way behind on the technology path; we also may be on a path that is not sustainable in the future. More work must be done in this area.
Cooperative Perspective
When co-ops were asked about use of MultiSpeak (co-op survey question C-22), 79% responded that they currently use it. They also noted that the majority of the use was in business-related functions (IT facing, 73%); Work Management constituted 46% of use. Only 46% said that they used MultiSpeak for OT-related functions. 10
When asked about which standards currently were in place (co-op question C-29), 79% again said MultiSpeak; only 7% cited IEC 61968.
The reason most often given for standards adoption was interoperability (36 percent), but 43% said they had yet to adopt standards of any kind (co-op question C-30).
Industry Perspective
The industry had the most to say about standards, as follows: IEC 61968 was ranked first in favorability, receiving a rating of 3.2 out of 4; MultiSpeak ranked last,
receiving 2.8 out of 4. The NIST framework was second, with 3.1 (industry question I-13).
When asked about the reasons they chose one standard over another (industry question I-14), IEC 61968 again ranked highest, with 31% noting Best Integration Flow as the reason.
10 NRECA Survey (performed by Leidos), Quarter 4, 2013.

54
Regarding the question about future standards, such as Web 2.0, the majority of industry respondents said they were followers, at 33%, and 24% said they had no current plans (industry question I-15).
As to membership in standards organizations, 46% responded “none,” and 33% responded “IEC.” Membership in the National Rural Electric Cooperative Association (NRECA) was third, at 16%.
Asked if they have IR&D programs in place, 75% of respondents said they did, and 53% said they used IR&D to address future products, standards, and interoperability (industry question I-17).
Ranked first as the biggest obstacle to standards adoption was loss of competitive advantage, at 22%. All other areas hovered in the 20% range (industry question I-18).
Competitive advantage via innovation on a level playing field was ranked first; 36% chose this response when asked about the best incentive for driving standards adoption (industry question I-19).
Gap Analysis
There are two significant disconnects in this area. First, there is a co-op bias toward MultiSpeak and an industry bias toward IEC 61968. This may be a reason to consider further efforts toward the harmonization of the two standards; however, this needs careful consideration. Second, there is a high level of IR&D activities coupled with a low level of ranking in new technology and standards organization membership.
When comparing co-op and industry perspectives on the requirements, considerable work needs to be done to open up MultiSpeak to the industry. Perhaps NRECA should consider promoting MultiSpeak as a true open source freeware product and devise another way to recoup the investments that would need to be made. MultiSpeak® is important because it is used by more than 900 utilities and, since it is owned by NRECA, can be extended more quickly and with the specific interest of the cooperatives in mind.
One thought is to take an Amazon-type approach, by sponsoring vendor-paid advertisements on the NRECA site in return for free open access to MultiSpeak specifications, and also maintaining a collaboration library of source code for interfaces between various vendor products. This library could be hosted on an NRECA cloud that would provide for security and backup. The NRECA cloud also could be the portal to vendor cloud services, such as the Service Fabric, and such applications as CIS, GIS, and WMS.

55
2.9 Real Big Data Capabilities
Why Big Data Is a Real Issue About five years ago, a common belief existed that the smart grid was a big-data application—that a vast amount of metering and data on consumer energy use at the appliance level would provide for a new paradigm in utility operations, in which load at the micro level would become controllable and a basic central part of utility planning in operations. The concern was that this development would present enormous challenges in data collection, maintenance, and analysis. To date, data collection has not been a major issue, for three reasons:
(1) A vast automation of home and appliances has not materialized. To date, consumer adoption of home energy management systems (HEMS) has been described as “anemic.”11
(2) Vendors and utilities have been slow to develop ways to make use of much of the data that can be collected, so utilities have not made efforts to build the data collection systems to support them.
(3) Even when fully realized, this vision of the smart grid, focused on load information, does not rise to the level of true “big data,” the term used in other industries.
Though utilities have kept up so far, the industry is still moving toward big data challenges.
(1) Though high-data home integration is off to a slow start, researchers still expect the industry to move into a period of rapid growth. Pike Research predicts that the marker will grow at a compound annual growth rate of 38.3%, reaching more than $2 billion in annual sales globally in 2020.12 Google’s recent purchase of Nest for $3.2 billion shows strong interest in HEMS by at least one major player in big data. Other major industrial players, including Honeywell and IBM, are investing in this area. Major suite vendors such as SEDC, NISC, ATS, and Indra are rolling out portal and dashboard software that make detailed information available to consumers; this development should, in turn, drive development of the need for high-volume, high-resolution data.
(2) There is increased deployment of synchrophasors and phasor measurement units. Synchrophasors monitor frequency and phase on transmission lines at a rate of 30 to 120 times per second to aid in the synchronization and integration of grid components, and support forensic analysis to aid future planning and operations. The data capture rate is two orders of magnitude greater than that of historical systems. As distributed generation proliferates, issues of frequency management are becoming a greater concern, particularly when it comes to the islanding and reintegration of the micro-grids. It is widely believed that a new generation of
11 Martin, Richard, Pike Research, http://www.businesswire.com/news/home/20120516005371/en/Slow-Start-Home-Energy-Management-Market-Surpass#.Uy2K6ag7vTo, May 16, 2012. 12 Ibid.
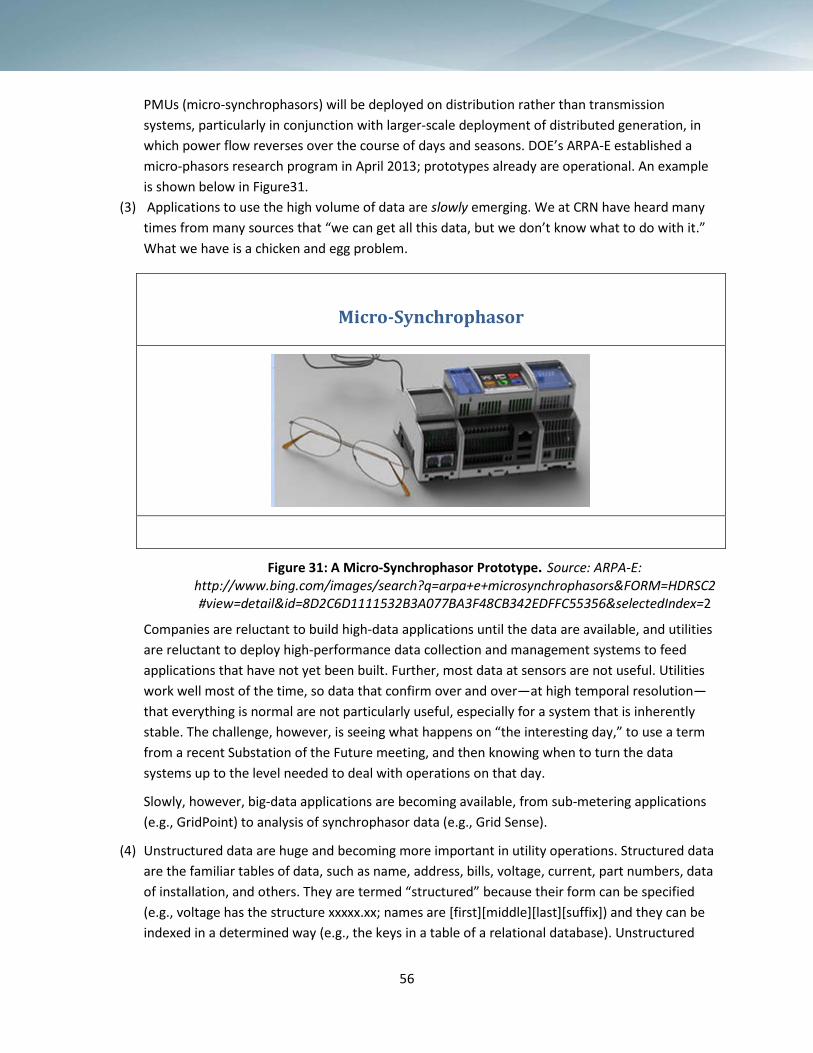
56
PMUs (micro-synchrophasors) will be deployed on distribution rather than transmission systems, particularly in conjunction with larger-scale deployment of distributed generation, in which power flow reverses over the course of days and seasons. DOE’s ARPA-E established a micro-phasors research program in April 2013; prototypes already are operational. An example is shown below in Figure31.
(3) Applications to use the high volume of data are slowly emerging. We at CRN have heard many times from many sources that “we can get all this data, but we don’t know what to do with it.” What we have is a chicken and egg problem.
Micro-Synchrophasor
Figure 31: A Micro-Synchrophasor Prototype. Source: ARPA-E: http://www.bing.com/images/search?q=arpa+e+microsynchrophasors&FORM=HDRSC2#view=detail&id=8D2C6D1111532B3A077BA3F48CB342EDFFC55356&selectedIndex=2
Companies are reluctant to build high-data applications until the data are available, and utilities are reluctant to deploy high-performance data collection and management systems to feed applications that have not yet been built. Further, most data at sensors are not useful. Utilities work well most of the time, so data that confirm over and over—at high temporal resolution—that everything is normal are not particularly useful, especially for a system that is inherently stable. The challenge, however, is seeing what happens on “the interesting day,” to use a term from a recent Substation of the Future meeting, and then knowing when to turn the data systems up to the level needed to deal with operations on that day.
Slowly, however, big-data applications are becoming available, from sub-metering applications (e.g., GridPoint) to analysis of synchrophasor data (e.g., Grid Sense).
(4) Unstructured data are huge and becoming more important in utility operations. Structured data are the familiar tables of data, such as name, address, bills, voltage, current, part numbers, data of installation, and others. They are termed “structured” because their form can be specified (e.g., voltage has the structure xxxxx.xx; names are [first][middle][last][suffix]) and they can be indexed in a determined way (e.g., the keys in a table of a relational database). Unstructured

57
data include emails, drawings, network diagrams, photos, warranty documents, and a host of other data objects whose structure is idiosyncratic or fully unstructured.13
Estimates are that 80% of the information in most organizations is unstructured. While the development of systems for management of unstructured data is not simple, tools are being developed rapidly. The vast majority of data accessible through the Internet are unstructured, but sophisticated systems are emerging to acquire, post, manage, search, and deliver this information.
Overall, even though utilities have managed to date with traditional data systems rather than “big data”–capable systems, big data is coming because of the following:
(1) The use of home and industrial energy management systems is increasing. (2) Very high-volume synchrophasor technology is becoming more common and will proliferate to
distribution systems. (3) Systems and applications to use the data are being developed. (4) Utility data systems are extending to include unstructured data.
General Requirements of a Comprehensive Grid State Database (CGSD)
In the architecture section of this document, we argue that it is necessary to address data collection and management as a critical utility application; we show this as a separate layer (Layer 2) in the general grid abstraction model (Figure32). For simplicity, we refer to this as the Comprehensive Grid State Database (CGSD). We do not envision any organization (utility or vendor) building a truly comprehensive database a priori. We believe, instead, that organizations implementing an integrated architecture initially will establish a good database that can support most applications. The contents of that database likely will resemble a concatenation of the IEC Common Information Model (CIM) and the data fields addressed in the MultiSpeak interfaces and use cases. Over time, however, the data dictionary for the CGSD will grow to include additional types of information. While this can be done at a specific utility to address its particular requirements, requirements shared by multiple utilities should be integrated into an expanding dictionary, supported by a standard organization.
We view the data layer as having multiple components, as shown conceptually in Figure 32 below. Time series databases are shown as cubical solids, while relational databases are shown as cylinders. There is
13 In one sense, a photo or email is structured with a header and payload, but the meaningful part of the payload cannot be determined definitively. Such data can be stored as a binary large object (BLOB), but a collection of BLOBs without substantial metadata is less useful than actively managed unstructured data.
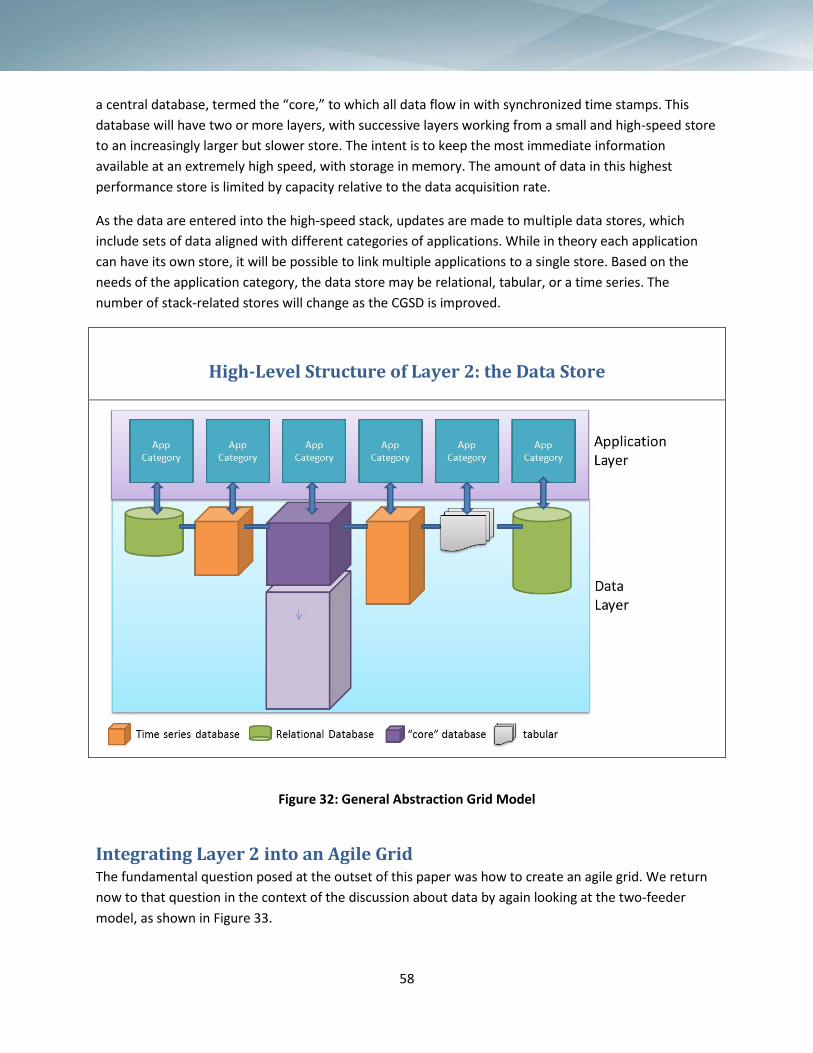
58
a central database, termed the “core,” to which all data flow in with synchronized time stamps. This database will have two or more layers, with successive layers working from a small and high-speed store to an increasingly larger but slower store. The intent is to keep the most immediate information available at an extremely high speed, with storage in memory. The amount of data in this highest performance store is limited by capacity relative to the data acquisition rate.
As the data are entered into the high-speed stack, updates are made to multiple data stores, which include sets of data aligned with different categories of applications. While in theory each application can have its own store, it will be possible to link multiple applications to a single store. Based on the needs of the application category, the data store may be relational, tabular, or a time series. The number of stack-related stores will change as the CGSD is improved.
High-Level Structure of Layer 2: the Data Store
Figure 32: General Abstraction Grid Model
Integrating Layer 2 into an Agile Grid The fundamental question posed at the outset of this paper was how to create an agile grid. We return now to that question in the context of the discussion about data by again looking at the two-feeder model, as shown in Figure 33.
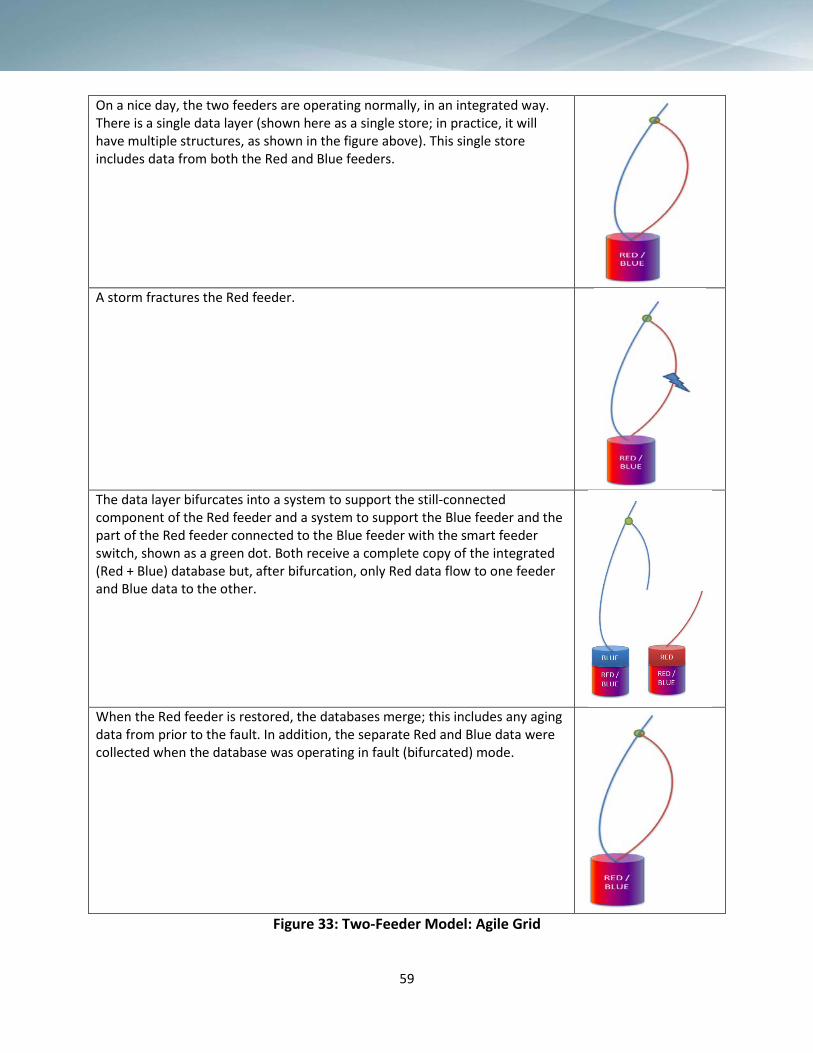
59
On a nice day, the two feeders are operating normally, in an integrated way. There is a single data layer (shown here as a single store; in practice, it will have multiple structures, as shown in the figure above). This single store includes data from both the Red and Blue feeders.
A storm fractures the Red feeder.
The data layer bifurcates into a system to support the still-connected component of the Red feeder and a system to support the Blue feeder and the part of the Red feeder connected to the Blue feeder with the smart feeder switch, shown as a green dot. Both receive a complete copy of the integrated (Red + Blue) database but, after bifurcation, only Red data flow to one feeder and Blue data to the other.
When the Red feeder is restored, the databases merge; this includes any aging data from prior to the fault. In addition, the separate Red and Blue data were collected when the database was operating in fault (bifurcated) mode.
Figure 33: Two-Feeder Model: Agile Grid

60
Building the Database The complex data system described above involves replication, time series, and relational models; a capability to create multiple, parallel stores concurrently; and very high performance. While such a system can be created using individual components, the more logical approach is to take advantage of a major high-performance computing infrastructure effort. Hadoop is the best candidate.
The Apache™ Hadoop® project develops open-source software for reliable, scalable, distributed computing. The Apache Hadoop software library is a framework that allows for the distributed processing of large data sets across clusters of computers, using simple programming models. It is designed to scale up from single servers to thousands of machines, each offering local computation and storage. Rather than rely on hardware to deliver high availability, the library itself is designed to detect and handle failures at the application layer, thus delivering a highly available service on top of a cluster of computers, each of which may be prone to failures.
The project includes the following modules, shown in Figure 34:
Core Components of Hadoop
Hadoop Common: The common utilities that support the other Hadoop modules.
Hadoop Distributed File System (HDFS™): A distributed file system that provides high-throughput access to application data.
Hadoop YARN: A framework for job scheduling and cluster resource management.
Hadoop MapReduce: A YARN-based system for parallel processing of large data set.
Apache Project Related to Hadoop
Avro™: A data serialization system.
Cassandra™: A scalable multi-master database with no single points of failure.
Chukwa™: A data collection system for managing large distributed systems.
Hbase™: A scalable, distributed database that supports structured data storage for large tables.
Hive™: A data warehouse infrastructure that provides data summarization and ad hoc querying.
Mahout™: A scalable machine learning and data mining library.

61
Pig™: A high-level data-flow language and execution framework for parallel computation.
Spark™: A fast and general computing engine for Hadoop data. Spark provides a simple and expressive programming model that supports a wide range of applications, including ETL, machine learning, stream processing, and graph computation.
Figure 34: Hadoop Modules. Source: http://hadoop.apache.org/

62
2.10 High-Performance Communications
The grid of the future will be data driven to a much greater degree than the current grid. Loads, VAR, and controls will be adjusted frequently in response to immediate conditions and near-term forecasts. There have been many predictions of an increasing volume of data associated with the smart grid, with number such as 10,000x and 100,0000x being thrown around. In practice, we have found that these estimates are little more than back-of-the-envelope calculations, which in any case have not yet been borne out.
NRECA is just completing a multi-year smart grid project at multiple utilities. At the start of the project five years ago, the co-ops identified the “massive” data requirements of the smart grid. In the course of the project, communications was a major issue, as expected, but these needs were met with relatively straightforward upgrades, using commercial, off-the-shelf (COTS) technology.
Roughly, we can guess that the volume of data will increase by a factor of 3,000 in moving from monthly readings to 15-minute readings at meters. This increase can be accommodated by current technology and reasonable, though not trivial, upgrades to communications systems. The next spike in data will come from applications with high temporal resolution, such as fault anticipation and phasor measurement units (PMUs) on distribution systems, which likely will be required for integration of microgrids.
Without a doubt, the volume of data will increase as we more actively manage the grid, although the volume remains to be determined. One factor that will reduce the volume, however, is moving toward “reporting by exception”; that is, filtering out and not transmitting data of no operational value. For example, meters can report unexceptional loads that are much the same hour after hour for most of the time when load management is not an issue. PMU data are only of interest when there is a problem. It is not necessary to report nominal values with high frequency. By a simple estimate, only about 0.2% of the data collected are needed if control and management systems can be designed to work only from the exceptional data. This reduction (which must be refined) translates in a large degree to reduced storage and certain other computing requirements, but it does not translate to a reduction in processor capacity or bandwidth.
At a recent meeting of NRECA’s Substation of the Future team, one participant noted that capacity is not driven by the average “sunny” day, but the “interesting day.” That is, communications capacity must be built to transmit and computing systems to process the volume of data needed for rapid decision making when the grid is under stress. The entire area of communications within a utility needs substantial research in two areas: accurately predicting the communications requirements (volume and other factors on the interesting day) and identifying the technology needed to meet these requirements.
The Substation of the Future team has begun critical work in this area by developing an integrated taxonomy of communications functions. This is shown below in Figure 35. This work will be extended so

63
as to characterize the type and volume of data required as well as to define the other attributes. There are other models of utility function—among these, the MultiSpeak architecture shown previously and the less complete but more commonly known NIST architecture, shown below in Figure36. Either of these can be used to develop a communications model and were considered in developing the Substation of the Future (SOF) taxonomy. The SOF Taxonomy is, we believe, the best starting point.
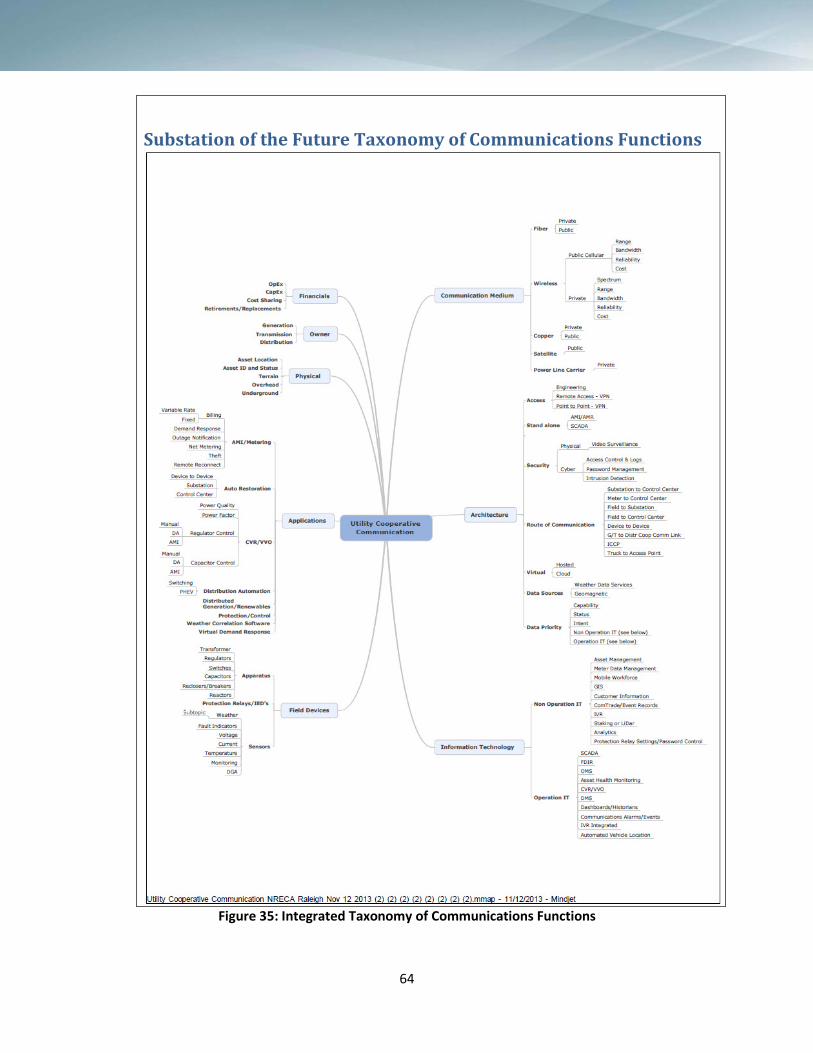
64
Substation of the Future Taxonomy of Communications Functions
Figure 35: Integrated Taxonomy of Communications Functions

65
NIST Grid Reference Architecture
Figure 36: NIST Grid Reference Architecture
66
2.11 Advanced Analytics
Introduction The central defining differences between the older, electromechanical (less controlled or uncontrolled) grid and the future agile grid are:
1. Distributed generation 2. Better knowledge of state 3. More precise control to provide for agile reconfiguration and optimization of control
Basically, the future grid will be able to do more to adapt to changing conditions, but advanced analytics is a key element of translating better state information into decisions on how to deploy distributed generation and employ the advanced control. When the future grid is more fully realized, there will be an enormous amount of data available to analyze dispatch and control options. Making optimal use of those data requires complex algorithms and a means to execute them in a timely and secure manner. Security and the computing infrastructure are addressed in other sections of this paper. The algorithms and modeling tools are a challenge in themselves, however.
Concurrent Development The development of tools for planning and operations must necessarily proceed apace with the availability of data and the means to make use of the information. Automated control systems run on data, so there is no point in building control systems for controls not yet deployed. Distribution systems that act on phasor measurements need PMUs, and the technology has not yet been developed to synchronize independent oscillators such as microgrids and the systems to which they are connected.
Prototype Analytics with Modeling Modeling is a form of analysis. Specifically, it is analysis detached from operations, making it possible to explore alternative scenarios that can represent real or speculative configurations and conditions. Detaching analysis of operations also greatly relieves the pressure to execute quickly enough for real-time control. Modeling provides a sandbox for testing algorithms and refining both the algorithms and computing infrastructure. When made more accurate and faster, modeling can provide for the development, testing, and validation of control systems.
Data is the Challenge One lesson learned from modeling is the challenge of feeding data to and calibrating the models. While the focus in the modeling community typically is on the development of solution algorithms, experience reveals that only about 5% of the time during a modeling analysis is spent this way. Roughly 80% is spent on gathering, validating, and organizing the data. The balance (15%) is spent on analyzing the results. Of course, for any particular analysis, these percentages can vary very widely.
The critical point is that the hardest part of analytics is getting the data right. We believe that the key to addressing this challenge is that data collection and management should be treated as a fundamental problem independent of the application. Building a data application to support multiple applications makes sense. Many analytical applications use the same data. An example of this would be weather

67
data—weather doesn’t change from application to application, and neither should the data representing it. Similarly, there should be one and only one data representation of the grid, customer base, rates, economic factors, etc. It is efficient to build one database with a comprehensive set of all data to be shared by multiple applications; it ensures consistency in the data used by the different applications.
Turning Analysis into Decisions The purpose of analysis is to enable better decision making. In planning, this is related primarily to the design of changes to the physical infrastructure and such major business decisions as longer-term power purchase or sales agreements. In operations, the decisions are about switch settings on the electrical system and configuration of the information and control systems. Technology is evolving to allow better control of both the electrical grid and the overlying information systems. This includes such technology as smart feeder switches on the electrical side and software-defined networking. There is still a challenge in bridging the gap from the analysis to the controls.
There are two general approaches to filling the gap: human-in-the-loop and automated. In automated systems, the control instructions are generated by computers and implemented directly, without human intermediation. With a human in the loop, the analytics generate a tabular or graphic display that summarizes the state, possibly compares options, and possibly makes a recommendation. Based on this information, the human implements a control strategy. Over time, it is likely that the quality and relevance of the information delivered to human operators will improve so they can make more informed decisions, and more systems will be automated.
Technical Challenges Two key challenges in building advanced analytics into grid control are, as discussed above, providing timely, accurate, and complete data, and turning analysis into decision and action. The focus in the analytical community, however, usually is on the analysis. Modelers, as opposed to those building operational systems, can afford the luxury of slow-paced and expensive data development, and the analysis can be made operational through a deliberated process supported by ancillary analysis. In this white paper, we develop a strategy to plug the data and decision gaps, but even presuming that these problems are solved, substantial challenges remain in improving the performance and utility of the actual analytics. This section addresses those challenges.
Closed Source Analytic results in the electricity industry are not reproducible.14 Even when studies are published, the source code is not. This is most surprising in large, federally funded studies.15 Without publicly available data and source code, analytics approaches are not shared but, more important, they are not verified on multiple varied data sets. Furthermore, the many competing approaches developed in this environment lead to confusion over terminology and approach, hindering confidence in the analytical results.
14 See http://www.nrel.gov/electricity/transmission/western_wind.html. 15 See https://www.youtube.com/watch?v=Mn0p7i2Xyik.
68
Data Silos Utility data systems are heavily siloed, as shown in Figure 37. Data are spread out among multiple systems of record.16 When data are integrated, it is done with separate efforts for each pair of systems, and these efforts are duplicated at multiple utilities. There are multiple competing interoperability standards, versions of those standards, and support levels that vary by vendor and product. Security standards and network resources vary widely: for example, between SCADA's real-time, high-security needs and engineering analysis systems' location on a planning engineer's personal computer. All of these problems combine to make a snapshot view of an entire utility's current state impossible.
Analytics Silos Analytics efforts in the research community do not interoperate, despite a clear need. Sandia's storage models will not work with GridLAB/OpenDSS/Matpower. Distribution and transmission models make separate simplifying assumptions that are incompatible with one another.
Inaccurate Load Models Load models are difficult to create, even when sensor data are widely available from SCADA and AMI systems. The current standard for load models are single-point-in-time peak and average load from billing systems or, for large transmission studies, load shapes; developing these models takes weeks of engineering effort for each system. This tedious process results in models incapable of capturing voltage effects on load, much less responses to demand-side management controls. With increasing penetration of intermittent generation, energy storage, and solid state electronics loads, these models will not be able to predict system behavior.
No Automatic Data Cleansing There are no products for continuous improvement of data quality across multiple systems. Errors in GIS and staking frequently are caught only in engineering analysis when load flows fail. Disconnected customers in billing systems cannot be removed automatically from operations models. Financial variables are exported from accounting systems via spreadsheets without references to their source. Even if automated processes for spotting these discrepancies were implemented, they could not be deployed.
Weak Graphical User Interfaces Tools for non-programmers to manipulate extremely large vector data sets do not exist. A utility with all of its connected hardware encompasses a data set with hundreds of millions of features; this is not supported even by the most sophisticated commercial solutions from ESRI, Google, etc. Situational awareness in a utility requires monitoring a number of systems with separate interfaces. Despite these problems, the geographical nature of utility service makes visualizing the current utility status a simple design problem.
16 See image in Figure 37.

69
Key Algorithms Are Slow Power flow performance, despite decades of earnest research, still results in models that utility engineers struggle to calculate overnight. Moreover, current best approaches do not achieve speedups on multi-core and multi-processor architectures, where all commercial CPU gains are made and all supercomputing resources are available. This problem will not be solved by stagnant models; loads, controls, and generation are becoming more complex, not less.
No One Knows What Analytics Are Worth What are the utility analytics software products available, and how much is each one worth? Tracking web requests lets us know that 10.68% of all personal computers are running Windows 8,17 and Microsoft financial statements lets us know that they have not turned a profit on that version yet.18 In the utility world, however, we do not even know if there are more PSSE or Power World users, much less what each package ultimately is worth.
No Credible Big Data Concepts in the Utility Space Should utilities prepare for large data volumes? Web services, even those run by a single individual, have been dealing with big data problems for decades.19 However, serving web pages must scale to 7 billion potential users; utilities serve their fixed customer base on the order of 10k−100k users. Phasor data has been cited as a source of greatly increased data volumes; however, the value of moving and aggregating these data has not been demonstrated. There are not, at yet, proven models of how phasor data can be used at the transmission level. There is no agreed-upon concept of how utility network services and databases will need to handle rates beyond megabytes per second and volumes beyond terabytes.
Streaming Data Still Uncommon There is no bridge between energy information systems and analytics that can operate on streaming data. Existing solutions are not built for streaming, elastic data flows.
17 See http://www.netmarketshare.com/operating-system-market-share.aspx?qprid=10&qpcustomd=0.
18 See http://www.microsoft.com/investor/EarningsAndFinancials/Earnings/PressReleaseAndWebcast/FY14/Q2/default.aspx. 19 See http://en.wikipedia.org/wiki/Slashdot_effect.
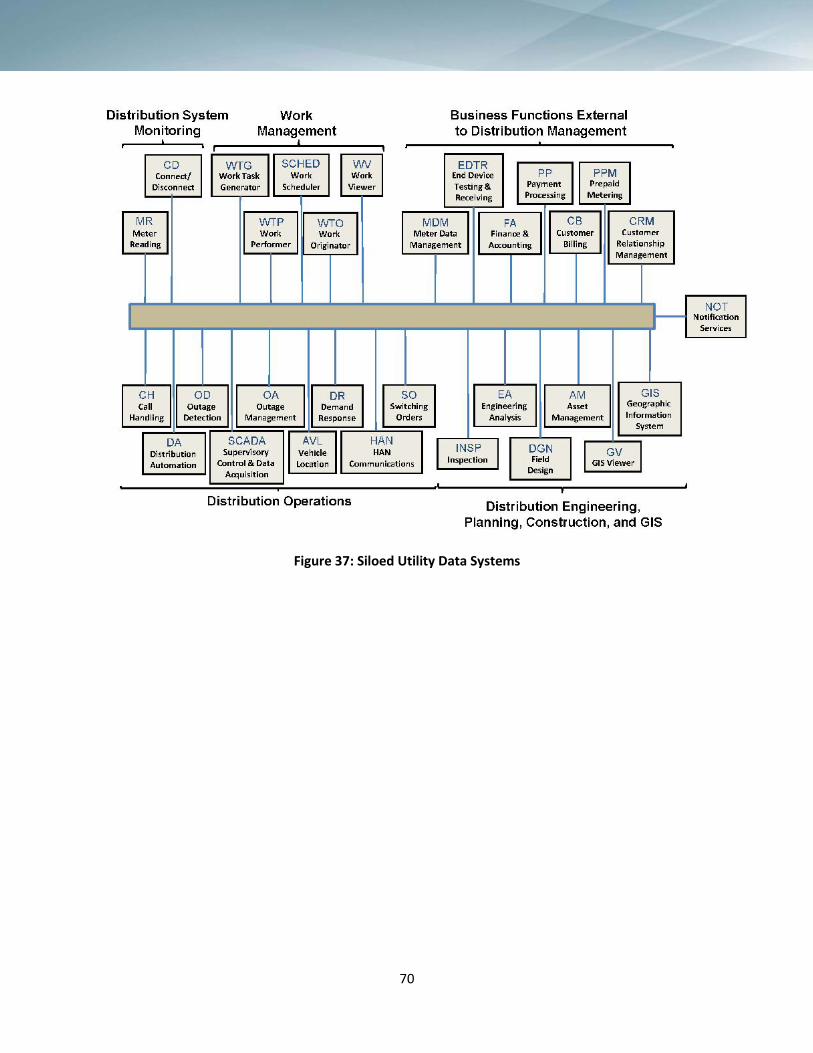
70
Figure 37: Siloed Utility Data Systems

71
Part 3 The Next Steps:
The Essence Project and Beyond

72
Transition Utilities are complex machines that must operate with an astoundingly high level of reliability. Ernest Moniz, the Secretary of Energy, has described the U.S. electrical grid as “a continent-wide machine of immense complexity that is at its best when it is invisible.”20
Neither this system, nor any substantial part of it, can be replaced wholesale. It is essential that any evolution to a new architecture must be:
(1) Incremental (2) Testable (3) Not disruptive of current operations
To that end, we propose that the data collection for the CGSD be accomplished initially by an overlay of the current grid, capturing sensor and control data from the existing control network by a combination of passive monitoring and some in-line measures, such as SPAN ports (Catalyst Switch Port Analyzer). In this way, the database and related analytical components will be implemented in steps, with no impact on operations. As the capabilities of the new systems expand, they can capture more data, approaching the ideal of total information capture.
Initially, this CGSD would have no direct role in control. Maintaining it as a system separate from the actual control systems would provide an independent check on information, alerting officials if there is any suspicious deviation from normal operation. In this way, the conventional systems would be in place to deal with operations under fault conditions. Over time, however, as the CGSD approaches its complete state and the applications (and devices, extending to SCADA) increase in functionality and prove their reliability, the GSCD-based system gradually can assume an operational role and eventually replace legacy systems.
The Essence Project The Essence Project is directed at the development of an advanced cyber security system that breaks, in a fundamental way, from the traditional, prescriptive perspective in which the user is required to establish fire wall rules, white lists, and black lists. The Essence Project, which is being executed by NRECA, with substantial support from the Department of Energy, will substantially advance and prove the Shared Data Architecture for the Grid.
In designing Essence, the team began with a strong abstraction model. Abstraction models divide a system into discrete components (or layers), which are defined by their functionality and, more precisely, by strict specification of the form and content of the information coming into the layer and delivered to other parts of the system. This strict, well-defined definition creates a level of independence between the layers, so that changes within a layer still conforming to the I/O
20 Keynote, IEEE Power Engineering Society Conference on Innovative Smart Grid Technologies (ISGT), Washington DC, February 19, 2014.
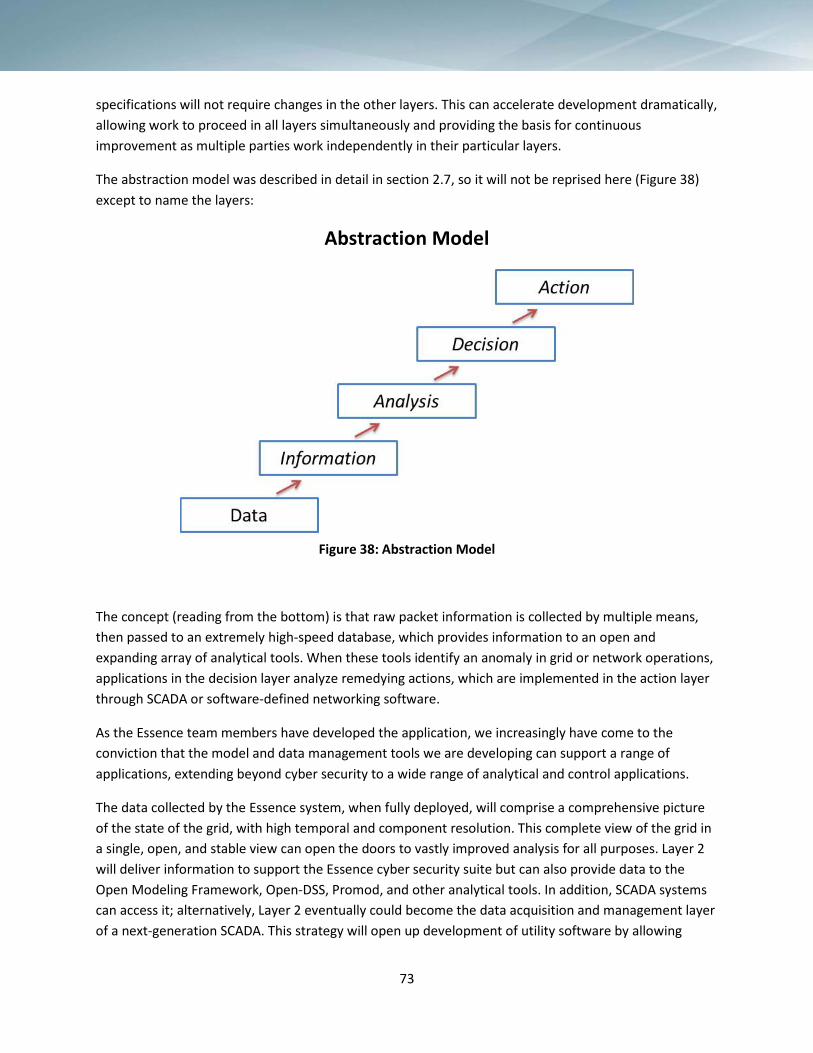
73
specifications will not require changes in the other layers. This can accelerate development dramatically, allowing work to proceed in all layers simultaneously and providing the basis for continuous improvement as multiple parties work independently in their particular layers.
The abstraction model was described in detail in section 2.7, so it will not be reprised here (Figure 38) except to name the layers:
Abstraction Model
Figure 38: Abstraction Model
The concept (reading from the bottom) is that raw packet information is collected by multiple means, then passed to an extremely high-speed database, which provides information to an open and expanding array of analytical tools. When these tools identify an anomaly in grid or network operations, applications in the decision layer analyze remedying actions, which are implemented in the action layer through SCADA or software-defined networking software.
As the Essence team members have developed the application, we increasingly have come to the conviction that the model and data management tools we are developing can support a range of applications, extending beyond cyber security to a wide range of analytical and control applications.
The data collected by the Essence system, when fully deployed, will comprise a comprehensive picture of the state of the grid, with high temporal and component resolution. This complete view of the grid in a single, open, and stable view can open the doors to vastly improved analysis for all purposes. Layer 2 will deliver information to support the Essence cyber security suite but can also provide data to the Open Modeling Framework, Open-DSS, Promod, and other analytical tools. In addition, SCADA systems can access it; alternatively, Layer 2 eventually could become the data acquisition and management layer of a next-generation SCADA. This strategy will open up development of utility software by allowing

74
…people to work in one or two layers if that is their preference. Further, it will allow more extensive testing, and make more and better real data available to researchers. The expanded abstraction model is shown in Figure 39:
Expanded Abstraction Model
Figure 39: Expanded Abstraction Model
From a practical perspective, the CGSD must be built on a common information model and messaging models. In this, the team is looking to the Common Information Model based on IEC 61958, IEC 61968, and IEC 62325, and MultiSpeak Version 4.
The Essence Project described here is a perfect pilot for the agile grid architecture. We will build the full stack, but only with the following three applications:
(1) An application that applies predetermined rules and policies to network traffic (2) An application that maps the network being protected in real time to detect changes (3) A machine-learning application that characterizes normal operation of the grid and detects
anomalies
75
Demonstration of the Architecture Beyond Cyber Security
The Essence Project, described in the previous section, will implement a pre-commercial version of an advanced grid application for cyber security. The basic five-tiered architecture of the project can support a wide range of utility applications beyond cyber security, but it also will provide a sandbox to prove and improve the concepts, and further provide a convincing demonstration of the value of the Essence architecture. The project is well underway.
The next step is to take the concept beyond cyber security. This extension necessarily will require a community beyond NRECA:
1. The scope of the development of a new architecture is substantially beyond the capabilities of any one organization. It requires an immense range of expertise, from an understanding of electrical sensor and control technology, to utility communications, messaging protocols, and interoperability standards, to cyber security, to ultra-high speed databases, and a host of other domains. There are only a few organizations (on the scale and breadth of General Electric) that could muster all of the required technical skills. NRECA is not one of this elite group, although we have shown facility in assembling teams, such as for the Essence Project.
2. No organization has a monopoly on good ideas. We must operate the project on the principle that all of us together are smarter than any of us individually. The final architecture and demonstration will benefit from creative and open engagement of people with diverse perspectives.
3. The technologies developed in this effort will succeed only if they are adopted by vendors, consultants, service providers, and utilities. A solution, however technically elegant, will fail if it does not gain widespread acceptance, both to create a first generation of commercially available products and to continue investment in the technology over the decades of its relevance.
At this point, NRECA is building a substantial consortium of companies committed to working together to develop the next-generation grid. This is a consortium organized around the Security Fabric Alliance, which is committed to building a demonstration of the platform in response to the Smart America Challenge, an initiative begun by the White House and administered by the National Institute of Standards and Technology (NIST). The Smart America Challenge encourages industry groups to demonstrate substantial extensions and improvement to the critical infrastructure of the United States.
Reiterating the theme of this paper, the demonstration will demonstrate the next-generation grid by addressing the 10 critical areas for change and improvement shown in Figure 40:

76
Foundations of the Next-Generation Grid Distributed Generation
Microgrids Segmentability, Agile Control
Fractal Construction An Internet You Can Trust
Advanced VAR Control and Solid State Power Electronics
Advanced Architecture Improving Standards
Real Big Data Capabilities High-Performance Communications
Advanced Analytics Figure 40: Foundations of the Next-Generation Grid