Achieving Enhanced Nutrient Removal and Additional
23
Achieving Enhanced Nutrient Removal and Additional Capacity at Low Capital Costs Wayne D. Simpson, PE, BCEE Senior Associate, The Alaimo Group 200 High Street Mt. Holly, NJ 08060
Achieving Enhanced Nutrient Removal and Additional Capacity at Low Capital Costs
Wayne D. Simpson, PE, BCEE Senior Associate,
The Alaimo Group 200 High Street
Mt. Holly, NJ 08060
Presenter
Presentation Notes
Thank you Tim and good morning everyone. When I prepared this first slide, it was several months after I had written the abstract for submission. As I looked at the slide on the computer screen for the first time, I thought, “Whoa, what did I do? That must be the Holy Grail of wastewater professionals.” Every conference I’ve been to has had at least one presentation with a similar title. But, given the current headlines, it’s a topic that I feel must be kept in the forefront.
Turmoil Over City Water Rates - Post-vote Fallout Begins The Times, June 17,2010
Clark Businesses Complain About Rising Sewage Rates The Star-Ledger, February 24, 2010
N.J. Gov. Christie Signs 2 Percent Property Tax Cap Bill The Star-Ledger, July 13, 2010
As we all know, the sour national economy is putting a squeeze on everybody. And this time government institutions are not insulated from this squeeze. All departments have been asked to do more with less. And some are now being asked to do less with even less. But that’s not true for the wastewater utilities. They are not allowed to do less.
Rolling Back Environmental Protections Won't Right Our Economic Ship The Times, March 22, 2011
N.J. Lawmakers Consider Barnegat Bay Clean Up Bills The Star-Ledger, August 11, 2010
The pressure is still on to keep our environmental protections in place. POTW’s and privately operated plants are still being required to meet strict discharge requirements. National programs such as the Chesapeake Bay Initiative and, in our home state, the debate over how to preserve and improve the Barnegat Bay loom over us with the threat of even stricter discharge requirements. In both instances, the need to restrict non-point sources of pollution is recognized, but the safety valve for when efforts to do so fail is to ratchet down on the point sources, that is the public and privately owned treatment plants.
Additional Constraints on Treatment Performance
Aging facilities No room to expand Increasing waste strength Energy demands
In addition to these global concerns, our industry has its own set of challenges to accomplish its mission in the near future. Many of our facilities are now twenty to thirty years old and struggling to maintain the designed performance without increasingly high O&M budgets. Since there is virtually no vacant land remaining in New Jersey, especially in the areas adjacent to treatment facilities, it is becoming increasingly difficult to add new process tanks and buildings. And, of course, the costs of power to pump and aerate are gobbling up much greater chunks of the operating budgets. But there is also a more recent phenomenon that bears watching since it could add to the stresses already felt by the operating staffs. As low and even no-flow plumbing fixtures are installed throughout our communities, there have been some reports of a negative impact being felt by wastewater utilities. The City of San Francisco recently reported problems with inadequate flushing velocities in some of its sewer mains due to low flow fixtures that led to numerous odor complaints. And, at a turnpike rest area in Pennsylvania, the installation of a completely no-flow toilet system has led to waste strengths that are three to four times normal.
So, with that background, I’d like to tell you about the Flywheel Process. It’s a patent protected wastewater treatment process that’s being developed by Bill Smith of Enviro/Sci Corporation, a small Pennsylvania company that provides assistance to owners and operators of wastewater treatment facilities. I became aware of Bill and his company over twenty-five years ago as we sat across the table from each other in a dispute regarding one of my clients. I’ve come to appreciate how much Bill loves to solve wastewater related problems and just how far outside of the box he can go. The path that has led him to the development of the Flywheel Process, however, is a classic example of “Necessity being the Mother of Invention”. The Flywheel Process has derived its name from Bill’s observation of the difference between the small wastewater treatment plants that he usually is called in to assist and the larger regional plants. At a large plant, there is a sufficiently large biomass population to overcome sudden, short term variations in waste strength, T or toxic discharges. This is not so at the smaller plants. So he needed to develop a flywheel of sorts to help these plants minimize their variations in effluent quality when they are subjected to variations in waste strength, T and toxic loads. The resulting solution has received two patents for the methods employed to create a flywheel effect and one for the PLC controller that assists the operator in its day to day implementation.
The methods described in the patents serve to increase the surface area available for biological growth and in turn, increase the biomass present in the process. This increase in biomass is achieved without the usual side effects of excessive foaming or settling upsets. And while some plastic media is employed by these methods, a far lesser volume of media is required than for the IFAS or MBBR processes. As I will explain in a little while, the conditions under which the process was developed necessitated treating very cold wastewater. And we’ve seen great results at T < 8° Celsius. In addition, we’ve seen that biological performance is significantly better at more normal temperatures.
What we have observed so far with this process is that it promotes nitrification and it also promotes denitrification. In the current plant, this occurs mostly through the mechanism of simultaneous nitrification/denitrification, but this is not necessarily required to see benefits from the process. We’ve seen that the process can make a plant resistant to shock loads and we’ve seen that, when a plant is upset by a toxic discharge, it shows a superior ability to recover quickly and return to compliance. We have one documented instance where the process had to undergo a total plant restart and was back in compliance within 28 hours. The process improvements have been made without significant increases to the aeration requirements of the plant and, in the current plant, with a significant decrease in overall energy requirements.
Development History
A 100,000 gpd SBR plant owned by a private utility.
Chronic non-compliance. Influent temperatures as low as 4° C. Conventional process modifications failed. Immersion heaters installed.
The process has been developed at a 100,000 gpd sequencing batch reactor activated sludge plant. It is located in the Pocono Mountains and owned by a private wastewater utility. The plant had been experiencing difficulties meeting its discharge limitations, especially in the winter months. The plant serves a small community and a school. The school’s wastewater is transmitted to the plant in a 15,000 foot long force main through bedrock that serves as a chiller during winter months. As is the case with wastewater from schools, it has a very high concentration of ammonia nitrogen. In response to the plant’s inability to meet its permit requirements, the operators and Bill made several conventional process modifications without success. The utility’s in-house engineer recommended the installation of immersion heaters and these were eventually installed. They did help the plant meet compliance during the winter months but at a very significant energy cost.
Presenter
Presentation Notes
The next two slides show the plant in the middle of winter. They remind me of a workshop I attended at WEFTEC out in San Diego. The instructor was a renowned professional in our field and he told us that trying to get the bacteria to remove nitrogen at temperatures below 8° Celsius was like trying to treat an ice cube.
Presenter
Presentation Notes
And this plant, with its outdoor process tanks, does resemble an ice cube.
As you can see from this chart, the reactor temperatures at this plant drop below 8° Celsius from about mid-November to early December and stay there until April. This is why the plant experienced such difficulties meeting its winter ammonia limit of 9 mg/L and year round nitrite/nitrate limit of 14 mg/L. Especially since the wastewater from the school had ammonia nitrogen concentrations that were over twice as high as the concentrations expected by the plant’s design engineer.
Process Components
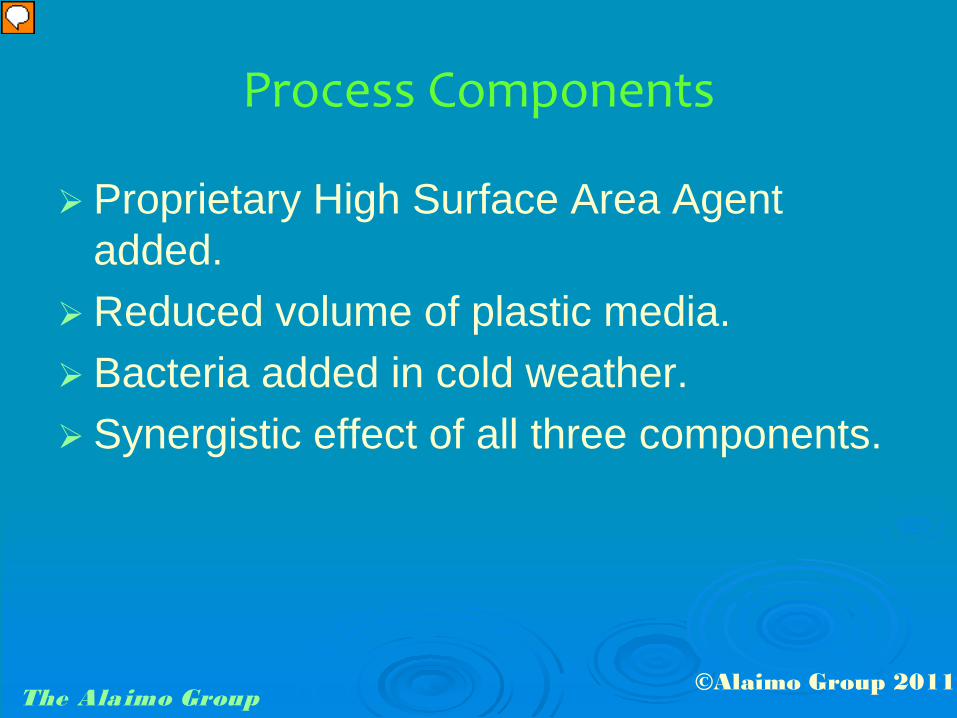
Proprietary High Surface Area Agent added.
Reduced volume of plastic media. Bacteria added in cold weather. Synergistic effect of all three components.
The components of this process weren’t brought together all at once. Rather, they had each been tried independently without much success. A proprietary high surface area agent was first used in an effort to help settling. While it did help somewhat with Suspended Solids and BOD removal, it had little effect on nitrogen concentrations. In an effort to increase the biomass in the reactor, plastic media was added. The tricky part of this effort was trying to keep the media from the decanter and the submersible sludge wasting pumps. A method was devised to keep the media in place, but this limited the media volume to two percent of reactor volume as opposed to the twenty to fifty percent typical in IFAS systems. Supplemental bacteria was also added in an effort to Improve nitrification and denitrification. Alone, none of these process changes helped accomplish the goal. When combined, however, the three elements worked synergistically to bring nitrogen levels within compliance.
This chart shows a comparison of the effluent concentrations before the process improvements were added and during a side by side comparison of the plant with and without the improvements. This side by side testing was performed during the first year of implementation. I’ve selected data from a time of year when reactor temperatures were approximately 10° C. These are more like the winter influent temperatures that my New Jersey clients usually experience for comparison here. The top line, in orange, shows the results prior to any process improvements being implemented. You can see that, while there is some conversion of ammonia to nitrate/nitrite nitrogen, the total nitrogen in the effluent remains quite high. The data shaded yellow represents the treatment train without the improvements at a later period of time. The influent ammonia levels happened to be lower during this period, but we still see incomplete nitrification and total effluent nitrogen levels higher than the permit limit. The data shaded blue is from SBR Train 2 with the improvements added treating the exact same influent as SBR Train 1 during the same period when the yellow shaded data was collected. One can see nearly complete nitrification and the effluent well within the permit limits of 9 mg/L NH3 and 14 mg/L NO2/NO3. Overall, we see over forty-five percent improvement in the plant’s nitrogen removal capabilities at about 10° C.
Process Performance
Heaters have not been employed during winter.
Bacteria added below 12º C. At temperatures above 12º C, the plant
Since the improvements were added, the plant has been operated with a MLSS of approximately 4,000 mg/L that is approximately seventy percent volatile. It has a calculated mean cell residence time of about forty days. But yet there have been no foaming or settling problems observed. The heaters were turned off as soon as it became apparent that the process modifications were bringing nitrogen levels down and haven’t been used since. It has been observed that, during the warmer months of the year, no supplemental bacteria are necessary to see improved performance. In fact, we’ve seen significant improvements in the plant’s performance at normal wastewater temperatures. So much so that the very high influent NH3 concentrations have been brought down to the range of 2 – 4 mg/L total effluent N on a consistent basis.
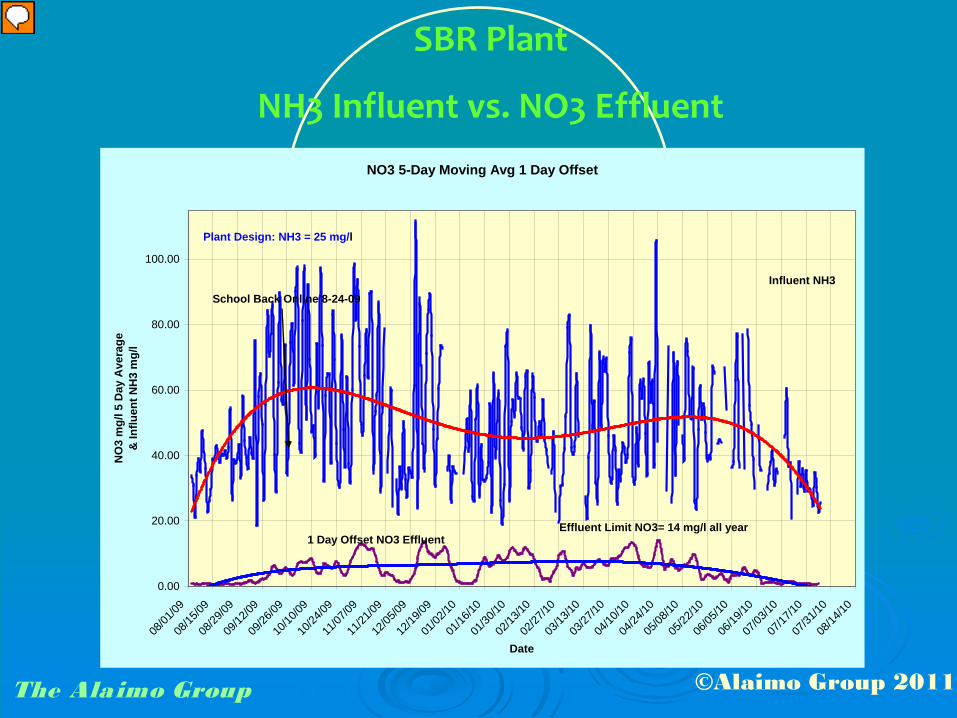
This chart represents one year of influent ammonia and effluent nitrates at the plant after the improvements were made. The red line tracks the five-day running average influent ammonia. As you can see, we’ve experienced some very high spikes of influent ammonia, some over 100 mg/L. During this period, the average influent ammonia concentration was approximately 58 mg/L. This at a plant that was designed for an influent ammonia concentration of 25 mg/L. The purple line represents daily effluent nitrate concentrations and the associated blue line the five-day running average for effluent nitrates. We had consistent compliance with the permit limit of 14 mg/L and, as T and influent ammonia levels approach normal, effluent concentrations fall below 5 mg/L.
SBR Plant
NO3 removed vs. NH3 Removed
1 Day Offset NH3 Removed vs NO3 RemovedAugust 3, 2009 to July 30, 2010
This chart was developed to assess the degree to which ammonia that had been converted to nitrates was eventually converted to nitrogen gas. While a perfect process would show 100% conversion, we’re pretty happy with the approximately ninety-one percent conversion and a very tight fit of the data to the trend line.
Another exercise we’ve performed to evaluate the process was to compare the specific denitrification rate observed to values presented in reference publications. This was a little tricky since we wanted to see just how well the process was doing in the “ice cube” range. Data was collected at a time when the reactor temperature was 4° Celsius, the temperature that one usually keeps the refrigerated sampler. Samples were taken during the reactor’s pre-mix cycle with no aeration, just mixing. The samples were analyzed for nitrates and the SDNR was determined. You might notice that the starting NO3 concentration was already quite low. This is typical for an SBR’s pre-mix cycle since the remaining wastewater in the reactor has the same levels of nitrate as those in the decant from the last batch.
The SDNR was then calculated from the results of this test. The reactor volume is 53,250 gallons and each batch is about 12,500 gallons. The nitrate concentration at the start of the fill cycle was approximately 4.7 mg/L and the mixed liquor volatile suspended solids concentration was approximately 3,500 mg/L. An equivalent mass of 75.11 lbs. NO3-N per day was removed during the test, leading to a SDNR of 0.0483 lb NO3-N removed/lb MLVSS/day. Now reference publications such as Metcalf and Eddy will list a typical SDNR of 0.045 lb NO3-N/lb MLVSS/day at 20° Celsius. When adjusted for a reactor temperature of 4° C, the predicted SDNR would be 0.0298 lb. NO3-N/lb MLVSS/day. While this predicted value is not truly significant due to lack of data at this temperature range, we did experience a great improvement over the expected performance.
The Flywheel Process has proven to offer significant savings at the plant in which it was first installed. This table compares capital and operating costs at the plant for both the remedy first recommended by the owner’s staff engineer vs. the costs to install and operate the Flywheel Process. Although the Flywheel Process cost approximately $5,000 more to install than the immersion heaters in one train of the plant, nearly $35,000 savings in annual operating costs were realized. So the process paid for itself in less than two months. Since the plant is also operating well within its permit requirements throughout the year and the hydraulics are amenable to flow increases, additional treatment capacity has also been created by the installation of this process.
Since the process worked so well at full scale at one plant, the owner has decided to implement the process at a second facility. This second plant is a 120,000 gpd SBR also in the Pocono Mountains. While the wastewater from a nearby resort does not have to travel through refrigerated bedrock to get to the plant, there is an outdoor equalization tank that allows influent T’s to drop below 8° C. Additional development is underway in the plant’s service area that will increase both year-round and seasonal flows above the plant’s current rated capacity. And while the plant does not have the chronic compliance issues that the first plant had, it is anticipated that the installation of the Flywheel Process will correct the excursions the plant does experience while providing the additional capacity for the community’s growth. The design of this second installation was much more difficult than the first since the existing process tanks were constructed with a building over them. The narrow walkway areas and low overhead clearance inside the building severely limit the ability to place the plastic media containment devices into the tanks. But the design is now complete and the installation is pending the owner’s authorization.
Current SBR Plant Cost Comparison
Estimated cost to add additional SBR train in new building (60,000 gpd) = $1,750,000.
Cost to retrofit two trains for Flywheel Process in existing building =$280,000.
For comparison purposes, we have developed capital cost estimates for the construction of a new SBR process train to accommodate the expected increases in flow versus the cost of installing the Flywheel Process. To construct a third SBR train with a building over it at the current site, we estimate the cost at approximately $1,750,000. Based upon the design of the Flywheel Process installation that has recently been completed, it is estimated that the cost will be approximately $280,000. This very significant savings is for capital costs alone. The additional costs to aerate the third train and heat the new building are not reflected in these estimates.
While the early results from the Flywheel Process have been very encouraging, there is still a lot of work to be done to bring it into the mainstream. The Aquifas wastewater process model, as developed by Dr. Dipankar Sen, has been employed not only to evaluate the theoretical basis for the improved performance and to predict the results that can be expected from the processes implementation, but also to assist in the operations of the process after its installation. This can be done by programming the model into the patented PLC that I referred to earlier. The process is also being installed currently at an attached growth plant with very high ammonia levels in the influent. Early results indicate that the process brings the required improvements, but a long term period of data collection and evaluation has just begun. Additionally, we are evaluating flow-through activated sludge plants where the installation of the process may be used to bring about improved compliance capabilities, increased capacity or both.
Process Inventor Enviro/Sci Corporation Bill Smith , President P.O. Box 2063 Southeastern, PA 19399-2063
Process Engineering by: Alaimo Group 200 High St. Mount Holly, NJ 08060 For additional information contact: Wayne Simpson,PE,BCEE [email protected] 609-267-8610
Process Implementation Team
Presenter
Presentation Notes
So while this may not be the discovery of the Holy Grail, it has certainly been exciting to be a part of what appears to be another step in the evolution of the wastewater treatment process. I’d like to thank Bill Smith for designating Alaimo Group as the exclusive engineer for design of his patented process and to the NJWEA for allowing me to share this emerging technology with all of you. If things go as currently planned, I hope to return at a future conference with more examples of how the process has worked to upgrade various plants. I’ll be happy to answer any questions you may have either now or via the contact information listed on the slide and in your handouts. Thank you for your attention.