achieving future research impact
TRANSCRIPT

Achieving Future Research Impact:
Guidance for Preparation
Impact Oriented Interdisciplinary Research (IIRG) Programme
Research Clusters
University of Malaya
May 2019

i
Acknowledgements
This hand out is compiled directly from materials presented in Research Excellence Framework (REF) Impact Toolkit [1]. Materials are also borrowed from EI 2018 Australia and many other publicly
available resources. All these sources [1-9, and others cited in the text] are gratefully acknowledged.
References 1. H. Tilley, L. Ball, C. Cassidy, Research Excellence Framework (REF) impact toolkit, March 2018 2. EI 2018 Australia 3. Research Services, University of Sheffield <https://www.sheffield.ac.uk/rs/impact/pathways> 4. https://www.sheffield.ac.uk/rs/impact/pathways 5. https://mssociety.ca/uploads/files/guide-to-writing-lay-summary-eng-final20130726.pdf 6. https://www.sheffield.ac.uk/rs/impact/ref 7. Many other publicly available resources (including those cited in the text) 8. G. Hall, A. Macdonald and J. Chubb, An introduction to Research Impact, Training Course, UK 9. G. Hall, L. Davies, A. McRae, Tools and techniques for research impact, Training Course, UK

ii
Table of Content
Acknowledgements...................................................................................................................................... i Table of Content ......................................................................................................................................... ii Glossary..................................................................................................................................................... iii
PART 1 1. Introduction to Research Impact, Stakeholder Engagement, Research Communication ............................. 1
1.1 Research Impact ............................................................................................................................................ 1
1.1.1 Impact Summary .................................................................................................................................... 3
1.1.2 Pathways to Impact................................................................................................................................ 3
1.1.3 Impact Case Study .................................................................................................................................. 4
1.2 Stakeholder Engagement .............................................................................................................................. 5
1.2.2 Research Users ....................................................................................................................................... 5
1.2.2 Stakeholders .......................................................................................................................................... 5
1.2.3 Stakeholder Mapping ............................................................................................................................. 6
1.3 Research Communication ............................................................................................................................. 7
1.3.1 Step 1: Knowing your audience............................................................................................................. 7
1.3.2 Step 2: Crafting effective messages ...................................................................................................... 7
1.3.3 Step 3: Planning your outputs and activities ........................................................................................ 8
1.3.4 Step 4: Presenting your research .......................................................................................................... 9
PART 2 2. Impact Development Workshop ............................................................................................................ 12
2.1 Impact ......................................................................................................................................................... 12
2.2 Stakeholder Engagement ............................................................................................................................ 13
2.3 Research Communication ........................................................................................................................... 15
PART 3 3. Impact Planning .................................................................................................................................... 16
Annex A: Examples of impacts and indicators ............................................................................................ 17 Annex B: Examples of stakeholder engagements ....................................................................................... 22

iii
Glossary Research partners: Research partners are those stakeholders who are with you all the way through a research project and/or are fundamental to realising your research goals. They may also be key beneficiaries or users of your research – the main difference here is that without them your research would not happen at all. Research partners may provide crucial infrastructure, funds or advice, they may broker access to equipment, staff, participants or those research users who can help you maximise your impact goals. Research user: For your research to have meaningful, long-term impact you need it to be taken up by someone other than yourself or your immediate peers. Research users play a vital role in disseminating, discussing, adapting, developing and adopting research. They can be found in any sector of society including charities, government departments, industry and special industry groups. Which users you engage with depends entirely on your field of study and the type of impacts you hope to have. For example, translating research from the laboratory to the pharmacy will require researchers from other disciplines, both inside and outside of academia to engage with your research, as well as commercial companies, medical regulators and even pharmacists. A research user is thus an individual, community or organisation external to academia that will directly use or directly benefit from the output, outcome or result of the research. Examples of research users include governments, businesses, non-governmental organisations, communities and community organisations.
Research beneficiaries: It is important to think about those who might be affected either directly or indirectly by your research. For example, imagine that you want to introduce a new therapeutic approach for a chronic but prevalent condition. You would need to engage directly with patients and patient groups but also those who will be impacted indirectly, such as carers, family, even employers or local health authorities. Stakeholder: A stakeholder is anyone who is affected by or has an interest or stake in a particular issue. Examples of stakeholders include members of local, state, federal or tribal agencies; business leaders and industry representatives; representatives from non-profit groups or other citizen organizations; and individuals from loosely defined user groups, such as local residents or farmers etc.
All research users and beneficiaries could also be considered stakeholders, but not all stakeholders are research users or beneficiaries. Research audiences: No matter what your research, someone will always be interested in what you do. The general public and the media are always interested in research which gets them thinking and talking, provides new insights or involves cutting-edge technology. They may also want to know more about your research because it intersects with their own interests or needs or has a specific meaning for their demographic, occupation, home town etc. Engagement: Research engagement is the interaction between researchers and research users and stakeholders outside of academia, for the mutually beneficial transfer of knowledge, technologies, methods or resources.
Alignment: Is the research likely to lead to policy/outcome the stakeholders broadly agree with? Do they share the same sense of potential importance and agree with your approach?
Interest: Are they interested in the issue your research is addressing? Are they committing resources to the issue? Do they want change? Are they speaking about the issue?
Influence: How important are they to making change happen? Are they in a position of authority? Can they put pressure on a decision-maker or others who can make a difference?

1
PART 1
1. Introduction to Research Impact, Stakeholder Engagement,
Research Communication
1.1 Research Impact Impact is defined as an effect on, or change or benefit to the economy, society, culture, public policy or services, health, the environment or quality of life, beyond academia (REF2014).
Fig. 1 Impact beyond academia.
Impacts can be manifested in a wide variety of ways including, but not limited to: the many types of beneficiary (individuals, organisations, communities, industry, regions and other entities); impacts on products, processes, behaviours, policies, practices and understanding; and avoidance of harm or the waste of resources in the widest sense. Impact of any type may be local, regional, national or international. Some examples of impact (not exhaustive) are given in Annex A as a guide. To have impact with your research, you need to be clear about what sort of change you want to see and what ‘impact’ means for your research. An impact objective is a statement of how you intend to do this, and it is required by the Pathways to Impact statement and the impact summary, in which you need to outline who will benefit from the research and how. This will also help define a good research communications strategy, to ensure messages from research reach those who can make a difference throughout the decision-making processes. It will determine the types of evidence you will collect during the research and implementation of the communications strategy, and in turn the monitoring of impact will inform the writing of the impact case study. Start thinking about impact and how you will measure it at the start of your research. This will help you understand and capture impact when it arises. Also, revisit your plan regularly to adjust it as necessary. Your role in achieving impact may not be straight forward. Your influence may be direct or indirect. It may be that you only contribute to broad changes. Consider complexities such as unexpected impact, impact over the longer term, contribution and co-creation, and contextual factors. Impact objectives revolve around getting your research known and used amongst those who can benefit most from it (ESRC, 2017). Achievement of research impact depends on successful communication, collaboration and interactions with stakeholders (Fig. 2). Most research is done in collaboration with others. Work in partnership, or as part of a coalition.
2
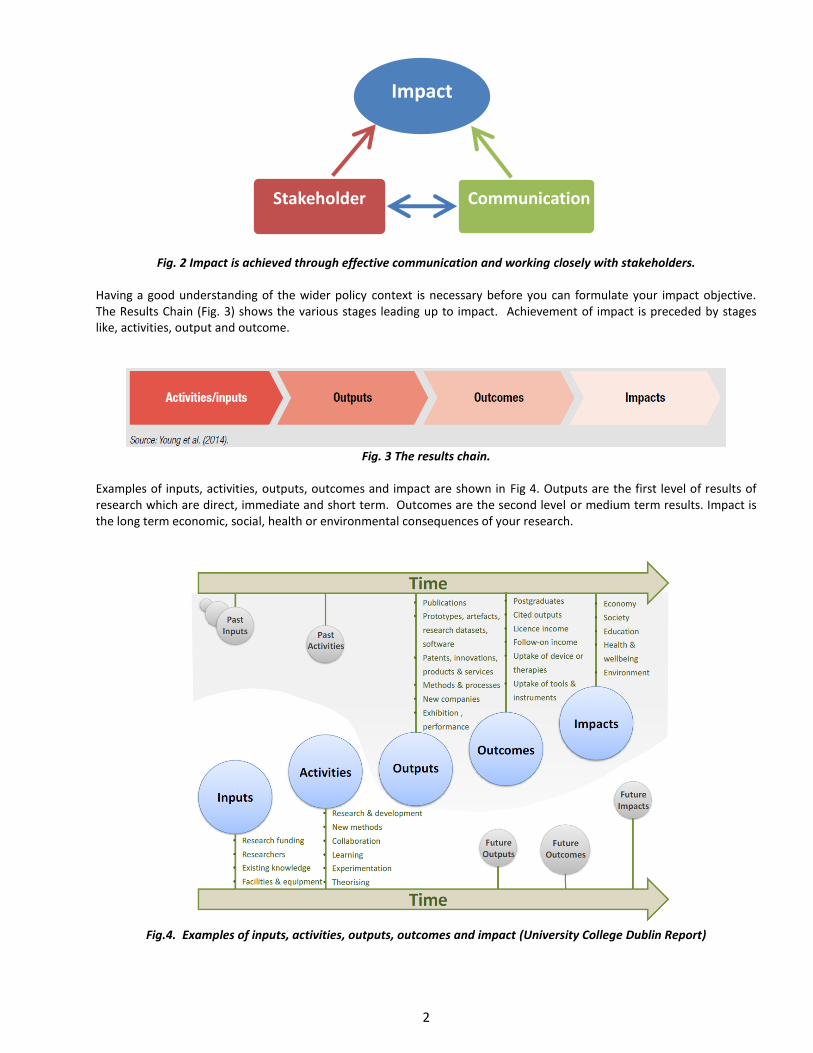
Fig. 2 Impact is achieved through effective communication and working closely with stakeholders. Having a good understanding of the wider policy context is necessary before you can formulate your impact objective. The Results Chain (Fig. 3) shows the various stages leading up to impact. Achievement of impact is preceded by stages like, activities, output and outcome.
Fig. 3 The results chain.
Examples of inputs, activities, outputs, outcomes and impact are shown in Fig 4. Outputs are the first level of results of research which are direct, immediate and short term. Outcomes are the second level or medium term results. Impact is the long term economic, social, health or environmental consequences of your research.
Fig.4. Examples of inputs, activities, outputs, outcomes and impact (University College Dublin Report)
Stakeholder Communication
Impact
3
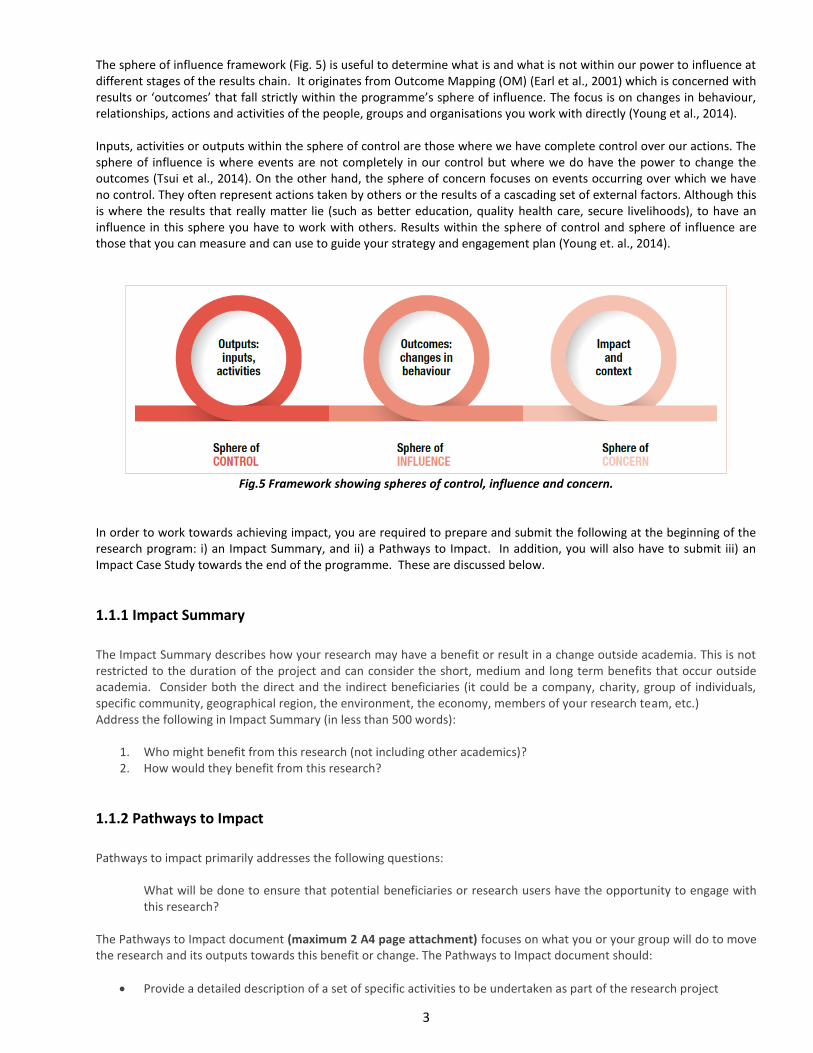
The sphere of influence framework (Fig. 5) is useful to determine what is and what is not within our power to influence at different stages of the results chain. It originates from Outcome Mapping (OM) (Earl et al., 2001) which is concerned with results or ‘outcomes’ that fall strictly within the programme’s sphere of influence. The focus is on changes in behaviour, relationships, actions and activities of the people, groups and organisations you work with directly (Young et al., 2014). Inputs, activities or outputs within the sphere of control are those where we have complete control over our actions. The sphere of influence is where events are not completely in our control but where we do have the power to change the outcomes (Tsui et al., 2014). On the other hand, the sphere of concern focuses on events occurring over which we have no control. They often represent actions taken by others or the results of a cascading set of external factors. Although this is where the results that really matter lie (such as better education, quality health care, secure livelihoods), to have an influence in this sphere you have to work with others. Results within the sphere of control and sphere of influence are those that you can measure and can use to guide your strategy and engagement plan (Young et. al., 2014).
Fig.5 Framework showing spheres of control, influence and concern.
In order to work towards achieving impact, you are required to prepare and submit the following at the beginning of the research program: i) an Impact Summary, and ii) a Pathways to Impact. In addition, you will also have to submit iii) an Impact Case Study towards the end of the programme. These are discussed below.
1.1.1 Impact Summary
The Impact Summary describes how your research may have a benefit or result in a change outside academia. This is not restricted to the duration of the project and can consider the short, medium and long term benefits that occur outside academia. Consider both the direct and the indirect beneficiaries (it could be a company, charity, group of individuals, specific community, geographical region, the environment, the economy, members of your research team, etc.) Address the following in Impact Summary (in less than 500 words):
1. Who might benefit from this research (not including other academics)? 2. How would they benefit from this research?
1.1.2 Pathways to Impact
Pathways to impact primarily addresses the following questions:
What will be done to ensure that potential beneficiaries or research users have the opportunity to engage with this research?
The Pathways to Impact document (maximum 2 A4 page attachment) focuses on what you or your group will do to move the research and its outputs towards this benefit or change. The Pathways to Impact document should:
• Provide a detailed description of a set of specific activities to be undertaken as part of the research project
4
• Include a realistic timeline for carrying out the activities
• Add to and complement the other parts of the research proposal
• Think of the most appropriate activities to engage with or reach the beneficiaries you have identified (see Section 1.2)
For each activity, give as much detail as possible. For example, consider:
• At what stage of the project it needs to happen
• Who will be responsible for managing/carrying out the activity
• Whether you will require additional support
• Which other stakeholders need to be involved and how you will identify and engage with them
• How you will measure success.
Do's and Don'ts
Do
• Think about your Pathways to Impact early on in the development of your research proposal.
• Be imaginative but realistic.
• Be specific and give details (dates, responsibilities, etc.).
• Tailor your impact activities to your research. They should be relevant to the type of research and to your stakeholders/end users.
• Plan impact activities throughout the life of your project and involve stakeholders and potential research users early in the process.
• Make your engagement two-way wherever possible. Give stakeholders a chance to feed into the design of your project.
• Request additional support for impact activities, if necessary.
• Keep it brief and relevant. 2 sides of A4 is the upper limit for the Pathways to Impact.
• Get peers and colleagues to read over your Pathways to Impact.
Don't
• Describe your research all over again.
• Mention academic impact (conferences, papers and articles) unless it is a key pathway to delivering your non-academic impact. If this is the case, you should make this link clear.
• Cut and paste your Impact Summary into your Pathways to Impact.
• Make wild and unrealistic claims for potential impact.
• List vague and general activities (e.g. "We will engage industry").
• Cut and paste from a previous or a colleague's Pathways to Impact, or use an 'off the peg' template
1.1.3 Impact Case Study
An Impact case study(ICS) is a narrative which describes how research, conducted during a specific time-frame, resulted in a change, had an effect on or benefited culture, the economy, the environment, health, public policy, quality of life or society using qualitative and quantitative evidence. This has to be written towards the end of the project. A format for the impact case study will be provided in due course.

5
1.2 Stakeholder Engagement In order to achieve impact, you have to work with both research users and stakeholders. The following will help you in identifying your research users and stakeholders.
1.2.2 Research Users
Research users are direct beneficiaries of your research. Their involvement in the project is vital to achieving impact from your research. Using the questions below as a guide, characterize each known and potential research user by completing a row for each in Table 2 (see Part 2).
Who are your research users? • What users or user groups have a decision-making role related to the issue of concern?
What are their needs or wants? • What are the relevant needs or wants for each research user or research user group? What problems are you
hoping to help them address?
• What information do you know they need or want, given their decision making context?
• How do you know they plan to use the information?
• What are the known opportunities for the research user to use the information you are planning to work with them to produce? What are the known barriers?
• What do you expect will be the impact of the information you produce?
How engaged should they be? • What role do you anticipate the research user will play in the development and implementation of the project,
e.g. help define the project goals; facilitate iterative/adaptive learning; testing/providing feedback; evaluation, etc.? How will their engagement in this role enhance the production and usability of the science for this project?
• How frequently do you need to meet in order for them to meaningfully play this role? Note: This and the last question will likely require a conversation with your research user.
• How engaged are they able/do they want to be?
When do the outputs need to be available to the users? • When do you expect the research user to apply the project outputs, e.g., during the project, after the project
concludes, in a more distant future?
1.2.2 Stakeholders
Stakeholder participation should complement the role of research users and provide unique perspectives on the issue and possible solutions. Consider why you are engaging specific stakeholders, what information you need, and how you will use their feedback. Stakeholders can help you:
• Refine the focal question;
• Understand the policy, social, and political landscape;
• Collect the data, local knowledge, or technical or industry insights necessary for an informed assessment;
• Be perceived as credible or legitimate;
• Identify creative and acceptable solutions to the focal question;
• Ground-truth preliminary results; and/or
• Improve the development of final products and presentation of results. Examples of engagements with stakeholders are given in Annex B.

6
1.2.3 Stakeholder Mapping
Stakeholder mapping has various uses in developing effective Pathways to Impact and for putting in place an effective strategy for achieving impact. It can be used to identify:
• research users to consult during the research planning stage, to discuss the role they may play in planning the research, such as co-investigators;
• opportunities for building strategic partnerships and strengthening relationships;
• and actively engage relevant users of research and stakeholders at appropriate stages. An Alignment, Interest and Influence Matrix (AIIM) (Fig. 6) can help ensure you consider the full range of stakeholders who may be influenced by your research in some way. It is a simple stakeholder mapping tool with three aspects: the degree of interest in the research topic; the degree of alignment with the thrust of the research; and the degree of influence they have within the policy-making process. Each of the quadrants in the AIIM is explained below. Top right quadrant: stakeholders in this quadrant are both interested in your issue and aligned with your approach. These people are your collaborators and allies. You may want to ‘work in partnership’ with this group. Perhaps you could form a community of practice or set up meetings with key organisations or individuals to share ideas or coordinate activities. Top left quadrant: stakeholders in this quadrant agree with your approach, but they are not interested or prioritising the issue. This could be for several reasons – they may not know much about the issue, have limited capacity or have competing priorities. If there are influential stakeholders in this group, start to think about how you can develop their interest or capacity to get involved. Bottom right quadrant: stakeholders in this quadrant are interested and perhaps active in your issue area, but they don’t agree with your approach or position. If you need to get stakeholders from this group on board, you’ll need to challenge their current thinking and persuade them of your position. Evidence usually works best for this group. Working through champions who are aligned with your position can also be effective. Bottom left quadrant: stakeholders in this quadrant do not know much about the project, or if they do, they are not very interested and probably do not agree with your views. If they are not influential in your project’s success, you may prefer to ignore them as a group. Ultimately, you cannot do everything and may need to focus your energies on the actors in the other three quadrants. It may also be hard to know who these actors are, because they might not even be known to you. If they are potentially influential, you may need to just monitor them to ensure that they don’t move into another quadrant and start to cause your project harm.
Fig. 6 Stakeholder Intent and Influence Matrix (AIIM).Source: Young et al. (2014)

7
1.3 Research Communication Your research will only have real world impact if it reaches the right people. Research communications should be understood in the broadest sense. It involves effective knowledge exchange with non-academic communities (ESRC, 2017). Communication can take many forms – formal and informal. This includes digital engagement, social media, publications, field visits, public events, emails or private meetings. The key is to: know who you want to reach; know what you want to do; and work out how you want to reach them – this means thinking about the channels and tools you will use and to what messages they will relate. Do not leave it to the end. It should be done throughout the project’s lifetime.
1.3.1 Step 1: Knowing your audience
The audience is at the heart of any communication. Before you can begin communicating your research, you need to be clear about your aims: who do you want to reach and what do you want them to do with the information? Effective communication material needs to be carefully tailored and adapted for different audiences. It is helpful at this point to look back at your impact objective and reflect on the following:
1. Is there a problem you are working to address? 2. Are you offering a solution (or several solutions)? 3. Are you providing new information to support others to find solutions? 4. What do you want your communications to achieve? 5. Who do you need to engage with to achieve your goal?
1.3.2 Step 2: Crafting effective messages
Identify your key message A strong message should be at the core of any good report, presentation or other piece of communication. Research frequently focuses on facts and data, but it is important to explore ways to tell a story through your messaging as well. Audiences, from academics to decision-makers, are far more likely to want to interact with new information if they can relate to it in some way. Key messages are ‘just the tip of the iceberg’ (Young and Quinn, 2012). They are what your audience most needs to know, and are supported by the main information (the rest of the iceberg) as needed. If you give readers all the information in one go they are unlikely to absorb it. When planning your key messages, think about your audience. Who are they? What sort of message do you need to communicate to them, and why? Thinking through several questions can help you shape the message, then the channel for best conveying it:
1. Who are the audience? What role do they play? Are they specialists in the topic or are they non-technical? Are they people who you already know?
2. What do they need to know? What are they currently working on? How can they use your information? Did they ask for the information? If so, are you delivering what they wanted? Do they need to know more?
3. How do they best receive information? Do you know how they tend to prefer to receive communications?
What has worked well in the past (and what has not)? Is it better to approach them for a meeting or to send a report?
Make your message stick Six dimensions to a good message:
Simple. The best messages are always simple. This does not mean dumbed down. Rather, you are pulling out the key message your audience needs to know. Keep it concise and don’t over-elaborate. Unexpected .If you can make people sit up and listen you’re more likely to have impact. Counter-intuitive messages, a surprising fact or a different angle can be one way to do this.

8
Concrete. Don’t be too abstract. Make your message tangible, relating to real life examples where possible. For example, rather than saying 25%, say one in four people. Credible. Your message can be clear, concise and well-constructed, but if it isn’t credible the audience is unlikely to listen. Is your message backed up by evidence? Is it believable? Emotional. We know emotions provoke reaction. Is there a way to explore emotions with your audience, make them connect or care about the human story behind your research? Stories. We use storytelling all the time for effective communications. Can your message tell a story rather than just hard facts? What’s the impact of the evidence?
1.3.3 Step 3: Planning your outputs and activities
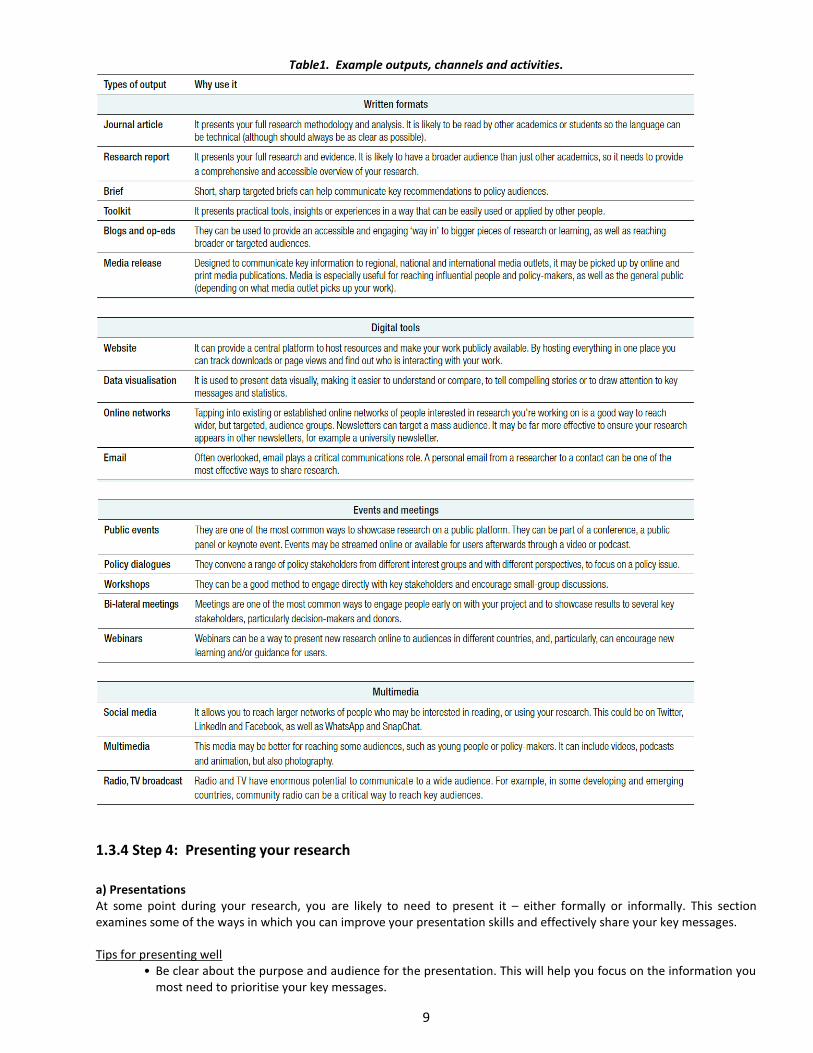
Every research project needs to think about outputs and activities. While research may be published in an academic journal, if you want to have an impact beyond academia you will need to think how to achieve this and explore other communication channels. Remember that effective engagement is more than one-way communication. Engaging stakeholders with your research can improve the quality of your research outputs and the impact, raise your profile and develop your skills. Communication activities, therefore, are some of the most important actions you can take to increase the impact of your research. The outputs, channels and activities you use will depend on what impact you want to have, who your audience is and what resources you have. A spectrum of knowledge communication activities is a helpful framework to reflect on the different types of knowledge roles you can play (Fig. 7). This may change throughout your research lifetime, depending on what you’re trying to achieve and your resources. If you are clear about what your role is and what you can achieve, you can then see where your limits are and where others can help.
Fig. 7. Spectrum of knowledge communication activities.
9
Table1. Example outputs, channels and activities.
1.3.4 Step 4: Presenting your research
a) Presentations At some point during your research, you are likely to need to present it – either formally or informally. This section examines some of the ways in which you can improve your presentation skills and effectively share your key messages. Tips for presenting well
• Be clear about the purpose and audience for the presentation. This will help you focus on the information you most need to prioritise your key messages.

10
• Structure your presentation. Can you identify one overarching message and three key points to share? The
beginning should capture your audience – quotes or surprising facts can work well. Then introduce the outline of your presentation. To close, highlight your key points and any recommendations or next steps.
• Plan your presentation and practice. Even the most experienced presenters practise, practise and practise.
• Make sure it is clear and accessible. ‘If you can’t explain it simply, you don’t understand’ – so goes the quote by Einstein.
• Try practising what you want to say with someone who does not know very much about the topic (a relative, friend, spouse or colleague) and get them to give you honest feedback.
• Stick to your time limit. Find out how long you will have to speak and prepare for less time than this, as it is normal to overrun. Also, try to keep presentations short, or break it up with time for questions. Don’t just speak non-stop at the audience – they will switch off.
• Find your passion. Stakeholders are more likely to listen to you if you sound confident but, above all, interested in what you are saying.
What not to do (common mistakes)
• Don’t use your slides as a crutch. Slides are there to enhance your presentation, not duplicate it. People can’t listen and read at the same time. If you need to, make notes, don’t read your slides. • Don’t overload your slides. Avoid putting too much information on one slide. Break up text with images, videos or quotes. Lots of studies show people respond better to visual stimuli than text (Gallo, 2014). Be careful with graphs and data; they can be helpful but can be difficult to read (see tips on data visualisation). Short videos can also be a good way to break up the presentation. • Don’t use PowerPoint until you have a structure. It pays off to spend time identifying your key messages and structuring your presentation. Don’t start making your PowerPoint presentation until you’ve got a proper structure in place. • Do not assume PowerPoint is the only format. There may be other formats that are more appropriate for the presenting your context and getting your message across. For example, Prezi is a visual tool that allows a different structure.
b) Briefs Briefs don’t replace reports as you still need to be able to provide the detailed evidence. Instead, briefs are a useful tool to reach specific audiences, particularly when they may not have time to read the full report or just need key information. They help present your findings and recommendations in a way that is digestible. The policy brief is a common form of brief used to target policy-makers. It typically has four functions: to explain/convey the urgency of an issue; to present policy recommendations or implications on the issue; to provide evidence to support the reasoning behind the brief; and to point the reader to additional resources on the issue. Here are four main steps to help plan a policy brief:
1. Identify the purpose and overarching message of the brief. 2. Determine three recommendations/implications if relevant. 3. Construct a logical line of argument for making these recommendations (your results or conclusions).
When you are thinking about your line of argument you can ask: what is the problem and how does my research fit into this? Why is it urgent/timely/ important? Why should the target audience know more?
4. Based on an understanding of the context around the issue, identify one or two entry points or hooks for the message. These are commonly used at the beginning of reports, summaries or briefs to entice the reader into continuing to read.

11
c) Data visualisation and infographics Data visualisation, the graphic representation of data or knowledge, can add value to your research by (ODI internal infographic guidelines):
1. Making data or information easier to understand or compare; 2. Telling complex stories in a condensed and compelling way; 3. Drawing attention to key audiences; 4. Engaging a wider audience.
Data visualisations showcase data or information in visual form, so there are a wide variety of options that fall under this category. At the simplest level, a data visualisation could be a graph or chart, a timeline, a map or an illustration. d) Lay abstract A lay abstract is a brief summary of a research project that is used to explain complex ideas and technical and scientific terms to people who do not have prior knowledge about the subject. A lay audience is diverse and includes members of the general public, media, funding agencies, and researchers in different disciplines. It is intended to explain why the research is being suggested, what researchers aim to achieve and how this may impact society, economy, environment etc. Typical summaries might discuss the purpose of the research, its relevance, and the proposed methodology.

12
PART 2
2. Impact Development Workshop Each IIRG team will engage in hands-on activities as described below (Activities 2.1-2.4) to develop their impact plan.
2.1 Impact
Activity 2.1: Identify your impact objective
13
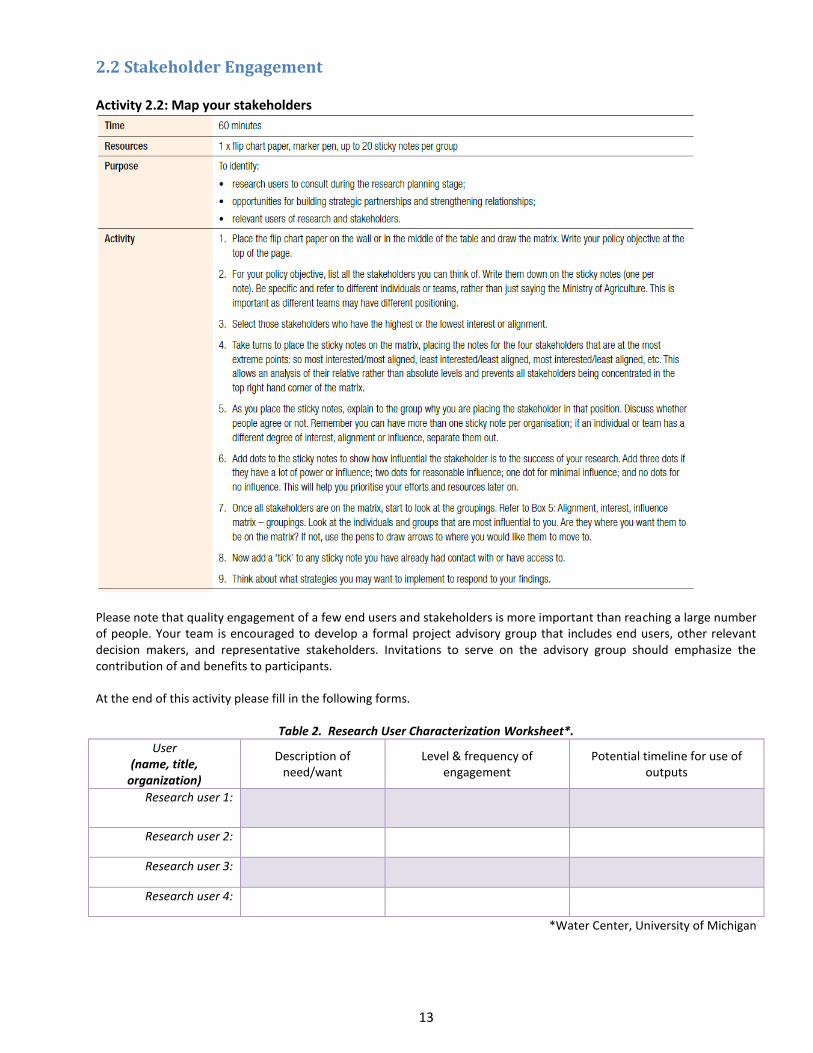
2.2 Stakeholder Engagement
Activity 2.2: Map your stakeholders
Please note that quality engagement of a few end users and stakeholders is more important than reaching a large number of people. Your team is encouraged to develop a formal project advisory group that includes end users, other relevant decision makers, and representative stakeholders. Invitations to serve on the advisory group should emphasize the contribution of and benefits to participants. At the end of this activity please fill in the following forms.
Table 2. Research User Characterization Worksheet*.
User (name, title,
organization)
Description of need/want
Level & frequency of engagement
Potential timeline for use of outputs
Research user 1:
Research user 2:
Research user 3:
Research user 4:
*Water Center, University of Michigan

14
Table 3. Stakeholder characterization worksheet*.
Who – potential stakeholder participant
Why – stakeholder contributions How – role and engagement
Brainstorm the names of individuals or organizations that are connected to the topic, have a unique perspective,
and might participate in the project in some way.
How specifically could each group/individual contribute to the
project? Consider the unique concerns of and potential benefits to participants.
How and when should these groups or individuals be involved?
What is the best way to communicate with and engage
each?
*Water Center, University of Michigan
15
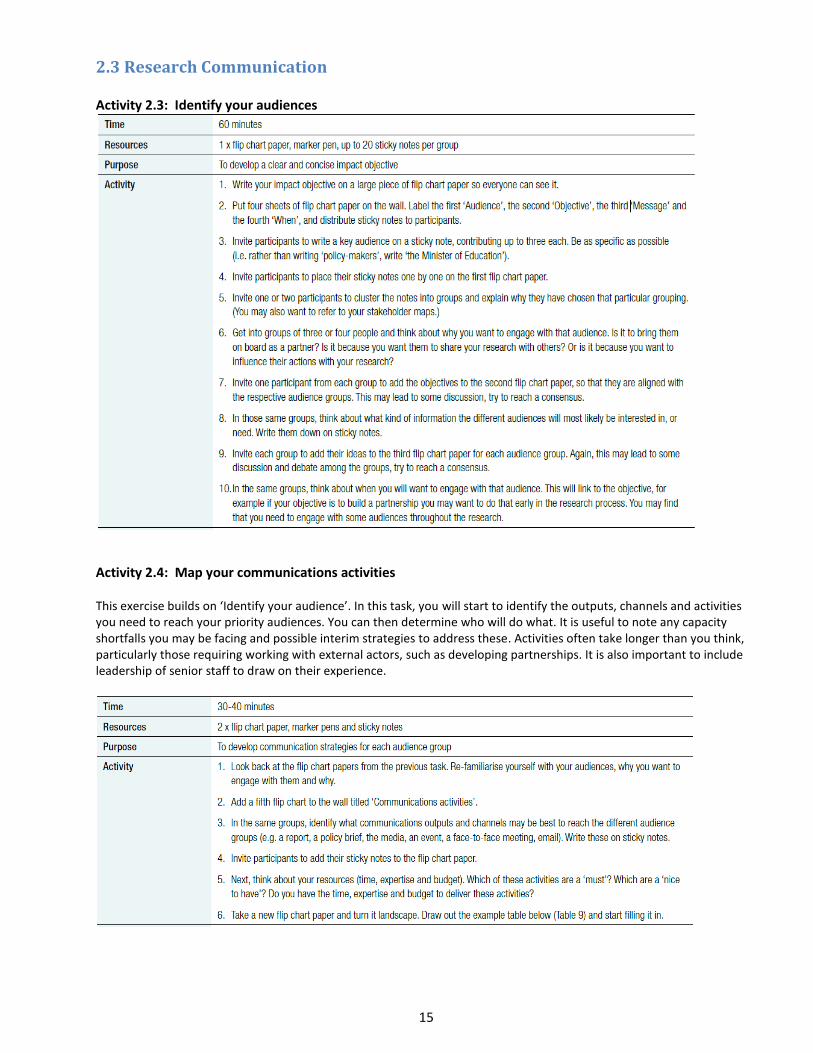
2.3 Research Communication
Activity 2.3: Identify your audiences
Activity 2.4: Map your communications activities This exercise builds on ‘Identify your audience’. In this task, you will start to identify the outputs, channels and activities you need to reach your priority audiences. You can then determine who will do what. It is useful to note any capacity shortfalls you may be facing and possible interim strategies to address these. Activities often take longer than you think, particularly those requiring working with external actors, such as developing partnerships. It is also important to include leadership of senior staff to draw on their experience.

16
PART 3
3. Impact Planning Please plan your impact related activities from the beginning and document them. An indicative list of activities and related time line is given below.
Table 4. An indicative list of activities and related time line. Year1 Year2
Q1 Q2 Q3 Q4 Q1 Q2 Q3 Q4
Cluster:
Activities
Workshop/training Impact Development Workshop
Follow-up Workshop
Progress monitoring Half yearly
Year End Half yearly
Year End
Researchers:
Activities
Internal Meeting of Researchers
* * * * * * * *
Impact Impact Summary, Pathways to Impact
Plan and carry out your impact activities Impact Case Study
Stakeholder Engagement Research User and Stakeholder Characterization Worksheets
Plan and carry out your engagement activities
Research Communication Lay Abstract, Graphical Abstract
Plan and carry out your communication activities

17
Annex A: Examples of impacts and indicators Table below is intended to illustrate the wide variety of areas in which impact from research may be found to have a positive influence on the quality of life of individuals and communities locally, nationally and internationally. These are indicative only, and in practice much of the impact will cross boundaries between them or go beyond them.
Areas of impact
Types of impacts
Indicators of reach and significance
Impacts on the health and wellbeing of people, and
animal welfare
Impacts where the beneficiaries are individuals and
groups (both human and animals) whose health
outcomes have been improved, whose quality of life
has been enhanced (or potential harm mitigated) or
whose rights or interests have been protected or
advocated through the application of enhanced
policy and practice for individuals or public health
activities.
• Outcomes for patients/users or related groups have
improved.
• Public health or wellbeing has improved.
• Quality of life in a developing country has been improved by
new products or processes.
• A new clinical or lifestyle intervention (e.g. drug, diet,
treatment or therapy) has been developed, trialled with
patients/users, related or other groups (e.g. community
samples), and definitive (positive or negative) outcome
demonstrated.
• Patient health outcomes have improved through, for
example, the availability of new drug, treatment or therapy,
diagnostic or medical technology, changes to patient care
practices, or changes to clinical or healthcare guidelines.
• A new diagnostic or clinical technology has been adopted.
• Disease prevention or markers of health have been enhanced
by research.
• Misleading health claims identified by research are not
included in food packaging.
• Care and educational practices have changed.
• Clinical, dietary, health or social care guidelines have
changed.
• Health or social care training guidelines have changed.
• Decisions by a health service or regulatory authority (to take,
or not to take action) have been informed by research.
• Public health and quality of life has been enhanced through,
for example, enhanced public awareness of a health risk,
enhanced disease prevention or, in developing countries,
improved water quality or access to health and social care.
• The user experience has improved.
• Increased patient/user involvement in shaping and
implementing policy and practice.
• Public awareness of a health risk or benefit has been raised.
• The control of diseases has changed in developing countries.
• Development or adoption of new indicators of health and
wellbeing.
• Development of policy and practice with regard to medical
ethics, health services or social care provision.
• Influence on CPD and training standards.
• Influence or shaping of relevant legislation.
• Influencing policy or practice leading to improved take-up or
use of services.
• Improved provision or access to services.
• Animal health and welfare has been enhanced by research.
• Use of animals in research has been reduced, refined or
replaced.
• Measures of improved clinical outcomes, public
behaviour or health services (lives saved, reduced
infection rates).
• Measures of improved wellbeing.
• Evidence from clinical trials.
• Measures of improved patient/user outcomes, public
health or health services.
• Documented changes to clinical and/or public health
guidelines (documented references to research
evidence in guidelines).
• Evidence of enhancement of patient/user experience.
• Evidence of take-up and use of new or improved
products and processes that improve quality of life or
animal welfare in any given context, e.g. developing
countries.
• Evidence of the number of animals no longer used in
research or a specific sector (e.g. per test, drug,
laboratory, or leisure industry).
• Documented changes to animal welfare codes or
guidelines.
Impacts on creativity, culture and society
Impacts where the beneficiaries may include
individuals, groups of individuals, organisations or
communities whose behaviours, creative practices,
rights, duties and other activity have been influenced.
• Collaboration with museum professionals results in
enhancements to (cultural) heritage preservation and
interpretation, including museum and gallery exhibitions.
• Co-production of new cultural artefacts, including for
example, films, novels and TV programmes.
• Generating new ways of thinking that influence creative
practice, its artistic quality or its audience reach.
• Inspiring, co-creating and supporting new forms of artistic,
literary, linguistic, social, economic, religious, and other
Arts Council England offer guidance and toolkits for
evaluating impact:
• https://www.artscouncil.org.uk/quality-
metrics/quality-principles
• https://www.artscouncil.org.uk/quality-
metrics/quality-metrics
• https://www.artscouncil.org.uk/measuring-
outcomes/generic-learning-outcomes
• https://www.artscouncil.org.uk/measuring-

18
expression.
• Collaboration with public arts venues, artists and
programming professionals to produce new forms of artistic
expression.
• Research-led engagement with marginalised, under-engaged
and/or diverse audiences leads to increased cultural
participation.
• Developing stimuli to cultural tourism and contributing to the
quality of the tourist experience.
• Improvements to legal and other frameworks for securing
intellectual property rights.
• Increased understanding of local traditions leads to enhanced
cultural preservation in any given context, for example
developing countries.
• New forms of artistic expression resulting in enhancement of
quality of life.
outcomes/generic-social-outcomes
• Testimonials from creative practitioners, curators,
media professionals.
• Publication and sales figures both in the UK and
overseas, audience or attendance figures (including
demographic data where relevant), broadcasting data
and other forms of media, download figures, or
database and website hits over a sustained period.
• Evaluative reviews in the media.
• Citations in reviews outside academic literature.
Independent citations in the media, including in online
documents.
• Tourism data, including audience figures and visitor
numbers at exhibitions, events, performances.
• Professional evaluations of exhibitions, performances
or other outputs.
• Audience/visitor/participant feedback (e.g. through
surveys, interviews or focus groups).
Impact on social welfare
Impacts where the beneficiaries include individuals,
groups of individuals, organisations or communities
whose rights, duties, behaviours, opportunities,
inclusion, quality of life and other activity have been
influenced.
• Improved social welfare, equality, social inclusion; improved
access to justice and other opportunities (including
employment and education).
• Engagement with research has enhanced policy and practice
for securing poverty alleviation.
• Influential contributions to campaigns for social, economic,
political and/or legal change through engagement with civil
society groups.
• Changes to social policy have been informed by research.
• Changes to social policy have led to improved social welfare,
equality or social inclusion.
• Research has contributed to community regeneration or
development.
• Improved social and educational inclusion of marginalised
groups in any given context, for example developing
countries.
• More effective integration of refugees into host communities.
• Enhanced understanding of victims’ needs in reconciliation
processes in post-conflict states.
A beginner’s guide to evaluating social return on
investment (SROI) can be found here:
http://www.socialvalueuk.org/resource/guidance-on-
starting-out-on-sroi-2/.
• Documented evidence of changes to social policy.
• Measures of improved social equality, welfare or
inclusion.
• Citations in campaign literature (e.g. leaflets).
• Evidence of public debate in the media or other fora
being influenced by the research.
• Documented evidence of increased social inclusion
(e.g. participation figures).
• Testimonials from civil society groups and
policymakers.
Impacts on commerce and the economy
Impacts where the beneficiaries may include
businesses, either new or established, the NHS,
private health and social care, agriculture or other
types of organisation which undertake activity that
may create wealth.
• A spin-out or new business has been created, established its
viability, or generated revenue or profits.
• Contributing to innovation and entrepreneurial activity
through the design and delivery of new products or services.
• Decisions are made not to introduce a new process or
product as a result of research.
• Social enterprise initiatives have been created.
• The costs of treatment, health or social care have changed as
a result of research-led changes in practice.
• Policies have been introduced which have had an impact on
economic growth or incentivising productivity.
• Gains in productivity have been realised as a result of
research-led changes in practice.
• Research helps to stimulate foreign direct investment (FDI).
• The performance of an existing business has been improved
through the introduction of new, or the improvement of
existing, products, processes or services; the adoption of new,
updated or enhanced technical standards and/or protocols;
or the enhancement of strategy, operations or management
practices.
• Contributing to economic prosperity via the creative sector
including publishing, music, theatre, museums and galleries,
film and television, fashion, tourism, and computer games.
• Performance has been improved, or new or changed
technologies or processes adopted, in companies or other
organisations through highly skilled people having taken up
specialist roles that draw on their research, or through the
provision of consultancy or training that draws on their
research.
• Evidence of improved cost-effectiveness.
• Evidence of service change.
• Sales of new products/services.
• Business performance measures (e.g. turnover/profits,
trends in key technical performance measures
underlying economic performance).
• Employment figures.
• Licences awarded and brought to market; market
authorisation.
• Demonstrable collaborations with industry (including
knowledge transfer partnerships, and contracts).
• Commercial adoption of a new technology, process,
knowledge or concept.
• Business performance measures, for example sales,
turnover, profits or employment associated with new
or improved products, processes or services.
• Jobs created or protected.
• Investment funding raised from UK and/or non-UK
agencies (venture capital/Business Angel, and so on)
for start-up businesses and new activities of existing
businesses.
• Priority shifts in expenditure profiles or quantifiable
reallocation of corporate, non-profit or public budgets.
• Evidence of critical impact on particular projects,
products and processes confirmed by independent
authoritative evidence, which should be financial
where possible.
• Evidence of research leading to avoidance of negative
outcomes.

19
• Potential future losses have been mitigated by improved
methods of risk assessment and management in safety- or
security-critical situations.
• The strategy, operations or workplace practices of a business
have changed.
• Improved support for the development of ‘small scale’
technologies.
• Improvements in legal frameworks, regulatory environment
or governance of business entities.
• Better access to finance opportunities.
• Enhanced corporate social responsibility policies.
• More effective dispute resolution.
• Alternative economic models (such as fair trade) have been
developed and adopted.
• Quantitative data relating, for example, to cost-
effectiveness or organisational performance.
• Tourism data, including audience figures and visitor
numbers at exhibitions, events, performances.
• Evidence of closing identified skills gaps.
Impacts on public policy, law and services
Impacts where the beneficiaries are usually
government, non-governmental organisations
(NGOs), charities and public sector organisations and
society, either as a whole or groups of individuals in
society, through the implementation or non-
implementation of policies, systems or reforms.
• Policy debate has been stimulated or informed by research
evidence, which may have led to confirmation of policy,
change in policy direction, implementation or withdrawal of
policy.
• Policy decisions or changes to legislation, regulations or
guidelines have been informed by research evidence.
• A policy has been implemented (including those realised
through changes to legislation) or the delivery of a public
service has changed.
• In delivering a public service, a new technology or process has
been adopted or an existing technology or process improved.
• The quality, accessibility, acceptability or cost-effectiveness of
a public service has been improved.
• (Sections of) the public have benefited from public service
improvements.
• Risks to the security of nation states have been reduced.
• The work of an NGO, charitable or other organisation has
been influenced by the research.
• Legislative change, development of legal principle or effect on
legal practice.
• Research is used by parliamentarians to develop proposals for
new legislation through Private Members’ Bills, or to assist
scrutiny of legislation and inform amendments to other bills
such as those introduced by government.
• Research recommendations are taken up by policymakers
through membership of a government advisory committee.
• Policymakers make use of research-based critical evidence
synthesis in developing policy.
• Government analysts adopt innovative methodological or
approach-based advice from researchers.
• Forms of regulation, dispute resolution or access to justice
have been influenced.
• Research is used to change current processes or services, or
identify new services to be provided.
• Research into the languages and cultures of minority
linguistic, ethnic, religious, immigrant, cultures and
communities used by government, NGOs, charities or private
sector to understand and respond to their needs.
• Research helps to highlight issues of concern to
parliamentarians and contributes to new analysis of existing
issues.
• Research helps parliamentarians and staff to identify inquiry
topics, shape the focus of inquiries, inform questioning of
witnesses, and underpin recommendations.
• Research equips parliamentarians, their staff, and legislative
staff with new analytical or technical skills, or refreshes
existing ones.
• International policy development has been influenced by
research.
• Allocation and/or distribution of Official Development
Assistance (ODA) has been influenced by research.
• Policy and practice of international agencies or institutions
have been influenced by research.
• Documented evidence of use in policy debate (e.g. at a
parliamentary Select Committee, material produced by
NGOs).
• Citation in a public discussion, consultation document
or judgement.
• Evidence of citation in policy, regulatory, strategy,
practice or other documents.
• Direct citations of research in parliamentary
publications such as Hansard, committee reports,
evidence submissions, or briefings.
• Acknowledgements to researchers on webpages, in
reports or briefings.
• Evidence of influence on a debate in public policy and
practice through membership of or distinctive
contributions to expert panels and policy committees
or advice to government (at local, national or
international level).
• Quantitative indicators or statistics on the numbers of
attendees or participants at a research event, or
website analytics for online briefings.
• Qualitative feedback from participants or attendees at
research events.
• Data to show close working relationships with
members or staff. For example, the number of
meetings held, minutes from these meetings,
membership of working groups, co-authoring of
publications.
• Testimonials from members, committees or officials,
where available.
• Documented evidence of influence on guidelines,
legislation, regulation, policy or standards.
• Documented evidence of changes to public policy,
legislation, regulations or guidelines.
• Analysis by third-party organisations of parliamentary
proceedings or processes, for example studies of the
passage of particular pieces of legislation.
• Documented evidence of changes to international
development policies.
• Evidence of use of process/technology.
• Measures of improved public services, including, where
appropriate, quantitative information; such
information may relate, for example, to the quality,
accessibility or cost-effectiveness of public services.
• Measures of improved inclusion, welfare or equality.
• Satisfaction measures (e.g. with services).
• Formal partnership agreements or research
collaboration with major institutions, NGOs and public
bodies. Consultancies to public or other bodies that
utilise research expertise.
• Evidence of engagement with campaign and pressure
groups and other civil organisations (including
membership and activities of those organisations and
campaigns) as a result of research.

20
• Research stimulates critical public debate that leads to the
non-adoption of policy.
• Documented evidence of changes to international
development policies.
• Measures of improved international equality, food
security, welfare or inclusion.
Impacts on production
Impacts where the beneficiaries are individuals
(including groups of individuals) whose production
has been enhanced.
• Production, yields or quality have been enhanced or level of
waste has been reduced.
• Research helps to create routes to international innovation
and market impact.
• Research leads to improvement in productivity and resource-
use efficiency.
• Decisions by regulatory authorities have been influenced by
research.
• More efficient production, including food production, for
example where costs have been reduced.
• Animal husbandry methods have changed.
• Management practices in production businesses have
changed.
• A new product has been recommended for use or
adopted.
• Development of a new plant variety or crop protection
product which has entered the appropriate national or
international regulatory testing system.
• Evidence of improved sustainability.
• Documented changes to working guidelines.
• Documented evidence of improved working practices
and/or level of production.
Impacts on practitioners and delivery of professional
services, enhanced performance or ethical practice
Impacts where beneficiaries may include
organisations or individuals, including service users,
involved in the development and/or delivery of
professional services and ethics.
• Professional standards, guidelines or training have been
influenced by research.
• Professional methods, ideas or ethics have been influenced by
research.
• Professionals and organisations are able to adapt to changing
cultural values as a result of research.
• Contribution to continuing personal and professional
development.
• Practitioners/professionals/lawyers have used research
findings in conducting their work.
• Professional bodies and learned societies have used research
to define best practice, formulate policy, or to lobby
government or other stakeholders.
• Workforce planning has been influenced by research.
• Educational or pedagogical practices and methods have
changed in primary, secondary, further or higher education,
within or beyond the submitting unit.
• Practices have changed, or new or improved processes or
methods have been adopted, by individuals, companies or
other organisations, through the provision of training or
consultancy.
• The development of expert systems has been influenced in
areas such as medicine, human resources, accounting, and
financial services.
• The quality, efficiency or productivity of a professional service
has improved.
• Expert and legal work or forensic methods have been
informed by research.
• Law enforcement and security practices have changed.
• Cessation of practices shown by research to be ineffective.
• Documented change to professional standards,
performance or behaviour.
• Evidence of adoption of best practice (e.g. by educators
or law enforcement personnel).
• New or modified professional standards and codes of
practice.
• New or modified technical standards or protocols.
• Documented changes in knowledge, capability or
behaviours of individuals benefiting from training.
• Evidence of debate among practitioners, leading to
developments in attitudes or behaviours.
• Literature/web information from practitioners and
advisers, including the research findings and how they
are applied in practice.
• Traceable reference to inclusion of research in national
or international industry standards or authoritative
guidance.
• Traceable references by practitioners to research
papers that describe their use and the impact of the
research.
Impacts on the environment
Impacts where the key beneficiaries are the natural,
historical and/or built environment, together with
societies, individuals or groups of individuals who
benefit as a result.
• The environment has been improved through the
introduction of new product(s), process(es) or service(s); the
improvement of existing product(s), process(es) or services;
or the enhancement of strategy, operations or management
practices.
• New methods, models, monitoring or techniques have been
developed that have led to changes or benefits.
• Policy debate on climate change or the environment has been
influenced by research.
• Policy debate on the environment, environmental policy
decisions or planning decisions have been stimulated or
informed by research and research evidence.
• Improved design or implementation of environmental policy
or regulation.
• The management or conservation of natural resources,
including energy, water and food, has changed in a
developing country.
• The management of an environmental risk or hazard has
changed.
• Sales of new products, or improvements in existing
products, that bring quantifiable environmental
benefits.
• Verifiable influence on particular projects or processes
which bring environmental benefits.
• Evidence of generic environmental impact across a
sector, confirmed by independent authoritative
evidence.
• Traceable reference to inclusion of research into
government policy papers, legislation and industry
guidance.
• Traceable reference to the influence of research in
planning decision outcomes.
• Sales of new products or improvements in existing
products that bring quantifiable environmental
benefits.
• Traceable impacts on particular projects or processes
which bring environmental benefits.
• Evidence of generic environmental impact across a

21
• Changes in environmental or architectural design standards
or general practice.
• Influence on professional practice or codes.
• Changes in practices or policies affecting biodiversity.
• The operations of a business or public service have been
changed to achieve environmental (green) objectives.
• Direct intervention, based on research evidence, has led to a
reduction in carbon dioxide or other environmentally
damaging emissions.
• Increased understanding of the environmental impact of a
product or process means that it is not adopted by industry.
sector, confirmed by independent authoritative
evidence.
• Documented case-specific improvements to
environment-related issues.
• Traceable reference to inclusion of research into
government policy papers, legislation and industry
guidance.
• Traceable reference to impact of research in planning
decision outcomes.
Impacts on understanding, learning and
participation
Impacts where the beneficiaries are individuals,
communities and organisations whose awareness,
understanding, participation or engagement have
been enhanced as a result of research.
• Enhanced cultural understanding of issues and phenomena;
shaping or informing public attitudes and values.
• Public interest and engagement in research has been
stimulated through, for example, the enhancement of science
education in schools.
• The awareness, attitudes or understanding of (sections of) the
public have been informed, and their ability to make
informed decisions on issues improved, by engaging them
with research.
• Public or political debate has been shaped or informed by
research; this may include activity that has challenged
established norms, modes of thought or practices.
• Contributing to processes of commemoration,
memorialisation and reconciliation.
• Contributing to a wider public understanding of basic
standards of wellbeing and human rights conceptions.
• Contributing to widening public access to and participation in
the political process.
• Professionals and organisations have adapted to changing
cultural values.
• Research has challenged conventional wisdom, stimulating
debate among stakeholders.
• Increased understanding of gender roles in any given context
(e.g. developing countries) has improved equality.
• Changes to education or the school curriculum have been
informed by research.
• Influencing the design and delivery of curriculum and syllabi
in schools, HEIs or other educational institutions.
• Research results in changes to the delivery of vocational
courses and subsequently changes to professional practice.
• Reduced gap in academic attainment for students with
protected characteristics.
Many organisations use the Generic Learning Outcomes
(GLO) to evaluate impacts on knowledge and
understanding:
https://www.artscouncil.org.uk/measuring-
outcomes/generic-learning-outcomes.
The Heritage Lottery Fund also offers guidance on
evaluating participation and learning:
https://www.hlf.org.uk/evaluation-guidance.
• Documented evidence that public understanding has
been enhanced through active collaborative
involvement in research.
• Documented evidence of policy debate (e.g. in
Parliament, the media, material produced by NGOs).
• Public debate in the media.
• Documented shift in public attitude (e.g. to sexual
behaviour, or social factors in health).
• Documented evidence of enhanced awareness of
health risks and benefits by consumers.
• Citation in a public discussion, consultation document
or judgement.
• Citation by journalists, broadcasters or social media.
• Evidence of increased public uptake of scientific
training, through public engagement.
• Information about the number and profile of people
engaged and types of audience.
• Evidence of secondary reach, for example from follow-
up activity or media coverage.
• Evidence of sustainability through, for example, a
sustained or ongoing engagement with a group, a
significant increase in participation in events or
programmes or use of resources.
• Evidence of engagement with campaign and pressure
groups and other civil organisations (including
membership and activities of those organisations and
campaigns) as a result of research.
• Measures of increased attainment and/or measures of
improved engagement with science in non-HE
education.
• Evidence of use of education materials arising from the
research.

22
Annex B: Examples of stakeholder engagements NOTE—This is NOT an exhaustive list. This list includes examples which may not be relevant for all disciplines.
• Mobility of researchers (i.e. researchers employed or placed outside academia, and/or research end-user employees that are employed or placed within academia)
• Patents granted, PCT applications, triadic patents • Citations in patents to traditional research outputs • Co-supervision of students by research end-users • Cash support from end-users • Research income / commercialisation income • Students in internships/placements • Student employment destinations • Repeat business with industry • Start-up/spin-out companies • Co-authorship of research outputs with research end-users • Co-funding of research outputs with research end-users • In-kind support from end-users • Licencing agreements • Confidentiality agreements • Number of contracts for research, consulting, expert witness and testing • Number of licences, assignments and options • Established networks and relationships with research users • Number of different clients with contracts worth greater than a threshold value • Evidence of significant institutional partnerships—e.g. Sydney Health Partners; various global research consortia,
OECD, World Bank, World Health Organisation, UN, UNESCO • Philanthropy linked to research support and in-kind support • Book sales • Serving on external advisory boards • Consultations with community groups, professional/practice organisations, government bodies • Consultation with/advice to Government • Expert witness in court cases • Contributions/submissions to public enquiries on industry-research related issues • Public lectures, seminars, open days, school visits • Presentations to practitioner communities • Connections to cultural institutions, seminars/workshops, internships and engagement with the public • Support for cultural events/institutions—e.g. Writers’ Festivals, Film Festivals, Vivid Sydney, etc. • Co-designing and collaborating on performances and exhibitions • Mentoring external research partners • Involving users at all stages of the research, including working with user stakeholder and participatory groups • Memoranda of Understanding (MOU)/Agreements • Collect data around performance and the different types of public activities in which researchers generally report
their work to the community or use their research capacity to further the work of community organisations • Event participation statistics (public lectures, cultural events, exhibitions, etc.) • Outreach activities (public lectures, policy engagements, media engagements, community events) • Media coverage of exhibitions and new works • Modification of traditional 'commercialisation' metrics such as 'spin-offs' to capture arts entrepreneurship such
as setting up galleries, ensembles, groups and other professional practice entities • Metrics which capture social media activity • Any other indicator