achieving greener and cleaner cities: the role of green-navigation systems
TRANSCRIPT
www.TransformingTransportation.org
Achieving Greener and Cleaner Cities:
The role of Green-Navigation Systems
Fiamma Perez, Lee Schipper Scholarship Fellow
Presented at Transforming Transportation 2017
ACHIEVING GREENER AND CLEANER CITIES: The role of Green-Navigation Systems
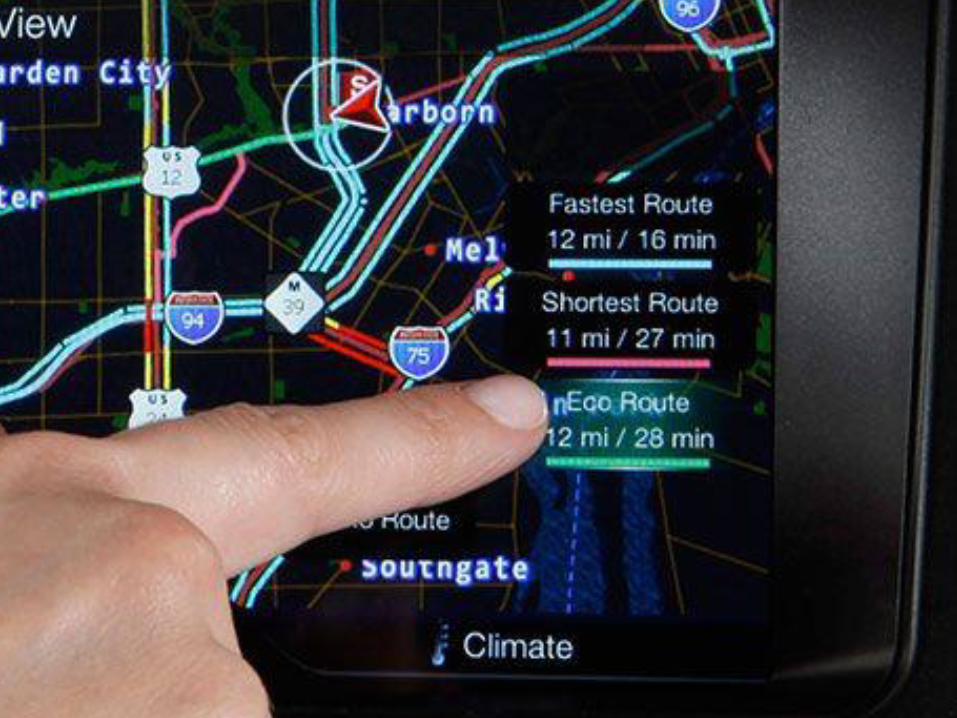
ECO-ROUTING
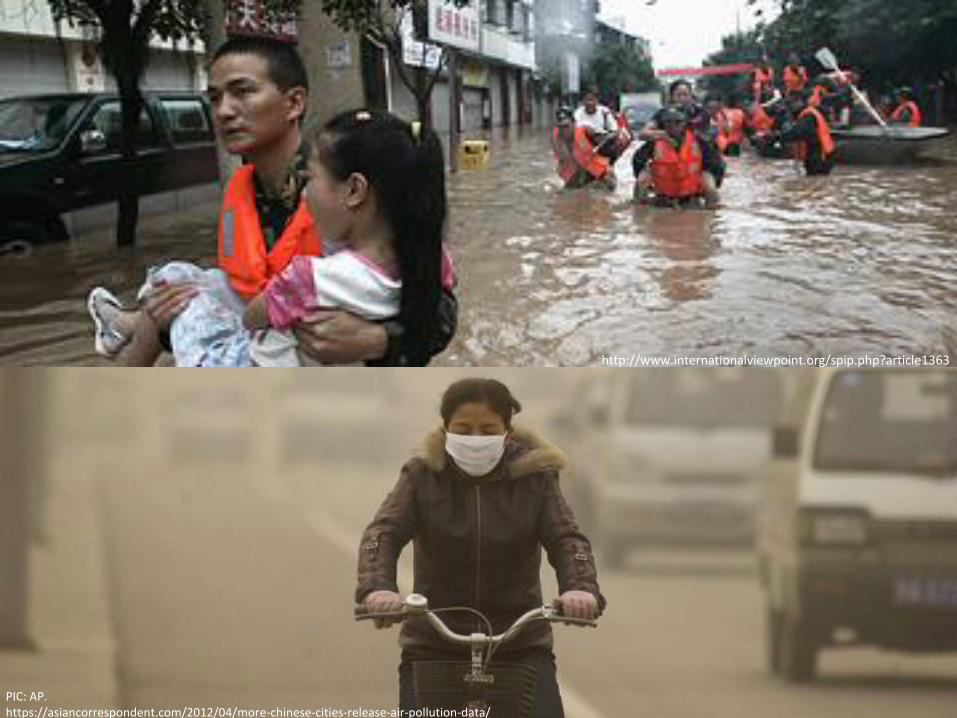
PIC: AP. https://asiancorrespondent.com/2012/04/more-chinese-cities-release-air-pollution-data/
http://www.internationalviewpoint.org/spip.php?article1363
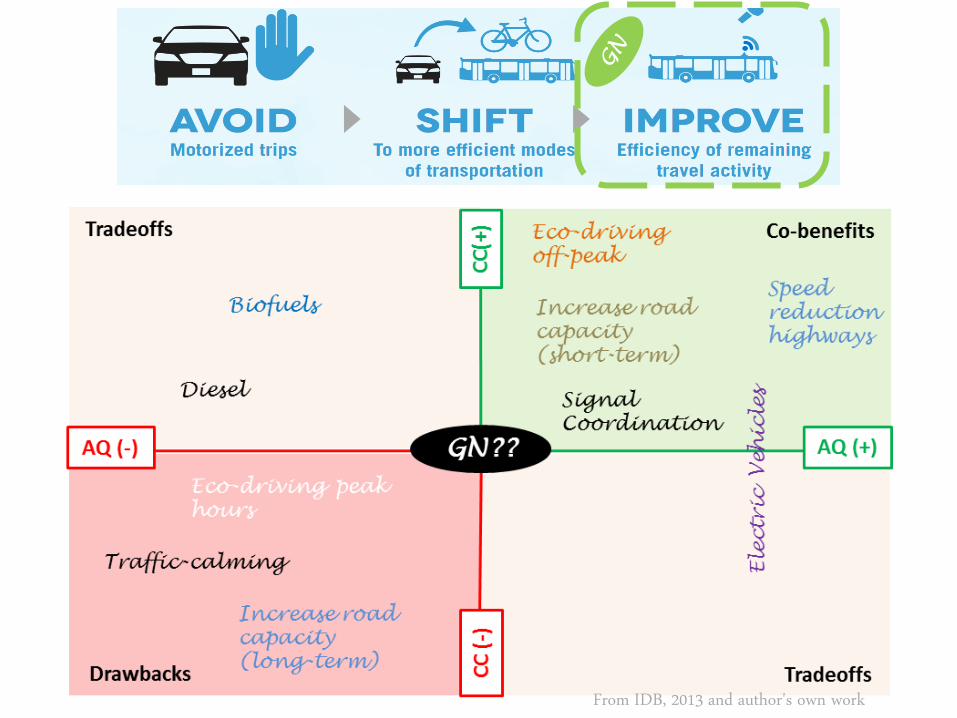
From IDB, 2013 and author's own work
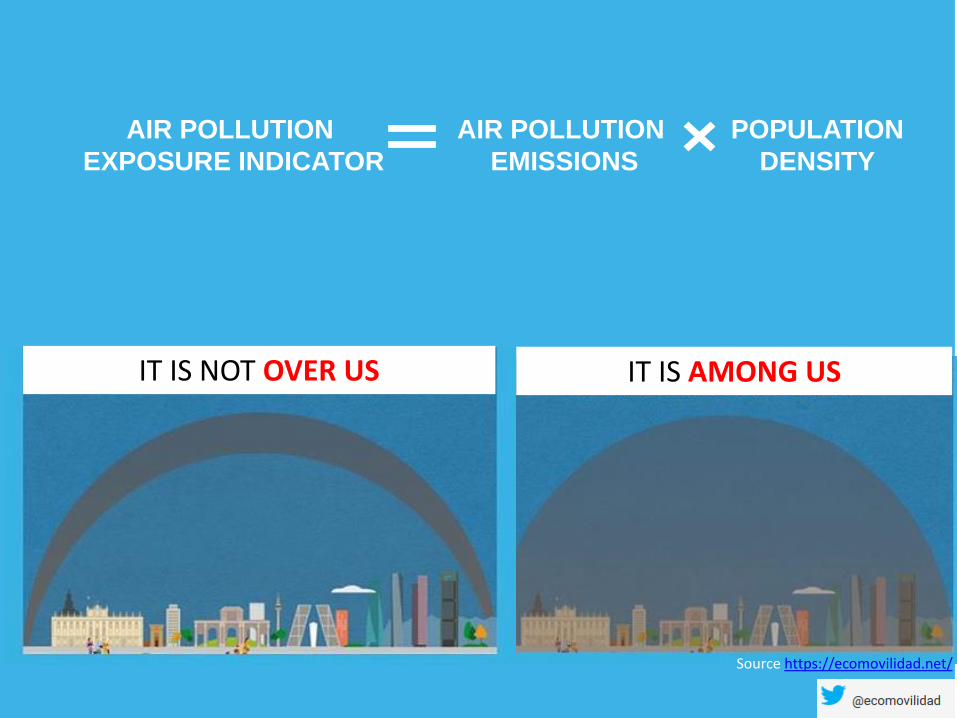
IT IS NOT OVER US IT IS AMONG US
Source https://ecomovilidad.net/
AIR POLLUTION
EXPOSURE INDICATOR
AIR POLLUTION
EMISSIONS
POPULATION
DENSITY
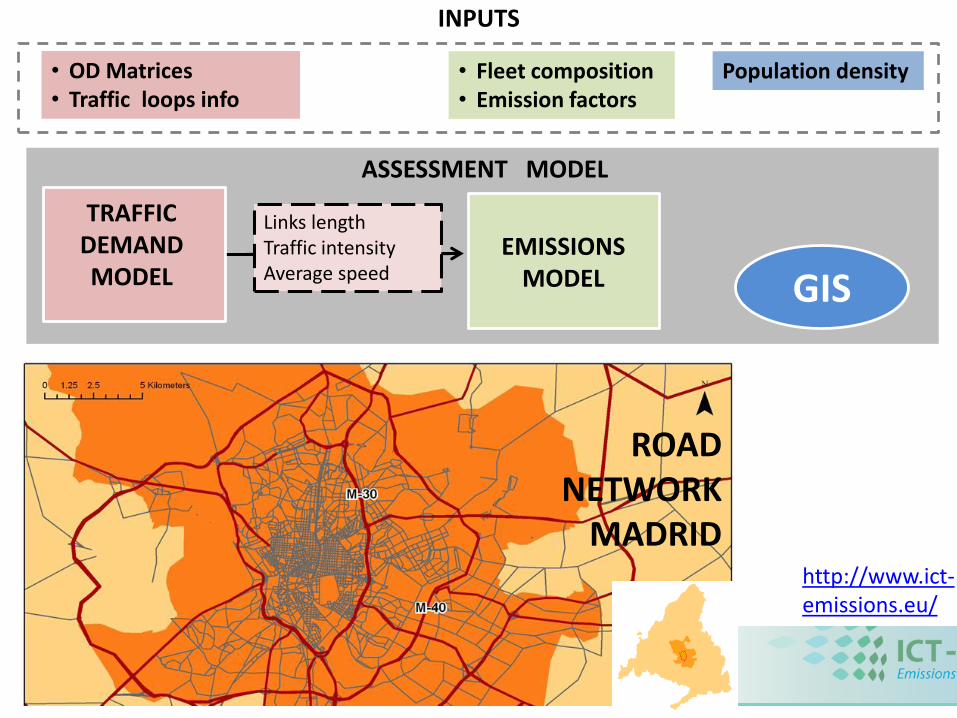
ASSESSMENT MODEL
TRAFFIC DEMAND MODEL
EMISSIONS MODEL
INPUTS
• OD Matrices• Traffic loops info
• Fleet composition• Emission factors
Links lengthTraffic intensityAverage speed
Population density
GIS
http://www.ict-emissions.eu/
ROAD NETWORK
MADRID

ASSESSMENT MODEL
TRAFFIC DEMAND MODEL
EMISSIONS MODEL
INPUTS
• OD Matrices• Traffic loops info
• Fleet composition• Emission factors
Links lengthTraffic intensityAverage speed
Population density
GIS
CONVENTIONAL DRIVERS GREEN-NAVIGATION DRIVERS
Impedance function:
f(time, monetary cost)
Impedance function:
f(fuel consumption)
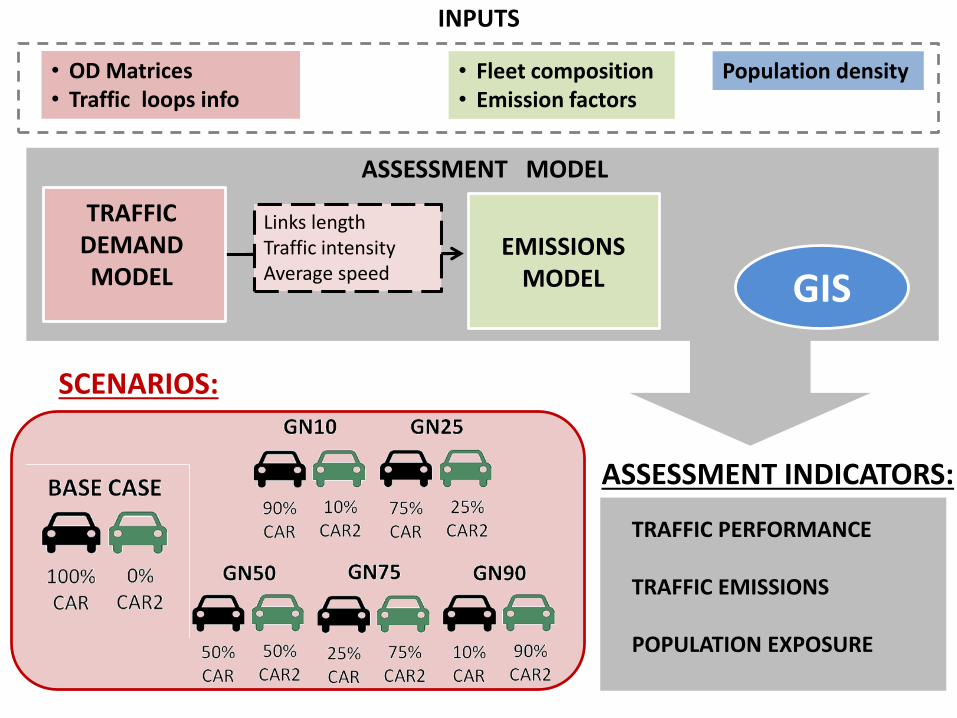
SCENARIOS:
ASSESSMENT MODEL
TRAFFIC DEMAND MODEL
EMISSIONS MODEL
INPUTS
• OD Matrices• Traffic loops info
• Fleet composition• Emission factors
Links lengthTraffic intensityAverage speed
Population density
GIS
ASSESSMENT INDICATORS:
TRAFFIC PERFORMANCE
TRAFFIC EMISSIONS
POPULATION EXPOSURE
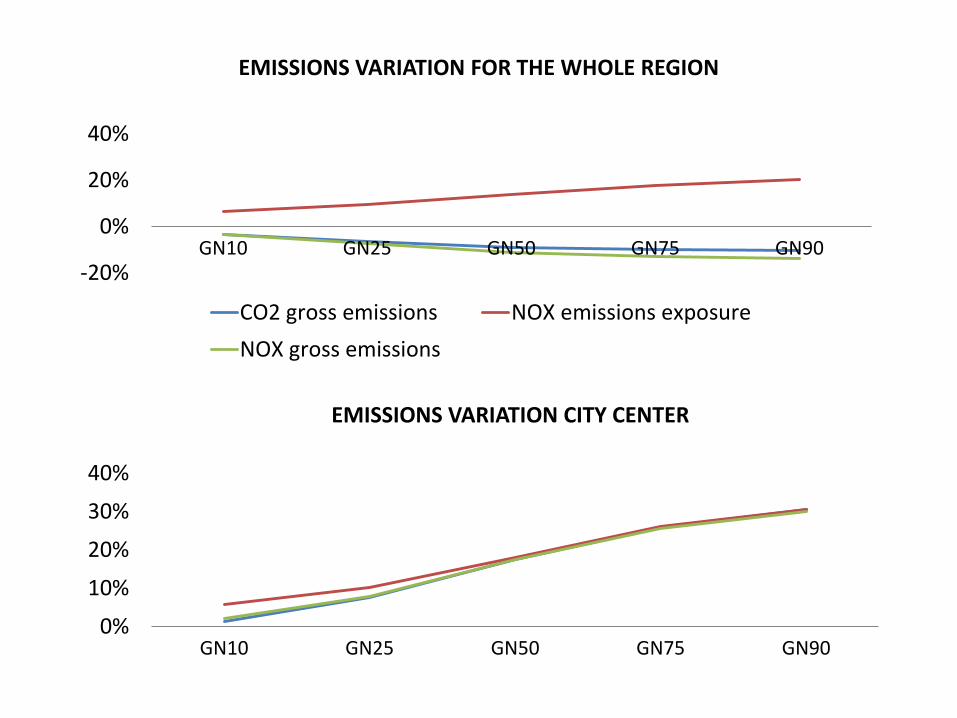
-20%
0%
20%
40%
GN10 GN25 GN50 GN75 GN90
EMISSIONS VARIATION FOR THE WHOLE REGION
CO2 gross emissions NOX emissions exposure
NOX gross emissions
0%
10%
20%
30%
40%
GN10 GN25 GN50 GN75 GN90
EMISSIONS VARIATION CITY CENTER
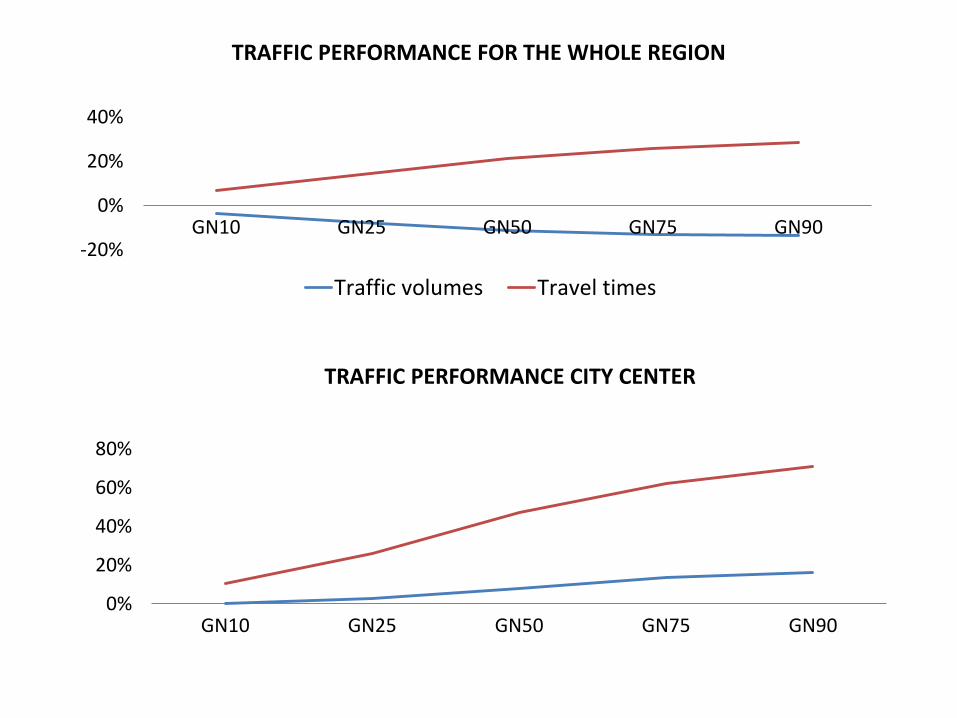
-20%
0%
20%
40%
GN10 GN25 GN50 GN75 GN90
TRAFFIC PERFORMANCE FOR THE WHOLE REGION
Traffic volumes Travel times
0%
20%
40%
60%
80%
GN10 GN25 GN50 GN75 GN90
TRAFFIC PERFORMANCE CITY CENTER
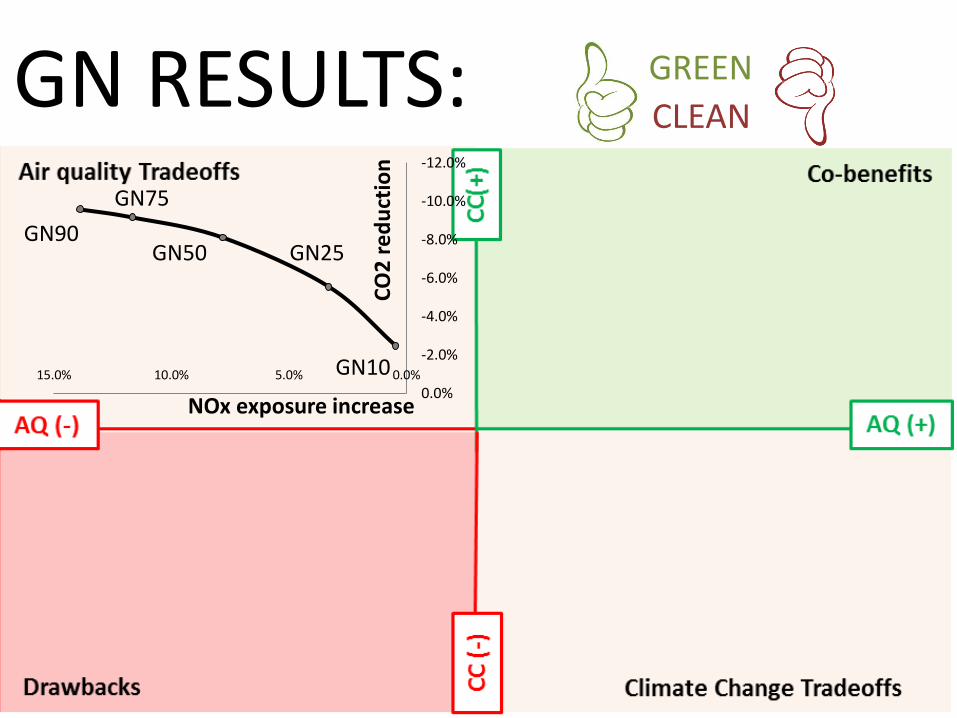
NOx exposure increase C
O2
re
du
ctio
n
-12.0%
-10.0%
-8.0%
-6.0%
-4.0%
-2.0%
0.0%0.0%5.0%10.0%15.0% GN10
GN25GN50
GN75
GN90
GN RESULTS: GREEN
CLEAN
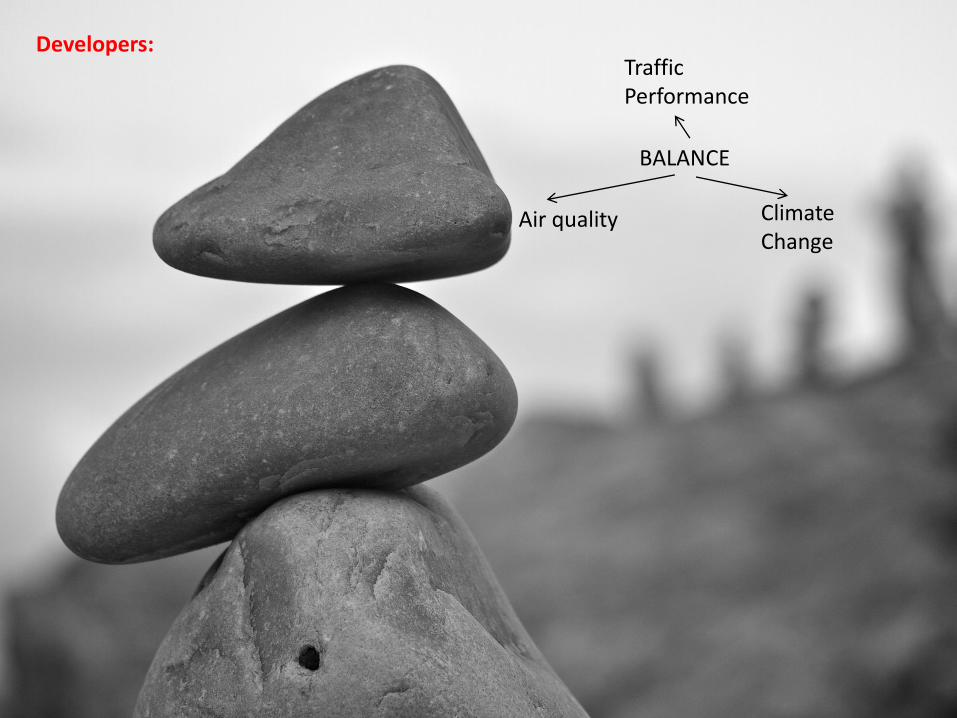
BALANCE
Traffic Performance
Climate Change
Air quality
Developers:
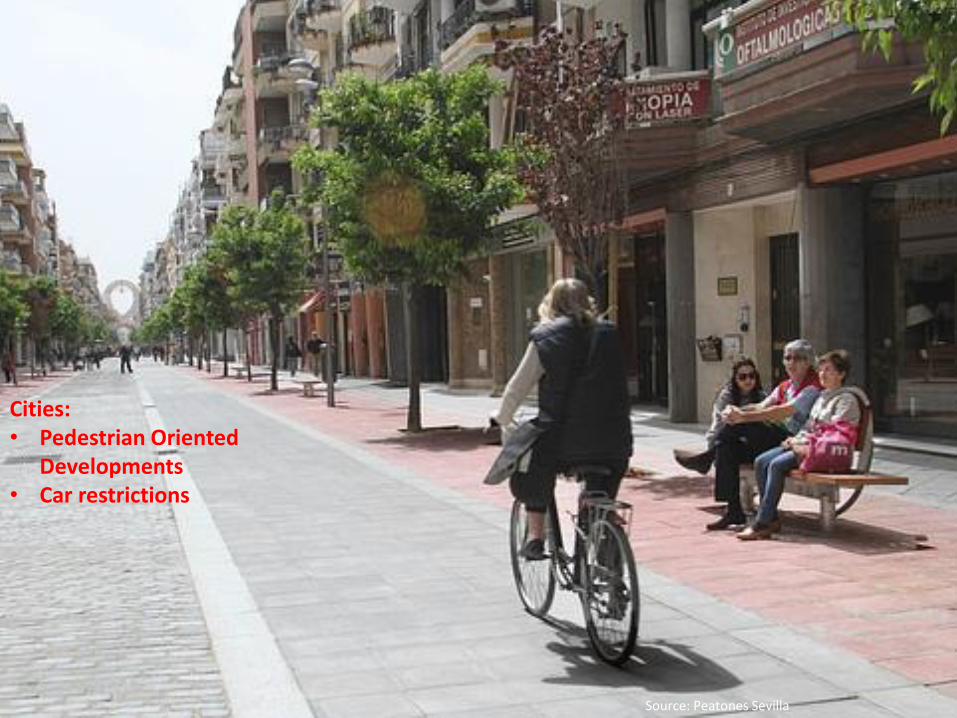
Source: Peatones Sevilla
Cities:• Pedestrian Oriented
Developments• Car restrictions

From individual savings to collective achievements
Fiamma [email protected]
Lee Schipper ScholarResearcher at TRANSyT – UPMhttp://www.transyt.upm.es/index.php/en/
THANK YOU