achieving health equity to eliminate tuberculosis (tb
TRANSCRIPT

© 2017 Denver Public Health
Achieving Health Equity to eliminate Tuberculosis (TB):
the true pathway for ending TB in Colorado
Michelle Haas, M.D.
Denver Metro Tuberculosis Program
Denver Public Health

© 2017 Denver Public Health
Goals
• Discuss the definition of health equity
• Review health inequities and health disparities in the U.S.
• Review the global and U.S. burden of Tuberculosis (TB)
• Discuss health inequities and disparities among individuals with TB
• Identify the challenges of TB elimination in the U.S.
• Achieving health equity to eliminate TB

© 2017 Denver Public Health
What is health equity?
• Health equity: every person has the opportunity to "attain his or her full health potential"
• Health inequities: unequal health differences closely linked with social, economic or environmental disadvantages that adversely affect groups of people
– Health inequities can lead to health disparities
http://sgba-resource.ca/en/concepts/equity/distinguish-between-equity-and-equality/

© 2017 Denver Public Health
Social Determinants of Health
McGinnis JM et al., Health Affairs 21, no.2 (2002):78-93
Schroeder SA et al. NEJM 2007;357:1221-8
5
40
15
30
10
PERCENTAGE
PROPORTIONAL CONTRIBUTION TO PREMATURE DEATH
health caregeneticssocial circumstancebehaviorenvironment

© 2017 Denver Public Health
Patient #1: Woman who is not taking her HIV medications
• Provider to patient: “Has anything interfered with your ability to take your HIV medications?”
• Patient to provider: “I want to take my HIV medications BUT….”
https://www.shutterstock.com/

© 2017 Denver Public Health
Patient #1: Woman who is not taking her HIV medications
• Health inequities compared to other HIV patients:
– Homeless (no place to store her medications)
– Competing priorities
• Searching for a job and caring for her children
– Food insecurity
– Physically limited in her ability to get to a clinic
• Health disparity results:
– Progression towards AIDS and ultimately death

© 2017 Denver Public Health
How can we measure health disparities?
• Identifying differences in the following:
– Life expectancy
– Infant mortality
– Disease outcomes
– Incidence of infectious diseases
• Across different socio-economic strata, racial/ethnic groups and gender

© 2017 Denver Public Health
Life Expectancy by Income in the U.S.
U.S. Life Expectancies by Percentile in
Comparison to
Mean Life Expectancies Across Countries
Expected Age at Death vs. Household Income Percentile
By Gender at Age 40
https://healthinequality.org/documents/ Chetty R, et al. JAMA. 2016 April 26; 315(16): 1750–1766

© 2017 Denver Public Health
Race-Adjusted Expected Age at Death: 40 Year Old Men
https://healthinequality.org/documents/ Chetty R, et al. JAMA. 2016 April 26; 315(16): 1750–1766
Bottom Quartile of U.S. Income Distribution
Note: Lighter Colors Represent Areas with Higher Life Expectancy

© 2017 Denver Public Health
Map of Denver neighborhoods and life expectancy
http://societyhealth.vcu.edu/media/society-health/pdf/LE-Map-Denver-Methods.pdf

© 2017 Denver Public Health
Income inequality life expectancy: associated factors
• General pattern: low-income people in affluent, educated cities with higher local government expenditures per capita, live longer (and have healthier behaviors)
Correlations of expected age at death: health and social factors
Higher life expectancy
https://healthinequality.org/documents/
Chetty R, et al. JAMA. 2016 April 26; 315(16): 1750–1766 Individuals in Bottom Quartile of Income Distribution

© 2017 Denver Public Health
Medicaid expansion associated with reduced Mortality in New York, Maine and Arizona
Variable
Baseline
mortality
Net change in
mortality after
Expansion
P value for
differences
# deaths/100,000
# deaths/100,000
(95% CI)
Entire cohort 320
-19.6
(-27.3 to 11.9) N/A
Race
White 309
-14.0
(-19.8 to -8.2) 0.04
Non-white 361
-41.0
(-64.7 to -17.3) reference
Age
20-34 yr 83
1.0
(-12.8 to 14.8) 0.006
35-64 yr 446
-30.4
(-41.0 to -19.9 reference
Level of poverty in county
High 334
-22.2 (-31.0 to -
13.5) 0.01
Low 283 -11.3 (-19.2 to 3.3) reference
Significant decrease in all-cause mortality in
expansion states, compared with control
states (−25.4 deaths per 100,000 population;
95% CI, −46.0 to −4.8; P=0.02)
Sommer BD, et al. NEJM 367;11
© 2017 Denver Public Health
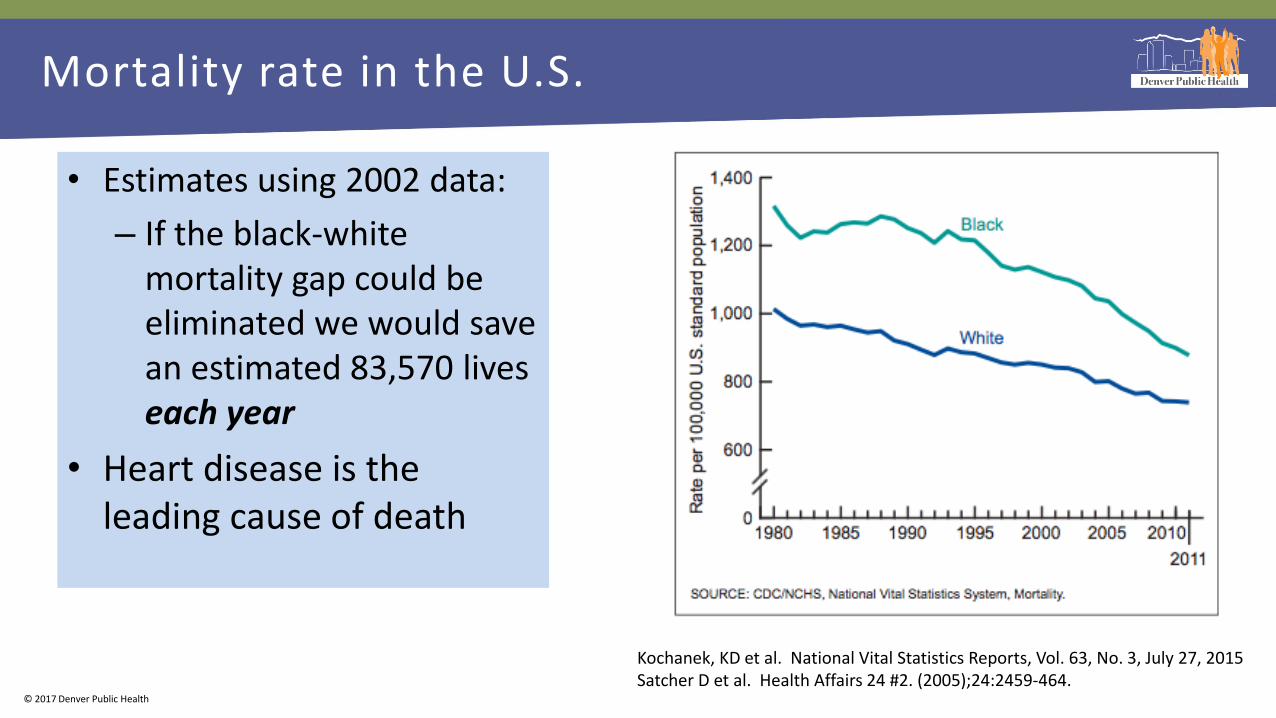
• Estimates using 2002 data:
– If the black-white mortality gap could be eliminated we would save an estimated 83,570 lives each year
• Heart disease is the leading cause of death
Kochanek, KD et al. National Vital Statistics Reports, Vol. 63, No. 3, July 27, 2015 Satcher D et al. Health Affairs 24 #2. (2005);24:2459-464.
Mortality rate in the U.S.

© 2017 Denver Public Health
Institute of Medicine, 2003:
• “It is likely that the vast majority [of clinicians] endorse egalitarian and non-racist attitudes.”
• “A large body of published research reveals that racial and ethnic minorities experience a lower quality of health services, and are less likely to receive even routine medical procedures than are white Americans."

© 2017 Denver Public Health
Unconscious/Implicit bias: automatic preference for one group over another
68% of test takers preferred European-Americans
Unconscious/implicit bias—refers to the attitudes or stereotypes that affect our understanding, action and decisions in an unconscious manner
https://implicit.harvard.edu/implicit/takeatest.html

© 2017 Denver Public Health
Implicit bias and its impact on clinical care
• Non-white patients of providers who have higher implicit bias favoring whites perceive lower quality of care
• The impact of implicit bias on clinical decision-making varies by specialty, and clinical scenario
– Pediatricians who have implicit-bias favoring whites demonstrated no difference in clinical decision making stratified by race
– Internists and ED physicians reviewing clinical vignettes: less likely to offer thrombolytics to black patients with coronary artery disease
• Informing them of their bias lessened its impact in future decisions
Blair IV et al. Ann Fam Med. 2013 Jan-Feb;11(1):43-52. Green AR, et al. J Gen Intern Med. 2007;22(9):1231–8. Sabin JA, Greenwald AG. Am J Public Health. 2012;102(5):988–95.

© 2017 Denver Public Health
Summary
• Racial/ethnic and income-related health disparities identified:
– Life expectancy and health outcomes
– Racial/ethnic disparities persist after accounting for differences in income and education
– Unconscious bias favoring whites a contributing factor
• Higher life expectancy may be seen in communities with increased access to public resources and education
– Medicaid Expansion under the Affordable Care Act in selected states:
• Associated with reduced mortality for people of color and those living in high poverty communities

© 2017 Denver Public Health
THE TUBERCULOSIS EPIDEMIC IN 2017

© 2017 Denver Public Health
Patient #2
• 60 year old man without health insurance, receives care through a sliding scale payment system at a public safety net hospital
– Diagnosed with drug-resistant pulmonary tuberculosis
– Family—wife and 2 adopted younger children
– Required to remain isolated for several weeks, loses his job
– Now unable to pay his mortgage
– Outreach staff discover there is very little food in the house, one of the children is in need of shoes for school

© 2017 Denver Public Health
Patient #2: addressing health inequities
• TB clinic provides:
– TB related services at no cost to the patient
– Resources for food
• TB clinic patient assistance fund is able to cover mortgage
– Avoids public health threat of an infectious homeless patient
– Preserves housing resource
• Result: able to stay on TB treatment, social situation is stabilized
– Health disparity avoided: death from TB and infection of family members

© 2017 Denver Public Health
TB is the leading cause of death from an infection globally
– 1 million children
Global Tuberculosis Report 2016
www.results.org
www.who.int
1.8 million deaths

© 2017 Denver Public Health
TB infection (latent TB) is very common globally
www.who.int
Latent TB: infection with M. tuberculosis without any symptoms or abnormalities identified after testing (i.e., your chest radiograph is normal and you feel well)

© 2017 Denver Public Health
For the first time in 2 decades, overall TB incidence remained flat in the U.S.
9,563 persons with active TB in 2015
compared to 9,421 in 2014
Incidence is 15.1/100,000 in
foreign born persons
Salinas JL, et al. MMWR Morb Mortal Wkly Rep 2016; 65: 273-278
Incidence of TB in the US: 3.0/100,000
Incidence of TB in Colorado:
1.3/100,000

© 2017 Denver Public Health
TB case rates by race/ethnicity, U.S., 2003–2014
Cas
es p
er
10
0,0
00
Salinas JL, et al. MMWR Morb Mortal Wkly Rep 2016

© 2017 Denver Public Health
Racial/ethnic disparities in recent transmission of TB
• Analysis from Jan 2011-Sept 2014
– n=26,586 genotyped cases
– Evidence for recent transmission in 14%
• 91% among individuals born in the U.S.
• After multivariable analysis, adjusted prevalence ratio (aPR) was higher for:
– Children < 4 years of age
– People of color
– Individuals reporting homelessness
Yuen CM, et al. PLoS ONE 11(4): 2016

© 2017 Denver Public Health
13 million individuals with latent TB in the US
Miramontes, PLoS One, 2015
TST prevalence: no travel to TB endemic area TST prevalence: lived in TB endemic area
158,000 individuals with latent TB in Colorado

© 2017 Denver Public Health
Higher TB incidence as Socio-economic status (SES) decreases
Cantwell MF, et al. AJRCCM 1998
• SES likely influences TB risk in 2 ways:
– 1) direct effect of living in crowded conditions
– 2) SES–health gradient: TB risk increases as SES decreases
Adjustment for the six indicators reduced risk ratios by half for Black Americans, Hispanics and Native Americans
41.6
7.4

© 2017 Denver Public Health
Health inequities and disparities associated with
migration
• N=248 from Los Angeles County
– Half smear-positive; 1/3 with cavitary disease
• Average delay in seeking care was 74 days
– Exposed an average of 8 additional people at home or work
Asch S, et al. AJRCCM 1998;157:1244–1248.
Factor
% with
Factor (n)
% of those with
Factor who
delayed(n)
% of those
without factor
who delayed (n)
p
value
Unemployed 49% (115) 25%(29) 14% (17) 0.033
Unsure
where to go 24% (57) 33% (19) 16% (28) 0.003
Anticipated
high cost 43% (101) 27%(27) 14%(19) 0.018
Anticipated
long wait in
office 44% (102) 26% (26) 14%(18) 0.023
Anticipated
long wait for
appt 30%(72) 28%(20) 16%(27) 0.043
Fear of
immigration
authorities 6%(15) 47%(7) 18%(40) 0.007
Thought
could self-
treat 32% (77) 31%(24) 14%(23) 0.002

© 2017 Denver Public Health
Health inequities resulting from migration: World Health Organization recommendations
• Avoid disparities in health status and access to health services between migrants and the host population
• Ensure migrants’ health rights
• Put in place lifesaving interventions so as to reduce excess mortality and morbidity
• Minimize the negative health outcomes of the migration process on migrants’ health outcomes
Kontunen, K, et al. Health Promotion International, Vol. 29 No. S1, 2014.

© 2017 Denver Public Health
Marion, Alabama: community with significant TB transmission in the U.S.
• Population 3600
• 2 hours from Tuskegee
• Poorest county in Alabama
• 20% uninsured (Alabama did not accept Medicaid Expansion)
• Average income $13,000
• Since 2014: 29 with active tuberculosis (TB) incidence 253/100,000
• 150 with latent TB
https://www.hsph.harvard.edu/ecpe/tuberculosis-in-rural-america-what-tuberculosis-in-marion-al-tells-us/

© 2017 Denver Public Health
TB in the U.S.
• Most TB disease in the U.S is due to reactivation of latent infection
• The prevalence of latent TB is higher among individuals who were born or who lived outside of the US
• Lack of clear options for healthcare, and possibly the threat of deportation associated with delays in care for migrants
• Recent TB transmission affects children, people of color and individuals who are homeless
• Increasing TB incidence strongly correlates with lower socioeconomic status
– Accounts for half of racial/ethnic disparities identified

© 2017 Denver Public Health
Can We Eliminate TB?

© 2017 Denver Public Health
At least 70% of individuals with active TB in Colorado could have avoided developing TB disease
Race/ethnicity for individuals with active TB who
are US-born, 2012-2016 (N= 74)
n %
Colorado
Demographics
Hispanic/Latino 25 34% 17%
Black 15 20% 4%
Asian 2 3% 2%
American Indian 2 3% 1%
White 30 41% 82%
US-born 22%
< 1 year 10%
1-5 years 20%
> 5 years 48%
INDIVIDUALS WITH ACTIVE TB IN COLORADO BY YEARS IN U.S. TO DIAGNOSIS, 2009-2016
Of those tested at diagnosis and with known years in US to diagnosis, 155/222 (70%) of persons had been here for 1 year or more and tested positive for TST or IGRA at diagnosis

© 2017 Denver Public Health
31% 17% 13% 0
1000
2000
3000
4000
5000
6000
7000
8000
9000
LatentTuberculosis
Infected
Aware of Status Started onTreatment
CompletedTreatment
Nu
mb
er
of
Pati
ents
5-10% lifetime risk of developing active TB = 340-680 individuals
*Single risk factor—prior residence in a TB endemic area
Denver Health Primary Care Latent Tuberculosis Infection Cascade of Care*, 2012-2014

© 2017 Denver Public Health
Projected Time to TB Elimination in the U.S.
Dye C, et al. Annual. Rev. Public Health 2013.

© 2017 Denver Public Health
Achieving Elimination By Advancing Health Equity

© 2017 Denver Public Health
Improved population health associated with decreased TB incidence
Health indicator Adjusted estimate of effect on change in
TB incidence between 1990-2005 Increase in life expectancy by
one year -7.8 Increase in measles vaccination
coverage -1.3 1% increase in TB treatment
success rate -0.9
Oxlade, O et al. IJTLD 2009

© 2017 Denver Public Health
Increased social protection spending is associated with decreased TB incidence
• Social protection spending:
– Cash benefits or benefits in kind for disabled, elderly, families, unemployed, homeless, low income earners
– Housing benefits
• Increase of US $100 per person:
– 1.5% decrease in # TB case notifications
– 1.7% decrease in estimated TB incidence
Reeves A, et al. Lancet Infect Dis 2011
(r= –0.65; p=0.0003)
21 European countries 1995, 2012
© 2017 Denver Public Health
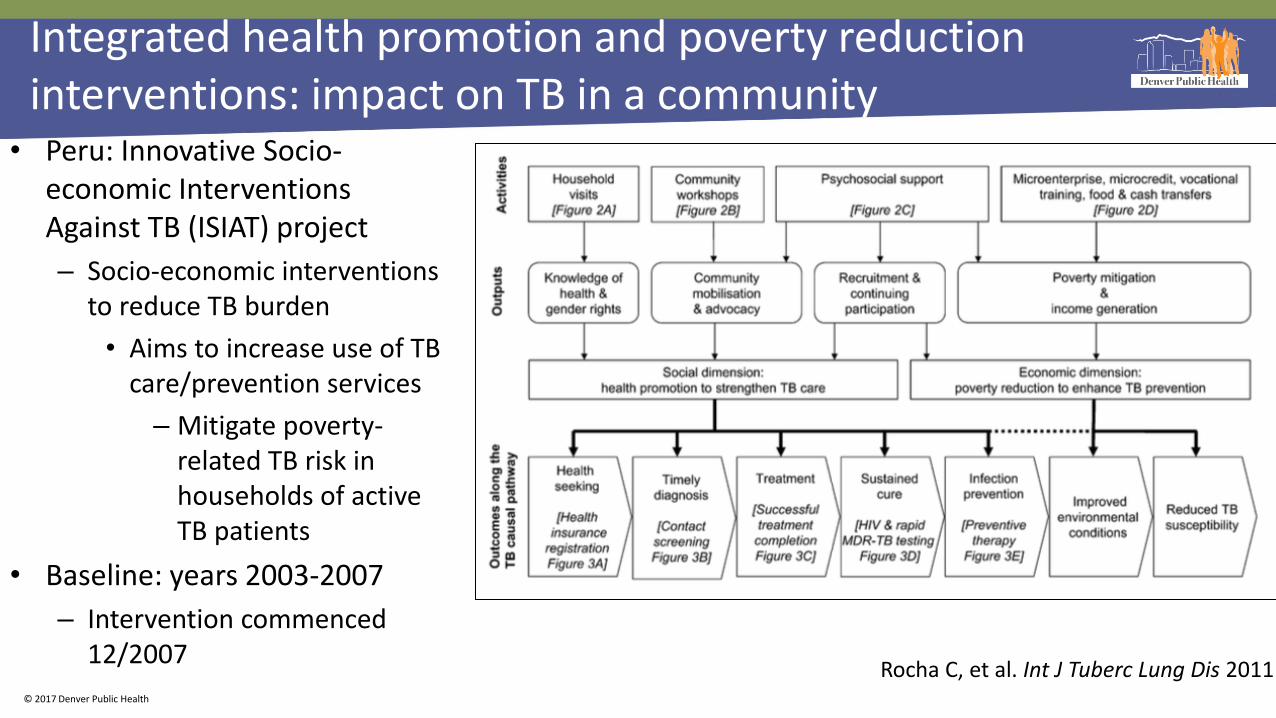
Integrated health promotion and poverty reduction interventions: impact on TB in a community
• Peru: Innovative Socio-economic Interventions Against TB (ISIAT) project
– Socio-economic interventions to reduce TB burden
• Aims to increase use of TB care/prevention services
– Mitigate poverty-related TB risk in households of active TB patients
• Baseline: years 2003-2007
– Intervention commenced 12/2007
Rocha C, et al. Int J Tuberc Lung Dis 2011

© 2017 Denver Public Health
Pre-interventions: A) 216 patients; B) 642 contacts; C) 1554 patients; D) 190 MDR-TB patients testing, 72 for HIV testing E) 2829 contacts initiated LTBI therapy; n=1116 contacts with treatment completion. Post intervention: : A) 318 patients; B) 748 household contacts; C) 307 patients; D) 307 MDR- TB patients testing, 318 for HIV testing; E) 542 contacts for LTBI therapy; 441 contacts with treatment completion. * Indicates P < 0.00001 for pre-interventions vs. post-interventions
RESULTS
Interim analysis of 2078 individuals, 336 with active TB

© 2017 Denver Public Health
Domestic Returns from Investment in the Control of Tuberculosis in Other Countries
Modeling cost-effectiveness of investing in TB services in other
countries • Expansion of DOTS in Mexico
through allocation of $34.9 million:
• 2591 fewer cases of tuberculosis in the US
• Net savings of $108 million over 20 years
Schwartzman K N Engl J Med 2005;

© 2017 Denver Public Health JAMA, 2016

© 2017 Denver Public Health
Automatic clinical reminders can improve TB preventative screening
• 4135 patients registering during the post-intervention phase
– 73% had at least one CDC-defined risk factor
– 610 met the alert criteria (birth in a high-risk TB country and aged 40 years)
– 183% increase, in adherence to screening recommendations (p=0.001)
Steele AW et al. Am J Prev Med 2005;28(3):281–284

© 2017 Denver Public Health
Future interventions
3. Preventing TB infection
• Decreasing crowded housing and greater pathways to housing for homeless individuals
1. Preventing TB disease for individuals who are already infected
• Increasing collaboration for TB services with countries from whom we receive a significant proportion of immigrants
• Evaluating and alleviating implicit bias as it impacts TB prevention services
• Extend health insurance for all individuals
• Mitigate the unmeasured costs of accessing healthcare: transportation, need for childcare, loss of wages
• Community education to address the stigma of TB
2. Minimizing delays in diagnosis of individuals with TB disease
• Extending health insurance for all individuals
• Evaluating and alleviating any threat of deportation that impacts delays in care
• Use of electronic medical record reminders for evaluating TB infection and disease

© 2017 Denver Public Health
Summary
• Health inequities can lead to health disparities and are pervasive in healthcare and our community
• The impact of TB is felt most by:
– people of color
– those with lower socio-economic status
– Individuals who were born or have lived in TB endemic areas
• Addressing racial/ethnic and economic health disparities in our community will likely propel us towards TB elimination in the U.S. and in Colorado

© 2017 Denver Public Health
Of all the forms of inequality,
injustice in health is the most
shocking and inhuman
-Martin Luther
King, Jr http://old.seattletimes.com/special/mlk/