achieving maximum long-term growth
TRANSCRIPT

427
Achieving MaximumLong-Term Growth
Jean-Claude Trichet
The title of our panel today is Setting Policy Priorities for Long-Term Growth. Given all of our recent struggles to regain our reference growth paths, it may strike some as something of a luxury to think about the long run; central bankers and policymakers have had to devote unprecedented attention to higher-frequency economic de-velopments. Many new lessons have been learned; many policy and institutional innovations have been introduced.
The recent financial crisis has produced a large and persistent downturn in our economies; a downturn, moreover, that threatens our long-run growth potential. It is therefore entirely natural that policymakers do not lose sight of the prerequisites for stable sustain-able growth.
This is especially so for most of the advanced economies, including the euro area, characterized (as it has been in recent decades) by de-clining potential growth rates. In the face of any economic predica-ment, one should ask oneself two questions—what got us here, and what can get us out? In the wider case of sustainable growth for the euro area, what matters is a commitment to structural reforms and sound macroeconomic policies. In the case of the financial matters, a robust macroprudential and supervisory framework is the key. I will address both of these issues in my coming remarks.

428 Jean-Claude Trichet
Likewise, some may consider it unusual to solicit views on matters of long-run growth from the president of a central bank. After all, pick up just about any growth-theory textbook and you’ll find few references to inflation and fewer still to monetary policy. Monetary policy is fundamentally viewed as neutral over the long run.
And indeed, inflation is ultimately a monetary phenomenon. Growth, in turn, is ultimately a real one reflecting, in particular, technology, education and training, capital accumulation, institutional quality.
Nonetheless, monetary-policy institutions can play and have played a fundamental role in supporting long-run, sustainable growth. In many ways, I see a parallel between the theory and practice of mone-tary policymaking and the shaping of modern growth analysis, which emphasizes the role of sound/proper institutions.
That achieving high and sustainable growth matters, however, is easy to motivate. On the subject of growth differences across countries, Lu-cas (1988) memorably wrote: The consequences for human welfare involved in questions like these are simply staggering: Once one starts to think about them, it is hard to think about anything else.
I. What Drives Growth in the Long Run?
So let’s start to think: what does drive growth in the long run? In fact, growth theory—much like central banking—has come a long way. As everyone knows, Solow’s work in the late 1950s produced two startling insights.1 First, that smooth factor substitutability could rid us of the Harrod-Domar boom-bust cycle. This, in fact, paved the way for a proper analysis of sustainable growth.2 His second insight was that growth was driven not only by factor accumulation but also by technological progress.
Fundamentally, technological progress and innovation are, over the long run, the prime drivers of economic growth and also impor-tant reasons for differences in international economic performance, even though demographic differences are also very relevant. Higher growth rates of technical innovation raise output and can lower the non-inflationary rate of unemployment.

Achieving Maximum Long-Term Growth 429
But what is technical change? Cracking open the Solovian black box of technical progress has taken us from theories of learning-by-doing to the impact of R&D on product variety and quality. The latter theories being underpinned by Paul Romer’s reflection on the fact that ideas are fundamentally nonrival.3 This concept, by the way, was not really new. The famous letter of Thomas Jefferson to Isaac McPherson expressed it very clearly in 1813.4 The bottom line in all of this is that knowledge spillover between open, dynamic economies could benefit everyone. Not surprisingly, these new developments in growth theory came replete with policy prescriptions.
A more recent but allied literature suggested the following: how close an economy is to the technological frontier and whether its institutions facilitate convergence to that frontier are vital consider-ations.5 In effect, a laggard country gains by implementing (or jump-ing to) frontier technologies.6 But an economy near the frontier—or with an appetite to define that frontier—should increasingly favor innovation over imitation.
Like many close to European policy7, I find this an attractive frame-work. Indeed, following World War II, the European economies were remarkably catching up in productivity and technological terms and today are leaders in many fields, in particular as concerns the embed-ding of technological innovation in manufacturing processes.8 Yet, there is still an enormous potential to tap, to reform our economies and boost their growth potential and job creation.9
II. Growth Patterns in the Euro Area and the United States
Debates about the United States versus the euro area have become commonplace in recent years. To my mind, though, such debates often fall short of a careful, nuanced analysis. Some international comparisons are indeed informative and yield important insights. Others—given lack of harmonized data, data concept or data unit—are more suspect. The crisis, though, has taught us that growth is only meaningful if it is sustainable and balanced. Growth that is not sustainable but follows boom-bust cycles carries enormous costs in terms of economic well-being. These costs go far beyond pure GDP

430 Jean-Claude Trichet
numbers; the deepest of these costs is that they, in some cases, put a strain on the fabric of our societies. For that reason alone, sustain-ability is a key qualification to associate to growth. The second key term is the balance of growth, both in domestic and external terms. Domestically balanced growth implies a broadly acceptable distribu-tion of economic well-being within societies in terms of income and wealth as well as the avoidance of misalignments especially of asset prices; and externally balanced implies the need to avoid excessive international disequilibria.
Since the introduction of the single currency in 1999, the euro area has experienced a per-capita growth rate that, at around 1 percent a year, is comparable to that in the United States (1.1 percent). This is the first fact that is often overlooked in international comparisons. In such comparisons, we often look at headline growth numbers; yet, demographics are very different. Adjusted for population growth, there has been virtually no difference between growth in the United States and the euro area over the first decade since the introduction of the single currency. The euro area, though, has created more jobs: 14 million compared with 8 million in the United States. Further, over recent decades differences in country and state dispersion rates of growth and inflation in the euro area and United States are re-markably similar. On employment, moreover, it will be interesting to compare our different evolutions in the coming years. What we all want to avoid is excessively volatile employment where human capital is all too easily lost and inequality deepens.
Table 1 shows a detailed comparison of the euro area with the United States over recent decades. This makes the standard growth accounting of contributions into employment and labor productiv-ity. Labor productivity itself can be further decomposed into changes in labor composition, information and communication technologies (ICT) and non-ICT usage per hour and (residual) total factor pro-ductivity (TFP) growth. The interest in the distinction between ICT and non-ICT reflects recent evidence that the ICT sector has been strongest where most growth has emerged across the world economy.

Achieving Maximum Long-Term Growth 431
Table 1Average Rates of Growth and Contributions (1995-2007)
Growth Rate of Output
Contribution to Growth from
Labor productivity contributions from
Hours Worked
Labor Productivity
Labor Productivity
ICTCapital
Per Hour
Non-ICT Capital
Per Hour
TFP
1=2+3 2 3 4 5 6 7=3-(4+5+6)
Euro Area 2.2 0.5 1.7 0.1 0.4 0.6 0.5
U.S. 3.5 0.6 2.9 0.3 1.0 0.5 1.1
Austria 2.7 0.4 2.4 0.2 0.5 0.2 1.5
Belgium 2.5 0.5 2.0 0.2 0.9 0.6 0.2
Finland 4.5 1.0 3.5 0.1 0.6 0.2 2.5
France 2.5 0.4 2.1 0.4 0.3 0.5 0.9
Germany 1.3 -0.3 1.7 0.0 0.5 0.5 0.7
Ireland 7.6 2.1 5.5 0.3 0.4 3.3 1.6
Italy 1.7 0.7 1.0 0.1 0.3 0.7 -0.2
Netherlands 3.1 0.7 2.4 0.3 0.5 0.6 1.0
Spain 3.5 2.0 1.5 0.4 0.5 1.4 -0.7
Source: EUKLEMS database
Looking over the contributions, we note a significant difference in labor productivity (1.7 for EU13 vs. 2.9 for the United States). The main drivers in this comparison of labor productivity are ICT capital services per hour (0.4 vs. 1.0) and, perhaps more significantly from our standpoint, economywide TFP (0.5 vs. 1.1). Although having said that, there turns out to be quite some heterogeneity among countries,
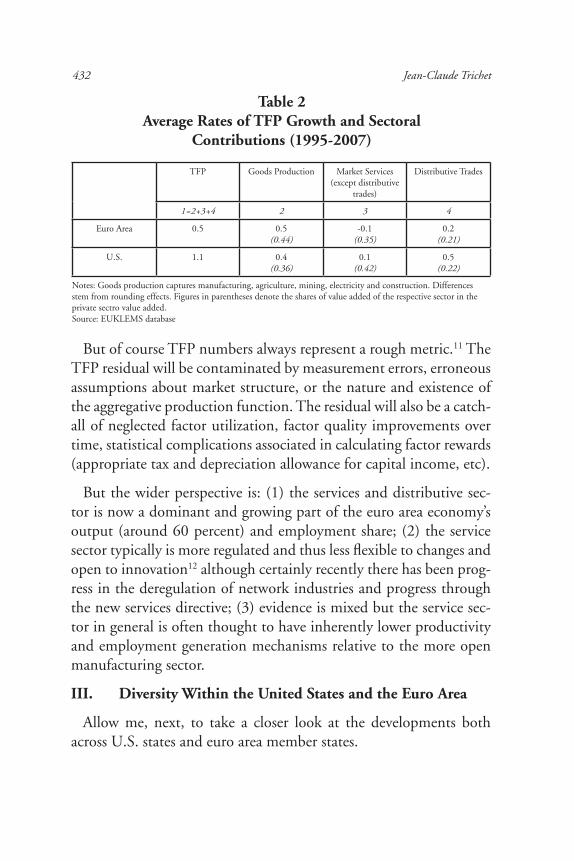
Moreover, see Table 2, which analyzes the sectoral decomposition of TFP growth. TFP in the production of goods is slightly larger in the euro area than in the United States. Rather, the higher overall TFP growth in the United States is driven by stronger TFP growth in services, in particular in distributive trade (0.2 vs. 0.5).10 Although, in passing, we should remember that productivity and technical im-provements in services are plagued by measurement difficulties.
432 Jean-Claude Trichet
But of course TFP numbers always represent a rough metric.11 The TFP residual will be contaminated by measurement errors, erroneous assumptions about market structure, or the nature and existence of the aggregative production function. The residual will also be a catch-all of neglected factor utilization, factor quality improvements over time, statistical complications associated in calculating factor rewards (appropriate tax and depreciation allowance for capital income, etc).
But the wider perspective is: (1) the services and distributive sec-tor is now a dominant and growing part of the euro area economy’s output (around 60 percent) and employment share; (2) the service sector typically is more regulated and thus less flexible to changes and open to innovation12 although certainly recently there has been prog-ress in the deregulation of network industries and progress through the new services directive; (3) evidence is mixed but the service sec-tor in general is often thought to have inherently lower productivity and employment generation mechanisms relative to the more open manufacturing sector.
III. Diversity Within the United States and the Euro Area
Allow me, next, to take a closer look at the developments both across U.S. states and euro area member states.
Table 2Average Rates of TFP Growth and Sectoral
Contributions (1995-2007)
Notes: Goods production captures manufacturing, agriculture, mining, electricity and construction. Differences stem from rounding effects. Figures in parentheses denote the shares of value added of the respective sector in the private sectro value added.Source: EUKLEMS database
TFP Goods Production Market Services(except distributive
trades)
Distributive Trades
1=2+3+4 2 3 4
Euro Area 0.5 0.5(0.44)
-0.1(0.35)
0.2(0.21)
U.S. 1.1 0.4(0.36)
0.1(0.42)
0.5(0.22)

Achieving Maximum Long-Term Growth 433
For the euro area it is very common to look at the level of its con-stituent countries and focus on the diversity among individual states, because a number of economic policy choices that affect productivity are national.
For the United States, this exercise is rarely done. It is often con-jectured that relevant policies are federal, and therefore by definition uniform at the level of the federation; and that, as a consequence, differences at the state level play much less of a role. In essence, it is therefore often assumed that the U.S. economy would be signifi-cantly more homogeneous than the economy of the euro area.
Looking more closely at the regional dispersion across U.S. regions and euro area economies does not confirm this. In fact, the disper-sion of many of the key indicators is surprisingly similar.
Let me share with you some findings from our analysis that we started some months ago and begin with inflation.13 Before the crisis, the dispersion of HICP inflation in euro area countries had remained broadly stable since the late 1990s, at a level similar to the 14 U.S. Metropolitan Statistical Areas.14 During the crisis we saw a tempo-rary increase in inflation dispersion in the euro area but this has been reversed over the past 12 months (Chart 1).
The picture is similar for the dispersion of GDP growth. Before the crisis the dispersion of growth rates was around 2 percent, in both the euro area and the United States. Dispersion rose somewhat during the crisis in both currency areas but remained broadly in line with pre-crisis patterns overall (Chart 2).15
Going one step further, investigation of the sources of this growth dispersion in the United States and euro area economies reveals parallels even in the root causes of dispersion in economic performance and productivity. On the one hand, both currency areas comprise re-gions that experienced a significant boom and bust cycle over the past decade. On the other hand, both also contain regions that are facing significant structural challenges of a more long-term nature.

434 Jean-Claude Trichet
Chart 1Dispersion of Annual Inflation
Chart 2Dispersion of Real GDP Growth
0
1
2
3Euro Area (12 countries) U.S. (14 MSAs)
Unweighted standard deviation in percentage points
1995 1997 1999 2001 2003 2005 2007 2009 2011
0.0
0.5
1.0
1.5
2.0
2.5
3.0
3.5
4.0Unweighted standard deviation of growth rates in percentage points
Euro Area (12 countries) U.S. (50 States & District of Columbia)
1990 1992 1994 1996 1998 2000 2002 2004 2006 2008 2010
Note: MSAs: Metropolitan Statistical Areas.Sources: Eurostat, U.S. Bureau of Labor Statistics, ECB calculations
Note: There is a statistical break in the U.S. regional data in 1998. For the U.S. the data refer to Gross Domestic Product (GDP) by state.Sources: European Commission, U.S. Bureau of Economic Analysis, ECB calculations

Achieving Maximum Long-Term Growth 435
In the United States, for example, Nevada, Arizona, Florida and Cali-fornia experienced increases in house prices that outpaced the national average by a wide margin. The steep house price increases accompanied above average growth in these states. This could probably be explained, at least in part, by the impulse that these states received from the hous-ing-related sectors such as construction, which saw its share in terms of value added increase at the national level during the years of the hous-ing boom. In the crisis, the sharp fall in house prices in Florida and the southwestern states turned boom into bust. These states experienced the harshest recession in the United States.16
Similarly, in the euro area some countries experienced asymmetric boom and bust cycles. Several euro area countries had higher than av-erage growth in the pre-crisis years. In Ireland and Spain particularly, strong growth was accompanied by strong increases in housing prices.
At the same time, other U.S. states, particularly the former manu-facturing powerhouses in the Great Lakes region, have seen a long episode of below average growth. Below average performance of the region—and particularly weaker growth rates in Michigan and Ohio—are related to strong reliance on manufacturing. Structural shifts in the U.S. economy toward services have gradually reduced the value added of manufacturing relative to GDP, with implications for areas with a high concentration of companies in manufacturing industries other than information and communications technology. During the crisis, GDP growth in the Great Lakes region, which was below average before the crisis, remained below average.
Similarly, other countries in Europe—Portugal, for example—have experienced growth persistently below the euro area average for the past decade due to structural rigidities that are now being addressed.
Just a few years ago, the low-growth group of countries included Germany—labeled the “sick man of Europe” at that time. Yet Ger-many is now an example of how big the dividends of reform can be if structural adjustment is made a strategic priority and implemented with sufficient patience.

436 Jean-Claude Trichet
The effect of the crisis on the different euro area economies follows a similar pattern to those of comparable U.S. states. The countries in the euro area that have been hit hardest are those in which either large asset-bubble driven imbalances unwound or structural prob-lems were left unaddressed before the crisis. Those countries that have yet to implement more far reaching structural reforms also have relatively low growth prospects after the crisis. These relatively low growth rates are linked to a deterioration of competitiveness, driven, for example, by persistent above average unit labor costs.
Precisely as regards the evolution of unit labor costs, that are so important for growth, dispersion both ahead of the crisis and dur-ing the crisis was quite similar in the euro area and the United States (Chart 3).
At the same time, it is worth noting that both currency areas in-clude regions with persistently above or below average unit labor cost growth. Again leaving aside the countries to join the euro area most recently, here, Greece, Portugal and Ireland, in particular, had pro-gressively lost competitiveness vis-à-vis their main trading partners in the euro area. They are now engaging in catching-up, adjustment strategies. Germany, which had lost competitiveness in the reunifica-tion process, by contrast, has been able to restore this competitive-ness over the same period of time (Chart 4).
Similar persistent losses and gains in unit labor costs are also ob-served in the United States. Taking a look at the upper and lower bound of the spectrum of U.S. states over the same period as the euro area reveals that some states have experienced large or persistent increases in unit labor costs, currently exceeding the national average by as much as 20 percent. Other states have been improving their labor cost competitiveness vis-à-vis the national average over the past decade (Charts 5, 6 and 7). In summary, there are strong indications that economic diversity in the euro area and the United States has not been significantly very different over the past 12 years.

Achieving Maximum Long-Term Growth 437
Chart 3Dispersion of Unit Labor Cost
Chart 4ULC Dynamics in the Euro Area
0
1
2
3
4
5
6
7
8
9
1978 1980 1982 1984 1986 1988 1990 1992 1994 1996 1998 2000 2002 2004 2006 2008 2010
Euro Area 12 United States
Unweighted standard deviation of growth rates in percentage points
Sources: European Commission, U.S. Bureau of Labor Statistics and U.S. Bureau of Economic Analysis
Note: ULCs are computed as the ratio between compensation per employee and real GDP per employed person.Source: European Commission
75
80
85
90
95
100
105
110
115
120
125
130
1998 1999 2000 2001 2002 2003 2004 2005 2006 2007 2008 2009 2010
Belgium Germany Ireland GreeceSpain France Italy LuxembourgNetherlands Austria Portugal Finland
ULC relative to Euro Area average, 1998=100

438 Jean-Claude Trichet
Chart 5ULC Dynamics in the United States
Chart 6ULC Dynamics in the Euro Area
Note: ULCs are computed as the ratio between compensation per nonfarm employee and real GDP per employed person. Source: U.S. Bureau of Economic Analysis
Note: ULCs are computed as the ratio between compensation per employee and real GDP per employed person. Source: European Commission
ULC relative to U.S. National, 1998=100
75
80
85
90
95
100
105
110
115
120
125
130
1998 1999 2000 2001 2002 2003 2004 2005 2006 2007 2008 2009 2010
Oregon Alaska Ohio MichiganCalifornia Kentucky Louisiana IdahoArizona Florida Nevada
10-25th and 75-90th Percentile
25-33rd and 66-75th Percentile
33-66th Percentile Median
ULC Relative to EA12 National 1998
75
80
85
90
95
100
105
110
115
120
125
1998 1999 2000 2001 2002 2003 2004 2005 2006 2007 2008 2009

Achieving Maximum Long-Term Growth 439
Chart 7ULC Dynamics in the United States
Note: ULCs are computed as the ratio between compensation per nonfarm employee and real GDP per employed person.Source: U.S. Bureau of Economic Analysis
10-25th and 75-90th Percentile
25-33rd and 66-75th Percentile
33-66th Percentile Median
ULC relative to U.S. national 1998
75
80
85
90
95
100
105
110
115
120
125
1998 1999 2000 2001 2002 2003 2004 2005 2006 2007 2008 2009
The observation that very large, continental economies of the size of the United States or of Europe are probably necessarily diverse should not be reason for complacency. The fact that advanced econo-mies of the size of more than 300 million people have a tendency to be significantly diverse calls for a solid economic governance frame-work and explains why the ECB Governing Council has been so vo-cal in this ground since the inception of the euro area.
And this inherent diversity of advanced economies of large size is an additional reason to resolutely engage in the structural reforms that would permit to accelerate the completion of the European sin-gle market in all sectors, and to enhance the growth potential of each individual European economy and of the euro area as a whole.
IV. Setting Priorities for Long-Run Growth
Let us get back to our central theme—Setting Policy Priorities for Long-Run Growth. Let me make some suggestions—three to be precise. A first, and overwhelming, priority—notably for the euro area—is the vigorous implementation of structural reforms. A sec-ond, but by no means unrelated priority is the continued attention to

440 Jean-Claude Trichet
external and internal imbalances. A final priority is greater flexibility on the part of policy institutions. Let’s take them one by one, with a particular emphasis on the euro area.
First, structural reforms. We earlier noted the primacy of institu-tions in modern growth theory. Sound institutions are essential to encourage a flexible, cutting-edge, knowledge-based economy. There is substantial evidence from industry-level studies on regulation as well from firm-level studies on the dynamics of firm performance that confirms the need for such a conducive environment to generate productivity growth.17
Douglas North defined institutions as … the rules of the game in a society … the humanly devised constraints that shape human interaction.18 And being “humanly devised constraints” (rather than exogenous geographical or climactic constraints), their major impact was through the setting of incentives.19
And one can see the remaining challenges for many advanced economies as follows:
Employment regulation needs to help more proactively outsiders, low-skilled, young and older workers.
In Europe, the single market needs to be advanced especially in the area of services.20
Tax, benefit and pensions systems should not discourage labor par-ticipation and create weak incentives for investment and innovation.
The distribution of wealth and general economic well-being needs to ensure some acceptable social balance.
Several remedial policy proposals have been suggested and imple-mented in the recent past. The most well known is the European Council’s Lisbon Strategy for Growth and Jobs, followed by the Europe 2020 strategy.21 The latter is the agenda that the European Union and its member states have decided to help Europe recover from the crisis and come out stronger, both internally and at the international level.22 The agenda sets targets for the European Union

Achieving Maximum Long-Term Growth 441
in 2020 in terms of employment, research and development, energy, and education.
The agenda puts particular emphasis on structural reforms in the labor and services markets. These two markets are still over-regulated and not directly subject, given their largely nontradable dimension, to the competitive forces originating from within and outside the single markets.23 At the EU-level, the necessity and shape of struc-tural reforms is acknowledged, but the gap between awareness and implementation is far from closed.
That said, we would do well to understand why political systems abide distortionary, inefficient structures and resist more efficient al-ternatives. Do structural reforms imply a J-curve of long-run gain but short-run pain that sits ill with the decision-making process in our democracies? Do vested interests strategically and systematically block change?
A second priority is vigilance against imbalances. I spoke at the last Jackson Hole symposium of the risks of chronic global imbal-ances and costs involved in unraveling the excessive private leverage, unsustainable fiscal and trade positions. Establishing more reason-able borrowing, restructuring and strengthening the balance sheets of firms, households and governments in an orderly manner remain key to smooth and continuous global growth. In all this, central banks are not immune. Tensions in financial markets and severe global im-balances deepen uncertainty and, therefore, profoundly challenge monetary-policy setting.
Precisely these dangers underpin the mutual assessment process of the G20 framework. The indicative indicators—agreed in February this year—identify imbalances in public, private and external posi-tions as the key culprits preventing balanced global growth, and a key input in shaping corrective policies. Seen in that light, a country’s economic success should be judged also on these indicators and not only on its last few years’ growth figures.

442 Jean-Claude Trichet
However, another imbalance—which has gained currency follow-ing the financial turbulence—is income imbalances. Naturally, ex-tremes of income inequality and restricted opportunity challenge our values and strain the fabric of our societies.
In short, growth skewed toward the few (or absent for a large mi-nority) risks social tensions, undermines institutions and encourages policy failures of one kind or another. Structural reforms, particu-larly in the form of re-training, improving job matching, providing flexibility and incentive for job creation and innovation remain the best policy options for encouraging well-balanced growth, and an environment of low and credible inflation the best environment to encourage matters from a central-banking perspective.
Finally, a priority for medium- and long-run growth is that our policy institutions remain attuned to an ever-changing landscape. We have seen in recent years the near-Knightian uncertainty poli-cymakers endured and how boldly they responded. The ECB was among the first central banks to react to the outbreak of the financial turmoil in August 2007 in providing liquidity to distressed institu-tions. Another example of flexibility by us and in the wider central banking community is in the swap agreements with other central banks as an example of internationally coordinated means of swiftly responding to the crisis.
Since then, we acted with what I have previously (here in Jackson Hole) called “credible alertness.”24 This includes implementing both nonstandard monetary policies and our interest rate policy. Inter-est rate policy depends on the outlook for price stability. The use of nonstandard measures depends on the functioning of the mon-etary policy transmission and must be commensurate with the level of malfunctioning or disruption of money and financial markets and segments of markets. Our nonstandard measures do not in any way impinge upon our capacity to design our monetary policy stance to deliver price stability in the medium term.
Despite all the ups and down of recent years, our key challenge remains as it has always been: to create strong, sustainable, balanced,

Achieving Maximum Long-Term Growth 443
noninflationary growth. Credibility and the medium-term orienta-tion in monetary policy allows, where needed, scope and flexibility to address various types of severe shocks. Over the long term a commit-ment to price stability anchors expectations, improves the workings of the price mechanism, reduces transaction costs, protects savers and reduces uncertainty. This is what I meant at the outset when I said that the theory and practice of monetary policy making paralleled developments in growth theory—namely, both are now seen to hinge on institutional quality.
V. Conclusions
Let me conclude. Ultimately growth is driven by technical prog-ress. This is especially important where there are limiting demo-graphic factors. In the euro area, there is ample of scope to realize efficiency gains from existing and prospective technological changes given structural reforms and more vigilant implementation of the ex-isting policy agenda. The remarkable resilience of the German labor market in the last few years25, where wage moderation and flexible time accounting shielded the economy from excessive job destruc-tion, illustrates admirably the promise of well-structured reforms.
Although there have been improvements in the euro area in recent years, there is still evidence of regulatory and market-based barriers to entry in selected professions which have to be actively corrected.
Structural reforms—re-training, improving job matching, provid-ing flexibility and incentives for job creation and innovation—re-main the best policy options for encouraging well-balanced growth, and an environment of low and credible inflation the best environ-ment to encourage matters from a central-banking perspective.
Likewise, alertness against savings and trade imbalances across the global economy is a fundamental concern. Such imbalances—if un-checked or conveniently rationalized away—make our entire, inter-connected economies more fragile and more risk prone. We have seen how rapidly negative financial impulses can transmit through the global economy and pull down economic activity. Alertness

444 Jean-Claude Trichet
means alertness. I have learned while discussing global imbalances and financial transmission channels—much of it done here at Jack-son Hole—that appropriate improvements in regulation and mul-tilateral surveillance frameworks can yield large gains. We should work hard to maintain momentum.

Achieving Maximum Long-Term Growth 445
Endnotes1Solow (1956, 1957).
2For contemporary discussions see La Grandville (2009), Klump et al. (2007 a, b).
3Romer (1990).
4“… He who receives an idea from me, receives instruction himself without lessening mine; as he who lights his taper at mine, receives light without darkening me. That ideas should freely spread from one to another over the globe, for the moral and mutual instruction of man, and improvement of his condition, seems to have been peculiarly and benevolently designed by nature …”, Letter of Thomas Jefferson to Isaac McPherson, Aug. 13, 1813.
5Acemoglu, Aghion and Zilibotti (2006).
6This is the so-called advantage of backwardness, Gerschenkron (1962).
7Sapir et al. (2003), Kok (2004).
8Gomez-Salvador et al. (2006).
9See for example, the discussion in Sondermann (2011).
10Note, the share of respective sector grouping’s value-added in total value-added across both countries are quite similar: goods production (0.44 for the euro area; 0.36 for the United States), market services (0.35 for the euro area; 0.42 for the United States), and distributive trades (0.21 for the euro area; 0.22 for the United States).
11See for example the discussion in Crafts (2008).
12See European Central Bank (2006).
13Keynote address by Jean-Claude Trichet, president of the ECB, at the “ECB and its Watchers XIII” conference, Frankfurt am Main, June 10, 2011.
14The use of all U.S. states in the computation of GDP dispersion, in contrast to only 14 U.S. Metropolitan Statistical Areas (MSAs) in the computation of infla-tion dispersion, is to be explained by data availability. The most recent entries to the euro area have been excluded to avoid breaks in the time series.
15The 2010 data for U.S. regions are estimates published by the Bureau of Eco-nomic Analysis on June 7, 2011.
16 The “Industry specialization index”—a measure of the degree to which states are more or less specialized in an industry relative to the national average—reveals that California, Florida, Arizona and Nevada all witnessed the share of their respec-tive construction sectors increase relative to the national average between 2001 and 2006, followed by the opposite development after 2006.

446 Jean-Claude Trichet
17Nicoletti and Scarpetta (2003), Bartelsman et al. (2005).
18North (1990).
19North (1981).
20For instance, the service sector accounts for over 70 percent of GDP but only 20 percent of intra-EU trade. Some home bias in the provision of services is inevi-table, but such a gap suggests that there are considerable local rents being extracted at consumers’ expense.
21For example: European Commission (2002, 2005a, 2005b, 2010), Interna-tional Monetary Fund (2004), Organization for Economic Cooperation and De-velopment (1997, 2003, 2006).
22European Council (2010).
23Macroeconomic assessments of the gains that might be realized in the euro area from greater competition and other structural reforms can be found in, for example, Bayoumi et al. (2004), Ebbinghaus and Eichhorst (2006), Jacobi and Kluve (2006), Gomes et al. (2011).
24“Monetary Policy and Credible Alertness,” J.-C. Trichet, Jackson Hole Sym-posium, August 2005.
25For example, Arpaia, A. and G. Mourre (2011), Boysen-Hogrefe and Groll
(2011), Burda and Hunt (2011).

Achieving Maximum Long-Term Growth 447
References
Acemoglu, D., P. Aghion and F. Zilibotti (2006). “Distance to Frontier, Selection, and Economic Growth,” Journal of the European Economic Association, 4(1), 37-74.
Arpaia, A., and G. Mourre (2011). “Institutions and Performance in European Labour Markets: Taking a Fresh Look at Evidence,” Journal of Economic Surveys, forthcoming.
Bayoumi, T., D. Laxton, and P. Pesenti (2004). “Benefits and Spillovers of Greater Competition in Europe: A Macroeconomic Assessment.” Working Paper 341 (Frankfurt: European Central Bank).
Boysen-Hogrefe, J., and D. Groll (2011). “The German Labour Market Miracle,” National Institute Economic Review, 214 (1): R38-R50.
Burda, M. C., and J. Hunt (2011). “What Explains the German Labor Market Miracle in the Great Recession?” NBER Working Paper No. 17187.
Crafts, N. (2008). “What Creates Multi-Factor Productivity?” Paper for the joint ECB, Banque de France and The Conference Board conference “The Creation of Economic and Corporate Wealth in a Dynamic Economy,” Frankfurt, January 2008. Available at http://www.ecb.int/events/conferences/html/cecwe.en.html.
Ebbinghaus, B., and W. Eichhorst (2006). “Employment Regulation and Labor Market Policy in Germany, 1991-2005.” IZA Discussion Paper 2505, December.
European Central Bank (2006). “Competition, Productivity and Prices in the Euro Area Services Sector.” Task Force of the Monetary Policy Committee of the Eu-ropean System of central Banks. Occasional paper, No. 44.
European Commission (2002). “Better Functioning Labor and Product Markets.” In European Economy 6/2000, chapter 3, Brussels: European Commission.
_______ (2005a). “Working for Growth and Jobs: Next Steps in Implementing the Revised Lisbon Strategy.” Commission Staff Working Paper 622/2.
________ (2005b). “Working Together for Growth and Jobs. A New Start for the Lisbon Strategy.” Communication to the Spring European Council.
_________(2010). “Europe 2020: A European Strategy for Smart, Sustainable and Inclusive Growth.” Communication from the Commission to the European Council, arch.
European Council (2010). European Council 17 June 2010 Conclusions, June.
Gerschenkron, A. (1962). Economic Backwardness in Historical Perspective, Belknap Press of Harvard University Press.

448 Jean-Claude Trichet
Gomes, S., P. Jacquinot, M. Mohr and M. Pisani (2011). “Structural Reforms and Macroeconomic Performance in the Euro Area Countries: A Model-Based Assessment,” Working Paper 1323 (Frankfurt: European Central Bank).
Gómez-Salvador, R., A. Musso, M. Stocker and J. Turunen (2006). “Labour Pro-ductivity Developments in the Euro Area,” Occasional Paper No. 53, European Central Bank.
International Monetary Fund (2004). “World Economic Outlook: Advancing Structural Reforms.” Washington, April.
Jacobi, L., and J. Kluve (2006). “Before and After the Hartz Reforms: The Performance of Active Labour Market Policy in Germany.” IZA Discussion Pa-per 2100, April.
Klump, R., P. McAdam and A. Willman (2007a). “Factor Substitution and Factor Augmenting Technical Progress in the US: A Normalized Supply-Side System Approach,” Review of Economics and Statistics, vol. 89, no. 1, pp. 183-192.
_______(2007b). “The Long-Term SucCESs of the Neo-Classical Growth Model,” Oxford Review of Economic Policy, vol. 23, no. 1, pp. 94-114.
Kok, W. et al (2004). “Facing the Challenge: The Lisbon Strategy for Growth and Employment,” European Commission.
La Grandville, O. de. (2009). Economic Growth: A Unified Approach. Cambridge University Press.
Nicoletti, G. and Scarpetta, S. (2003). “Regulation, Productivity, and Growth: OECD Evidence,” Policy Research Working Paper Series 2944, The World Bank.
North, D. (1981). Structure and Change in Economic History, Norton, 1981.
_______(1990). Institutions, Institutional Change and Economic Performance, Cambridge University Press.
Organization for Economic Co-operation and Development (1997). OECD Re-port on Regulatory Reform. Paris: OECD.
_______(2003). The Sources of Economic Growth in OECD Countries. Paris: OECD.
_______(2006). Economic Policy Reforms: Going for Growth. Paris: OECD.
Romer, P. M (1990). “Endogenous Technological Change,” Journal of Political Economy, 98(5), S71-102.
Sapir, A. et al (2003). “An Agenda for a Growing Europe,” Available at http://www.euractiv.com/ndbtext/innovation/sapirreport.pdf.

Achieving Maximum Long-Term Growth 449
Serafini, R., R. Strauch and M. Schiffbauer (2011). “The Impact of ICT and Human Capital on TFP—Implications for Recent EMU and U.S. Growth Differences.” Working Paper forthcoming (Frankfurt: European Central Bank).
Solow, R. M. (1956). “A Contribution to the Theory of Economic Growth.” Quarterly Journal of Economics, 70(1): 65-94.
_______(1957). “Technical Change and the Aggregate Production Function.” Review of Economics and Statistics, 39(3): 312-320.
Sondermann, D. (2011). “Productivity in the Euro Area: Any Evidence of Convergence?” European Central Bank, mimeo.
