achieving mdg 2: universal primary education …nap.psa.gov.ph/ncs/12thncs/papers/invited/ips-20...
TRANSCRIPT

12th National Convention on Statistics (NCS) EDSA Shangri-La Hotel, Mandaluyong City
October 1-2, 2013
ACHIEVING MDG 2: UNIVERSAL PRIMARY EDUCATION THROUGH EVIDENCE-BASED PLANNING AND PROGRAMMING USING CBMS INDICATORS: LESSONS ON
GOVERNANCE STATISTICS FROM TABACO CITY, ALBAY
by
Krisel Lagman-Luistro and Marco Stefan B. Lagman
For additional information, please contact:
Author’s name
Cielo Krisel Lagman-Luistro
Designation Former Mayor of Tabaco City, Albay Affiliation LGU Tabaco City, Albay Address 59 Samar Ave., South Triangle, Quezon City Tel. no. 0920-9704216 E-mail [email protected]
Author’s name Marco Stefan B. Lagman Designation Affiliation Address Tel. no. E-mail

Page 1 of 17
ACHIEVING MDG 2: UNIVERSAL PRIMARY EDUCATION THROUGH EVIDENCE-BASED PLANNING AND PROGRAMMING USING CBMS
INDICATORS: LESSONS ON GOVERNANCE STATISTICS FROM TABACO CITY, ALBAY
by
Krisel Lagman-Luistro and Marco Stefan B. Lagman
ABSTRACT
In 2000, UN member states agreed to achieve eight Millennium Development Goals (MDGs) by 2015. While such pledges are made by national governments, their attainment is dependent on the planning and implementation efforts of LGUs. This paper shows how the local government of Tabaco City (TLGU) from 2007 to 2013 achieved significant gains in attaining the MDGs and improving the quality of life of its residents with respect to development indicators, partly through the proper utilization of its Community-Based Monitoring System (CBMS) statistics.
The TLGU experience demonstrates that the CBMS, when properly
instituted and regularly updated, allows decision-makers to specifically identify households that need help and efficiently concentrate resources on them. The CBMS education indicators that were analyzed allowed the TLGU to monitor and evaluate the impact of their MDG-related interventions on making quality primary education more accessible. More importantly, the adoption of the CBMS as a tool in crafting localized responses to attain the MDGs led to innovations in local governance and equipped decision-makers with factual data. It also depoliticized the provision of services and encouraged the bottoms up approach in planning, resource allocation, program implementation and monitoring of development initiatives based on CBMS data.
Key words: Millennium Development Goals, Community-Based Monitoring System, quality of life, education, local governance, development planning, monitoring and evaluation, service provision
I. Tabaco City's Experience with the CBMS
Since the emergence of the modern state, governments have been developing ways to better understand the situation of the places and people that they govern (Scott, 1998). From census, tax and land records that helped determine the resources at their disposal, the data that government institutions employ now include indicators that are designed to reflect and measure specific socioeconomic conditions of their constituents. Policy and decision-makers, in turn, have used these to craft appropriate policies, programs and interventions.
Government institutions in the Philippines, particularly local governments, are now actively using the Community-Based Monitoring System (CBMS) to generate, store and analyze vital socioeconomic information not only to determine the situation of their constituents but also to geographically locate those who need assistance the most as well as monitor the progress of their development programs. One of the distinctive features of

Page 2 of 17
the CBMS is its being a policy and planning tool that could help direct judicious public investments. This is recognized as a key approach in reducing poverty and inequality in society (Reyes & Due, 2009).
The Tabaco City local government unit (TLGU) has been one of the leading local government units (LGU) that have been using the CBMS in part to achieve the Millennium Development Goals (MDGs) that the Philippine government has pledged to attain. The TLGU, like other more progressive Philippine cities and municipalities, has used CBMS statistics to achieve specific MDGs whose attainment relies partly on accurate information (United Nations, 2007). Employing evidence-based planning and budgeting allows for the efficient use of scarce resources on place and person-specific interventions.
CBMS statistics and indicators have also served as bases for ordinary people to dialogue with decision and policy-makers and even propose solutions to pressing issues that affect them. The use of updated and accurate CBMS data in TLGU has also been a means to enhance the efficiency of local governance as these serve as the foundation for the de-politicization of program assistance and the approval of barangay government budgets that are aligned with the priorities identified by the system.
Moreover, the case of TLGU also demonstrates that significant financial and institutional resources need to be invested over time in order to ensure the reliability of the data being collected and processed by CBMS personnel. This has proven to be cost-effective in the long term as it allows for the judicious use of scarce government funds. II. The story of TLGU's CBMS database: Ensuring that you get statistics that you can trust
Any plan or program that seeks to address a specific concern and attain a precise outcome should be based on an accurate description of the situation of a particular area or group (Department of Interior and Local Government, 2009).
The comprehensive and nuanced understanding of any situation requires the determination of specific indicators that define such a situation's characteristics, the timely and accurate collection of these data, and the comparison of these data over time in order to assess the effects of a plan or program's intervention.
As such, while LGUs that use CBMS in their governance activities willingly report their achievements, the literature seems quite silent on how an institution can both ensure that the data they are employing in policy-making avoids the generation of inaccurate knowledge and that such vital information is continuously collected with a fair degree of accuracy.
The TLGU's experience with the use and maintenance of its CBMS database is a case in point when it comes to amount of resources required in ensuring the collection and availability of usable indicators. Since 2007 when the TLGU was introduced to the CBMS, its then local chief executive Mayor Krisel Lagman-Luistro immediately implemented steps to ensure that the CBMS would be used in the planning and delivery of programs and projects that would aid in the attainment of MDGs and improve the well-being of target constituents.

Page 3 of 17
Since that year, the TLGU has already conducted three CBMS censuses in 2008, 2010, and 2012. While the said census is usually done every three years, it was decided that the said city-wide activity be implemented on a bi-annual basis in order for the city's executives and administrators to immediately ascertain if their interventions based on the initial census have resulted in the improvement of target beneficiaries.
This strong commitment to the efficient collection of vital information for planning and monitoring is important since CBMS requires the utilization of human, financial and physical resources (Reyes & Due, 2009).
The TLGU's 26,711 households (Community-Based Monitoring System Tabaco City, 2012) are unevenly distributed over 117.14 square kilometers (Republic Act 9020, 2001) in 47 barangays in urban, upland and island environments with varying levels of physical and accessibility conditions. Once officials and leaders have bought into the CBMS, the next step required the training of eight people under the TLGU’s Planning and Development Office who would have to handle CBMS data on a full-time basis. To ensure that there is close coordination between the local CBMS unit and the TLGU's different localities, each barangay designated a CBMS focal person. During a census year, this group of almost 60 personnel would include roughly an additional 200 enumerators who have to complete the census within 45 days to ensure that the data collected reflects people's perceptions and conditions over the same period of time.
While setting up the institutions and relations that would help ensure the collection, storage and analysis of CBMS indicators is vital, nothing would be achieved without a serious effort in ensuring that associated offices and activities are properly funded. During the two census years, around P2 million per census was allotted by the City Government to cover the reproduction of questionnaires, honorarium and travel expenses of enumerators and encoders, and other financial requirements of the census. Such amounts represent only 0.5% of the TLGU's annual budgets in recent years. During non-census years, the City’s CBMS unit would need around P1.5 million to ensure the proper processing of pertinent information.
Proper funding and institution building may take time and resources, but such efforts are essential in order to ensure that the CBMS's three-step process of enumeration, encoding, and people-centered validation over three months becomes doable. The validation part, which requires CBMS staff and city officials to participate in barangay assemblies attended by local residents to ensure the accuracy of information gathered since the said activity gives CBMS poverty indicators a human face.
Such sessions are, in fact, an opportunity for local officials and planners to better understand the situation of their constituents. In like manner, the discussion of barangay-based numbers and statistics, which may seem more like abstractions, give residents a chance to propose solutions to and validate the problems that have been identified. This gives TLGU the opportunity to properly identify not only the households who are most in need of help but also assign the local government or community organization tasked to implement the proposed solutions or interventions. The role of local residents is considered so integral that the generation of poverty maps is done only after the validation has been completed. As such, investing on time, people and financial resources foster meaningful people-centered governance and empowerment while also emphasizing the shared responsibility and accountability of both the government and the governed.
Page 4 of 17
III. CBMS and the MDGs
Local governments must take center stage in the localization of the attainment of the Millennium Development Goals even if the commitments were made at the national level. Consistent with its mandate to supervise local governments, the Department of the Interior and Local Government issued Memorandum Circular 2004-152 dated September 10, 2004, instructing local authorities to mainstream the MDGs in their respective local government agenda, adopt benchmarks and a monitoring system based on local poverty indicators, allocate resources for basic services responsive to the MDGs, and implement localized responses to the attainment of the goals.
The TLGU has adopted in 2007 the MDG framework as the city’s template for develoment and the CBMS as the tool to monitor and gauge the effectiveness of the MDG localization initiatives (Executive Order 7 series of 2009, Tabaco City).
The first CBMS city-wide census was conducted in 2008. This was indicative of TLGU’s commitment to use first-hand factual data and actual statistics from the 47 barangays as baseline data. The CBMS census has been conducted bi-annually after the initial 2008 census.
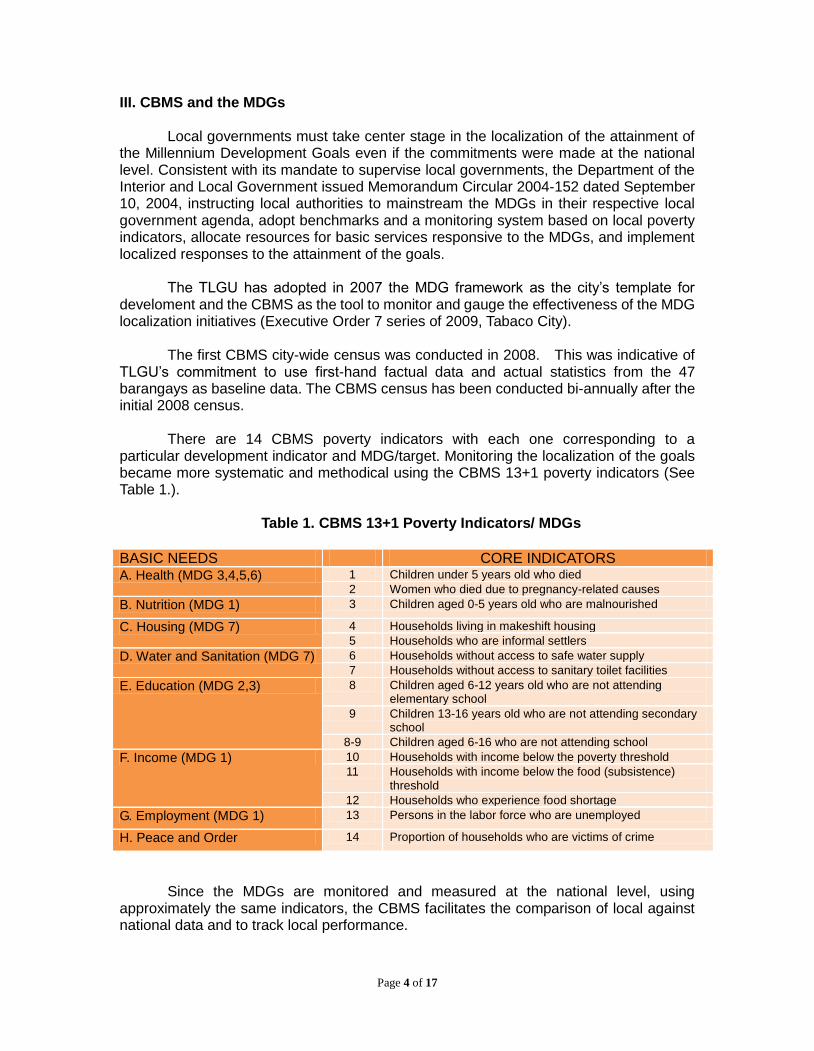
There are 14 CBMS poverty indicators with each one corresponding to a particular development indicator and MDG/target. Monitoring the localization of the goals became more systematic and methodical using the CBMS 13+1 poverty indicators (See Table 1.).
Table 1. CBMS 13+1 Poverty Indicators/ MDGs
BASIC NEEDS CORE INDICATORS A. Health (MDG 3,4,5,6) 1 Children under 5 years old who died
2 Women who died due to pregnancy-related causes
B. Nutrition (MDG 1) 3 Children aged 0-5 years old who are malnourished
C. Housing (MDG 7) 4 Households living in makeshift housing
5 Households who are informal settlers
D. Water and Sanitation (MDG 7) 6 Households without access to safe water supply
7 Households without access to sanitary toilet facilities
E. Education (MDG 2,3) 8 Children aged 6-12 years old who are not attending elementary school
9 Children 13-16 years old who are not attending secondary school
8-9 Children aged 6-16 who are not attending school
F. Income (MDG 1) 10 Households with income below the poverty threshold
11 Households with income below the food (subsistence) threshold
12 Households who experience food shortage
G. Employment (MDG 1) 13 Persons in the labor force who are unemployed
H. Peace and Order 14 Proportion of households who are victims of crime
Since the MDGs are monitored and measured at the national level, using approximately the same indicators, the CBMS facilitates the comparison of local against national data and to track local performance.

Page 5 of 17
IV. A Case Study on Education
The CBMS poverty indicators have assisted TLGU in responding to social, ecological, and security needs of its constituents. This section will focus on how CBMS data, coupled with statistical data from the Department of Education (DepEd), were utilized in enhancing accessible quality education as well as monitoring the impact of education interventions. Furthermore, identifying and targeting program beneficiaries were based on evidence and factual data.
Through the CBMS census, TLGU now has a clearer picture of the status of education in Tabaco City. Among the top education-related problems identified and validated by the respondents were the following: (1) high drop-out rates both in primary and secondary levels; (2) lack of classrooms and teachers; (3) untrained out-of-school youth, unemployment, and underemployment; and (4) high poverty incidence which impacts on education-related issues like health and nutrition.
It is well documented that education is critical in breaking the cycle of poverty.
Research has established that for poor parents, the opportunity to obtain primary education for their children is the first empowering step in their long journey out of poverty (Holyfield, 2002). Since an educated, productive, and empowered citizenry is at the core of sustainable human development, TLGU utilized CBMS data together with the DepEd’s statistics to make education more accessible and responsive to the special needs of students in Tabaco City. High Drop-Out Rates (DOR)
The City’s DOR level for 2010, based on the report of the Tabaco City Division, was 0.89% for the primary level and at 4% for the secondary level. In both elementary and secondary levels, the number of students quitting school has grown since 2005. For the elementary level, the DOR since 2005 has increased by 0.15% while the secondary level DOR has increased by 0.47%. Verily, the number of students at the secondary level dropping out of school is higher than the elementary level. It is important to emphasize, however, that the DOR data gathered by DepEd includes both residents and non-residents of Tabaco since the city also caters to the education needs of neighboring municipalities.
In the 2010 CBMS census, 73,161 respondents were asked what the barriers were for completing primary and secondary education. Although 38.7% of the respondents’ answers were considered non-responsive, 61.3% gave the following reasons for dropping out of school: to seek employment (32%), to help in the family business (12%), marriage and/or pregnancy (11%), financial constraints (3%), lack of interest (2%), and illness or disability (1%).
The Family Mapping Survey conducted by the DepEd Tabaco Division in the summer of 2008 sought to collect data on household literacy which included questions to identify the contributing factors to school drop-out rates, parent participation, and the correlation between poverty indicators, family size, and literacy levels. The survey covered 18,632 families with school-aged children.
Page 6 of 17
Interestingly, the identified reasons for dropping out of school slightly differed in families with primary school aged children. The top six reasons were the following: (1) no money to buy school supplies; (2) child helps the family in earning a living; (3) no money for fare, clothes and baon, laziness; (4) no interest; (5) and needed at home.
Based on the 2008 CBMS census, most Tabaqueños who left school for work were from the lowland or urban barangays. The lowest drop out rates, on the other hand, registered in the upland and island barangays. There was almost equal number of male and female drop-outs, however, it is interesting to note, that there were gender-related reasons for quitting school. Overall, there were seven times more females (14,676 vs. 2,206) who stopped schooling in order to help in their households. On the other hand, males tend to quit school in order to work or find employment as opposed to their female counterparts (24,479 males vs. 10, 829 females).
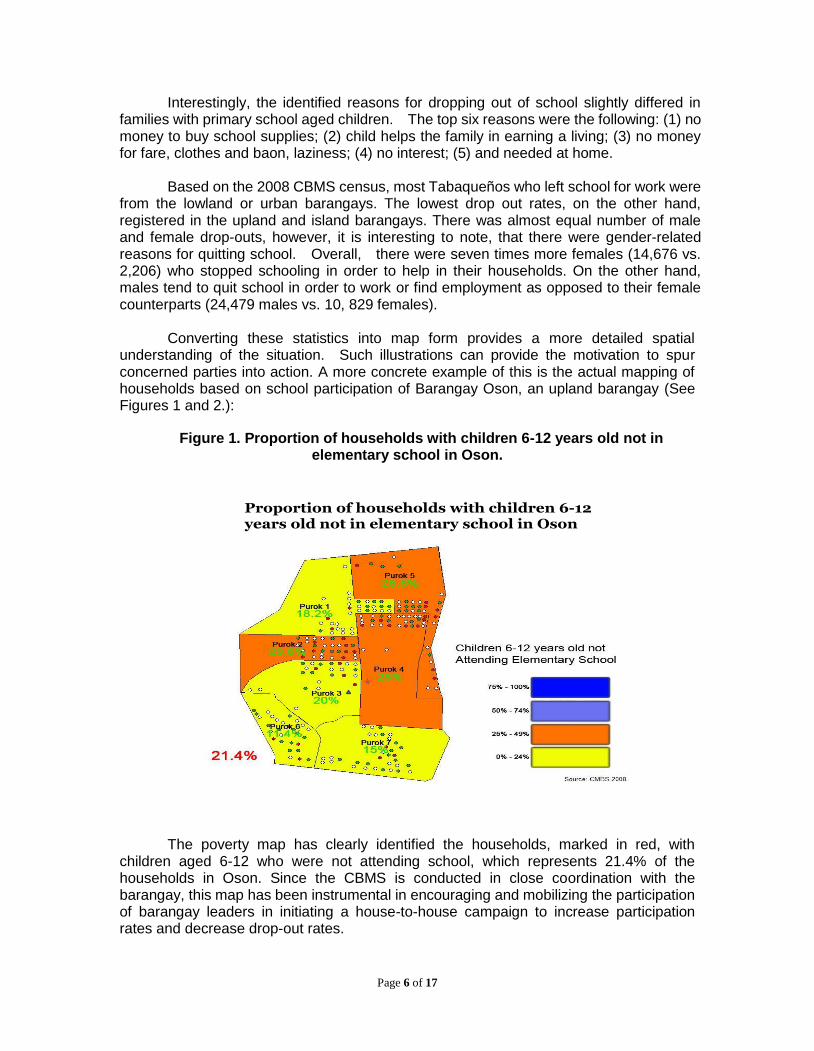
Converting these statistics into map form provides a more detailed spatial understanding of the situation. Such illustrations can provide the motivation to spur concerned parties into action. A more concrete example of this is the actual mapping of households based on school participation of Barangay Oson, an upland barangay (See Figures 1 and 2.):
Figure 1. Proportion of households with children 6-12 years old not in elementary school in Oson.
Proportion of households with children 6-12 years old not in elementary school in Oson
The poverty map has clearly identified the households, marked in red, with
children aged 6-12 who were not attending school, which represents 21.4% of the households in Oson. Since the CBMS is conducted in close coordination with the barangay, this map has been instrumental in encouraging and mobilizing the participation of barangay leaders in initiating a house-to-house campaign to increase participation rates and decrease drop-out rates.

Page 7 of 17
The house-to-house campaign also gave an opportunity to further investigate the reasons for non-school attendance. Barangay Oson, headed by Punong Barangay Clara Boringot and her councilors, embarked on the campaign and found out that the most common reason for dropping out of school at the elementary level was lack of school supplies. Notebooks and writing materials are essential in school and children who go to school without these essentials begin to lose interest and eventually drop out. It was also revealed that classmates teased many of those who dropped out especially when they regularly ask for paper from seatmates for quizzes and exams.
Figure 2. Proportion of households with children 13-16 years old not in elementary school in Oson.
Proportion of households with children 13-16 years old not in secondary school in Oson
The poverty map for the secondary level shows a more heartbreaking picture
where 53.2% of households with children ages 13-16, have children who are not attending school. The barangay council conducted the same house-to-house campaign and the reasons were slightly different. Children drop out of school or fail to attend school for the following reasons: (1) lack of money to commute to the nearest school (San Antonio National High School is approximately 3-4 kilometers from Barangay Oson); (2) need to work or find employment to augment family income; (3) helping in the farm; and (4) early pregnancy and marriage.
The results of the informal interviews with the target households, conducted by people from their own community, have validated the information gathered during the CBMS census. These responses have become the basis of the city government’s interventions to keep children in school.
The Libreng Gamit sa Eskwela Program, a program that targeted 30% of the total primary school pupils from Tabaco who were at the bottom quintile in terms of family income was launched in 2009. Since 2009, an annual budget of One Million Five Hundred Thousand Pesos (Php1,500,000.00) was allocated by TLGU under the city’s Millennium

Page 8 of 17
Development Fund. The program sought to address the primary reason for school drop out among elementary school pupils and to encourage parents to enroll their children and keep them in school.
The principals or heads of school were tasked to identify the poorest students
from grades 1-6 and this list was crosschecked against the CBMS data. The number of beneficiaries of free school supplies during the five school years are as follows: 6347 students in 2009, 8882 in 2010, 6761 in 2011, 7710 in 2012, and 7673 in 2013.
Since lack of money for transportation to school has been identified as a deterrent for high school students, the TLGU, DepEd Tabaco and the Japan Asian Friendship Society (JAFS) spearheaded a creative yet practical program dubbed Love on Wheels in 2011. Three hundred bicycles from Japan were donated by JAFS and distributed to the poorest students in every high school in the division.
The student-beneficiaries were chosen from a survey conducted by the school heads and crossed-checked against the CBMS data. The program prioritized poor families who find it hard to send their children to school because of distance and transportation cost. Because of the bicycles, many of the students need not walk 3-4 kilometers to school or worry if money will be available for transportation. Aside from making education more accessible, Love on Wheels also aims to curb absenteeism and improve participation rates.
Among the above cited reasons for secondary school dropout is teenage pregnancy and, subsequently, early marriage. Unfortunately, adolescent reproductive health services have not been given the attention it badly needs. There is an absence of concrete programs from government, both national and local, in responding to this growing concern among adolescents. The Reproductive Health (RH) Law enacted in 2012 by the Philippine Congress is pending before the Supreme Court for review. The RH Law will address the lack of adolescent reproductive health care services as well as prevent unplanned and mistimed teen-aged pregnancy through age-appropriate and accurate sex education incorporated in the school curriculum.
TLGU, being a staunch advocate of the attainment of the MDGs, which includes
Improving Maternal Health and Access to Family Planning Services (MDG 5), initiated a trainer’s training seminar on Parent Education on Adolescent Health and Youth Development in October 2011. Members of the Parent Teacher Association and school guidance counselors participated in this seminar. This training was the initial step in approaching the sensitive issue of adolescent reproductive health. It also aimed to educate parents and teachers on being more involved in assisting their children and students in this critical stage.
Experts from the Population Commission of Region V produced the modules and conducted the training. The original participants are now trainers in their own schools. For instance, Mrs. Marta Barro, the principal of San Antonio National High School, embarked on a series of trainings with PTA members and their adolescent children in response to the City Mayor’s challenge of Zero Teenage Pregnancy in Schools. Institutionalization of the program in all high schools in the division, through the PTA, and training of peer counselors are the next steps to be taken by the TLGU, DepEd Tabaco, and the Local School Board.

Page 9 of 17
Lack of Classrooms and Teachers
In Tabaco, the total number of instructional rooms for the school year 2010-2011 in public pre-school and elementary is 543. The 2010 ratio of these instructional rooms to the total number of enrollees per school ranges from 1:22 to 1:65. In private schools, the 2010 classroom-student ratio (CSR) ranges from 4-42 students per classroom.
At the secondary level, the total number of instructional rooms as of 2010 is 286. The range of CSRs among public schools in Tabaco ranges from 32-50 students for every instructional room. The CSR in private schools, on the other hand, ranges from 9-32 students per instructional room. Again, the figures demonstrate more favorable values for private secondary schools in Tabaco even though classroom-student indicators vary from school to school. The goal is to reduce the classroom:student ratio to the ideal 1:35 for elementary school and 1:40 for secondary school.
TLGU was among the first LGUs that responded to the call of DepEd Secretary
Armin Luistro to partner with the Department in constructing classrooms. The City has allocated an amount of P9.5 M for the Classroom Counter-parting Program. Under this program, a total of 16 classrooms were constructed.
The TLGU has been aggressive in sourcing out funds for the construction of additional classrooms and has tapped various government and non-government institutions such as the Filipino-Chinese Chamber of Commerce and Industry, which assisted the LGU in the construction of two classrooms in the Salvacion Resettlement Site, an extension of Fatima Elementary School, and the Philippine Games and Amusements Corporation (PAGCOR) which financed the construction of 11 classrooms in Bantayan National High School, an upland high school, in order to give better access to secondary level education in the mountainous portions of the city. Representative Edcel C. Lagman, through his Congressional Initiative and Priority Development Assistance Fund also supported the construction of additional school buildings, gymnasiums, and multi-purpose halls in both elementary and secondary schools in the city.
The Local School Board, a special body composed of the city mayor and the city superintendent of schools as co-chairmen; the chairman of the education committee of the Sangguniang Panlungsod, the city treasurer, the representative of the Pederasyon ng mga Sangguniang Kabataan in the Sangguniang Panlungsod, the duly elected president of the city federation of Parents-Teachers Associations, the duly elected representative of the teachers’ organizations in the city, and the duly elected representative of the non-academic personnel of public schools in the city, as members with members from the local government, education, and civil society sectors, is tasked to determine, the annual supplementary budgetary needs for the operation and maintenance of public schools within the city and the supplementary local cost of meeting such needs, which shall be charged to its share in the proceeds of the special levy on real property constituting the Special Education Fund (SEF) [Sec.99, Book I, Title 4, R.A. 7160].
To improve the Teacher:Student Ratio (TSR), the Local School Board has annually allocated since 2008 around 50% of the Special Education Fund for the honorarium of SEF-funded teachers. Through this initiative, TLGU has employed 80 SEF teachers who were deployed to the schools with extension classes under the Guro Magtutro and Dagdag Klase Programs of DepEd. Upland and island schools were the main beneficiaries of the program, as well as highly populated urban schools.

Page 10 of 17
There has been an exponential increase of the budget for SEF teachers charged against the Special Education Fund. From Php1.95 million in 2007 to Php. 2.3 million in 2008 and Php.3.64 million in 2009, the budget for hiring additional teachers reached Php. 5.22 million in 2010. In 2011 and 2012, the annual budgets for SEF teachers were pegged at P5.498M and P5.954M, respectively. Additional funds were allocated from the General Fund of the TLGU to cover additional incentives for SEF teachers.
It is important to add that TLGU’s inputs in hard infrastructure is balanced with
corresponding investments in soft infrastructure. Under the Every Child a Reader Program (ECARP), all public elementary and high schools have achieved a 1:1 student-book ratio of supplementary books in English, Filipino, MAPE, and Math, for elementary and Reading Power in the secondary. Day care and Pre-school textbooks and workbooks were also purchased to supply all day care and pre-school pupils. High Incidence of Out-of-School Youth, Unemployment and Underemployment.
TLGU statistics show that only 30 out of 100 high school graduates will pursue
higher education. The remaining 70 will enter the work force with almost no training. This perennial condition has led to high levels of unemployment and even higher levels of underemployment.
Through the Alternative Learning System unit of the DepEd, the TLGU as well as the barangays, embarked on a campaign to support the ALS program at the barangay level. The barangays established learning centers in their barangay halls and the local government assisted in the production of learning materials, purchase of furniture for the center, and repair/rehabilitation of existing learning centers.
The adult literacy classes have promising results as presented in Table 2 below:
Table 2. Alternative Learning Systems data, 2008-2012.
Year Number of Learners Number of Completers Number of Passers
M F T M F T M F T
2008-09 630 439 1069 560 288 848 24 13 37
2009-10 231 359 590 236 180 416 10 14 24
2010-11 242 487 729 326 217 543 22 31 53
2011-12 589 366 955 397 171 568 34 56 90
Source: Alternative Learning Systems Office, DepEd Tabaco City Division *Note: Number of learners in 2010 declined because of the absence of Balik-Paaralan Para sa Out of School Adults (BP-OSA) for 2009-10.
DepEd recognized several barangays in the city for their support to ALS and the
efficiency of their barangay leaning centers. Barangay Salvacion is a Regional Awardee

Page 11 of 17
for the Hall of Fame Category as Most Functional Community Learning Center (CLC), having been a qualifier for the years 2008 and 2009. In 2009, Barangay Bacolod was a qualifier in the regional search for the most functional CLC. To date there are five functional Community Learning Centers in the city.
MDG 1, Target 1.B. seeks to achieve full and productive employment and decent work for all, including women and young people. To achieve this target and to respond to the growing number of OSYs and untrained young labor force, TLGU reactivated the Manpower and Skills Training Program. The Sentrong Kabuhayan Livelihood and Skills Training Center (SKLSTC) now handles the program, a TESDA accredited facility run by the local government. Tabaco City has three TESDA-accredited centers serving the island, upland and urban barangays.
According to CBMS data, most of those who quit school reside in the urban barangays, thus the establishment of the main livelihood and training center in Cormidal. The dilapidated Maritime Building was transformed into a two-storey training center. Similarly, a large number of high school graduates from the island of San Miguel lack access to technical-vocational training due to the absence of post secondary institutions in the island. Thus, TLGU rehabilitated an old abandoned building into the Visita Livelihood and Skills Training Center. And finally to cater to the 14 upland barangays, the old camarin market in Bantayan now houses the Bantayan Skills Training Center.
Since 2007, the Sentrong Kabuhayan has gained popularity as a
technical-vocational training center offering short courses in Consumer Electronics Servicing (NC II), Motorcycle/Small Engine NC II, Automotive NC I, Driving NC II, Electrical Installation and Maintenance NC II and CBTED Reflexology for free to all Tabaquenos. In 2010, the Sentrong Kabuhayan Livelihood and Skills Training Center bested all other local governments when it was awarded by TESDA as the National Kabalikat Awardee, LGU Category.
The table below (See Table 3.) enumerates the courses offered by Sentrong Kabuhayan Livelihood and Skills Training Center and the number of graduates who benefitted from the free training:
Table 3. The number of graduates of courses offered by the SKLSTC from the
period, 2008-2013.
No. Course No. of Graduates
2008 to 2009
2010 2011 2012 2013 Total
1 Consumer Electronics NC-II 247 203 119 183 175 927
2 Electrical Installation Maintenance NC-II
25 93 51 87 52 308
3 Motorcycle Small Engine Servicing NC-II
250 117 63 78 29 537
4 Automotive Servicing NC-I 128 100 85 78 35 426
5 Driving NC-II 180 143 122 137 38 620
6 Reflexology 0 93 246 132 46 517
7 Beauty Care 0 0 0 108 57 165
8 Dress Making 0 0 0 0 20 20
9 Table Skirting & Table Setting 0 0 0 0 22 22
10 Flower Arrangement 0 0 0 0 23 23

Page 12 of 17
11 Bread and Pastry Production 0 0 0 0 30 30
12 Tile Setting 0 0 0 50 0 50
Total 830 749 686 853 527 3,645
Source: Sentrong Kabuhayan Livelihood and Skills Training Center, Tabaco City
It is important to note the other mechanisms employed by the city to address the high unemployment rate like the twice-yearly job fairs, which provided citywide job opportunities in local and overseas employment with the support from the Department of Labor and Employment Regional Offices and the local PESO officer. Moreover, the Sentrong Kabuhayan has partnered with the San Francisco Institute of Science and Technology, a TESDA institution in Albay, in linking technical-vocational graduates with companies like Panasonic, Yamaha, Honda, and Hitachi for on-the-job training and eventually, permanent employment. From 2010 to June 2013, 582 graduates were employed locally and overseas.
The TLGU also worked towards strengthening the role of the Sentrong Kabuhayan as DepEd’s partner in the implementation of the K+12 program in terms of sharing resources, such as training center equipment and supplies and trainers.
The scholarship program funded by the TLGU under the Gender and
Development Fund and through the Priority Development Assistance Fund (PDAF) of Rep. Edcel C. Lagman is another intervention to assist poor but deserving students pursue higher and technical education.
V. Tracking Progress of Interventions through CBMS
TLGU’s first CBMS census was conducted in 2008. The results of the 2008 census became the baseline data. Succeeding census in 2010 and 2012 were compared to the baseline data to measure the appropriateness and impact of inventions. Table 4 below shows the progress of TLGU over the three census years:
Table 4. Core CBMS indicators of Tabaco City, 2008, 2010 and 2012
CBMS CORE INDICATORS, TABACO CITY
Basic Needs Indicators 2008 2010 2012 A. Health and Nutrition (MDG 1,3,4,5,6)
Proportion of children 0-5 years old who died
0.4 0.3 0.3
Prevalence of 0-5 malnourished children 9.8 7.1 5.0
Proportion of women who died due to pregnancy-related causes
0.4 0.1 0.08
B. Housing (MDG 7)
Proportion of households living in makeshift housing
6.1 7.1 1.7
Proportion of households who are informal settlers
7.3 5.4 3.7
C. Water and Sanitation (MDG 7)
Proportion of households without access to improved water source
14.1 11.4 1.4
Proportion of households without access to sanitary toilet facility
17.6 13.7 5.0
D. Basic Education (MDG 2, 3)
Proportion of children aged 6-12 years old not enrolled in elementary school
19.6 12.3 6.6
Proportion of children aged 13-16 years old not enrolled in high school
34.8 34.2 18.5

Page 13 of 17
E. Income and Livelihood (MDG 1)
Proportion of households with income below poverty threshold
50.5 59.8 31.1
Proportion of households with income below food threshold
34.3 44.3 18.5
Proportion of households who experienced food shortage
7.4 0.3 0.3
Proportion of unemployed members of the labor force
2.1 2.3 1.3
F. Peace and Order
Proportion of households who are victims of crime
0.3 0.2 0.2
Source: CBMS Office, Tabaco City
Based on the census results, there is significant improvement on health, water
and sanitation, housing, incomes and livelihood, and basic education. Focusing on education, the proportion of children aged 6-12 who are not attending elementary school has decreased from 19.6% in 2008 to 6.6% in 2012. Similarly, the proportion of children aged 13-16 who are not attending secondary school has decreased from 34.8% in 2008 to 18.5% in 2012.
The DepEd Tabaco City Division’s report on Enrollment Participation Rate (EPR) and Dropout Rate (DR) confirms the data generated by the CBMS. Below is the EPR and DR comparative tables for School Year 2005-2012 (See Table 5.):
Table 5. Enrollment participation rates of Tabaco City, 2005-2012
Table 6. Dropout rates of Tabaco City, 2005-2012
Dropout Rate in Tabaco 2005-2012 School Year Primary level Secondary level
2005-2006 0.69% 3.53%
2006-2007 0.68% 3.50%
2007-2008 0.59% 3.58%
2008-2009 0.51% 3.64%
2009-2010 0.84% 4.00%
2010-2011 0.49% 4.22%
2011-2012 0.29% 2.63%
Source: Tabaco Division of Schools
Since CBMS is community and location-specific, each barangay has its own data
from each census year. Below is an example of the comparative data on education for Barangay Oson for the three census years (See Table 6.):
Enrollment Participation Rate in Tabaco 2005-2012 School Year Primary level Secondary level 2005-2006 79.45% 64.57
2006-2007 78.53 % 66.75
2007-2008 75.92% 66.97
2008-2009 76.32% 64.98
2009-2010 81.04% 66.07
2010-2011 87.06% 61.35
2011-2012 90.62% 76.70
Source: Tabaco Division of Schools

Page 14 of 17
Table 7. Magnitude and proportion of CBMS educational indicators in Barangay Oson, 2008, 2010 and 2012.
Indicator CBMS 2008 CBMS 2010 CBMS 2012
Magnitude Proportion
Magnitude Proportion
Magnitude Proportion
Children 6-12 years old not attending elementary school
41 21.4% 33 16.1% 6 2.9%
Children 13-16 years old not attending high school
58 53.2% 58 52.3% 17 16.3%
Children 13-16 years old not attending school
30 10% 26 8.2% 3 1.0%
Source: Barangay Socio-economic Profile, Barangay Oson, Tabaco City
TLGU also monitors the city’s performance in localizing the attainment of the
MDGs while comparing local results to national achievements. It can be seen in the information below (Table 7.) that TLGU’s performance in MDG 2 is the same or even better than the national average:
Table 8. Cross comparison of core educational indicators between Tabaco City
and the Philippine average, 2008 and 2010.
Goal 2. Achieve Universal Primary Education
Indicators Tabaco City LATEST NATIONAL
DATA
Performance of
City of Tabaco
vs. National data
Proportion of children aged 6-11 years old enrolled in
elementary 4/ 92.0 89.9 (2010)
Proportion of children aged 12-15 years old enrolled
in high school 4/ 61.4 61.3 (2010)
Literacy rate of 15-24 year-olds 4/ 98.9 97.8 (2008)
4/NationaldatasourcedfromtheDepartmentofEducation(DepEd) SamewiththeNationalDataorevenbetterperformance
VI. Summary and Lessons Learned Accurate and relevant data is vital in decision-making and poverty reduction
The CBMS captures basic data about a locality and acts as a guide for policymakers and decision makers in crafting location-specific interventions to improve quality of life. This tool can provide information to support policy formulation, design, and program evaluation. Reliable data is essential in targeting beneficiaries and prioritizing where public investments will be allocated. Since wise public investment is
Page 15 of 17
key to reducing poverty and addressing inequalities in society, factual data is a prerequisite and is indispensable for effective poverty-reduction strategies. Public service delivery is depoliticized
Public service delivery generally means the provision of public goods or social (education, health), economic (grants) or infrastructure (water, electricity) services to those who need (or demand) them. In several occasions, political considerations and accomodations have affected the equitable distribution of goods and services to prospective beneficiaries. Since delivery is associated with redistribution, the stakes of non-delivery are politically high. With CBMS, beneficiaries of goods and services are selected based on factual data and government resources are directed to those who need it most. Targeted interventions are cost-effective
The main objective of targeted government intervention is to reduce the deprivation suffered by the poor (Kakwani, 2011). Oftentimes, the shot-gun approach is employed by governments and institutions because of the inability to identify the genuine poor. The CBMS can provide governments not only who the poor are but also where the are and why they are poor. Since the system can generate data down to the household level, interventions can be targeted to specific households or communities and the impact of the interventions can be effectively monitored afterwards. Limited resources when directed to those who will benefit the most, will bring about more meaningful, cost-effective and equitable growth. Increased local government accountability and transparency
Accountability and transparency are enhanced in communities using the CBMS. Knowing the needs of constituents, engaging them in the problem solving process, and responding to their needs by allocating resources, are essential to good governance. CBMS gives communities a voice in decision-making CBMS is a data gathering and monitoring tool that relies on people participation at all levels: from the census proper, to the community validation and solution identification, to the monitoring of the impact of interventions. It is crucial to involve communities in the localization of the MDGs since people at the grassroots level know their condition best and engaging them in finding solutions to their problems will ensure that poverty reduction strategies are appropriate, acceptable, and supported by the end-users and beneficiaries. Data validation is crucial
An important step in the CBMS process is data validation. In a community assembly, the results of the census are presented for comments and suggestions. The validation process engages discussion between the respondent-households, barangay leaders, and local planners and officials. At this stage, additional information that were not included in the census questionnaire are elicited from the participants so as to better understand the dynamics of poverty at the micro level. Solutions are thereafter formulated and the people or offices responsible for the implementation of the proposed solutions are identified.

Page 16 of 17
Facilitate monitoring and evaluating interventions
The initial census is used as baseline data against which subsequent results can be measured. In the case of TLGU, the census was conducted bi-annually but the monitoring of the impact of programs and projects need not wait for the next census. Barangay officials and local government offices are tasked and empowered to monitor impact after each intervention to allow for immediate and timely assessment of results. As mentioned earlier, the CBMS also facilitates tracking of the attainment of the MDGs and comparing local progress to national targets. Political commitment is key to sustainability
For CBMS to be an effective tool in poverty reduction, the data generated by the system should be utilized properly. Political commitment is key to CBMS sustainability and success. In the Philippine setting where elected officials have three-year terms, sustainability becomes a serious issue. To ensure sustainabilty of the CBMS and to guarantee that the TLGU’s investment on reliable data for local governance is not wasted, the Sangguniang Panlungsod of Tabaco passed Ordinance 012-2013 entitled: Institutionalizing the CBMS as a Tool for Localizing and Monitoring the Attainment of the MDGs and as a Basis of the Programs and Projects at the City and Barangay Levels in Tabaco City.
The CBMS is a tool and like any instrument is value-neutral. Its value and
significance depend on how it is utilized. Its potential to transform lives through accurate, timely, and relevant data is dependent on responsible and responsive development advocates.

Page 17 of 17
REFERENCES
Department of Education Tabaco City Division (2012). Division of Tabaco Annual
Accomplishment Report for 2012. DepEd Tabaco City Division, Philippines. Holyfield, L. (2009). Moving Up and Out: Poverty, Education, and the Single Parent
Family. Temple University Press. Philadelphia, PA. Kakwani, Nanak (2011). “A New Approach to Evaluating and Designing Targeted Social
Protection”. In Reyes, Celia and Marsmath Baris (editors). Monitoring the Impacts of the Clobal Crisis at the Community Level. De La Salle University Press. Manila, Philippines.
Philippine Development Forum Working Group on Millennium Development Goals
(MDGs) and Social Progress. Poverty Monitoring in the Philippines:The Case for Community Based Monitoring System (CBMS). http://www.pdf.ph/downloads/Annex_3_FINAL_PDF_Poverty_Mapping_Report__2_%5B1%5D.pdf
Reyes, C; Due, E. (2009). In focus: Fighting Poverty with Facts. Community Based Monitoring Systems. International Development Research Center. Ontario, Canada.
Scott, J. (1998). Seeing Like a State: How Certain Schemes to Improve the Human Condition Have Failed. New Haven and London: Yale University Press. (2012).
Tabaco City (2008). Community-Based Monitoring System Census 2008. Tabaco City,
Philippines. Tabaco City (2010). Community-Based Monitoring System Census 2010. Tabaco City,
Philippines. Tabaco City (2012). Community-Based Monitoring System Census 2012. Tabaco City,
Philippines. Tabaco City (2012). Comparative Results of CBMS Census 2008, 2010, and 2012 of
Barangay Oson, Tabaco City, Philippines. Tabaco City (2012). Consolidated Report on Technical-Vocational Courses offered by
Sentrong Kabuhayan Livelihood and Skills Training Center. Tabaco City, Philippines.
Tabaco City (2008). Socio-Economic Profile of Barangay Oson, Tabaco City, Philippines. United Nations (2007). The Millennium Development Goals Report 2007. UN. New York,
USA.mdgs.un.org/unsd/mdg/Resources/Sttic/products/Progress2007/UNSD_MDG_Report_2007e.pdf