achieving more sustainable solutions through … · achieving more sustainable solutions through...
TRANSCRIPT

Achieving More Sustainable Solutions Through Process IntensificationThrough Process Intensification
Rafiqul Gani
CAPEC-PROCESS, Department of Chemical & Biochemical Engineering
Technical University of Denmark, DK-2800 Lyngby, Denmarkwww.capec.kt.dtu.dkwww.capec.kt.dtu.dk
Fertilizers ElectronicsNutrition
Communications,
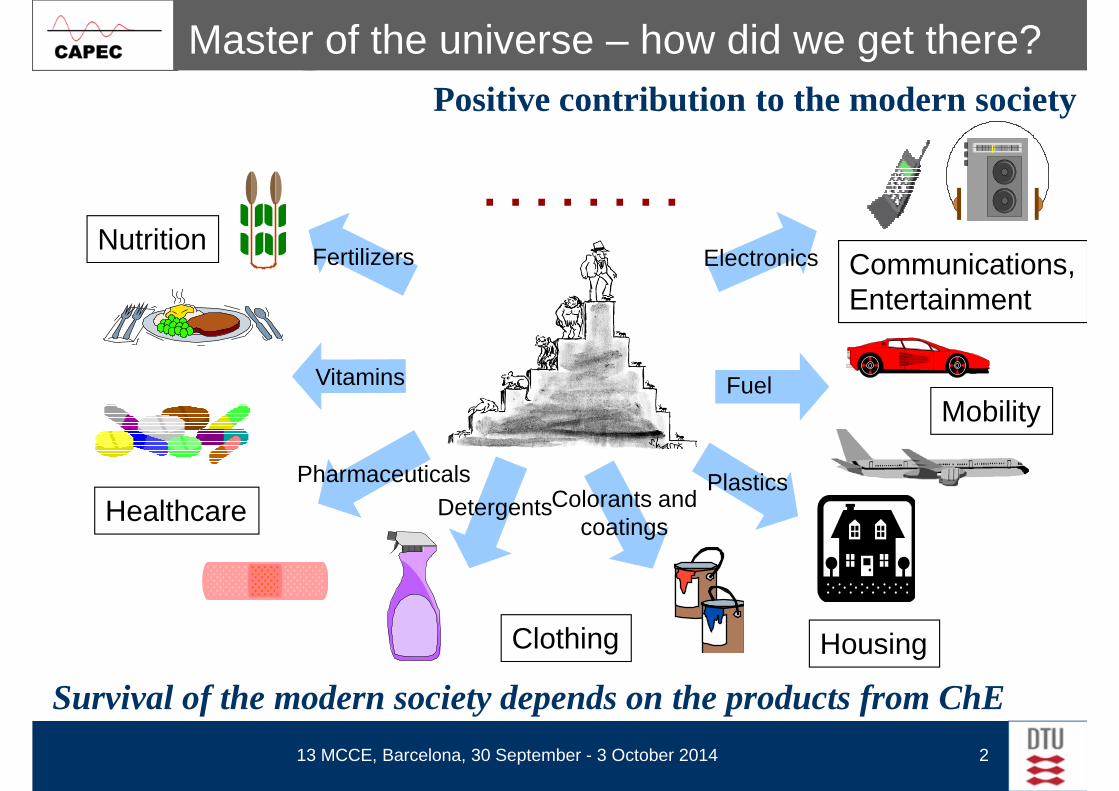
Master of the universe – how did we get there? Positive contribution to the modern society
. . . . . . . .Fertilizers
Vitamins
Colorants andcoatings
Plastics
Fuel
Electronics
PharmaceuticalsDetergentsHealthcare
Mobility
Communications,Entertainment
13 MCCE, Barcelona, 30 September - 3 October 2014 2
coatings
Clothing Housing
Survival of the modern society depends on the products from ChE
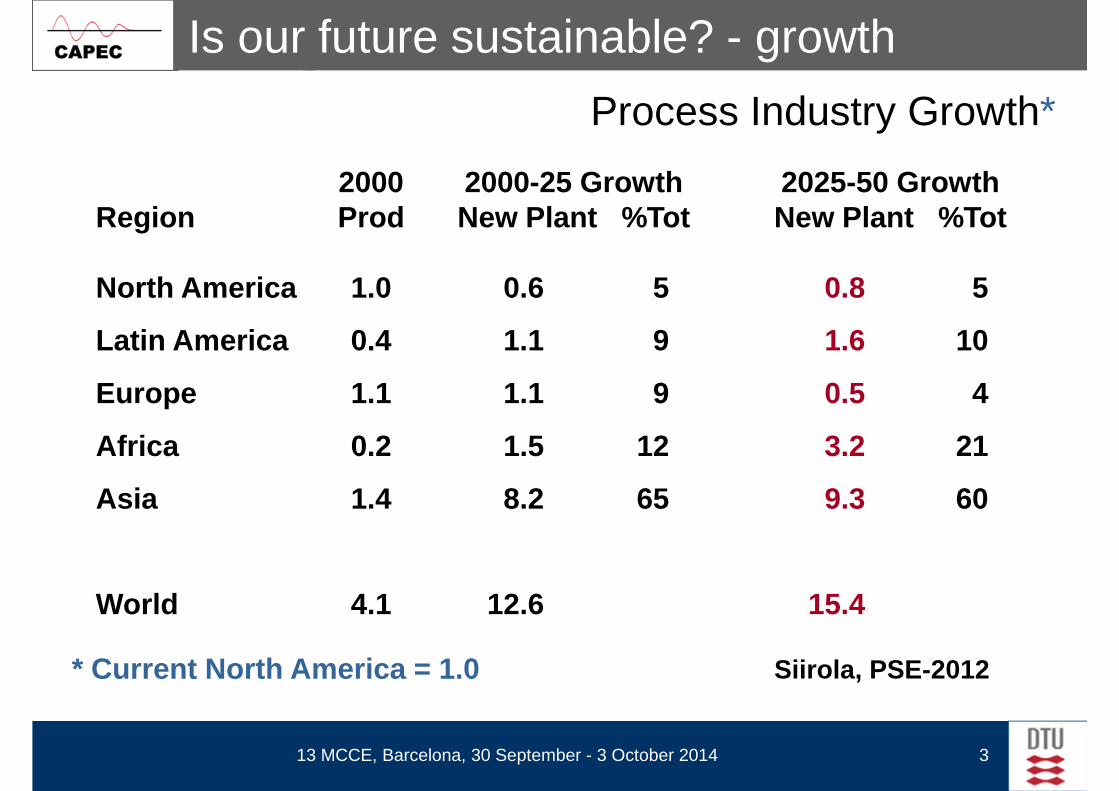
Is our future sustainable? - growth
Process Industry Growth*
Region2000Prod
2000-25 GrowthNew Plant %Tot
2025-50 GrowthNew Plant %Tot
North America 1.0 0.6 5 0.8 5
Latin America 0.4 1.1 9 1.6 10
Europe 1.1 1.1 9 0.5 4
Africa 0.2 1.5 12 3.2 21
Asia 1.4 8.2 65 9.3 60
13 MCCE, Barcelona, 30 September - 3 October 2014 3
World 4.1 12.6 15.4
* Current North America = 1.0 Siirola, PSE-2012
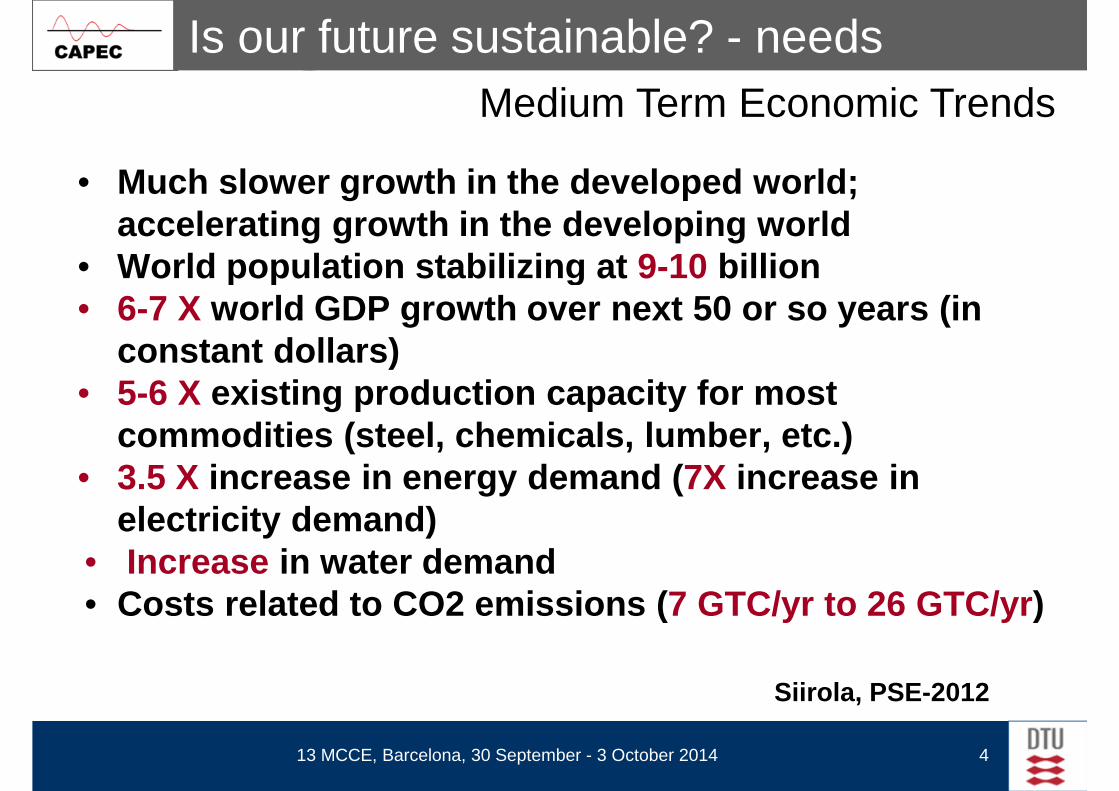
Is our future sustainable? - needsMedium Term Economic Trends
• Much slower growth in the developed world; accelerating growth in the developing world
• World population stabilizing at 9-10 billion• World population stabilizing at 9-10 billion• 6-7 X world GDP growth over next 50 or so years (in
constant dollars)• 5-6 X existing production capacity for most
commodities (steel, chemicals, lumber, etc.)• 3.5 X increase in energy demand ( 7X increase in
electricity demand)
13 MCCE, Barcelona, 30 September - 3 October 2014 4
electricity demand)• Increase in water demand• Costs related to CO2 emissions ( 7 GTC/yr to 26 GTC/yr )
Siirola, PSE-2012
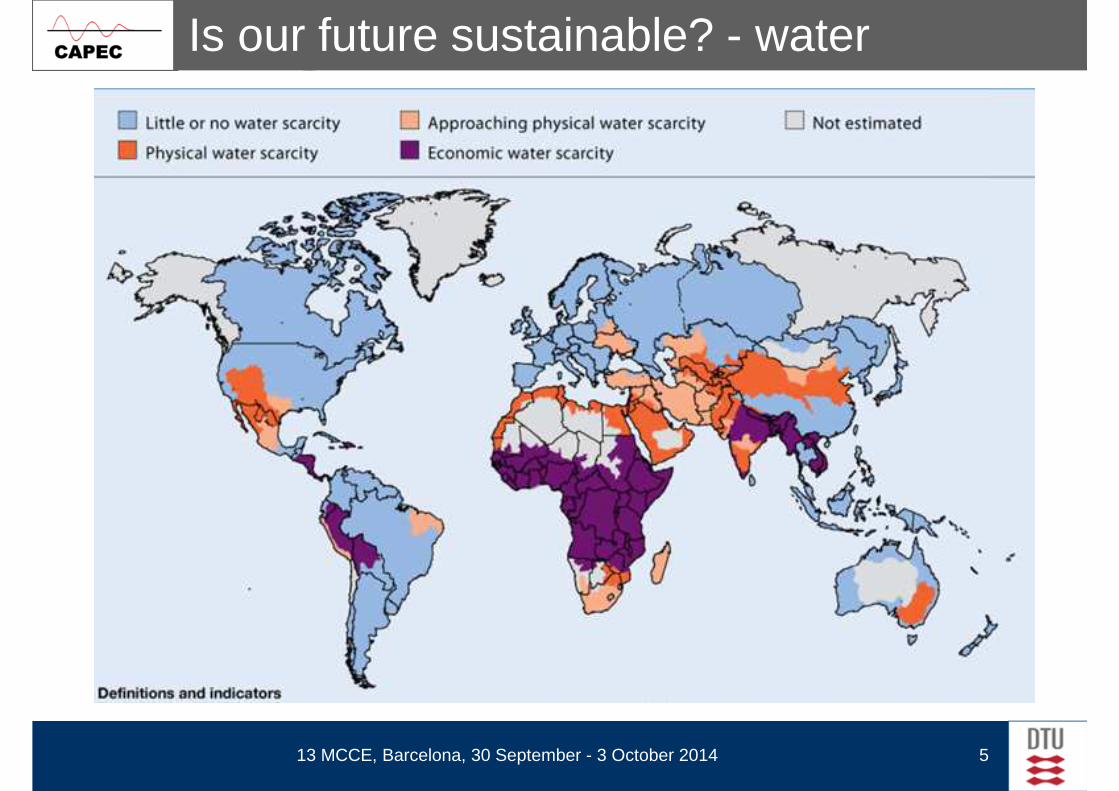
Is our future sustainable? - water
13 MCCE, Barcelona, 30 September - 3 October 2014 5

Is our future sustainable? - Environment
13 MCCE, Barcelona, 30 September - 3 October 2014 6
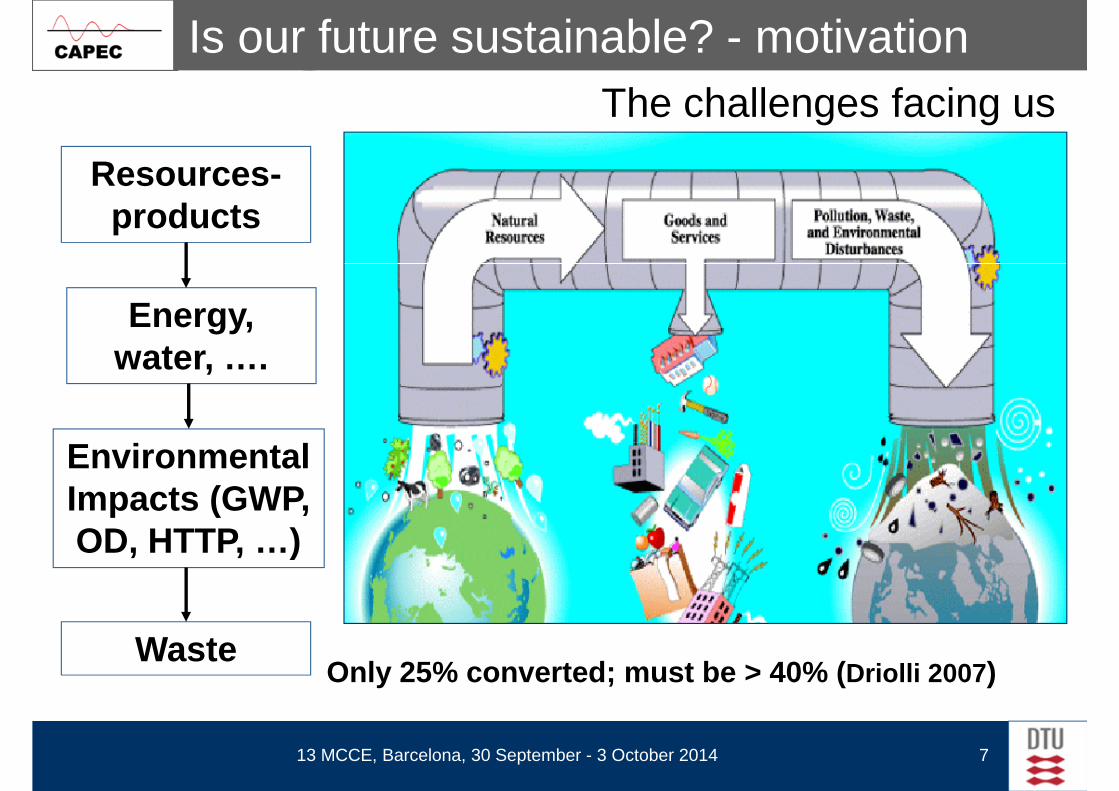
Is our future sustainable? - motivationThe challenges facing us
Resources-products
Energy, water, ….
Environmental Impacts (GWP, OD, HTTP, …)
13 MCCE, Barcelona, 30 September - 3 October 2014 7
OD, HTTP, …)
WasteOnly 25% converted; must be > 40% ( Driolli 2007 )
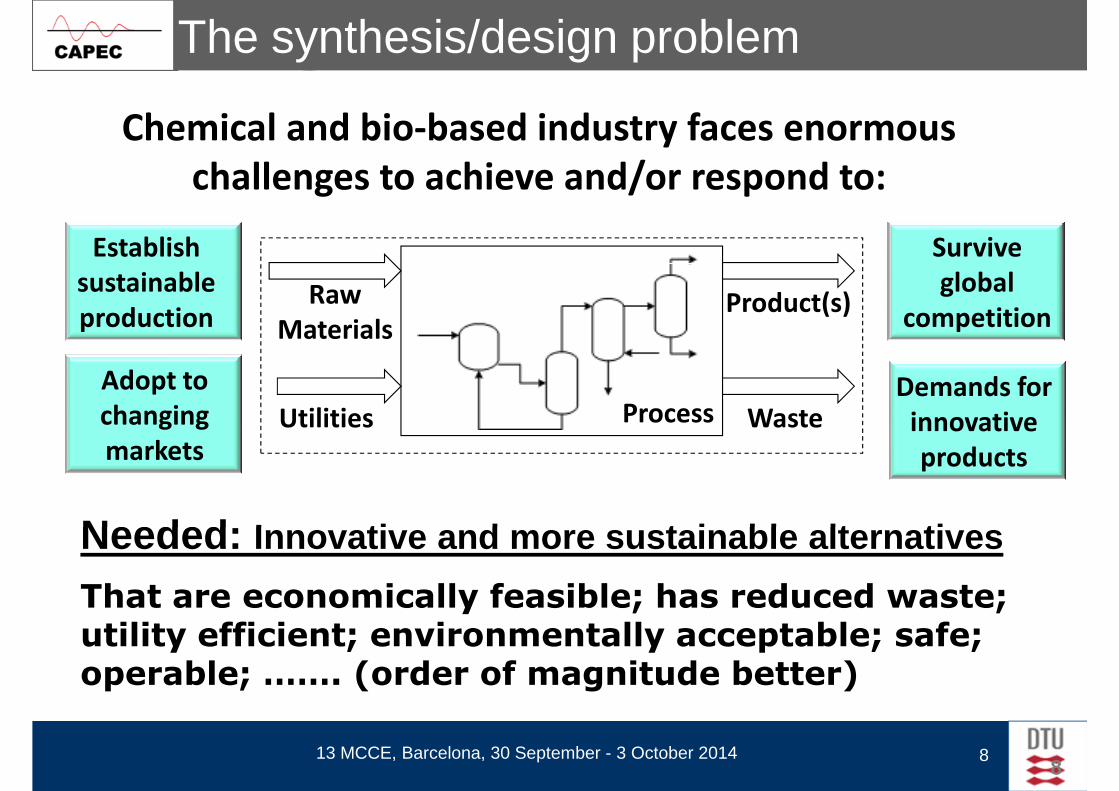
The synthesis/design problem
Establish
Chemical and bio-based industry faces enormous
challenges to achieve and/or respond to:
Survive
Needed: Innovative and more sustainable alternatives
Establish
sustainable
production
Adopt to
changing
markets
Demands for
innovative
products
Survive
global
competition
Process
Product(s)
Waste
Raw
Materials
Utilities
Needed: Innovative and more sustainable alternatives
That are economically feasible; has reduced waste; utility efficient; environmentally acceptable; safe; operable; ……. (order of magnitude better)
813 MCCE, Barcelona, 30 September - 3 October 2014 8
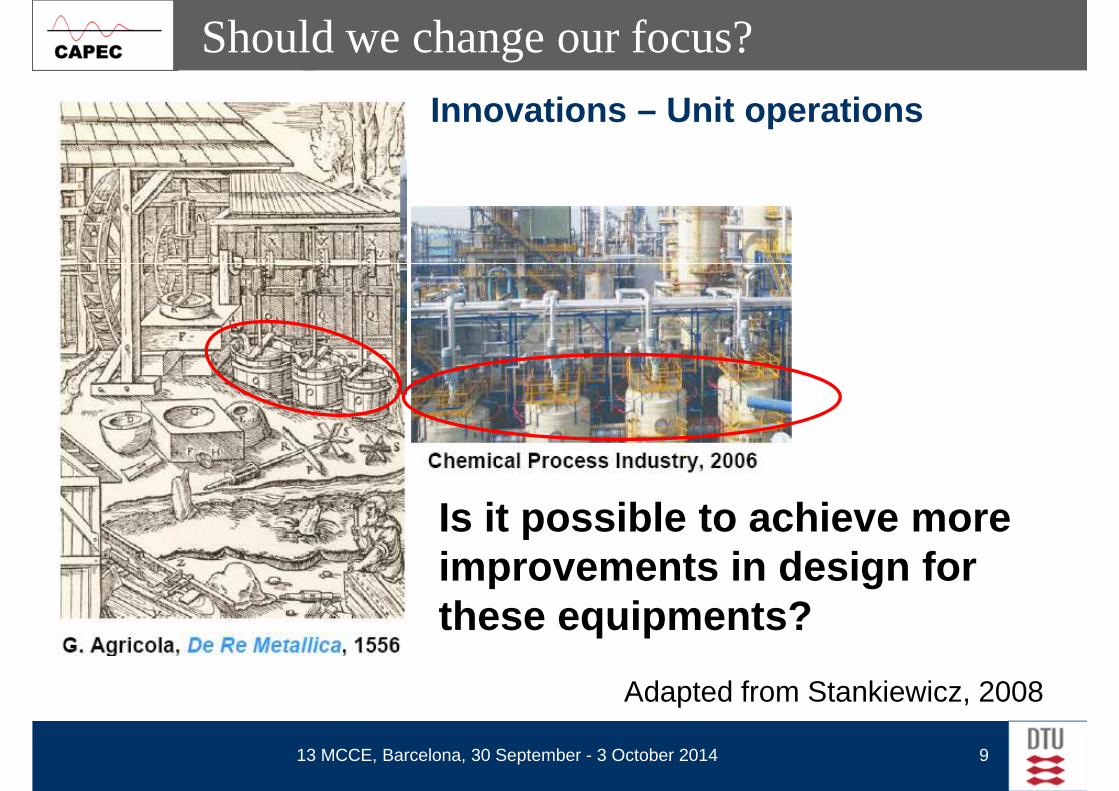
Should we change our focus?
Innovations – Unit operations
Is it possible to achieve more
13 MCCE, Barcelona, 30 September - 3 October 2014 9
Is it possible to achieve more improvements in design for these equipments?
Adapted from Stankiewicz, 2008
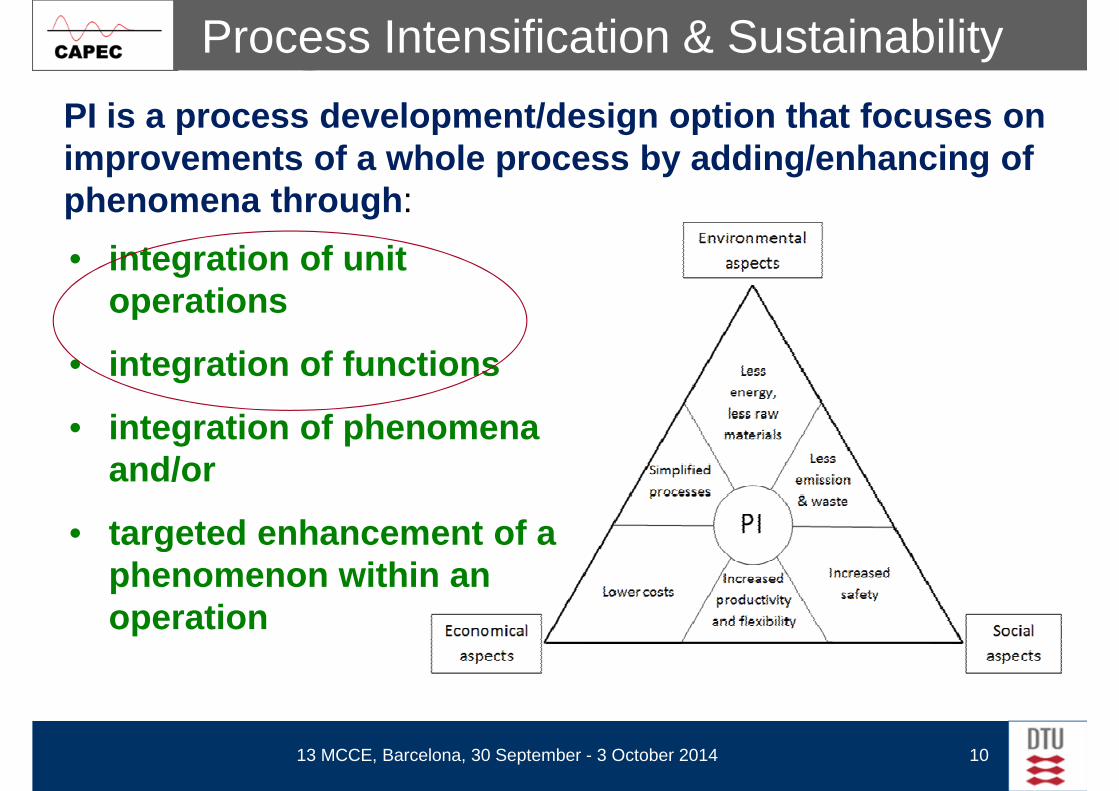
Process Intensification & Sustainability
PI is a process development/design option that focuses on improvements of a whole process by adding/enhancing of phenomena through:
• integration of unit • integration of unit operations
• integration of functions
• integration of phenomena and/or
• targeted enhancement of a
13 MCCE, Barcelona, 30 September - 3 October 2014 10
• targeted enhancement of a phenomenon within an operation
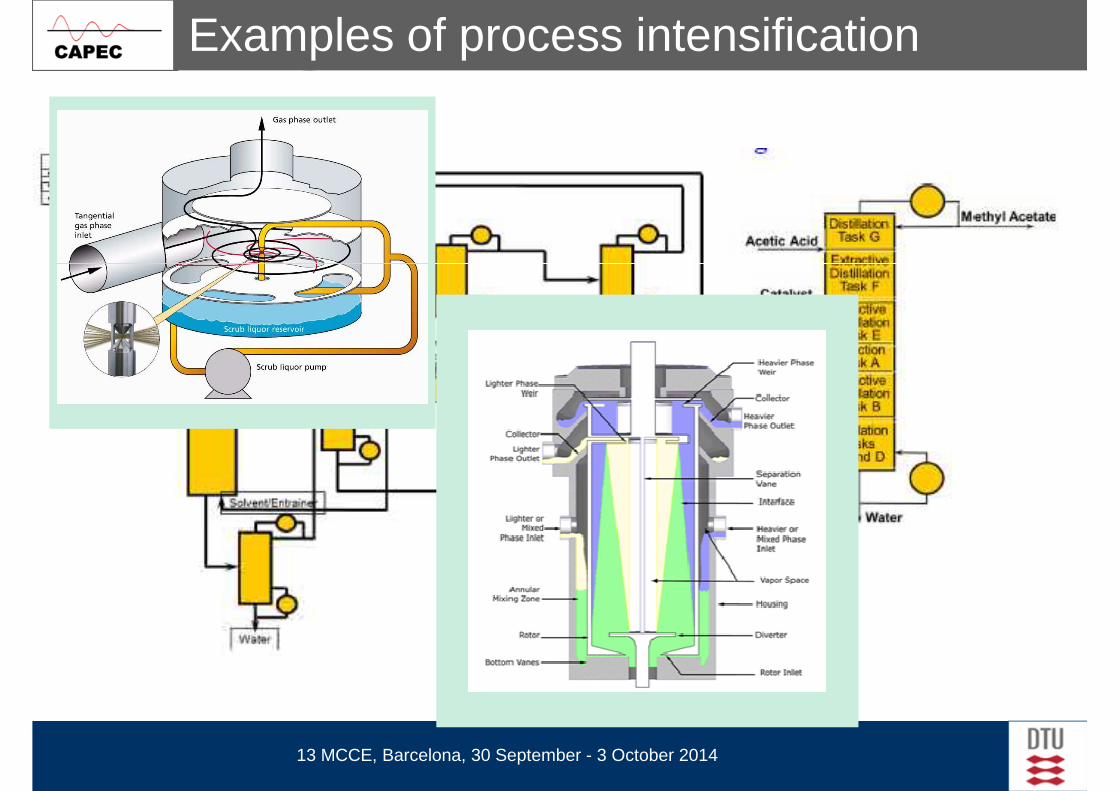
Examples of process intensification
13 MCCE, Barcelona, 30 September - 3 October 2014
11

Experiment based or model based?
REALITY
Experimenting
SystemSystemunder studyunder study
OptimisedOptimisedSystem ?System ?
Modelling
Implement
Simulate
REALITY
VIRTUAL
REALITY Modelling
ModelModelsystemsystem
Implement
Solution forSolution forthe systemthe system
13 MCCE, Barcelona, 30 September - 3 October 2014 12
How to perform useful virtual experiments to identify trully sustainable & innovative
solutions?
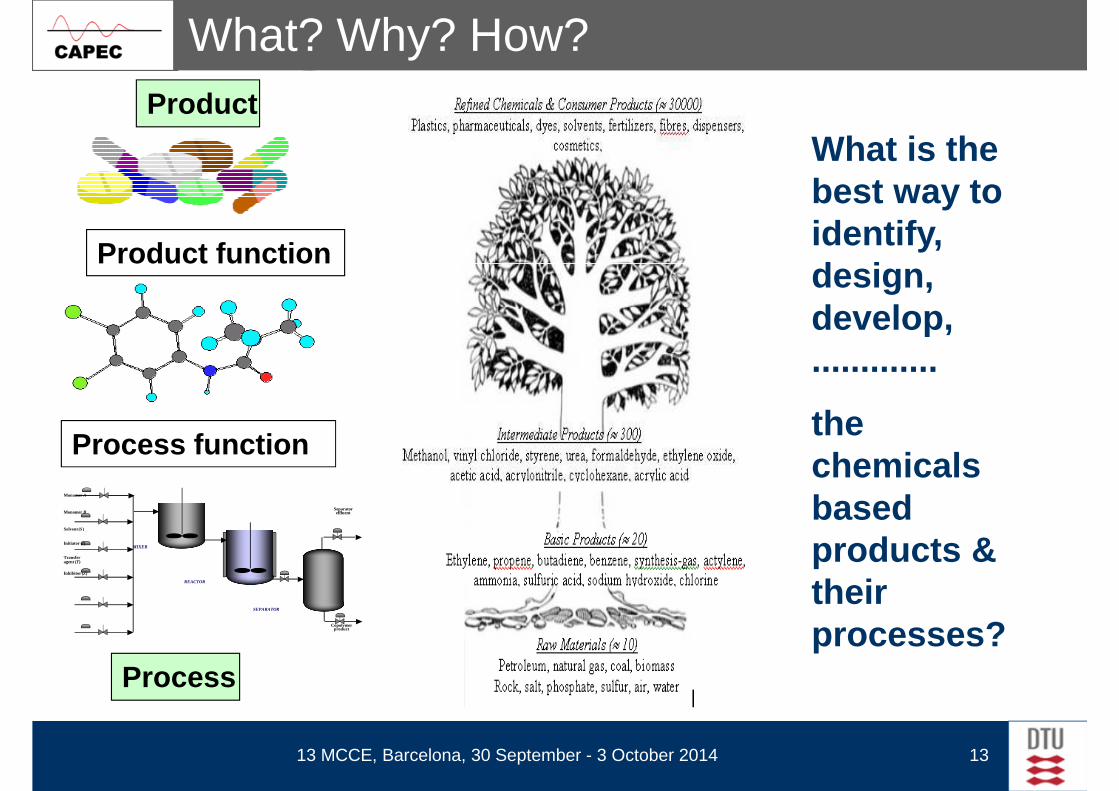
What? Why? How?
Product function
Product
What is the best way to identify, design,
Product function
Process functionMonomer A
Monomer B
Solvent (S)
Separatoreffluent
design, develop, .............
the chemicals based
13 MCCE, Barcelona, 30 September - 3 October 2014 13
Process
Solvent (S)
Initiator (I)
Transferagent (T)
Inhibitor (Z)
MIXER
REACTOR
SEPARATOR
Copolymerproduct
products & their processes?

Knowledge-data-models
Monomer A
Monomer BSeparatoreffluent
Log Pi = Ai + [Bi/(Ci + T)]Property models
Process modelsSolvent (S)
Initiator (I)
Transferagent (T)
Inhibitor (Z)
MIXER
REACTOR
SEPARATOR
Copolymerproduct
, , ( , , ) ; 1 ,ii n i o u t i
d mf f r m T P V i N C
d t= − − =
Mod
els
for
envi
ronm
enta
l im
pact
Models for
sustainability m
etrics
Process models
Operation models Formulation process model
13 MCCE, Barcelona, 30 September - 3 October 2014 14
Mod
els
for
envi
ronm
enta
l im
pact
Models for
sustainability m
etricsProperty-kinetics models
Process models
Cost models
model
Product evaluation model
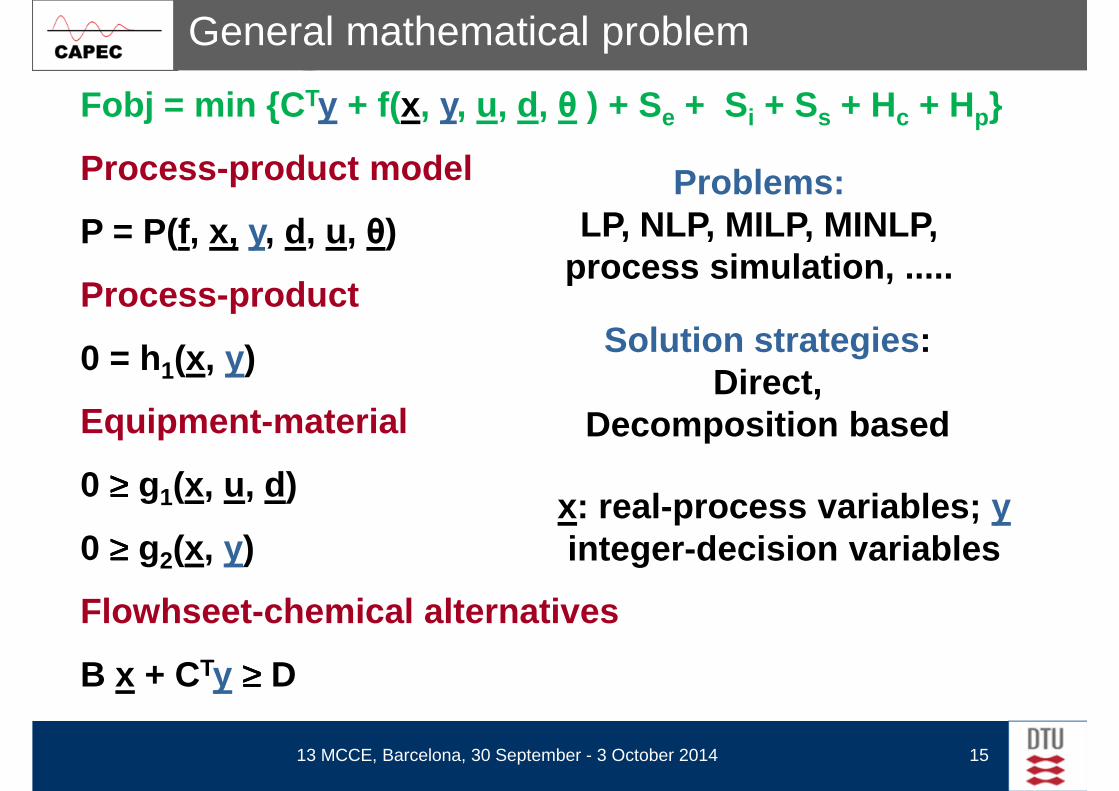
General mathematical problem
Fobj = min {C Ty + f(x, y, u, d, θ ) + Se + Si + Ss + Hc + Hp}
Process-product model
P = P(f, x, y, d, u, θ)Problems:
LP, NLP, MILP, MINLP,process simulation, .....
Process-product
0 = h1(x, y)
Equipment-material
0 ≥≥≥≥ g1(x, u, d)
≥≥≥≥
process simulation, .....
Solution strategies : Direct,
Decomposition based
x: real-process variables; y
13 MCCE, Barcelona, 30 September - 3 October 2014
0 ≥≥≥≥ g2(x, y)
Flowhseet-chemical alternatives
B x + CTy ≥≥≥≥ D
15
integer-decision variables

A 3-stages framework for achieving sustainability
13 MCCE, Barcelona, 30 September - 3 October 2014 16

Molecular design vs flowsheet design
• Comparison to Computer-Aided Molecular Design (CAMD)
• Key concept: Operation at a lower level of aggregationlower level of aggregation
Molecules
MolecularGroups
Lower Level of Aggregation
Next Lower Level of
Tasks
13 MCCE, Barcelona, 30 September - 3 October 2014 17
AtomsC H O
Level of Aggregation
PhenomenaIdea l
Mix ingReaction
2 Phase Mix ing
Phase Contact
Phase Transition
Gani et al. (1994)Babi et al. (2014)
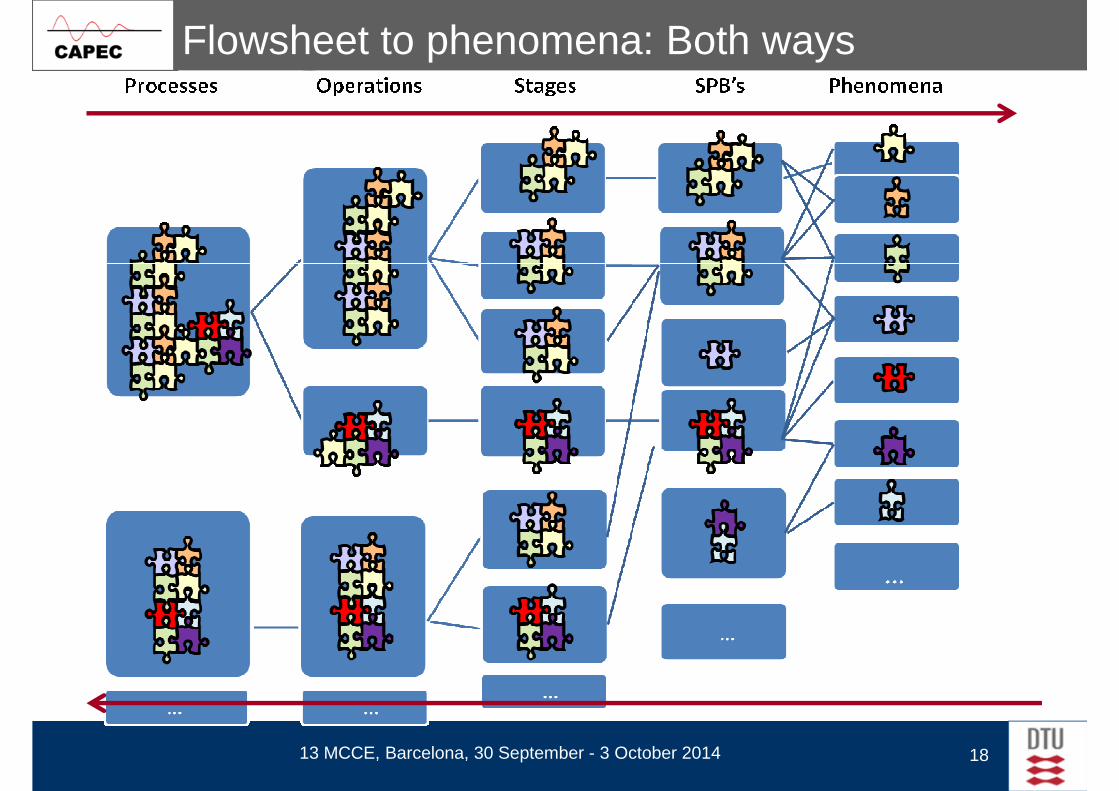
Flowsheet to phenomena: Both ways
13 MCCE, Barcelona, 30 September - 3 October 2014 18
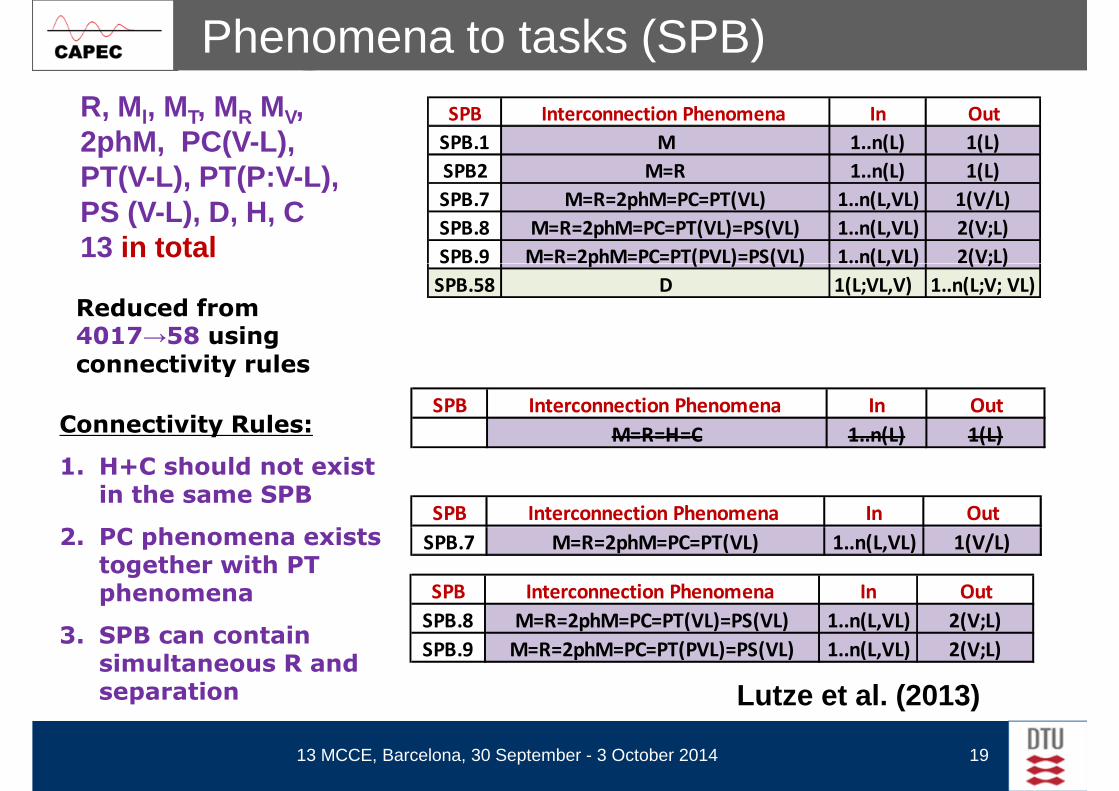
Phenomena to tasks (SPB)
SPB Interconnection Phenomena In Out
SPB.1 M 1..n(L) 1(L)
SPB2 M=R 1..n(L) 1(L)
SPB.7 M=R=2phM=PC=PT(VL) 1..n(L,VL) 1(V/L)
SPB.8 M=R=2phM=PC=PT(VL)=PS(VL) 1..n(L,VL) 2(V;L)
SPB.9 M=R=2phM=PC=PT(PVL)=PS(VL) 1..n(L,VL) 2(V;L)
R, Ml, MT, MR MV, 2phM, PC(V-L), PT(V-L), PT(P:V-L), PS (V-L), D, H, C 13 in total SPB.9 M=R=2phM=PC=PT(PVL)=PS(VL) 1..n(L,VL) 2(V;L)
SPB.58 D 1(L;VL,V) 1..n(L;V; VL)
SPB Interconnection Phenomena In Out
M=R=H=C 1..n(L) 1(L)
SPB Interconnection Phenomena In Out
Reduced from 4017→58 using connectivity rules
Connectivity Rules:
1. H+C should not exist in the same SPB
2. PC phenomena exists
13 MCCE, Barcelona, 30 September - 3 October 2014 19
SPB.7 M=R=2phM=PC=PT(VL) 1..n(L,VL) 1(V/L)
SPB Interconnection Phenomena In Out
SPB.8 M=R=2phM=PC=PT(VL)=PS(VL) 1..n(L,VL) 2(V;L)
SPB.9 M=R=2phM=PC=PT(PVL)=PS(VL) 1..n(L,VL) 2(V;L)
2. PC phenomena exists together with PT phenomena
3. SPB can contain simultaneous R and separation Lutze et al. (2013)
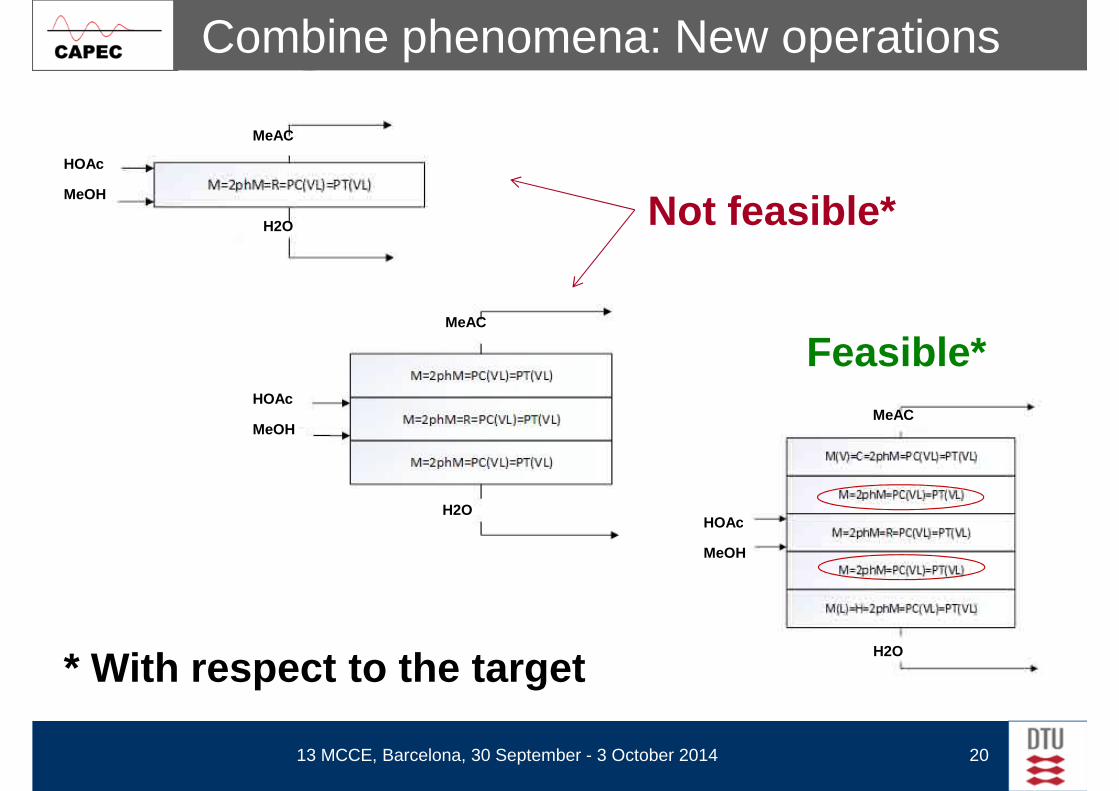
Combine phenomena: New operations
Not feasible*MeOH
HOAc
H2O
MeAC
Feasible*MeAC
H2O
MeOH
HOAc
HOAc
MeAC
13 MCCE, Barcelona, 30 September - 3 October 2014 20
MeOH
HOAc
H2O
* With respect to the target

Innovative solution
Non- reactive Zone
Reactive Zone
13 MCCE, Barcelona, 30 September - 3 October 2014 21
Non- reactive Zone
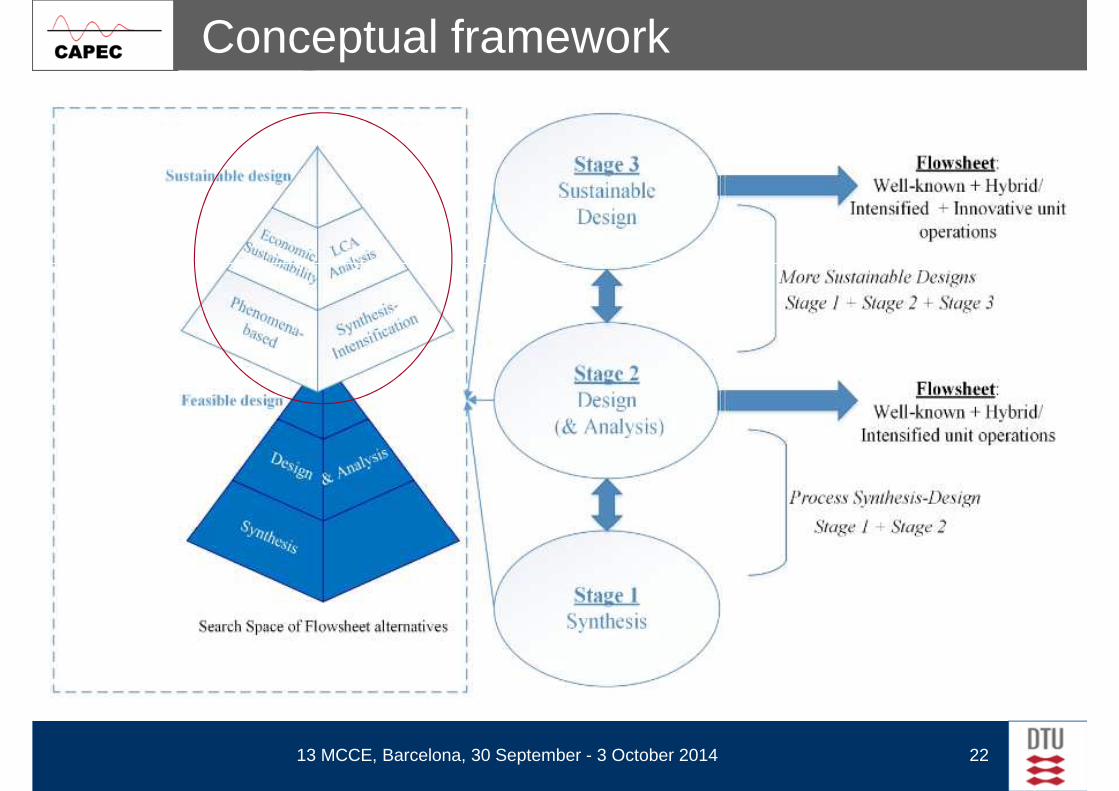
Conceptual framework
13 MCCE, Barcelona, 30 September - 3 October 2014 22
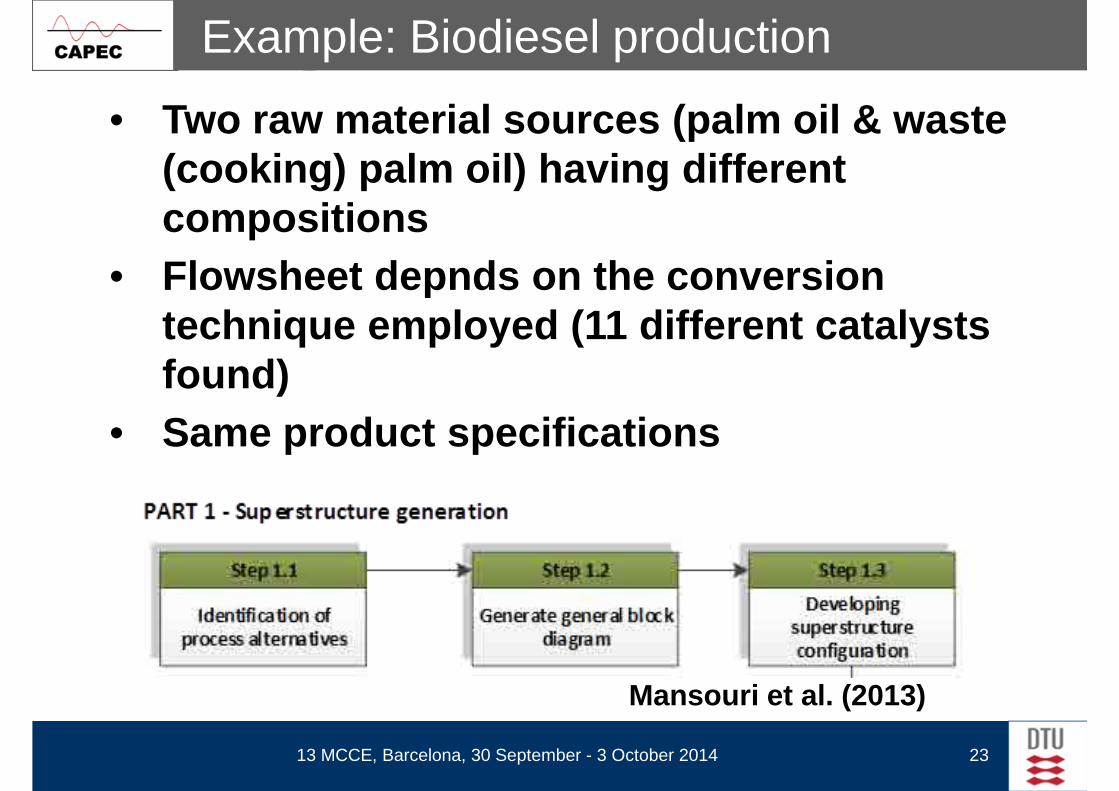
Example: Biodiesel production
• Two raw material sources (palm oil & waste (cooking) palm oil) having different compositions
• Flowsheet depnds on the conversion • Flowsheet depnds on the conversion technique employed (11 different catalysts found)
• Same product specifications
13 MCCE, Barcelona, 30 September - 3 October 2014 23
Mansouri et al. (2013)

Biodiesel production superstructure
Palm Oil
R1
Feedstock Pretreatment Reaction ProductsSeparation 1 Separation 2 Separation 3
R2 R3
DC
DC
Biodiesel
D DD
LLE
Water
RMeOH &
Waste oil
D
MeOH
DC
Glycerine
D DD
N
Acid
RMeOH & RWater
S S
F
LD
S
F
Catalyst
Co-solvent
S
NAlkali
S
Waste Oil
R
Vent gas
WC
Glycerol
S
S
13 MCCE, Barcelona, 30 September - 3 October 2014 24
Title: Superstructure biodiesel production Legend: R - ReactorD - DecanterS - SeparatorWC - Washing column
E - Esterification TankLLE - Liquid-liquid extractionDC - Distillation columnLD - Liquid dryer
LS - Liquid separatorF - Flash N - Neutralization tankLW - Liquid washing
LW
Water
Sep 1 - Methanol recoverySep 2 - Water washing and neutralizationSep 3 - Biodiesel and glycerine purificationDetails: Combination of flowsheets
S
LW LWLW
Water Water Water
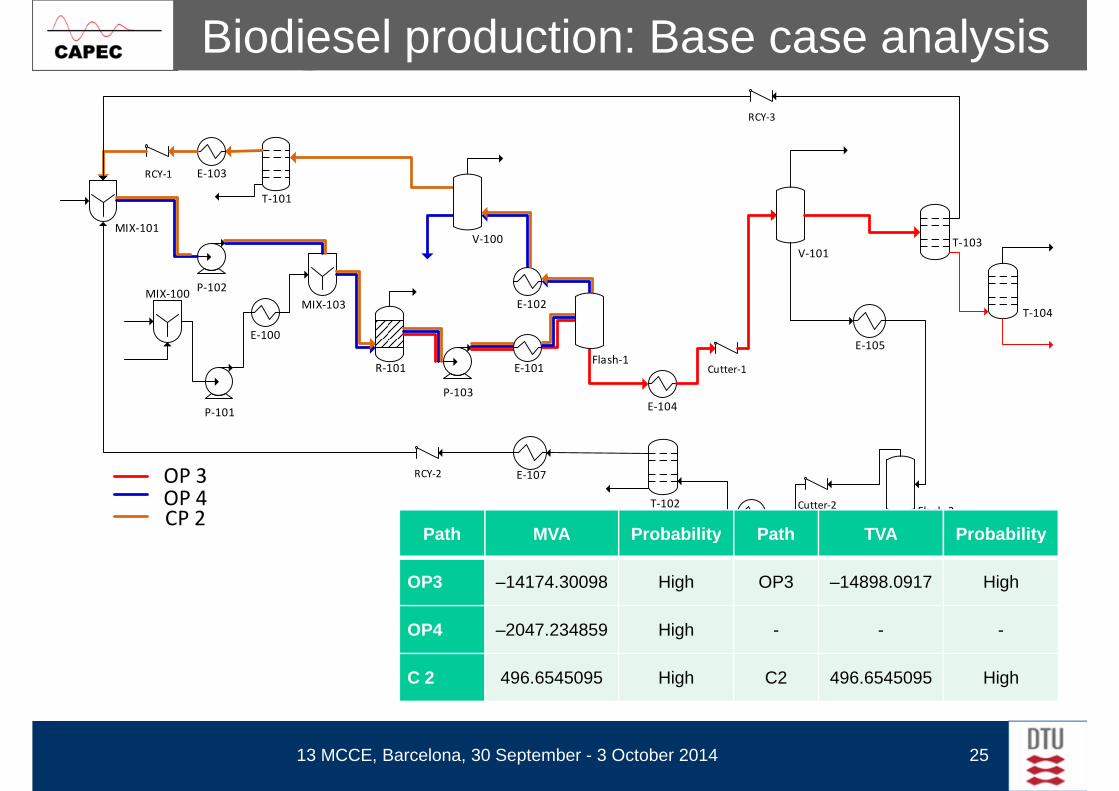
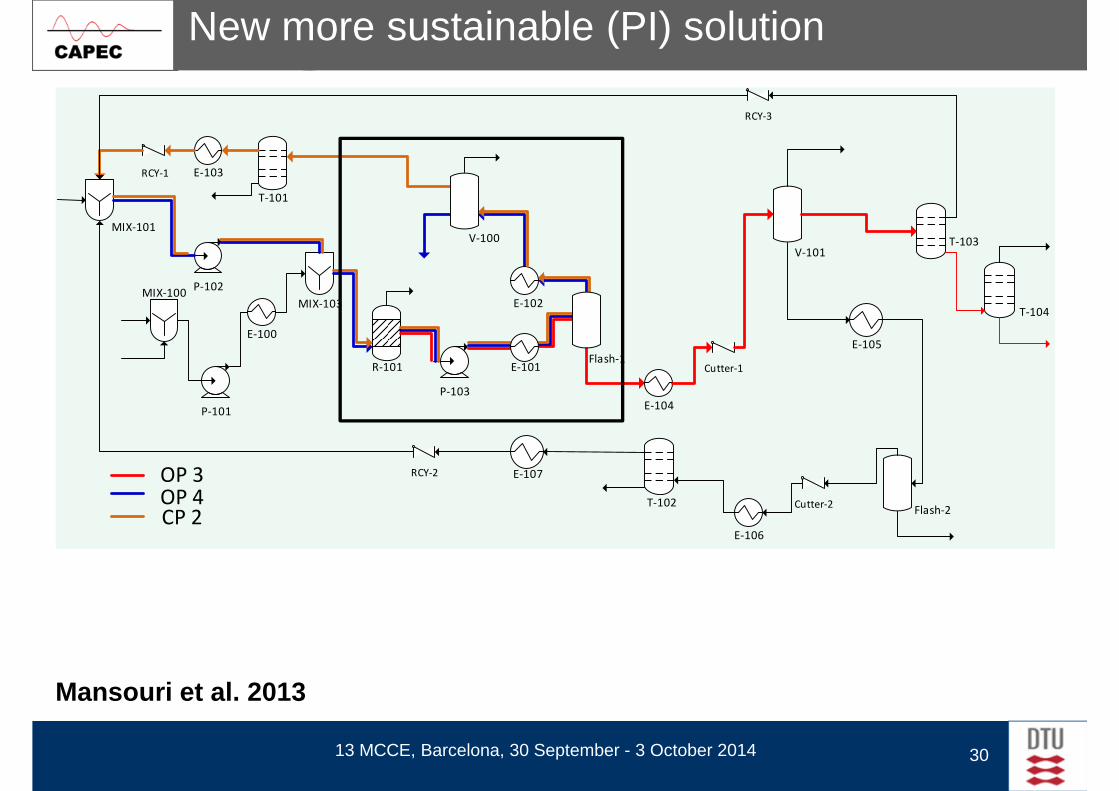
Biodiesel production: Base case analysis
MIX-101
T-101
E-103RCY-1
V-101T-103
RCY-3
V-100
MIX-100
P-101
E-100
P-102
P-103
MIX-103
R-101
E-104
Cutter-1
Flash-2Cutter-2T-102
RCY-2
T-104
E-105
E-107OP 3
E-101
E-102
Flash-1
OP 4CP 2
Path MVA Probability Path TVA Probability
13 MCCE, Barcelona, 30 September - 3 October 2014 25
E-106
CP 2Path MVA Probability Path TVA Probability
OP3 –14174.30098 High OP3 –14898.0917 High
OP4 –2047.234859 High - - -
C 2 496.6545095 High C2 496.6545095 High
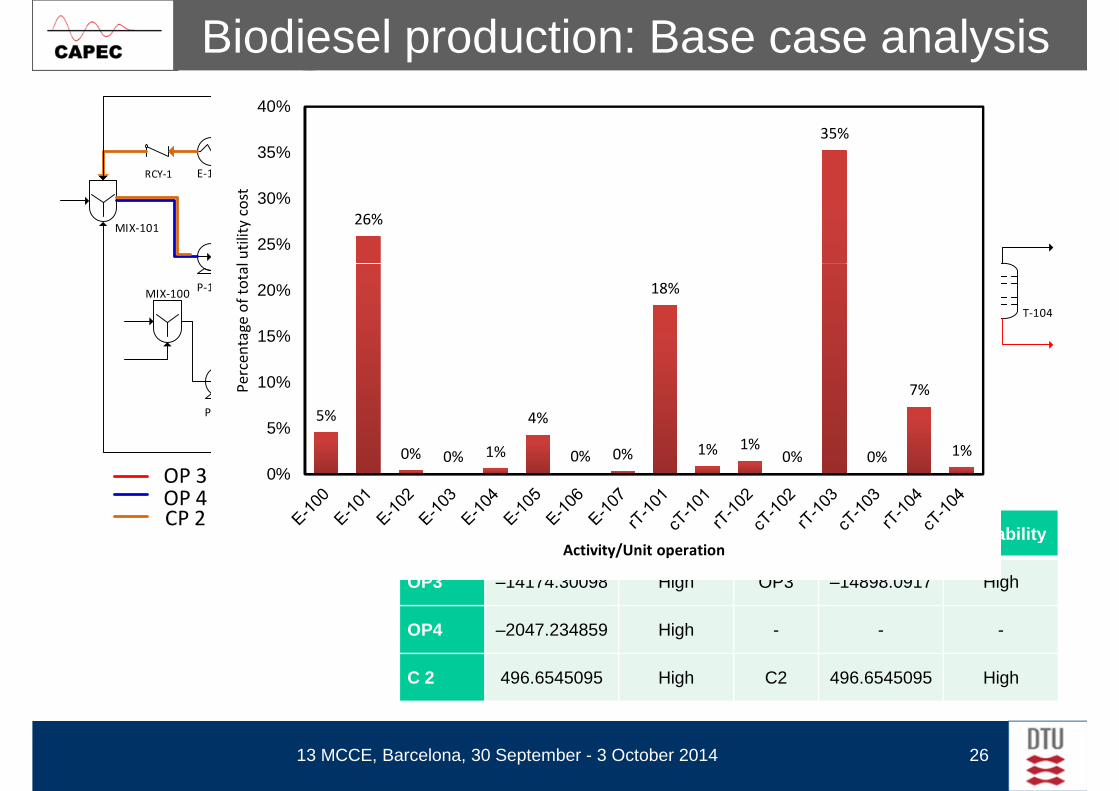
Biodiesel production: Base case analysis
MIX-101
T-101
E-103RCY-1
V-101T-103
RCY-3
V-100
26%
35%
25%
30%
35%
40%
Pe
rce
nta
ge
of
tota
l uti
lity
co
st
MIX-100
P-101
E-100
P-102
P-103
MIX-103
R-101
E-104
Cutter-1
Flash-2Cutter-2T-102
RCY-2
T-104
E-105
E-107OP 3
E-101
E-102
Flash-1
OP 4CP 2
Path MVA Probability Path TVA Probability
5%
0% 0% 1%
4%
0% 0%
18%
1% 1%0% 0%
7%
1%
0%
5%
10%
15%
20%
Pe
rce
nta
ge
of
tota
l uti
lity
co
st
13 MCCE, Barcelona, 30 September - 3 October 2014 26
E-106
CP 2Path MVA Probability Path TVA Probability
OP3 –14174.30098 High OP3 –14898.0917 High
OP4 –2047.234859 High - - -
C 2 496.6545095 High C2 496.6545095 High
Activity/Unit operation
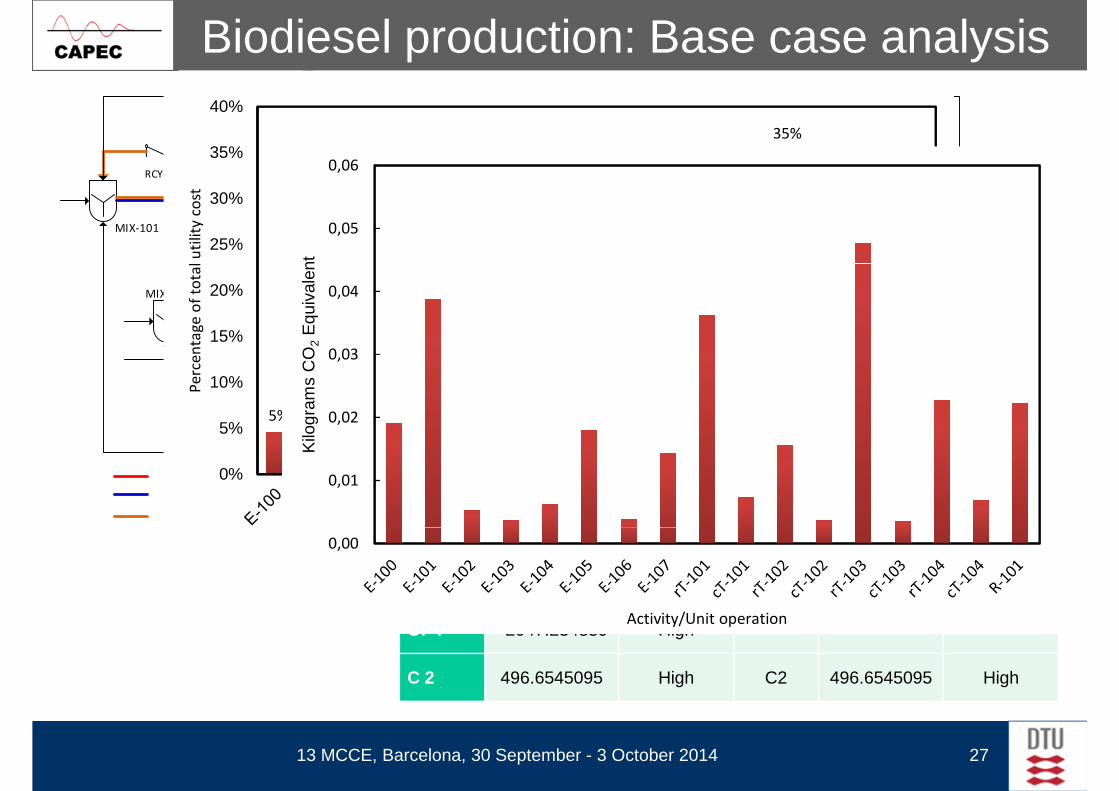
Biodiesel production: Base case analysis
MIX-101
T-101
E-103RCY-1
V-101T-103
RCY-3
V-100
26%
35%
25%
30%
35%
40%
Pe
rce
nta
ge
of
tota
l uti
lity
co
st
0,05
0,06
Equ
ival
ent
MIX-100
P-101
E-100
P-102
P-103
MIX-103
R-101
E-104
Cutter-1
Flash-2Cutter-2T-102
RCY-2
T-104
E-105
E-107OP 3
E-101
E-102
Flash-1
OP 4CP 2
Path MVA Probability Path TVA Probability
5%
0% 0% 1%
4%
0% 0%
18%
1% 1%0% 0%
7%
1%
0%
5%
10%
15%
20%
Pe
rce
nta
ge
of
tota
l uti
lity
co
st
0,01
0,02
0,03
0,04K
ilogr
ams
CO
2E
quiv
alen
t
13 MCCE, Barcelona, 30 September - 3 October 2014 27
E-106
CP 2Path MVA Probability Path TVA Probability
OP3 –14174.30098 High OP3 –14898.0917 High
OP4 –2047.234859 High - - -
C 2 496.6545095 High C2 496.6545095 High
Activity/Unit operation0,00
Activity/Unit operation

Biodiesel production: Identify tasks
Separation TaskSeparation TaskSeparation Task
Methanol
Recycle
MixingMethanol
RecycleMethanol
Feed
Reaction Task Separation TaskSeparation Task
Water
Separation Task
Separation Task
Biodiesel
MixingWaste cooking oil
Feed
13 MCCE, Barcelona, 30 September - 3 October 2014 28
Separation Task
Separation TaskMethanol
Recycle
Water
Glycerol
Separation Task
Waste Oil
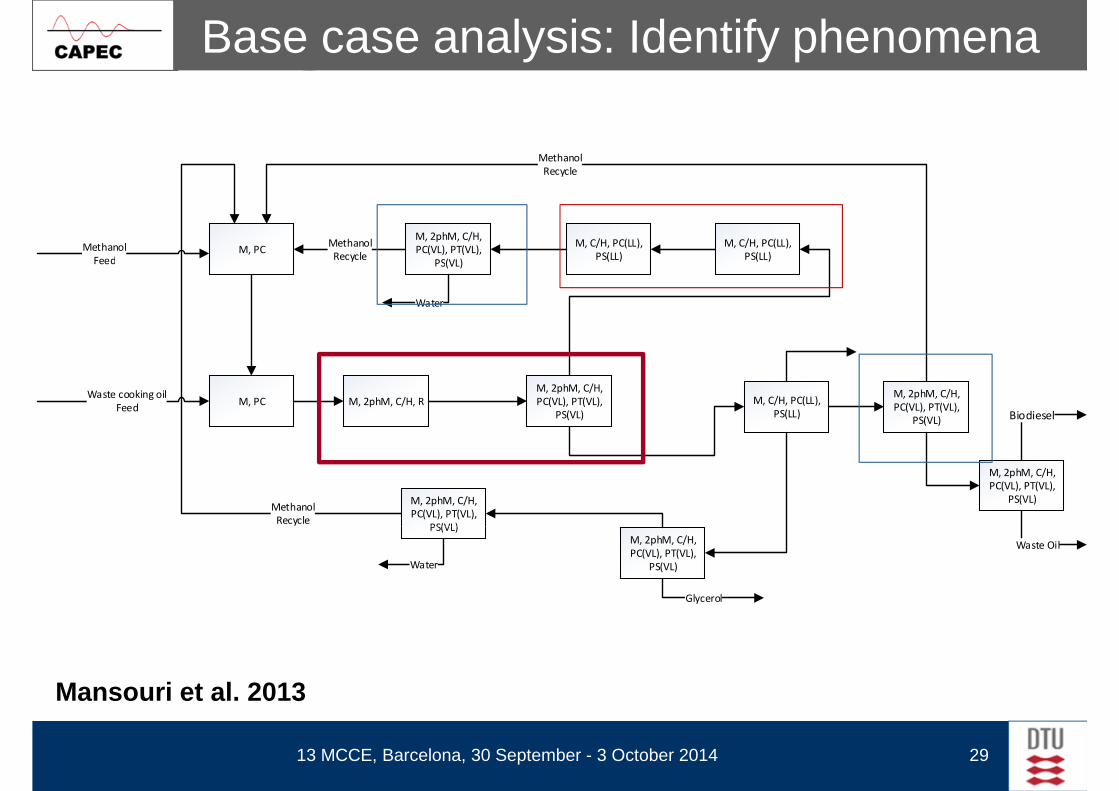
Base case analysis: Identify phenomena
M, C/H, PC(LL),
PS(LL)
M, C/H, PC(LL),
PS(LL)
M, 2phM, C/H,
PC(VL), PT(VL),
PS(VL)
Methanol
Recycle
M, PCMethanol
RecycleMethanol
Feed
M, 2phM, C/H, R
M, 2phM, C/H,
PC(VL), PT(VL),
PS(VL)
PS(VL)
M, C/H, PC(LL),
PS(LL)
Water
M, 2phM, C/H,
PC(VL), PT(VL),
PS(VL)
Methanol
Recycle
M, 2phM, C/H,
PC(VL), PT(VL),
PS(VL)
M, 2phM, C/H,
PC(VL), PT(VL),
PS(VL)
Biodiesel
M, PC
Feed
Waste cooking oil
Feed
13 MCCE, Barcelona, 30 September - 3 October 2014 29
M, 2phM, C/H,
PC(VL), PT(VL),
PS(VL)
PS(VL)
Water
Glycerol
Waste Oil
Mansouri et al. 2013
MIX-101
T-101
E-103RCY-1
V-101T-103
RCY-3
V-100
New more sustainable (PI) solution
MIX-100
P-101
E-100
P-102
P-103
MIX-103
R-101
E-104
Cutter-1
Flash-2Cutter-2T-102
RCY-2
T-104
E-105
E-107OP 3
E-101
E-102
Flash-1
OP 4CP 2
E-106
CP 2
13 MCCE, Barcelona, 30 September - 3 October 2014 30
Mansouri et al. 2013
MIX-101
T-101
E-103RCY-1
V-101T-103
RCY-3
V-100
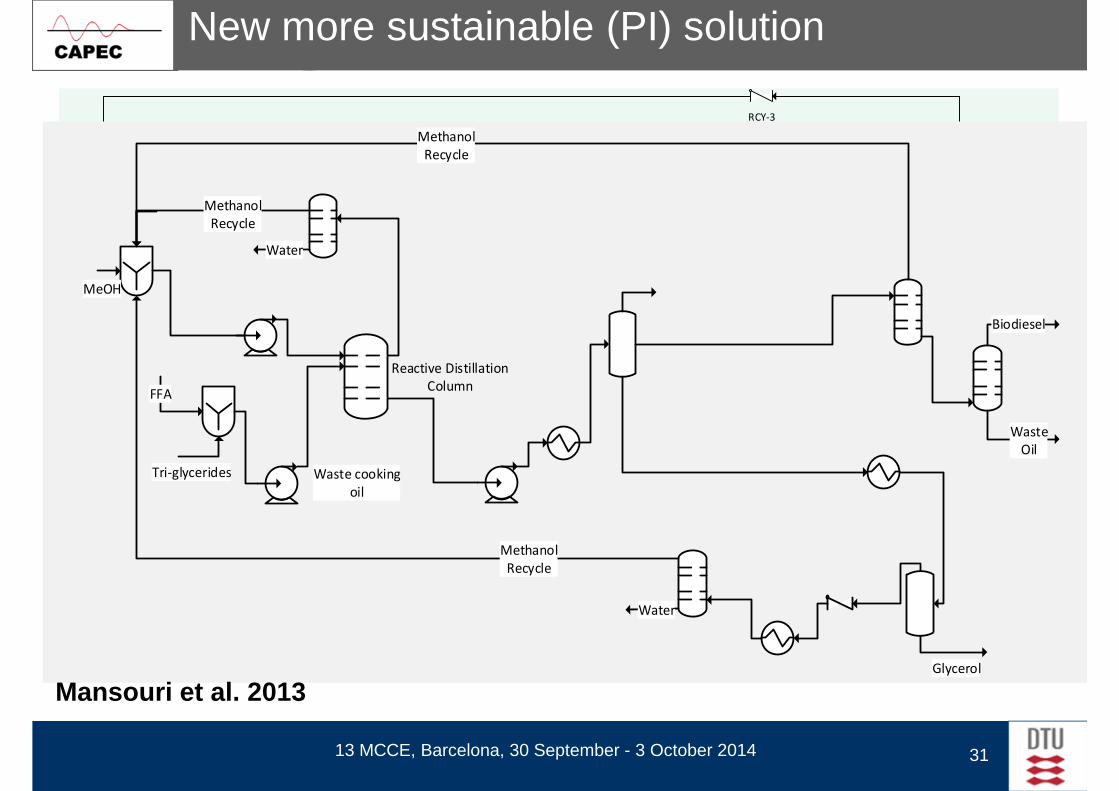
New more sustainable (PI) solution
Water
Methanol
Recycle
Methanol
Recycle
MIX-100
P-101
E-100
P-102
P-103
MIX-103
R-101
E-104
Cutter-1
Flash-2Cutter-2T-102
RCY-2
T-104
E-105
E-107OP 3
E-101
E-102
Flash-1
OP 4CP 2
Waste cooking
oil
MeOH
Tri-glycerides
Biodiesel
Waste
Oil
Reactive Distillation
ColumnFFA
E-106
CP 2
13 MCCE, Barcelona, 30 September - 3 October 2014 31
Glycerol
Water
Methanol
Recycle
Mansouri et al. 2013
New more sustainable (PI) solution
Water
Methanol
Recycle
Methanol
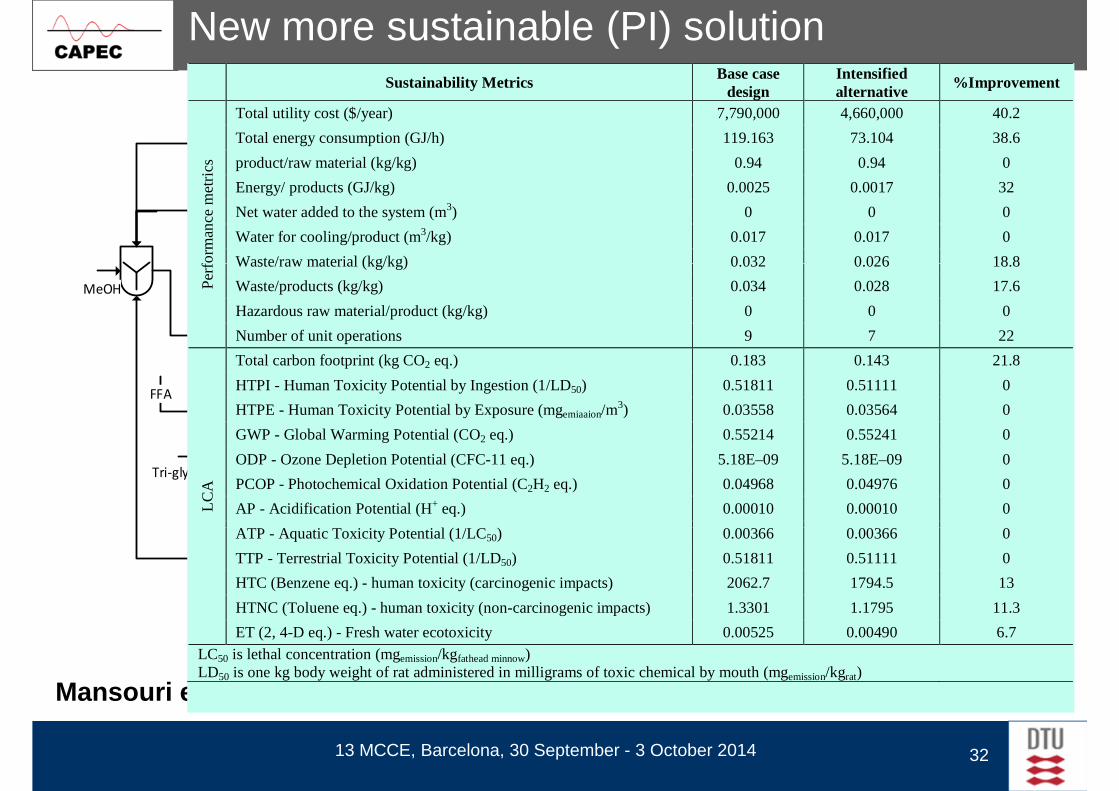
Recycle Sustainability Metrics Base case
design Intensified alternative
%Improvement
Per
form
ance
met
rics
Total utility cost ($/year) 7,790,000 4,660,000 40.2
Total energy consumption (GJ/h) 119.163 73.104 38.6
product/raw material (kg/kg) 0.94 0.94 0
Energy/ products (GJ/kg) 0.0025 0.0017 32
Net water added to the system (m3) 0 0 0
Water for cooling/product (m3/kg) 0.017 0.017 0
Waste/raw material (kg/kg) 0.032 0.026 18.8
Waste cooking
oil
MeOH
Tri-glycerides
Biodiesel
Waste
Oil
Reactive Distillation
ColumnFFA
Per
form
ance
Waste/raw material (kg/kg) 0.032 0.026 18.8
Waste/products (kg/kg) 0.034 0.028 17.6
Hazardous raw material/product (kg/kg) 0 0 0
Number of unit operations 9 7 22
LC
A
Total carbon footprint (kg CO2 eq.) 0.183 0.143 21.8
HTPI - Human Toxicity Potential by Ingestion (1/LD50) 0.51811 0.51111 0
HTPE - Human Toxicity Potential by Exposure (mgemiaaion/m3) 0.03558 0.03564 0
GWP - Global Warming Potential (CO2 eq.) 0.55214 0.55241 0
ODP - Ozone Depletion Potential (CFC-11 eq.) 5.18E–09 5.18E–09 0
PCOP - Photochemical Oxidation Potential (C2H2 eq.) 0.04968 0.04976 0
AP - Acidification Potential (H+ eq.) 0.00010 0.00010 0
ATP - Aquatic Toxicity Potential (1/LC) 0.00366 0.00366 0
13 MCCE, Barcelona, 30 September - 3 October 2014 32
Glycerol
Water
Methanol
Recycle
Mansouri et al. 2013
ATP - Aquatic Toxicity Potential (1/LC50) 0.00366 0.00366 0
TTP - Terrestrial Toxicity Potential (1/LD50) 0.51811 0.51111 0
HTC (Benzene eq.) - human toxicity (carcinogenic impacts) 2062.7 1794.5 13
HTNC (Toluene eq.) - human toxicity (non-carcinogenic impacts) 1.3301 1.1795 11.3
ET (2, 4-D eq.) - Fresh water ecotoxicity 0.00525 0.00490 6.7
LC50 is lethal concentration (mgemission/kgfathead minnow) LD50 is one kg body weight of rat administered in milligrams of toxic chemical by mouth (mgemission/kgrat)
New more sustainable (PI) solution
Water
Methanol
Recycle
Methanol
Recycle Sustainability Metrics Base case
design Intensified alternative
%Improvement
Per
form
ance
met
rics
Total utility cost ($/year) 7,790,000 4,660,000 40.2
Total energy consumption (GJ/h) 119.163 73.104 38.6
product/raw material (kg/kg) 0.94 0.94 0
Energy/ products (GJ/kg) 0.0025 0.0017 32
Net water added to the system (m3) 0 0 0
Water for cooling/product (m3/kg) 0.017 0.017 0
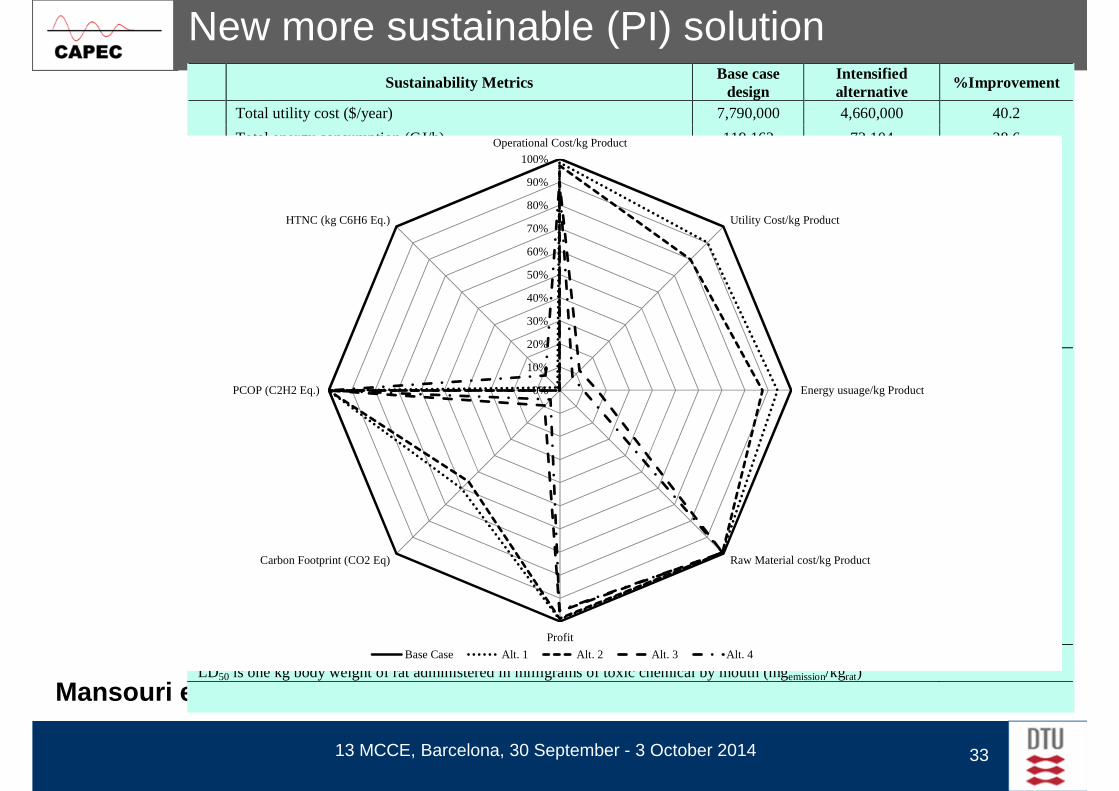
Waste/raw material (kg/kg) 0.032 0.026 18.8 60%
70%
80%
90%
100%
Operational Cost/kg Product
Utility Cost/kg ProductHTNC (kg C6H6 Eq.)
Waste cooking
oil
MeOH
Tri-glycerides
Biodiesel
Waste
Oil
Reactive Distillation
ColumnFFA
Per
form
ance
Waste/raw material (kg/kg) 0.032 0.026 18.8
Waste/products (kg/kg) 0.034 0.028 17.6
Hazardous raw material/product (kg/kg) 0 0 0
Number of unit operations 9 7 22
LC
A
Total carbon footprint (kg CO2 eq.) 0.183 0.143 21.8
HTPI - Human Toxicity Potential by Ingestion (1/LD50) 0.51811 0.51111 0
HTPE - Human Toxicity Potential by Exposure (mgemiaaion/m3) 0.03558 0.03564 0
GWP - Global Warming Potential (CO2 eq.) 0.55214 0.55241 0
ODP - Ozone Depletion Potential (CFC-11 eq.) 5.18E–09 5.18E–09 0
PCOP - Photochemical Oxidation Potential (C2H2 eq.) 0.04968 0.04976 0
AP - Acidification Potential (H+ eq.) 0.00010 0.00010 0
ATP - Aquatic Toxicity Potential (1/LC) 0.00366 0.00366 0
0%
10%
20%
30%
40%
50%
Energy usuage/kg ProductPCOP (C2H2 Eq.)
13 MCCE, Barcelona, 30 September - 3 October 2014 33
Glycerol
Water
Methanol
Recycle
Mansouri et al. 2013
ATP - Aquatic Toxicity Potential (1/LC50) 0.00366 0.00366 0
TTP - Terrestrial Toxicity Potential (1/LD50) 0.51811 0.51111 0
HTC (Benzene eq.) - human toxicity (carcinogenic impacts) 2062.7 1794.5 13
HTNC (Toluene eq.) - human toxicity (non-carcinogenic impacts) 1.3301 1.1795 11.3
ET (2, 4-D eq.) - Fresh water ecotoxicity 0.00525 0.00490 6.7
LC50 is lethal concentration (mgemission/kgfathead minnow) LD50 is one kg body weight of rat administered in milligrams of toxic chemical by mouth (mgemission/kgrat)
Raw Material cost/kg Product
Profit
Carbon Footprint (CO2 Eq)
Base Case Alt. 1 Alt. 2 Alt. 3 Alt. 4

Edible oil industry:Soybean Processing
Soybean (Glicine max):
native to East Asia, globally grown.
248 MMT global production*, steadily increasing
Goal:Goal:
Synthesis and Design of Optimal Soybean Processing Network
Maximize Net Present Value (NPV)
Robustness to Uncertainty
Models:
Generic Process Interval Model
Sources of uncertainty:
Commodity - price uncertainty
Natural product - raw material composition uncertaintyNatural product - raw material composition uncertainty
* FAO Food Outlook, 2007-2009
Raw Materials 2
Products 21
Processes 15
Proc. Intervals 42
Tot binary var. 65

Results - Topology
SELECTED INTERVALS
DET.
NPV (unit-cost)
106.6
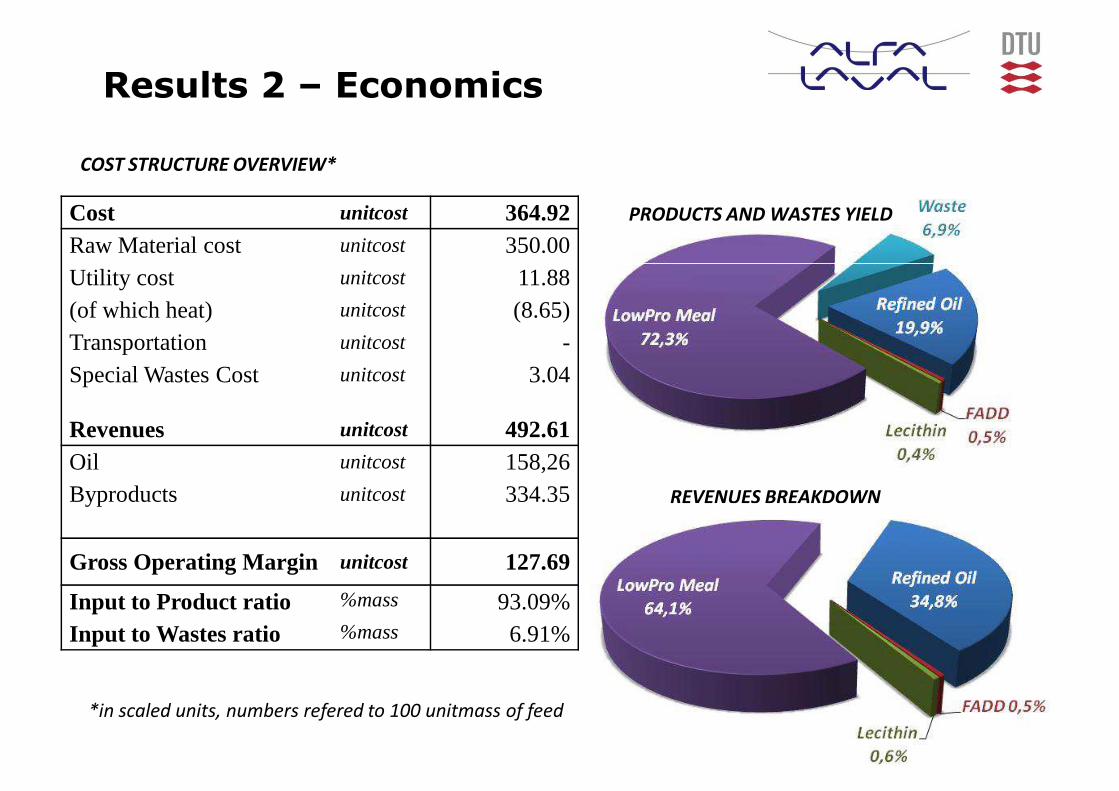
Results 2 – Economics
Cost unitcost 364.92Raw Material cost unitcost 350.00
PRODUCTS AND WASTES YIELD
COST STRUCTURE OVERVIEW*
Utility cost unitcost 11.88(of which heat) unitcost (8.65)Transportation unitcost -Special Wastes Cost unitcost 3.04
Revenues unitcost 492.61Oil unitcost 158,26Byproducts unitcost 334.35 REVENUES BREAKDOWN
Gross Operating Margin unitcost 127.69
Input to Product ratio %mass 93.09%Input to Wastes ratio %mass 6.91%
*in scaled units, numbers refered to 100 unitmass of feed
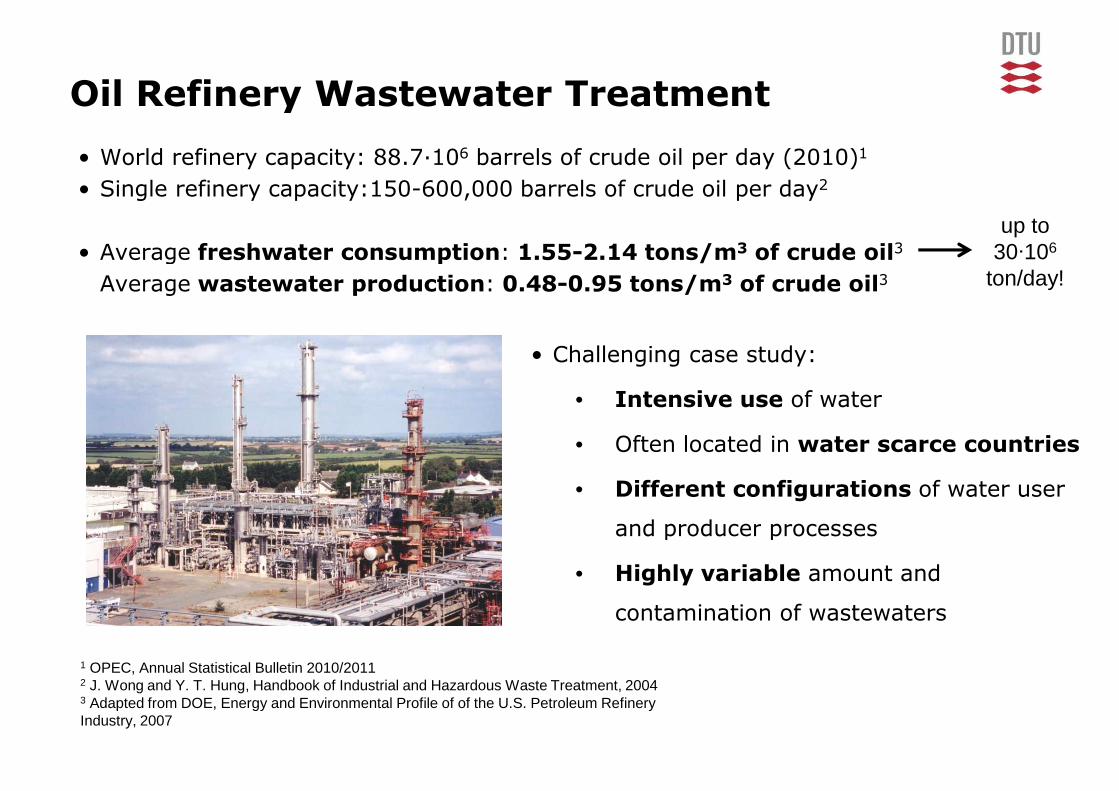
Oil Refinery Wastewater Treatment
• World refinery capacity: 88.7·106 barrels of crude oil per day (2010)1
• Single refinery capacity:150-600,000 barrels of crude oil per day2
• Average freshwater consumption: 1.55-2.14 tons/m3 of crude oil3up to
30·106• Average freshwater consumption: 1.55-2.14 tons/m of crude oil
Average wastewater production: 0.48-0.95 tons/m3 of crude oil3
• Challenging case study:
• Intensive use of water
• Often located in water scarce countries
• Different configurations of water user
and producer processes
30·10ton/day!
and producer processes
• Highly variable amount and
contamination of wastewaters
1 OPEC, Annual Statistical Bulletin 2010/20112 J. Wong and Y. T. Hung, Handbook of Industrial and Hazardous Waste Treatment, 20043 Adapted from DOE, Energy and Environmental Profile of of the U.S. Petroleum RefineryIndustry, 2007
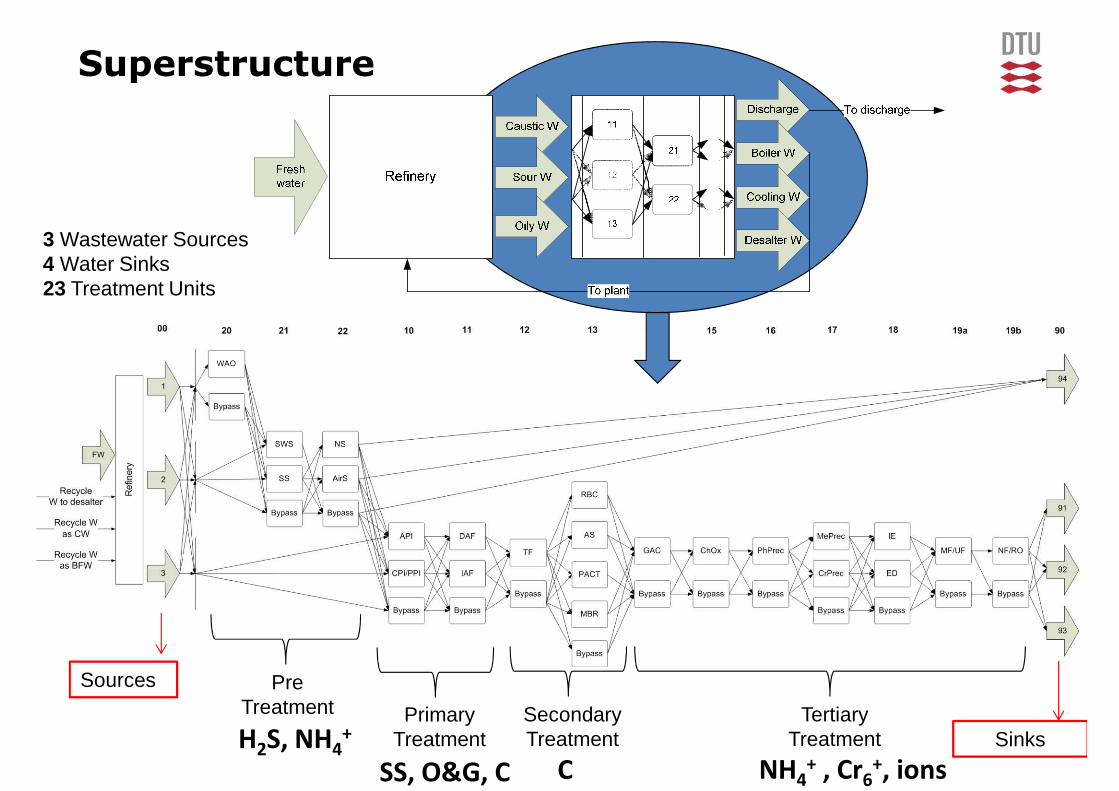
Superstructure
3 Wastewater Sources4 Water Sinks4 Water Sinks23 Treatment Units
Sinks
PreTreatment Primary
TreatmentSecondaryTreatment
TertiaryTreatmentH2S, NH4
+
SS, O&G, C NH4+ , Cr6
+, ions
Sources
C

Results 1- topology
Information obtained:
� Stream table
� Composition evolution
� Economic and performance metrics

CO2 Utilization
40

Production of block chemicals through CO2 conversion
Kongpanna et al. 2014
41
Roh et al. 2014

Production of block chemicals through CO2 conversion
42
Roh et al. 2014
Kongpanna et al. 2014
Are we dependent on others?
Why should Why should others make decisions for us? How do we become
decision makers?
13 MCCE, Barcelona, 30 September - 3 October 2014 43
makers?

What are the challenges?
Depletion of fossil fuels?
13 MCCE, Barcelona, 30 September - 3 October 2014 44
Grossmann, 2014

What are the challenges?
Growth in shale gas
13 MCCE, Barcelona, 30 September - 3 October 2014 45
Grossmann, 2014

How sure are we?
• Issues related to uncertainty of data & models are important and need to be considered
• Mutlidisciplinary nature of problems need to be handled
13 MCCE, Barcelona, 30 September - 3 October 2014 46
• Golden Era for Chemical Engineering (Westmoreland, 2014) – do something!
• Focused team-effort needed to meet the challenges

Chemical Engineering Education
13 MCCE, Barcelona, 30 September - 3 October 2014 47
Grossmann, 2014

Invitation to visit Denmark
Main Event of the EFCE
13 MCCE, Barcelona, 30 September - 3 October 2014 49
Call for abstracts is now open!