aci stcta jna tchnic a a
TRANSCRIPT

209ACI Structural Journal/July 2020
ACI STRUCTURAL JOURNAL TECHNICAL PAPER
This paper reports on an investigation of the flexural behavior and serviceability performance of long-span square concrete members with a shear span-to-effective depth ratio (a/d) greater than 5, inter-nally reinforced with uniformly distributed fiber-reinforced polymer (FRP) bars. The study comprised testing of four large-scale square members up to failure under four-point bending. The specimens measured 400 mm (16 in.) in width, 400 mm (16 in.) in depth, and 6000 mm (236.22 in.) in length. The test parameters included the longitudinal reinforcement ratio and the longitudinal reinforce-ment type, including glass FRP (GFRP), carbon FRP (CFRP), and steel bars. Test results show that the deformability of the tested FRP-reinforced concrete (FRPRC) specimens ranged between 7.0 and 10.4, which significantly exceeds the requirements of North American codes. Moreover, the nominal flexural strength of the specimen reinforced with GFRP bars was 1.9 times that of the steel counterpart specimen when the reinforcement ratios were similar. An analytical strain-compatibility model capable of predicting the flex-ural strength of the tested specimens was developed and compared to the experimental results. In addition, the measured crack widths and deflections were analyzed and compared at service load condi-tions to those predicted using models in the literature as well as in design guidelines and codes. The effect of uniformly distributed bars on the flexural strength and serviceability of square FRPRC members was also investigated, revealing that the presence of side bars significantly enhanced the serviceability performance in terms of crack width and deflection. On the other hand, the contribution of these side bars to flexural strength was minimal.
Keywords: fiber-reinforced polymer (FRP) bars; flexural strength; service-ability; uniformly distributed bars.
INTRODUCTIONReinforced concrete (RC) members with square cross
sections and internally reinforced with uniformly distrib-uted bars are frequently used in practice for structures such as bridges and marine structures (piers, piles, and fenders). Because they have high moments of inertia and strength characteristics equal in all directions, they can perform well under lateral loads. The deterioration of such members, resulting from the corrosion of internal steel reinforcement, has been a critical issue worldwide for many years (Mousa et al. 2018a). The use of fiber-reinforced-polymer (FRP) bars for internal reinforcement has been an innovative solution in overcoming these common problems caused by the corro-sion of steel reinforcement. FRP bars have many advan-tages compared to steel: one-quarter to one-fifth of steel’s density, neutrality to electrical and magnetic disturbances, and high tensile strength (ACI Committee 440 2015; Mousa et al. 2018b). They have also been introduced successfully in integrally insulated sandwich walls where low thermal
conductivity is desired and in hospital magnetic resonance imaging (MRI) units where nonferromagnetic systems are required (Tomlinson and Fam 2015).
Studies over the past two decades have provided important information on the flexural design and serviceability of rectangular FRP-reinforced concrete (FRPRC) beams (Benmokrane et al. 1996; Thériault and Benmokrane 1998; Rashid et al. 2005; Kassem et al. 2011; El-Nemr et al. 2013, 2016; Maranan et al. 2015; Tomlinson and Fam 2015; Elgabbas et al. 2016). These valuable studies have shown that FRPRC beams fail in flexure, either due to concrete crushing (compression failure mode) or FRP-bar rupture (tension failure mode). The concrete-crushing failure mode, however, is marginally more desirable because it is more progressive and has a higher degree of deformability (Nanni 1993).
Because crack width is a function of reinforcement axial stiffness (EA) and bond properties, reinforcement type has a significant effect. Hence, various modifications to the steel-based models—the empirically based Gergely-Lutz equa-tion (1968) and Frosch’s physical model (1999)—have been put forward to account for the mechanical properties of FRP reinforcing bars (Masmoudi et al. 1996; Toutanji and Saafi 2000; Ospina and Bakis 2007; Noël and Soudki 2014). Based on these studies, crack-width limitations are lower than those for steel RC as corrosion is no longer the governing factor (ACI Committee 440 2015; Mousa et al. 2019a).
Deflection-oriented studies have proposed coefficients to modify Branson’s equation to simulate the real behavior of FRPRC beams (Benmokrane et al. 1996; Thériault and Benmokrane 1998; Toutanji and Saafi 2000; Yost et al. 2003; Mousavi and Esfahani 2012; Adam et al. 2015). Others have proposed deflection-calculation models derived from the inte-gration of curvatures (Razaqpur et al. 2000; Bischoff 2005, 2007; Bischoff and Gross 2011a,b; Mousa et al. 2019b).
Although these extensive experimental programs have been carried out to investigate the flexural strength and serviceability of FRPRC members, most of the tests were limited to conventional arrangements of bars in a section and a shear span-to-effective depth ratio (a/d) ranging from 2 to 5. This paper presents an experimental study aimed at investigating the flexural behavior and serviceability perfor-mance of square FRPRC members with a/d values greater
Title No. 117-S88
Flexural Behavior of Long-Span Square Reinforced Concrete Members with Uniformly Distributed Fiber-Reinforced Polymer Barsby Salaheldin Mousa, Hamdy M. Mohamed, Brahim Benmokrane, and Antonio Nanni
ACI Structural Journal, V. 117, No. 4, July 2020.MS No. S-2019-241.R1, doi: 10.14359/51723511, received June 22, 2019, and
reviewed under Institute publication policies. Copyright © 2020, American Concrete Institute. All rights reserved, including the making of copies unless permission is obtained from the copyright proprietors. Pertinent discussion including author’s closure, if any, will be published ten months from this journal’s date if the discussion is received within four months of the paper’s print publication.
210 ACI Structural Journal/July 2020
than 5 and internally reinforced with uniformly distributed glass FRP (GFRP) and carbon FRP (CFRP) bars. The study also aimed at assessing the code provisions in light of the experimental results. In addition, the effect of the uniformly distributed bars on flexural strength and serviceability was also examined.
RESEARCH SIGNIFICANCEConsiderable research work has investigated the flexural
behavior and serviceability of rectangular concrete members reinforced with FRP bars; most of these studies were limited to conventional arrangements of bars in a section and a/d ranging from 2 to 5. No research, however, seems to have investigated the flexural behavior and serviceability perfor-mance of square FRPRC members with a/d values greater than 5 and internally reinforced with uniformly distributed FRP bars. The study will contribute to implementing the use of FRP bars in many structural members such as fender piles in marine structures, soft-eyes in tunnel applications, and contiguous pile walls because FRP bars can be an innovative solution to the corrosion problem in infrastruc-ture applications. This paper reports on full-scale square concrete members reinforced with GFRP and CFRP bars that were tested up to failure under four-point bending load. The paper examines the accuracy of the available equations in code provisions and those available in the literature for the cracking control and deflection of such members. This study also provides new insights into the effect of uniformly distributed bars on the flexural strength and serviceability of square FRPRC members. The experimental data and design analysis provide the evidence required to include design
provisions in the forthcoming ACI 440 code and updated CSA S6 code for the use of the uniformly distributed FRP bars in concrete members with a/d values greater than 5.
EXPERIMENTAL PROGRAMMaterial properties
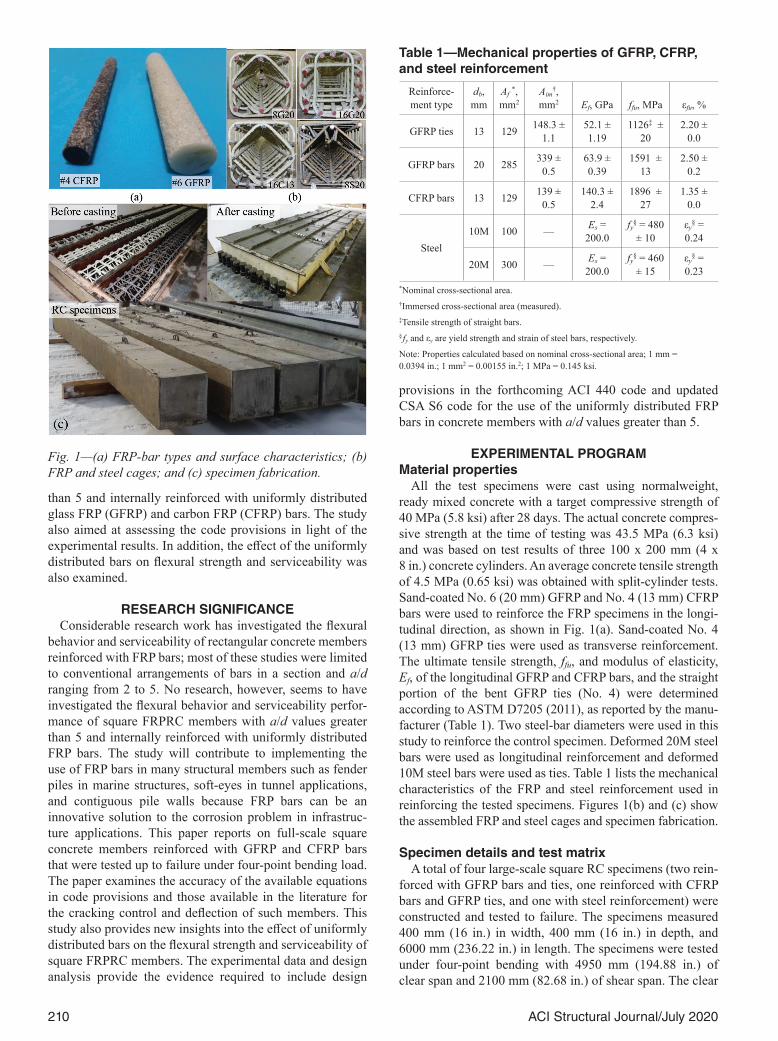
All the test specimens were cast using normalweight, ready mixed concrete with a target compressive strength of 40 MPa (5.8 ksi) after 28 days. The actual concrete compres-sive strength at the time of testing was 43.5 MPa (6.3 ksi) and was based on test results of three 100 x 200 mm (4 x 8 in.) concrete cylinders. An average concrete tensile strength of 4.5 MPa (0.65 ksi) was obtained with split-cylinder tests. Sand-coated No. 6 (20 mm) GFRP and No. 4 (13 mm) CFRP bars were used to reinforce the FRP specimens in the longi-tudinal direction, as shown in Fig. 1(a). Sand-coated No. 4 (13 mm) GFRP ties were used as transverse reinforcement. The ultimate tensile strength, ffu, and modulus of elasticity, Ef, of the longitudinal GFRP and CFRP bars, and the straight portion of the bent GFRP ties (No. 4) were determined according to ASTM D7205 (2011), as reported by the manu-facturer (Table 1). Two steel-bar diameters were used in this study to reinforce the control specimen. Deformed 20M steel bars were used as longitudinal reinforcement and deformed 10M steel bars were used as ties. Table 1 lists the mechanical characteristics of the FRP and steel reinforcement used in reinforcing the tested specimens. Figures 1(b) and (c) show the assembled FRP and steel cages and specimen fabrication.
Specimen details and test matrixA total of four large-scale square RC specimens (two rein-
forced with GFRP bars and ties, one reinforced with CFRP bars and GFRP ties, and one with steel reinforcement) were constructed and tested to failure. The specimens measured 400 mm (16 in.) in width, 400 mm (16 in.) in depth, and 6000 mm (236.22 in.) in length. The specimens were tested under four-point bending with 4950 mm (194.88 in.) of clear span and 2100 mm (82.68 in.) of shear span. The clear
Fig. 1—(a) FRP-bar types and surface characteristics; (b) FRP and steel cages; and (c) specimen fabrication.
Table 1—Mechanical properties of GFRP, CFRP, and steel reinforcement
Reinforce-ment type
db, mm
Af *, mm2
Aim†,
mm2 Ef, GPa ffu, MPa εfu, %
GFRP ties 13 129 148.3 ± 1.1
52.1 ± 1.19
1126‡ ± 20
2.20 ± 0.0
GFRP bars 20 285 339 ± 0.5
63.9 ± 0.39
1591 ± 13
2.50 ± 0.2
CFRP bars 13 129 139 ± 0.5
140.3 ± 2.4
1896 ± 27
1.35 ± 0.0
Steel10M 100 — Es =
200.0fy
§ = 480 ± 10
εy§ =
0.24
20M 300 — Es = 200.0
fy§ = 460 ± 15
εy§ =
0.23*Nominal cross-sectional area.†Immersed cross-sectional area (measured).‡Tensile strength of straight bars.§fy and εy are yield strength and strain of steel bars, respectively.
Note: Properties calculated based on nominal cross-sectional area; 1 mm = 0.0394 in.; 1 mm2 = 0.00155 in.2; 1 MPa = 0.145 ksi.
211ACI Structural Journal/July 2020
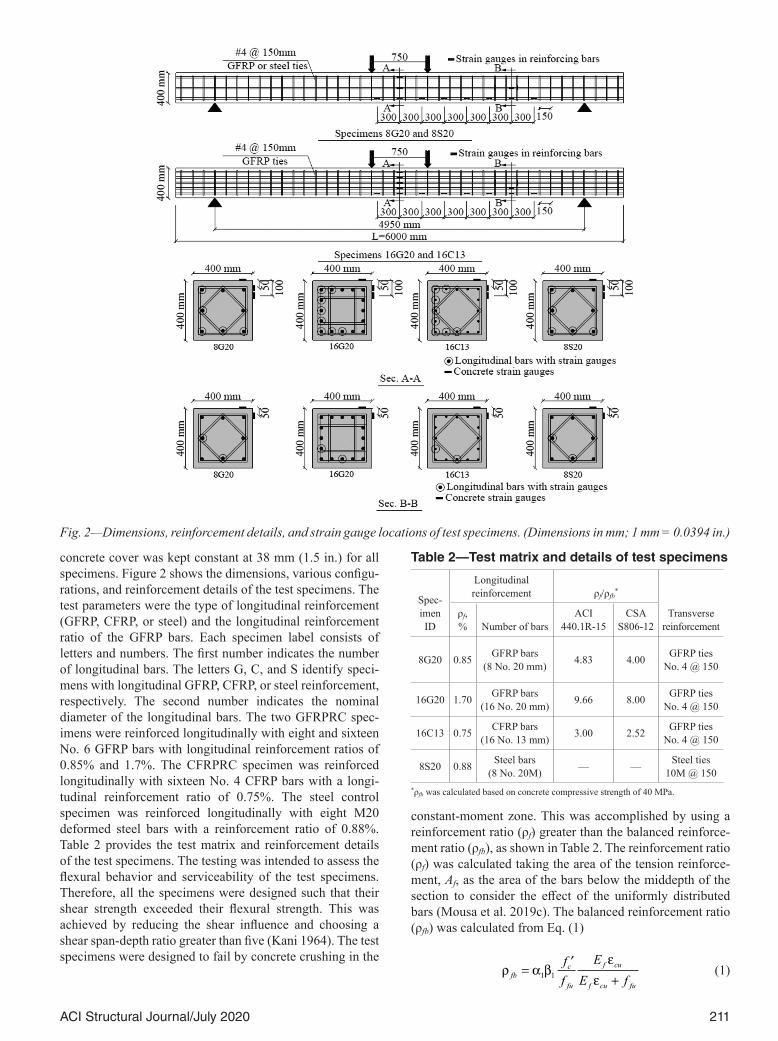
concrete cover was kept constant at 38 mm (1.5 in.) for all specimens. Figure 2 shows the dimensions, various configu-rations, and reinforcement details of the test specimens. The test parameters were the type of longitudinal reinforcement (GFRP, CFRP, or steel) and the longitudinal reinforcement ratio of the GFRP bars. Each specimen label consists of letters and numbers. The first number indicates the number of longitudinal bars. The letters G, C, and S identify speci-mens with longitudinal GFRP, CFRP, or steel reinforcement, respectively. The second number indicates the nominal diameter of the longitudinal bars. The two GFRPRC spec-imens were reinforced longitudinally with eight and sixteen No. 6 GFRP bars with longitudinal reinforcement ratios of 0.85% and 1.7%. The CFRPRC specimen was reinforced longitu dinally with sixteen No. 4 CFRP bars with a longi-tudinal reinforcement ratio of 0.75%. The steel control specimen was reinforced longitudinally with eight M20 deformed steel bars with a reinforcement ratio of 0.88%. Table 2 provides the test matrix and reinforcement details of the test specimens. The testing was intended to assess the flexural behavior and serviceability of the test specimens. Therefore, all the specimens were designed such that their shear strength exceeded their flexural strength. This was achieved by reducing the shear influence and choosing a shear span-depth ratio greater than five (Kani 1964). The test specimens were designed to fail by concrete crushing in the
constant-moment zone. This was accomplished by using a reinforcement ratio (ρf) greater than the balanced reinforce-ment ratio (ρfb), as shown in Table 2. The reinforcement ratio (ρf) was calculated taking the area of the tension reinforce-ment, Af, as the area of the bars below the middepth of the section to consider the effect of the uniformly distributed bars (Mousa et al. 2019c). The balanced reinforcement ratio (ρfb) was calculated from Eq. (1)
ρ α βε
εfbc
fu
f cu
f cu fu
ff
EE f
=′
+1 1 (1)
Fig. 2—Dimensions, reinforcement details, and strain gauge locations of test specimens. (Dimensions in mm; 1 mm = 0.0394 in.)
Table 2—Test matrix and details of test specimens
Spec-imen ID
Longitudinal reinforcement ρf/ρfb
*
Transverse reinforcement
ρf, % Number of bars
ACI 440.1R-15
CSA S806-12
8G20 0.85 GFRP bars (8 No. 20 mm) 4.83 4.00 GFRP ties
No. 4 @ 150
16G20 1.70 GFRP bars (16 No. 20 mm) 9.66 8.00 GFRP ties
No. 4 @ 150
16C13 0.75 CFRP bars (16 No. 13 mm) 3.00 2.52 GFRP ties
No. 4 @ 150
8S20 0.88 Steel bars (8 No. 20M) — — Steel ties
10M @ 150*ρfb was calculated based on concrete compressive strength of 40 MPa.

212 ACI Structural Journal/July 2020
where fcʹ is the specified compressive strength of the concrete; ffu and Ef are the ultimate tensile strength and modulus of elasticity of the FRP bars, respectively; and εcu is the maximum usable compressive strain in the concrete. The terms α1 and β1 are calculated from Eq. (2) and (3) for ACI 440.1R-15 and Eq. (4) and (5) for CSA S806-12
α1 = 0.85 (2)
β1 = 0.85 – [0.05(fcʹ – 28)/7] ≥ 0.65 (3)
α1 = 0.85 – 0.0015 fcʹ ≥ 0.67 (4)
β1 = 0.97 – 0.0025fcʹ ≥ 0.67 (5)
Table 2 provides the ratio of ρf to ρfb for the test specimens as per ACI 440.1R-15 and CSA S806-12.
Instrumentation and test setupStrains in the longitudinal reinforcing bars and spirals
were measured using electrical resistance strain gauges with a gauge length of 10 mm (0.39 in.) (refer to Fig. 2). In addition, six strain gauges with a gauge length of 60 mm (2.36 in.) were mounted on the concrete surface at midspan and at quarter-span to measure compressive strains, as shown in Fig. 2. Specimen deflection was measured with three linear potentiometers (LPOTs) placed at the midspan and at the quarter-span. The test setup was designed and fabricated at the University of Sherbrooke’s Canada Foun-dation for Innovation (CFI) structural laboratory. The spec-imens were loaded under four-point bending load, as shown in Fig. 3(a), using an 1000 kN (224.8 kip) servo-controlled, hydraulic actuator attached to a spreader beam. The load was applied at a displacement-controlled rate of 0.5 mm/min (0.02 in./min). An automatic data-acquisition system moni-tored by a computer was used to record the readings of the LPOTs, load cells, and strain gauges.
Test results and observationsThis section summarizes the experimental results,
including the general behavior of the test specimens in terms of cracking moment, flexural capacity, crack patterns, failure modes, strains in the reinforcement and concrete, neutral-axis depth, ductility, and deformability.
First cracking momentThe first vertical flexural crack initiated at the
constant-moment zone between the two loading points. The corresponding cracking moment was recorded during the test and verified with the moment-deflection relationship. The cracking moment, excluding specimen self-weight, ranged between 22.3 and 23.5 kN∙m (16.45 and 17.33 kip-ft) with an average of 22.8 kN∙m (16.82 kip-ft.). The cracking moments, Mcr, were predicted using Eq. (6)
Mcr = frIg/yt (6)
where fr is the modulus of rupture of concrete and is calcu-lated from Eq. (7a) in accordance with ACI 440.1R-15
and Eq. (7b) in accordance with CSA S806-12 for normal- density concrete.
fr = 0.62√fcʹ (7a)
fr = 0.6√fcʹ (7b)
Table 3 compares the experimental and predicted values of the cracking moments, Mcr. The controlling variable for predicting the cracking moment is the modulus of rupture of concrete fr, which varies according to the design codes and guidelines. As shown in Table 3, the cracking moment of the FRPRC specimens was generally 28% and 24% lower than those predicted with ACI 440.1R-15 and CSA S806-12, respectively. CSA S806-12 yielded slightly better predic-tions of cracking moments than ACI 440.1R-15 because of the former’s smaller modulus of rupture. Similar observa-tions were reported by El-Nemr et al. (2013) and Elgabbas et al. (2016) for the cracking moments of FRPRC beams where the predicted cracking moments were higher than the measured cracking moments.
Failure modes and crack propagationTable 3 summarizes the observed failure modes of the
tested specimens. As presented in Fig. 3(b), all of the FRPRC specimens, regardless of the FRP reinforcement, showed a similar pattern at failure characterized by concrete crushing on the compression face. ACI 440.1R-15 and CSA S806-12 recommend this mode of failure for any concrete member reinforced with FRP bars because it is more gradual, less brittle, and less catastrophic with higher deformability compared to the tensile rupture of FRP bars. On the other hand, Fig. 3(b) shows that 8S20 also failed in flexure due to steel yielding, followed by concrete crushing. The crack propagation in the tested specimens followed the traditional
Fig. 3—(a) Test setup; and (b) failure modes and crack prop-agation of test specimens.

213ACI Structural Journal/July 2020
flexural-cracking patterns seen in simply supported members, as shown in Fig. 3(b). The first crack in all the specimens was consistently a vertical flexural crack at the constant-moment zone between the two loading points, starting from the specimen’s bottom surface and extending vertically toward the compression zone. With the increase in loading, new cracks started to develop at the shear span. These cracks were affected by a combination of flexural and shear stresses, so the cracks tended to have some inclination toward the loading points. Because the FRPRC specimens had adequate shear reinforcement, the failure was typically initiated by flexural compression failure at midspan. The failure moment Mn was 246, 342, and 285 kN∙m (181.45, 252.26, and 210.22 kip-ft) for 8G20, 16G20, and 16C13, respectively. After concrete crushing, the confining restraint provided by ties and uniformly distributed bars was activated, and the specimens were again able to sustain additional loads. Then, loading continued and post-compressive and tensile strains in the GFRP and CFRP bars in the compression and tension sides, respectively, maintained strain compatibility and internal-force equilibrium, leaving the section strength intact. The post-failure behavior provided a pseudo- ductile failure and warning with the soft and gradual crushing of the compression block, formation of visible wide cracks, and excessive deformation. The peak moment Mpeak was 269, 470, and 353 kN∙m (198.41, 346.67, and 260.37 kip-ft) for 8G20, 16G20, and 16C13, respectively. The corresponding ratio between Mpeak and Mn for these specimens was 109%, 128%, and 124%. Similar behavior of FRPRC specimens has also been reported by Rashid et al. (2005) and Maranan et al. (2015). On the other hand, the early yielding of steel bars in 8S20 prior to concrete crushing resulted in wider cracks concentrated in the constant-moment zone. The failure (yielding of the extreme tension bars) and peak (concrete crushing) moments for 8S20 were 130 and 170 kN∙m (95.89 and 125.39 kip-ft), respectively. When the applied load was released, all the FRPRC specimens recovered most of their deflection during the unloading process, because the
FRP bars on the tension side did not reach rupture strain. In contrast, 8S20 retained deflection after unloading, as shown in Fig. 3(b).
Moment-deflection relationshipsFigure 4(a) presents the relationships between the bending
moment and the midspan deflection of the test specimens. The typical moment-deflection curves can be defined by three distinct stages (pre-cracking, post-cracking, and post-failure stages). At the pre-cracking stage, all the specimens exhibited similar linear moment-deflection relationships from initial loading up to the occurrence of the first flex-ural crack. The uncracked response for all the specimens showed insignificant deflection, reflecting gross section stiffness and the fact that the concrete provided the main resistance to flexural stresses. At the post-cracking stage, however, the flexural stiffness was considerably lower and dependent on the axial stiffness of the reinforcing bars,
Table 3—Experimental moments, mode of failure, curvature, and ductility and deformability of test specimens
Specimen ID
Mcr, kN∙m
Mn, kN∙m
Mpeak, kN∙m
Failure mode*
Curvature ψ, 1/d at
Mn
Ductility and deformability
Mexp./Mpred.
Mcr Mn
ACI 440.1R-15
CSA S806-12
ACI 440.1R-15 CSA S806-12
μe JConsider
comp. barsIgnore
comp. barsConsider
comp. barsIgnore
comp. bars
8G20 22.3 246 269 C.C. 0.015 1.90 7.00 0.71 0.74 1.15 1.17 1.05 1.07
16G20 23.0 342 470 C.C. 0.013 2.80 9.20 0.73 0.77 1.21 1.26 1.11 1.17
16C13 22.6 285 353 C.C. 0.012 2.20 10.40 0.72 0.76 1.00 1.06 0.92 0.97
8S20† 23.5 130 170 S.Y. 0.003 4.10 — 0.75 0.78 1.02 — 1.01 —
Average‡ 0.72 0.76 1.12 1.16 1.02 1.07
COV, %‡ 1.55 1.54 9.60 8.90 9.50 9.10*C.C. is concrete crushing; S.Y. is steel yielding.†Values calculated at Mn = My, and Mpeak is maximum moment at concrete crushing.‡Specimen 8S20 was excluded from calculation of average and COV, and was calculated according to requirements of ACI 318-19 and CSA A23.3-14.
Note: 1 kN.m = 0.7376 kip.ft.
Fig. 4—(a) Moment-deflection relationship; (b) moment crack-width relationship; (c) moment bar-tension and compression-strain relationship at midspan; and (d) moment tie-strain relationship at shear span. (Note: 1 mm = 0.0394 in; 1 kN∙m = 0.7376 kip.ft.)

214 ACI Structural Journal/July 2020
which is a function of the area A and modulus of elasticity E of the longitudinal reinforcement. This change in stiffness represents the transition from gross- to effective-section properties. At this stage, the FRPRC specimens behaved nearly linearly with reduced stiffness up to failure. This is attributed to the linear elastic characteristics of the FRP reinforcement. In contrast, the moment-deflection curve of the steel-reinforced specimen was initially linear and then became nonlinear, showing a typical yielding plateau after yielding. At the post-failure stage, the FRPRC specimens continued to carry additional loads due to the confining restraint provided by ties and uniformly distributed bars. The FRPRC specimens evidenced longer post-failure ascending branches than the steel-reinforced specimen. This is mainly due to the fact that, after yielding, the steel bars had a very low tangent modulus and did not contribute to the flexural strength, compared to the GFRP and CFRP bars, which maintained their modulus of elasticity throughout the entire duration of loading.
Moment-crack width relationshipFigure 4(b) shows the variation in the measured crack
width against the applied moment in the test specimens. The figure shows that the crack width varied linearly with the applied moment up to failure in the specimens reinforced with FRP bars. This is attributed to the linear elastic behavior of the FRP reinforcement. That of the control specimen (8S20), however, varied linearly until the steel reinforcement yielded. Figure 4(b) reveals that increasing the axial stiff-ness of the longitudinal reinforcement considerably reduced crack widths in the FRP specimens—regardless of reinforce-ment type—when compared at the same load level. Table 4 provides the values of experimental service moment Ms.
In this study, two reference points were employed to define the bending-moment capacity at service condition Ms. The first defines the service moment as the moment that corre-sponds to a tensile strain of 2000 με in the reinforcement, which was originally suggested by ISIS Canada in 2001 for GFRP reinforcement (ISIS Canada Research Network 2001). The second was calculated at 30% of the nominal capacity 0.3Mn of the tested specimens, as suggested by Bischoff et al. (2009). Table 4 shows the experimental results of the crack width at 2000 με and 0.3Mn. The crack width of the FRPRC specimens ranged from 0.37 to 0.47 mm (0.015 to 0.019 in.) at 2000 με, with an average value 0.41 mm (0.016 in.), while the corresponding crack width ranged from 0.52 to 0.82 mm (0.02 to 0.032 in.) at 0.3Mn with an average
value of 0.62 mm (0.024 in.). Therefore, the reference point at a tensile-strain level of 2000 με might be more reasonable in defining the experimental service moment for cracking behavior. El-Nemr et al. (2016) made similar observations in their investigation of the cracking behavior of rectangular concrete beams reinforced with GFRP and CFRP bars.
Strains in longitudinal and transverse reinforcement
Figures 4(c) and (d), respectively, show the moment-strain behavior in the longitudinal bars and transverse ties. As shown in Fig. 4(c), the tensile-strain gauge read-ings for the GFRP, CFRP, and steel reinforcing bars were minimal before the initiation of the first flexural crack. After cracking occurred, a significant increase in tensile strains was observed in all four specimens. The GFRP specimens showed progressively increasing strain up to concrete crushing (failure moment) with tensile-strain values of 12,000 and 8950 με (48% and 36% of the ultimate tensile strain in the GFRP bars) for 8G20 and 16G20, respectively. After concrete crushing, the moment values dropped, and the strain gauges continued to read more values up to peak moment. The maximum recorded tensile strains in the GFRP bars were 15,480 and 16,000 με (62% and 64% of the ulti-mate tensile strain in the GFRP bars) for 8G20 and 16G20, respectively. Similarly, 16C13 exhibited progressively increasing strain up to concrete crushing with a tensile-strain value of 8400 με (62% of the ultimate tensile strain in the CFRP bars). The maximum recorded tensile strain at peak was 9400 με (70% of the ultimate tensile strain in the CFRP bars). In contrast, 8S20 yielded (a corresponding strain of approximately 2300 με) at an applied moment of 130 kN∙m (95.9 kip-ft) (approximately 76% of the speci-men’s maximum moment). The steel reinforcement then exhibited a yielding plateau, followed by a rapid increase in the strain values up to failure, reaching a maximum strain of 16,200 με. The recorded compressive strains for the GFRP, CFRP, and steel reinforcing bars were low compared to the tensile strains at the same moment up to failure, as shown in Fig. 4(c). The values of compressive strains just before failure either due to concrete crushing or steel yielding were –60, –910, –1400, and –340 με for 8G20, 16G20, 16C13, and 8S20, respectively. The maximum measured compressive strains before the damage to the strain gauges were –8225, –10,750, –6150, and –1280 με for 8G20, 16G20, 16C13, and 8S20, respectively. In the case of transverse reinforcement, the maximum measured tie strains in the shear span at failure
Table 4—Experimental-to-predicted crack width (wexp./wpred.) at service moment
Specimen ID
Service moment Ms, kN∙m Crack width w, mm wexp./wpred.
2000 με 0.30Mn 2000 με 0.30Mn
ACI 440.1R-15 (kb = 1.4) [ACI 440-H (kb = 1.2)] CSA S6-14 (kb = 0.8)
at 2000με 0.30Mn at 2000 με 0.30Mn
8G20 41.3 73.8 0.47 0.82 0.72 (0.85) 0.71 (0.83) 1.31 1.28
16G20 75.8 102.6 0.38 0.53 0.79 (0.92) 0.83 (0.97) 1.37 1.44
16C13 65.7 85.5 0.37 0.52 0.76 (0.89) 0.94 (1.09) 1.41 1.73
Average 0.76 (0.89) 0.83 (0.96) 1.36 1.48
COV, % 4.5 (4.5) 13.7 (13.7) 4.0 15.6
Note: 1 kN.m = 0.7376 kip.ft; 1 mm = 0.0394 in.
215ACI Structural Journal/July 2020
were 1160, 800, 1800, and 370 με for 8G20, 16G20, 16C13, and 8S20, respectively (refer to Fig. 4(d)). These values, respectively, are 5%, 3.6%, and 8% of the ultimate strain of the GFRP ties and 16% of the steel yield strain.
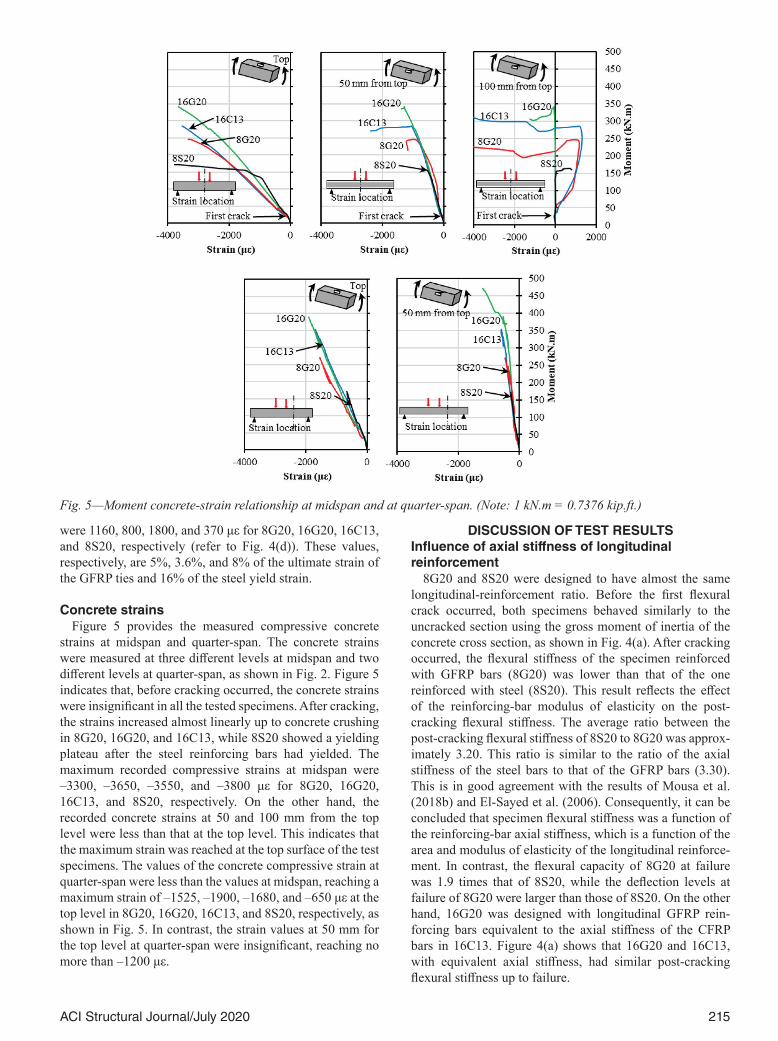
Concrete strainsFigure 5 provides the measured compressive concrete
strains at midspan and quarter-span. The concrete strains were measured at three different levels at midspan and two different levels at quarter-span, as shown in Fig. 2. Figure 5 indicates that, before cracking occurred, the concrete strains were insignificant in all the tested specimens. After cracking, the strains increased almost linearly up to concrete crushing in 8G20, 16G20, and 16C13, while 8S20 showed a yielding plateau after the steel reinforcing bars had yielded. The maximum recorded compressive strains at midspan were –3300, –3650, –3550, and –3800 με for 8G20, 16G20, 16C13, and 8S20, respectively. On the other hand, the recorded concrete strains at 50 and 100 mm from the top level were less than that at the top level. This indicates that the maximum strain was reached at the top surface of the test specimens. The values of the concrete compressive strain at quarter-span were less than the values at midspan, reaching a maximum strain of –1525, –1900, –1680, and –650 με at the top level in 8G20, 16G20, 16C13, and 8S20, respectively, as shown in Fig. 5. In contrast, the strain values at 50 mm for the top level at quarter-span were insignificant, reaching no more than –1200 με.
DISCUSSION OF TEST RESULTSInfluence of axial stiffness of longitudinal reinforcement
8G20 and 8S20 were designed to have almost the same longitudinal-reinforcement ratio. Before the first flexural crack occurred, both specimens behaved similarly to the uncracked section using the gross moment of inertia of the concrete cross section, as shown in Fig. 4(a). After cracking occurred, the flexural stiffness of the specimen reinforced with GFRP bars (8G20) was lower than that of the one reinforced with steel (8S20). This result reflects the effect of the reinforcing-bar modulus of elasticity on the post-cracking flexural stiffness. The average ratio between the post-cracking flexural stiffness of 8S20 to 8G20 was approx-imately 3.20. This ratio is similar to the ratio of the axial stiffness of the steel bars to that of the GFRP bars (3.30). This is in good agreement with the results of Mousa et al. (2018b) and El-Sayed et al. (2006). Consequently, it can be concluded that specimen flexural stiffness was a function of the reinforcing-bar axial stiffness, which is a function of the area and modulus of elasticity of the longitudinal reinforce-ment. In contrast, the flexural capacity of 8G20 at failure was 1.9 times that of 8S20, while the deflection levels at failure of 8G20 were larger than those of 8S20. On the other hand, 16G20 was designed with longitudinal GFRP rein-forcing bars equivalent to the axial stiffness of the CFRP bars in 16C13. Figure 4(a) shows that 16G20 and 16C13, with equivalent axial stiffness, had similar post-cracking flexural stiffness up to failure.
Fig. 5—Moment concrete-strain relationship at midspan and at quarter-span. (Note: 1 kN.m = 0.7376 kip.ft.)

216 ACI Structural Journal/July 2020
Influence of longitudinal-reinforcement ratioIncreasing the amount of the longitudinal reinforce-
ment enhanced the performance of the GFRP specimens. Figure 4(a) shows an increase in flexural capacity and reduction in deflection for an increase in longitudinal rein-forcement. In addition, the flexural stiffness significantly increased with a higher reinforcement ratio. Increasing the reinforcement ratio from 0.85% to 1.7% in the GFRP spec-imens (8G20 and 16G20) increased the flexural capacity by 39% (from 246 to 342 kN∙m [181.45 to 252.26 kip-ft]). Similar behavior was reported by Kassem et al. (2011) for CFRPRC beams reinforced with two types of CFRP bars. The ultimate capacity increased by 26% and 31% as a result of increasing the CFRP reinforcement ratio by 100% for two types of CFRP bars. Moreover, El-Nemr et al. (2013) concluded that increasing the reinforcement ratio three to four times resulted in an average increase of 83.5% in the load-carrying capacity of GFRPRC beams. On the other hand, the flexural stiffness of 16G20 (reinforcement ratio = 1.7%) after initial cracking increased by 95% compared to 8G20 (reinforcement ratio = 0.85%).
Ductility and deformabilityDuctility is a structural design requirement in most
design codes. The traditional definition of ductility for steel-reinforced concrete members, which considers the yielding of steel bars as a reference point, cannot be directly applied to members reinforced with FRP reinforcement due to the linear elastic behavior of FRP bars up to failure. The literature contains two approaches to defining the ductility of FRPRC members. The first approach is based on absorbed energy (Naaman and Jeong 1995); the second on the deformation concept (CAN/CSA S6-14; Jaeger et al. 1997).
Energy-based ductility index—Naaman and Jeong (1995) defined ductility as the ratio of the total energy to the elastic energy and proposed the following equation to compute the ductility index μe, which can be applied to steel- and FRP-reinforced concrete members
µetot
el
EE
= +
1
21 (8)
where Etot is the total energy computed as the area under the load-deflection curve; and Eel is the elastic energy released upon failure computed as the area of the triangle formed at failure load by the line having the weighted average slope of the two initial straight lines of the load-deflection curve. Table 3 lists the computed μe for the FRP and steel speci-mens. The computed μe increased by 47.4% when the rein-forcement ratio was increased 100% in the specimens rein-forced with GFRP bars. Specimen 8S20, however, exhibited a higher ductility index compared to the specimens rein-forced with GFRP and CFRP bars.
Deformability factor—The Canadian Highway Bridge Design Code (CAN/CSA S6-14) adopted the Jaeger et al. 1997 (J-factor) approach to evaluate the deformability index of FRPRC members. In this approach, the absorbed energy is measured based on deformability rather than ductility to ensure adequate deformation of FRP-reinforced structures
before failure. The deformability J-factor takes into account the strength effect as well as the curvature effect at service and ultimate conditions. The deformability J-factor can be calculated, as follows
JMMultimate
c
ultimate
c
= ×ψ
ψ (9)
where ψc is curvature at a concrete strain equal to 0.001 (service condition); ψultimate is the curvature at ultimate; Mc is the moment at a concrete strain equal to 0.001; and Multimate is the ultimate moment (Mn was considered in the calculation). For this study, the curvature at the ultimate limit states was calculated with the maximum actual experimental concrete strain, rather than a theoretical value. Similarly, the ultimate moment is given as the failure moment recorded during the test. Table 3 shows that all the test specimens demonstrated adequate deformability when compared to the CSA-S6-14 (2014) code limit of 4. The J-factor of the test specimens ranged between 7.0 and 10.4. The higher the J-factor values, the more ample warning given by the FRPRC specimen before failure. In other words, the J-factor indicates the amount of cracks and deflection that the FRP-reinforced concrete member will exhibit through load history from service to ultimate conditions.
ANALYTICAL INVESTIGATIONStrain compatibility and force equilibrium analysis
A detailed sectional analysis was conducted based on strain compatibility and force equilibrium to predict the nominal bending moments of the tested specimens. In one scenario, neglecting the contribution of the FRP longitu-dinal bars in the compressive block to the moment-carrying capacity was assumed to be equivalent to the concrete and, in the second, the FRP longitudinal bars in the compressive block was considered, assuming that the FRP tensile and the compressive Young’s modulus were equal (Deitz at al. 2003). In all the analyses, the concrete density factor, material resis-tance factor, and member safety factor were taken as equal to unity. In accordance with ACI 440.1R-15 and CSA S806-12, the following assumptions were considered: 1) strain in the concrete and the FRP reinforcement is proportional to the distance from the neutral axis (a plane section remains plane after deformation up to failure); 2) the maximum usable compressive strain in the concrete is assumed to be 0.003 and 0.0035 according to ACI 440.1R-15 and CSA S806-12, respectively; 3) the tensile strength of concrete is ignored; 4) the stress-strain curve of the FRP reinforcement is linearly elastic until failure; 5) the strain in the FRP reinforcement, whether in tension or compression, is the same as that in the surrounding concrete (that is, perfect bond exists between the FRP reinforcement and concrete); 6) the distribution of concrete compressive stress can be described by the equiv-alent rectangular stress block shown in Fig. 6 with param-eters α1 and β1 as presented in Eq. (2) and (3), satisfying the requirements of ACI 440.1R-15, and in Eq. (4) and (5), satisfying the requirements of CSA S806-12.
To obtain the nominal moment capacity of the test spec-imens, the procedure can be summarized in the following steps, in relation to Fig. 6:

217ACI Structural Journal/July 2020
1. Specify the section dimensions, material properties, and locations and areas of FRP bars.
2. Assume a value for the neutral-axis depth c.3. Calculate the compression force in concrete Fc with
Eq. (10)
Fc = α1β1fcʹbc (10)
where fcʹ is the concrete cylinder strength; and b is the cross section width.
4. For each layer of reinforcement, compute the strain in the tension and compression reinforcement, εfi, according to the meaning of strain compatibility with reference to ultimate concrete strain in the case of compression failure, and with reference of ultimate FRP strain in the case of tension failure.
5. Calculate the tensile and compressive forces in FRP bars with Eq. (11) and (12)
F E Atb fi f fii
nt= ∑
=ε
1 (11)
F E Acb fi f fii
nc= ∑
=ε
1 (12)
where Ftb is the tensile force in FRP bars; Fcb is the compres-sive force in FRP bars; and Ef and Afi are the modulus of elas-ticity and area for the row of FRP bars at level i, respectively.
6. Check for equilibrium considering or ignoring the contri-bution of the FRP bars in compression by satisfying the condi-tion that the absolute value of the sum of the total tensile and compressive forces is less than a certain allowable tolerance.
7. If equilibrium is not satisfied, revise the estimate of c and repeat from step 2 until equilibrium is achieved.
8. Once equilibrium is satisfied, the nominal moment capacity Mn can be calculated with Eq. (13) or (14) by taking the moment of the forces around the centroid of the cross section.
Case 1: Ignoring the contribution of the FRP bars in compression
M Fh c
E A yn c fi f fii
n
ti
t
=−
+ ∑=
βε1
12 (13)
Case 2: Considering the contribution of the FRP bars in compression
M Fh c
E A y E A yn c fi f fii
n
ci fi f fii
n
ti
c t
=−
+ ∑ + ∑= =
βε ε1
1 12 (14)
where yti is the distance between the center of i-th FRP bars on the tension side and the centroid of the concrete cross section; and yci is the distance between the center of i-th FRP bars on the compression side and the centroid of the concrete cross section.
Table 3 presents the experimental-to-predicted ratios for the flexural capacities of the test specimens. The level of conservatism and degree of accuracy depend on the assump-tions of considering and ignoring the contribution of the FRP bars in compression. By considering the FRP bars in compression, the average Mexp./Mpred. considering the ACI 440.1R-15 assumptions at the failure moment was 1.12 with a coefficient of variation (COV) of 9.6%, and was 1.02 with a COV of 9.5% considering the CSA S806-12 assumptions. Neglecting the bar contribution in compression increased the level of conservatism of the predicted results. The average Mexp./Mpred. considering the ACI 440.1R-15 assumptions was 1.16 with a COV of 8.9%, and was 1.07 with a COV of 9.1% considering the CSA S806-12 assumptions.
Theoretical crack-width predictionThe codes and design guidelines have two design method-
ologies for controlling flexural cracking: 1) a direct proce-dure in which crack widths are calculated; and 2) an indirect procedure in which maximum bar-spacing limits are speci-fied. Steel-based crack models have been modified to account for FRP-bar properties using the kb factor (ACI 440.1R-15). The kb term is a coefficient that accounts for the degree of bond between FRP bars and the surrounding concrete.
ACI 440.1R-15 recommends an indirect procedure that controls flexural-crack widths with a maximum reinforc-ing-bar spacing based on the approach proposed by Ospina and Bakis (2007), as follows
sE wf k
cE wf k
f
fs bc
f
fs bmax = − ≤1 15 2 5 0 92. . . (15)
where smax is the maximum permissible center-to-center bar spacing for flexural-crack control (mm); w is the maximum allowable crack width (mm); ffs is the stress level induced in FRP at service loads (MPa); Ef is the design or guaranteed
Fig. 6—Idealized cross section and stress and strain distributions in analytical model.

218 ACI Structural Journal/July 2020
modulus of elasticity of FRP reinforcement, defined as the mean modulus of a sample of test specimens (MPa); cc is the clear cover (mm); and kb is the bond-dependent coeffi-cient. When kb is not known from the experimental data, a conservative value of 1.4 should be assumed (smooth bars and grids are specifically excluded from this recommenda-tion). A similar equation is currently being considered by ACI Subcommittee 440-H (ACI 440, under preparation) for a future design standard by replacing the crack width w in Eq. (15) with 0.7 mm, as follows
sE
f kc
Ef k
Ef k
f
fs bc
f
fs b
f
fs b
max =×
− ≤×
=×
−
1 150 7
2 5 0 920 7
0 8052
..
. ..
...
.5
0 644c
Ef kc
f
fs b
≤×
(16)
where kb is 1.2 for bars that include sand coating (with or without other surface treatments) and 1.4 for bars without sand coating.
The Canadian Highway Bridge Design Code (CAN/CSA S6-14) states that if the maximum strain of FRP bars in the tension zone under full-service loads exceeds 0.0015, cross sections of the maximum positive and negative moment regions shall be proportioned in such a way that the crack width does not exceed 0.5 mm for members subjected to aggressive environments and 0.7 mm for other members, with the crack width calculated based on the physical model proposed by Frosch (1999), as follows
wfEhhk d sf
fb cmax = +
22
2
1
2
2
(17)
where wmax is the maximum allowable crack width at the tension face (mm); ff is the stress level induced in FRP at service loads (MPa); s is the bar center-to-center spacing (mm); Ef is the modulus of elasticity of GFRP reinforce-ment (MPa); h1 is the distance from neutral axis to the center of tensile reinforcement (mm); h2 is the distance from the neutral axis to the extreme tension fiber (mm); and kb is the coefficient that accounts for the degree of bond between FRP bars and surrounding concrete. The value of kb shall be determined experimentally, but in the absence of data, values of 0.8 for sand-coated and 1.0 for deformed FRP bars shall be used. In addition, the clear cover shall not be greater than 50 mm in calculating dc.
Table 4 provides the mean values and the COV for the ratios of the measured to predicted maximum crack widths (wexp./wpred.) at service condition. ACI 440.1R-15 yielded good yet conservative predictions of the maximum crack width. The wexp./wpred. ranged between 0.72 and 0.79 at 2000 με with an average of 0.76 and a corresponding COV of 4.5% and ranged between 0.71 and 0.94 at 0.30Mn with an average of 0.83 and a corresponding COV of 13.7%. It should be noted that Eq. (15) was rearranged to calculate the maximum crack width, as the corresponding bar spacing was predefined for the test specimens. The ACI 440.1R-15 equation accounts for the effect of varying reinforcement ratios by including the stress in the reinforcing bar ffs and
the spacing between the longitudinal bars. Therefore, the prediction equation reflects the effect of varying the rein-forcement ratio and bar spacing on the maximum crack width. The conservative kb value of 1.4, as recommended in ACI 440.1R-15, resulted in conservative predictions of the crack widths. Using a kb value of 1.2, which is currently being considered for ACI Subcommittee 440-H (ACI 440, under preparation) for sand-coated bars, provided much better predictions than ACI 440.1R-15, on average, with a wexp./wpred. of 0.89 with a COV of 4.5% and 0.96 with a COV of 13.7% at 2000 με and at 0.30Mn, respectively.
The CSA S6-14 predictions underestimated the maximum crack width. The wexp./wpred. ranged between 1.31 and 1.41 at 2000 με with an average of 1.36 and a corresponding COV of 4% and ranged between 1.28 and 1.73 at 0.30Mn with an average of 1.48 and a corresponding COV of 15.6%. Similar to the ACI 440.1R-15 equation, the CSA S6-14 equation accounts for the effect of varying reinforcement ratios by including the reinforcing-bar stress (ff) and the spacing between the longitudinal bars, in addition to h2/h1 that accounts for the strain gradient. The recommended value of kb (0.8) in CSA S6-14 compared to those recommended in ACI 440.1R-15 (1.4) contributed to underestimating the crack widths.
Theoretical effective moment of inertia and deflection prediction
The maximum midspan flexural deflection δmax for a simply supported member with a span of L subjected to two equal concentrated loads of P/2 magnitude symmetrically placed at a distance a from the support is given as follows
δmax = −( )PaE I
L ac e48
3 42 2 (18)
where Ec is the modulus of elasticity of the concrete, taken as Ec = 4700√fcʹ (MPa) (ACI 318-19); and Ie is the effec-tive moment of inertia of the cross section. The effective moment of inertia Ie provides a transition between the upper and lower bounds of the gross moment of inertia Ig and the cracked moment of inertia Icr as a function of the ratio of applied moment to cracking moment (Ma/Mcr).
Several authors have proposed effective moment of inertia expressions for FRPRC members. Benmokrane et al. (1996) first incorporated empirical correction factors (α and β) in Branson’s equation through a comprehensive experimental program on GFRP-reinforced beams, which was needed to reduce tension stiffening and gave reasonable estimates of computed deflection, as follows
I M MI
M M I Ie cr ag
cr a cr g= ( ) + − ( )
≤3 3
1β
α (19)
where α and β are 0.84 and 7, respectively.On the basis of a study conducted by Mota et al. (2006),
ISIS Canada No. 3 (2007) proposed an equation to calculate the effective moment of inertia Ie as follows
II I
I M M I Ie
t cr
cr cr a t cr
=+ − ( )( ) −( )1 0 5
2
.
(20)

219ACI Structural Journal/July 2020
in which It and Icr are the moment of inertia of a non-cracked section transformed to concrete and the cracked moment of inertia, respectively.
Bischoff (2005, 2007) proposed a new expression for the effective moment of inertia Ie based on the fundamental concepts of tension stiffening, as follows
II
I I M Me
cr
cr g cr a
=− − ( )( )( )1 1
2 (21)
Bischoff and Gross (2011a,b) proposed an equation to calcu-late Ie (Eq. (22)), which includes an additional factor γ to account for the change in stiffness along the length of beams and dependent on the boundary conditions and loading type.
II
I I M Me
cr
cr g cr a
=− − ( )( )( )1 1
2γ (22)
For a four-point bending load, which is the load arrangement used in this study, Bischoff and Gross (2011a) suggested the following expression based on the integration of curvature along the span to calculate γ.
γ =( ) − ( ) − ( )
( ) − ( )3 4 4 3
3 4
3
3
a L M M a L
a L a Lcr a (23)
ACI 440.1R-15 recommends calculating Ie based on the equation proposed by Bischoff and Gross (2011a) (Eq. (22)).
Ovitigala et al. (2017), in response to Bischoff’s discus-sion, proposed a new equation that was very consistent with the experimental Ie of their tested beams, as follows
II M M
M M C M M CIe
cr cr a
cr a cr ag=
( )( ) − ( ) +
≤5
5
1 2
(24)
where
Ca L a La L a L
I Icr g1
3
3
3 12
3 4
1=( ) + ( )( ) − ( )
− ( )( )
and
Ca L
a L a LI Icr g2
3
3
16
3 4
1=( )
( ) − ( )− ( )( ) .
CSA S806 (2012), based on Razaqpur et al. (2000), recommends the integration of curvature along the span to determine deflections. The CSA S806-12 (2012) approach is based on an assumption that the moment-curvature rela-tionship of a cracked FRPRC member remains linear under increasing load, which ignores the tension stiffening effect. A simple equation derived by Razaqpur et al. (2000) for calcu-lating the deflection of simply supported four-point bending of FRPRC members was provided, as follows:
δmax =
−
− −
PLE I
aL
aL
II
LLc cr
cr
g
g3 3
483 4 8 1
3
(25)
where Lg is the distance from support to point where Ma = Mcr.
The effective-to-gross moment of inertia Ie/Ig was plotted for each FRPRC specimen versus the applied-to-cracking moment ratio Ma/Mcr, as shown in Fig. 7. The analysis was carried out to investigate the effectiveness of the analytical models in predicting the deflection. Ie models according to Benmokrane et al. (1996), Bischoff (2005, 2007), ACI Committee 440 (2015), ISIS Canada Research Network (2007), and Ovitigala et al. (2017) were plotted and compared to the experimental results. The experimental and models results in this study were assessed at service load. For this purpose, service load is defined as the load corresponding to 30% of the nominal capacity, 0.3Mn, as suggested by Bischoff et al. (2009). As shown in Fig. 7, the ACI 440.1R-15 model overestimates the Ie and thus underestimates the service deflections with an average ratio of the measured-to-predicted deflections (δexp./δpred.) of 1.33 and a corresponding COV of 6.4%. The Bischoff (2005, 2007) model yielded better predic-
Fig. 7—Effective-to-gross moment of inertia Ie/ Ig versus Ma/Mcr for FRP-reinforced specimens.

220 ACI Structural Journal/July 2020
tions than the ACI 440.1R-15 model, with an average ratio δexp./δpred. of 1.13 and a corresponding COV of 2.7%. The Benmokrane et al. (1996) model, in contrast, provided conser-vative predictions at service load, with an average ratio δexp./δpred. of 0.81 with a COV of 3.7%. The ISIS Canada Research Network (2007) and Ovitigala et al. (2017) models, however, provided accurate predictions at service load, with an average ratio δexp./δpred. of 1.02 with a COV of 0.9% and 0.99 with a COV of 0.8%, respectively. On the other hand, CSA S806-12 provided good yet conservative predictions, with an average ratio δexp./δpred. of 0.98 with COV of 0.9%.
Parametric investigation on effect of uniformly distributed bars
A parametric investigation was carried out to study the effect of uniformly distributed bars on the flexural strength and serviceability of square FRPRC members. In this investiga-tion, simply supported members, measuring 400 mm in width,
400 mm in depth, and 6000 mm in length, and loaded with two equal concentrated loads at a distance of 2100 mm from supports, were considered. The studied members were divided into six groups with different reinforcement ratios and layouts, as detailed in Fig. 8(a). Number 6 GFRP and No. 4 CFRP bars were used as longitudinal reinforcement. The chosen tensile strength and modulus of elasticity were 1500 MPa and 60 GPa for the GFRP bars, and 1800 MPa and 140 GPa for the CFRP bars; the chosen concrete strength was 40 MPa.
All the predictions were performed in accordance with the requirements of ACI 440.1R-15. One scenario, ignoring the contribution of FRP bars in compression, was consid-ered in this investigation. Figure 8(b) provides a comparison between the members reinforced with uniformly distributed bars, as well as those with bars as top and bottom rein-forcement, in terms of flexural strength, crack width, and deflection. It is quite clear that the existence of side bars in the members with uniformly distributed bars significantly
Fig. 8—Parametric investigation. (Note: 1 mm = 0.0394 in.; 1 kN∙m = 0.7376 kip.ft.)

221ACI Structural Journal/July 2020
enhanced the serviceability performance in terms of crack width with an average ratio of 0.8 and a corresponding COV of 4.7% and deflection with an average ratio of 0.86 and a corresponding COV of 1.8%. On the other hand, the contribution of these side bars to the flexural strength was minimal with an average ratio of 1.01 and a corresponding COV of 1.2%.
CONCLUSIONSThis paper reports on an experimental and analytical inves-
tigation of the flexural strength and serviceability perfor-mance of square FRPRC members with a/d values greater than five and internally reinforced with uniformly distributed glass-FRP (GFRP) and carbon-FRP (CFRP) bars. Based on the experimental results and the analytical study presented in this paper, the following conclusions can be drawn:
1. The failure of the FRPRC specimens occurred as gradual concrete crushing, while the steel-reinforced spec-imen failed due to steel yielding, followed by concrete crushing. Interestingly, the FRP-reinforced specimens did not lose their load-carrying capacity after concrete crushing. Instead, they continued to sustain additional loads. This behavior can be attributed to the confinement effect provided by the longitudinal FRP bars and GFRP ties that enhanced specimen deformability and strength.
2. The flexural strength at concrete crushing of the GFRP-reinforced specimen was almost 1.9 times greater than that of its steel-reinforced counterpart with a similar reinforcement ratio.
3. The reinforcement ratio significantly affected the behavior of the GFRPRC specimens. As the reinforce-ment ratio increased, both the flexural stiffness and capacity increased.
4. The experimental evidence of this study indicates that using GFRP ties as transverse reinforcement effectively prevented the buckling of the FRP bars and confined the concrete core in the post-peak stages up to a high strain level.
5. Based on the data presented in this study, the reference point at a tensile strain of 2000 με in the reinforcement might be more reasonable than 0.3Mn in defining the experimental service moment for cracking behavior.
6. Although all the FRP-reinforced specimens failed due to compressive failure, a high degree of deformability was attained before failure. In all cases, the calculated deformability factor was higher than 4, as recommended by CSA S6-14.
7. Considering the compression contribution of the FRP bars in the strain-compatibility and force-equilibrium analyses provided accurate predictions of the flexural-moment capacities, while neglecting this contribution added to the level of conservativeness.
8. Comparing the crack widths predicted according to ACI 440.1R-15 and CSA S6-14 to the experimental results revealed that the ACI 440.1R-15 predictions were generally conservative with respect to the experimental crack width values. On the other hand, the CSA S6-14 predictions were nonconservative compared to the experimental crack-width values for this type of sand-coated FRP bars. Further inves-tigations on the bond coefficient kb of 0.8 recommended by CSA S6-14 for sand-coated FRP bars are required.
9. The ACI 440.1R-15 model overestimated the Ie and thus underestimated the service deflections of the FRP-reinforced specimens with an average ratio δexp./δpred. of 1.33 and a corresponding COV of 6.4%. On the other hand, CSA S806-12 provided good yet conservative predictions, with an average ratio δexp./δpred. of 0.98 with COV of 0.9%.
10. The side bars in the FRP-reinforced members, with uniformly distributed bars, significantly enhanced the serviceability performance in terms of crack width and deflection. On the other hand, the contribution of these side bars to flexural strength was minimal.
AUTHOR BIOSACI member Salaheldin Mousa is a MITACS Postdoctoral Fellow in the Department of Civil Engineering at the University of Sherbrooke, Sher-brooke, QC, Canada, where he also received his PhD. He received his BSc and MSc from and is a Lecturer at the Faculty of Engineering at Shoubra, Benha University, Cairo, Egypt. His research interests include the use of fiber-reinforced polymers (FRPs) in reinforced concrete structures.
Hamdy M. Mohamed is a Research Associate-Lecturer in the Department of Civil Engineering at the University of Sherbrooke, Sherbrooke, QC, Canada. He received his BSc and MSc from the Faculty of Engineering, Helwan University, Cairo, Egypt, and his PhD from the University of Sher-brooke. His research interests include the use and field applications of fiber-reinforced polymers (FRPs) in reinforced concrete structures.
Brahim Benmokrane, FACI, is Professor of civil engineering and NSERC Research Chair in FRP Reinforcement for Concrete Infrastructure and Tier-1 Canada Research Chair in Advanced Composite Materials for Civil Structures in the Department of Civil Engineering at the University of Sher-brooke, Sherbrooke, QC, Canada. He is a member of ACI Committee 440, Fiber-Reinforced Polymer Reinforcement. His research interests include development of FRP reinforcements for concrete structures and their dura-bility, structural performance, and field applications.
Antonio Nanni, FACI, is the Inaugural Senior Scholar, Professor, and Chair of the Department of Civil, Architectural, and Environmental Engineering at the University of Miami, Coral Gables, FL, and Professor of structural engineering at the University of Naples-Federico II, Naples, Italy. He was the founding Chair and is a member of ACI Committee 440, Fiber-Rein-forced Polymer Reinforcement, and is Chair of ACI Committee 549, Thin Reinforced Cementitious Products and Ferrocement, and ACI Subcommittee 318-L, International Liaison. His research interests include construction materials and their structural performance and field applications.
ACKNOWLEDGMENTSThe authors would like to express their special thanks and gratitude to the
Natural Science and Engineering Research Council of Canada (NSERC), Canada Research Chair Program, the Fonds de la recherche du Quebec–Nature et Technologie – (FRQ-NT), and the University of Sherbrooke Research Centre on FRP Composite Materials for Structures (CRUSMaC) for their financial support, and Pultrall Inc. (Thetford Mines, QC, Canada) for the donation of the GFRP and CFRP reinforcement. The authors thank the tech-nical staff of the Canada Foundation for Innovation (CFI) structural labora-tory in the Department of Civil Engineering at the University of Sherbrooke.
REFERENCESAdam, M. A.; Said, M.; Mahmoud, A. A.; and Shanour, A. S., 2015, “Analyt-
ical and Experimental Flexural Behavior of Concrete Beams Reinforced with Glass Fiber Reinforced Polymers Bars,” Construction and Building Materials, V. 84, pp. 354-366. doi: 10.1016/j.conbuildmat.2015.03.057
ACI Committee 318, 2019, “Building Code Requirements for Struc-tural Concrete (ACI 318-19) and Commentary (ACI 318R-19),” American Concrete Institute, Farmington Hills, MI, 624 pp.
ACI Committee 440, 2015, “Guide for the Design and Construction of Concrete Reinforced with FRP Bars (ACI 440.1R-15),” American Concrete Institute, Farmington Hills, MI.
ASTM D7205/D7207-06(2011), 2011, “Standard Test Method for Tensile Properties of Fiber Reinforced Polymer Matrix Composite Bars,” ASTM International, West Conshohocken, PA, 13 pp.

222 ACI Structural Journal/July 2020
Benmokrane, B.; Chaallal, O.; and Masmoudi, R., 1996, “Flexural Response of Concrete Beams Reinforced with FRP Reinforcing Bars,” ACI Structural Journal, V. 93, No. 1, Jan.-Feb., pp. 46-55.
Bischoff, P. H., 2005, “Reevaluation of Deflection Prediction for Concrete Beams Reinforced with Steel and Fiber Reinforced Polymer Bars,” Journal of Structural Engineering, ASCE, V. 131, No. 5, pp. 752-767. doi: 10.1061/(ASCE)0733-9445(2005)131:5(752)
Bischoff, P. H., 2007, “Deflection Calculation of FRP Reinforced Concrete Beams Based on Modifications to the Existing Branson Equation,” Journal of Composites for Construction, ASCE, V. 11, No. 1, pp. 4-14. doi: 10.1061/(ASCE)1090-0268(2007)11:1(4)
Bischoff, P. H.; Gross, S.; and Ospina, C. E., 2009, “The Story Behind the Proposed Changes to the ACI 440 Deflection Requirements for FRP-Reinforced Concrete,” Serviceability of Concrete Members Reinforced with Internal/External FRP Reinforcement, SP-264, C. Ospina, P. Bischoff, and T. Alkhardaji, eds., American Concrete Institute, Farmington Hills, MI, pp. 53-76.
Bischoff, P. H., and Gross, S. P., 2011a, “Design Approach for Calcu-lating Deflection of FRP Reinforced Concrete,” Journal of Composites for Construction, ASCE, V. 15, No. 4, pp. 490-499. doi: 10.1061/(ASCE)CC.1943-5614.0000195
Bischoff, P. H., and Gross, S. P., 2011b, “Equivalent Moment of Inertia Based on Integration of Curvature,” Journal of Composites for Construction, ASCE, V. 15, No. 3, pp. 263-273. doi: 10.1061/(ASCE)CC.1943-5614.0000164
Canadian Standards Association, 2012, “Design and Construction of Building Components with Fiber Reinforced Polymers (CAN/CSA S806-12),” CSA Group, Mississauga, ON, Canada.
Canadian Standards Association, 2014a, “Canadian Highway Bridge Design Code (CAN/CSA-S6-14),” CSA Group, Mississauga, ON, Canada.
Canadian Standards Association, 2014b, “Design of Concrete Structures (CAN/CSA-A23.3-14),” CSA Group, Mississauga, ON, Canada.
Deitz, D. H.; Harik, I. E.; and Gesund, H., 2003, “Physical Properties of Glass Fiber Reinforced Polymer Rebars in Compression,” Journal of Composites for Construction, ASCE, V. 7, No. 4, pp. 363-366. doi: 10.1061/(ASCE)1090-0268(2003)7:4(363)
El-Nemr, A.; Ahmed, E. A.; Barris, C.; and Benmokrane, B., 2016, “Bond-Dependent Coefficient of Glass- and Carbon-FRP Bars in Normal- and High-Strength Concretes,” Construction and Building Materials, V. 113, pp. 77-89. doi: 10.1016/j.conbuildmat.2016.03.005
El-Nemr, A.; Ahmed, E. A.; and Benmokrane, B., 2013, “Flexural Behavior and Serviceability of Normal- and High-Strength Concrete Beams Reinforced with Glass Fiber-Reinforced Polymer Bars,” ACI Structural Journal, V. 110, No. 6, Nov.-Dec., pp. 1077-1088.
El-Sayed, A. K.; El-Salakawy, E. F.; and Benmokrane, B., 2006, “Shear Strength of FRP-Reinforced Concrete Beams without Transverse Rein-forcement,” ACI Structural Journal, V. 103, No. 2, Mar.-Apr., pp. 235-243.
Elgabbas, F.; Vincent, P.; Ahmed, E.; and Benmokrane, B., 2016, “Experimental Testing of Basalt-Fiber-Reinforced Polymer Bars in Concrete Beams,” Composites Part B., V. 91, pp. 205-218. doi: 10.1016/j.compositesb.2016.01.045
Frosch, R. J., 1999, “Another Look at Cracking and Crack Control in Reinforced Concrete,” ACI Structural Journal, V. 96, No. 3, May-June, pp. 437-442.
Gergely, P., and Lutz, L. A., 1968, “Maximum Crack Width in RC Flex-ural Members, Causes, Mechanism and Control of Cracking in Concrete,” Causes, Mechanism, and Control of Cracking in Concrete, SP-20, Amer-ican Concrete Institute, Farmington Hills, MI, pp. 87-117.
ISIS Canada Research Network, 2001, “Reinforced Concrete Structures with Fibre Reinforced Polymers” ISIS Manual No. 3, University of Mani-toba, Winnipeg, MB, Canada.
ISIS Canada Research Network, 2007, “Reinforced Concrete Structures with Fibre Reinforced Polymers” ISIS Manual No. 3, University of Mani-toba, Winnipeg, MB, Canada.
Jaeger, L. G.; Mufti, A. A.; and Tadros, G., 1997, “The Concept of the Overall Performance Factor in Rectangular-Section Reinforced Concrete Members.” Proceedings of the 3rd International Symposium on Non-Metallic (FRP) Reinforcement for Concrete Structures, FRPRCS-3, V. 2, Japan Concrete Institute, Tokyo, Japan, pp. 551-559.
Kani, G. N. J., 1964, “The Riddle of Shear Failure and Its Solution,” ACI Journal Proceedings, V. 61, No. 4, Apr., pp. 441-467.
Kassem, C.; Farghaly, A. S.; and Benmokrane, B., 2011, “Evaluation of Flexural Behaviour and Serviceability Performance of Concrete Beams Reinforced with FRP Bars,” Journal of Composites for Construction, ASCE, V. 15, No. 5, pp. 682-695. doi: 10.1061/(ASCE)CC.1943-5614.0000216
Maranan, G. B.; Manalo, A. C.; Benmokrane, B.; Karunasena, W.; and Mendis, P., 2015, “Evaluation of the Flexural Strength and Serviceability of Geopolymer Concrete Beams Reinforced with Glass-Fibre-Reinforced
Polymer (GFRP) Bars,” Engineering Structures, V. 101, pp. 529-541. doi: 10.1016/j.engstruct.2015.08.003
Masmoudi, R.; Benmokrane, B.; and Chaallal, O., 1996, “Cracking Behaviour of Concrete Beams Reinforced with Fiber Reinforced Plastic Rebars,” Canadian Journal of Civil Engineering, V. 23, No. 6, pp. 1172-1179. doi: 10.1139/l96-926
Mota, C.; Alminar, S.; and Svecova, D., 2006, “Critical Review of Deflection Formulas for FRP-RC Members,” Journal of Compos-ites for Construction, ASCE, V. 10, No. 3, pp. 183-194. doi: 10.1061/(ASCE)1090-0268(2006)10:3(183)
Mousa, S.; Mohamed, H. M.; and Benmokrane, B., 2018b, “Flexural Strength and Design Analysis of Circular Reinforced Concrete Members with Glass Fiber-Reinforced Polymer Bars and Spirals,” ACI Structural Journal, V. 115, No. 5, Sept.-Oct., pp. 1353-1364. doi: 10.14359/51702282
Mousa, S.; Mohamed, H. M.; and Benmokrane, B., 2019a, “Cracking and Crack Control in Circular Concrete Bridge Members Reinforced with Fiber-Reinforced-Polymer Bars,” Journal of Bridge Engineering, ASCE, V. 24, No. 1, p. 04018108 doi: 10.1061/(ASCE)BE.1943-5592.0001335
Mousa, S.; Mohamed, H. M.; and Benmokrane, B., 2019b, “Deflec-tion Prediction Methodology for Circular RC Members Reinforced with Fiber-Reinforced Polymer Bars,” ACI Structural Journal, V. 116, No. 2, Mar., pp. 279-293. doi: 10.14359/51713293
Mousa, S.; Mohamed, H. M.; and Benmokrane, B., 2019c, “Strength and Deformability Aspects of Circular Concrete Members Reinforced with Hybrid Carbon-FRP and Glass-FRP under Flexure,” Journal of Composites for Construction, ASCE, V. 23, No. 2, p. 04019005 doi: 10.1061/(ASCE)CC.1943-5614.0000931
Mousa, S.; Mohamed, H. M.; Benmokrane, B.; and Ferrier, E., 2018a, “Flexural Behavior of Full-Scale Circular Concrete Members Reinforced with Basalt FRP Bars and Spirals: Tests and Theoretical Studies,” Composite Structures, V. 203, pp. 217-232. doi: 10.1016/j.compstruct.2018.06.107
Mousavi, S. R., and Esfahani, M. R., 2012, “Effective Moment of Inertia Prediction of FRP-Reinforced Concrete Beams Based on Experimental Results,” Journal of Composites for Construction, ASCE, V. 16, No. 5, pp. 490-498. doi: 10.1061/(ASCE)CC.1943-5614.0000284
Naaman, A. E., and Jeong, S. M., 1995, “Structural Ductility of Concrete Beams Prestressed with FRP Tendons,” Proceedings of the 2nd Interna-tional RILEM Symposium on Non-Metallic (FRP) Reinforcement for Concrete Structures, RILEM, Bagneux, France, pp. 379-386.
Nanni, A., 1993, “Flexural Behaviour and Design of RC Members Using FRP Reinforcement,” Journal of Structural Engineering, ASCE, V. 119, No. 11, pp. 3344-3359. doi: 10.1061/(ASCE)0733-9445(1993)119:11(3344)
Noël, M., and Soudki, K., 2014, “Estimation of the Crack Width and Deformation of FRP-Reinforced Concrete Flexural Members with and without Transverse Shear Reinforcement,” Engineering Structures, V. 59, pp. 393-398. doi: 10.1016/j.engstruct.2013.11.005
Ospina, C. E., and Bakis, C. E., 2007, “Indirect Flexural Crack Control of Concrete Beams and One-Way Slabs Reinforced with FRP Bars,” Proceed-ings of the 8th International Symposium on Fiber Reinforced Polymer Reinforcement for Concrete Structures (FRP-RCS-8), University of Patras, Patras, Greece, July 16-18.
Ovitigala, T.; Ibrahim, M. A.; and Issa, M. A., 2017, “Serviceability and Ultimate Load Behavior of Concrete Beams Reinforced with Basalt Fiber-Reinforced Polymer Bars,” ACI Structural Journal, V. 113, No. 4, July-Aug., pp. 1067-1071.
Rashid, M. A.; Mansur, M. A.; and Paramasivam, P., 2005, “Behavior of Aramid Fiber-Reinforced Polymer Reinforced High Strength Concrete Beams under Bending,” Journal of Composites for Construction, ASCE, V. 9, No. 2, pp. 117-127. doi: 10.1061/(ASCE)1090-0268(2005)9:2(117)
Razaqpur, A. G.; Svecova, D.; and Cheung, M. S., 2000, “Rational Method for Calculating Deflection of Fiber-Reinforced Polymer Reinforced Beams,” ACI Structural Journal, V. 97, No. 1, Jan.-Feb., pp. 175-185.
Thériault, M., and Benmokrane, B., 1998, “Effects of FRP Reinforce-ment Ratio and Concrete Strength on Flexure Behavior of Concrete Beams,” Journal of Composites for Construction, ASCE, V. 2, No. 1, pp. 7-16. doi: 10.1061/(ASCE)1090-0268(1998)2:1(7)
Tomlinson, D., and Fam, A., 2015, “Performance of Concrete Beams Reinforced with Basalt FRP for Flexure and Shear,” Journal of Composites for Construction, ASCE, V. 19, No. 2, p. 04014036 doi: 10.1061/(ASCE)CC.1943-5614.0000491
Toutanji, H. A., and Saafi, M., 2000, “Flexural Behavior of Concrete Beams Reinforced with Glass Fiber-Reinforced Polymer (GFRP) Bars,” ACI Structural Journal, V. 97, No. 5, Sept.-Oct., pp. 712-719.
Yost, J. R.; Gross, S. P.; and Dinehart, D. W., 2003, “Effective Moment of Inertia for Glass Fiber-Reinforced Polymer-Reinforced Concrete Beams,” ACI Structural Journal, V. 100, No. 6, Nov.-Dec., pp. 732-739.