acid rain program - robert b. laughlinlarge.stanford.edu/publications/coal/references/docs/... ·...
TRANSCRIPT

Acid Rain Program2 0 0 5 P R O G R E S S R E P O R T
acidrain05_mockup_FINAL.qxp 1/11/2007 5:04 PM Page 1

Acid Rain Program 2005 Progress Report
CONTENTS
Summary ....................................................................................................2
Origins of the Acid Rain Program ................................................................4
SO2 Emission Reductions ............................................................................5
SO2 Program Compliance ...........................................................................7
SO2 Allowance Market ................................................................................8
SO2 Compliance Options ..........................................................................10
NOx Emission Reductions and Compliance................................................11
Emission Monitoring and Reporting ..........................................................13
Status and Trends in Air Quality, Acid Deposition, and Ecological Effects ......14
Air Quality ................................................................................................17
Acid Deposition ........................................................................................20
Recovery of Acidified Lakes and Streams....................................................22
Quantifying Costs and Benefits of the Acid Rain Program...........................24
Further National Controls to Protect Human Health and the Environment.....26
Online Information, Data, and Resources ..................................................27
Endnotes ..................................................................................................28
EPA-430-R-06-015Clean Air Markets DivisionOffice of Air and RadiationU.S. Environmental Protection AgencyOctober 2006
acidrain05_mockup_FINAL.qxp 1/11/2007 5:04 PM Page 2
T he U.S. Environmental Protection Agency (EPA)
publishes an annual report to update the public
on compliance with the Acid Rain Program
(ARP), status of implementation, and progress toward
achieving environmental goals.
The Acid Rain Program 2005 Progress Report updates
data reported in previous years, specifically:
• Sulfur dioxide (SO2) emissions, allowance market
information, and program compliance.
• Nitrogen oxides (NOx) emissions and program
compliance.
• Status and trends in acid deposition, air quality, and
ecological effects.
• Future programs that build on the ARP to further
address environmental quality.
The Acid Rain Program 2005 Progress Report includes
special sections on fuel switching, EPA’s framework for
accountability, program costs and benefits, surface water
quality monitoring, impact assessment, environmental
justice, and new rules.
For more information on the ARP, including addi-
tional information on SO2 and NOx emissions, acid
deposition monitoring, environmental effects of acid
deposition, and detailed unit-level emissions data, please
visit EPA’s Clean Air Markets Web site at
<www.epa.gov/airmarkets>.
acidrain05_mockup_FINAL.qxp 1/11/2007 5:04 PM Page 1
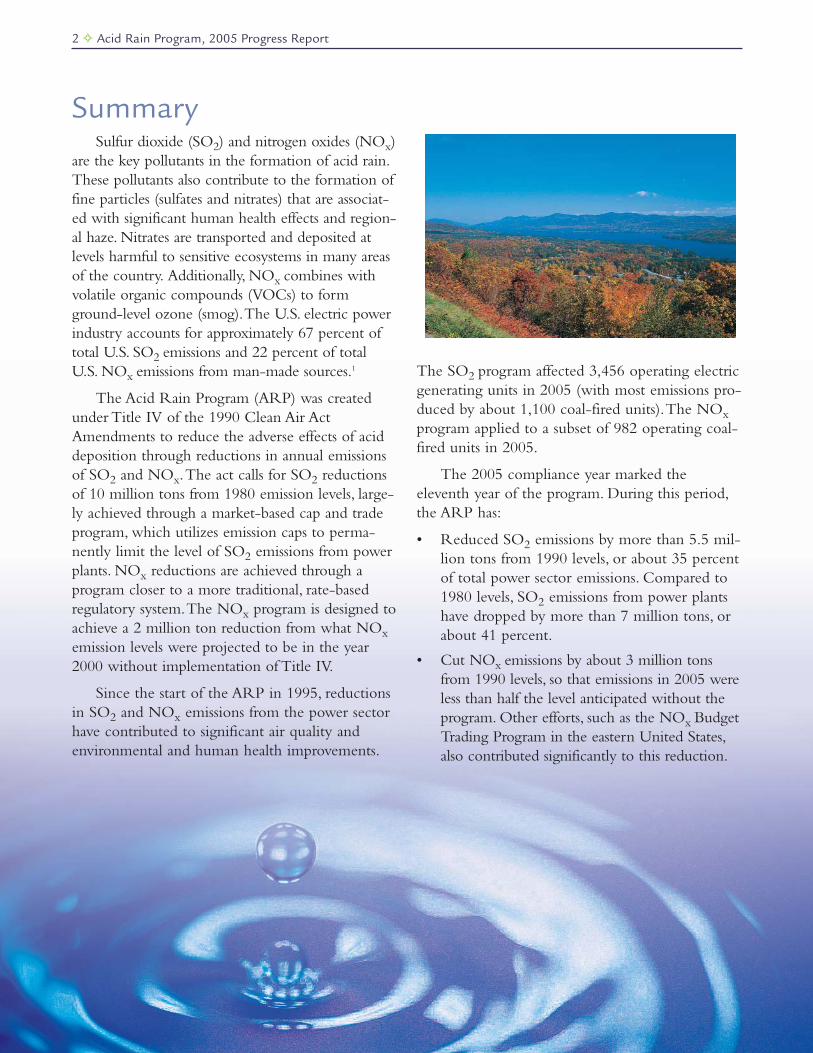
Sulfur dioxide (SO2) and nitrogen oxides (NOx)are the key pollutants in the formation of acid rain.These pollutants also contribute to the formation offine particles (sulfates and nitrates) that are associat-ed with significant human health effects and region-al haze. Nitrates are transported and deposited atlevels harmful to sensitive ecosystems in many areasof the country. Additionally, NOx combines withvolatile organic compounds (VOCs) to formground-level ozone (smog).The U.S. electric powerindustry accounts for approximately 67 percent oftotal U.S. SO2 emissions and 22 percent of totalU.S. NOx emissions from man-made sources.1
The Acid Rain Program (ARP) was createdunder Title IV of the 1990 Clean Air ActAmendments to reduce the adverse effects of aciddeposition through reductions in annual emissionsof SO2 and NOx.The act calls for SO2 reductionsof 10 million tons from 1980 emission levels, large-ly achieved through a market-based cap and tradeprogram, which utilizes emission caps to perma-nently limit the level of SO2 emissions from powerplants. NOx reductions are achieved through a program closer to a more traditional, rate-basedregulatory system.The NOx program is designed toachieve a 2 million ton reduction from what NOxemission levels were projected to be in the year2000 without implementation of Title IV.
Since the start of the ARP in 1995, reductionsin SO2 and NOx emissions from the power sectorhave contributed to significant air quality andenvironmental and human health improvements.
The SO2 program affected 3,456 operating electricgenerating units in 2005 (with most emissions pro-duced by about 1,100 coal-fired units).The NOxprogram applied to a subset of 982 operating coal-fired units in 2005.
The 2005 compliance year marked theeleventh year of the program. During this period,the ARP has:
• Reduced SO2 emissions by more than 5.5 mil-lion tons from 1990 levels, or about 35 percentof total power sector emissions. Compared to1980 levels, SO2 emissions from power plantshave dropped by more than 7 million tons, orabout 41 percent.
• Cut NOx emissions by about 3 million tonsfrom 1990 levels, so that emissions in 2005 wereless than half the level anticipated without theprogram. Other efforts, such as the NOx BudgetTrading Program in the eastern United States,also contributed significantly to this reduction.
2 ✧ Acid Rain Program, 2005 Progress Report
Summary
acidrain05_mockup_FINAL.qxp 1/11/2007 5:04 PM Page 2

Acid Rain Program, 2005 Progress Report ✧ 3
• Led to significant reductions in acid deposition.For example, between the 1989–1991 observa-tion period and the 2003–2005 observationperiod, wet sulfate deposition decreased 36 per-cent in the Northeast and 32 percent in theMidwest.These decreases have resulted in posi-tive changes in environmental indicators, includ-ing improved water quality in lakes and streams.
• Provided the most complete and accurateemissions data ever developed and made thosedata available and accessible through compre-hensive electronic data reporting and Web-based tools for agencies, researchers, affectedsources, and the public.
• Delivered pioneering e-gov-ernment results, automatingadministrative processes,reducing paper use, and pro-viding online systems fordoing business with EPA.
• Achieved extremely highcompliance levels. No unitsoperating in the ARP during2005 were found out of com-pliance with the allowanceholding requirements.
• Reduced implementationcosts by allowing sources tochoose cost-effective compli-ance strategies.
After 11 years of implementation, monitoring,and assessment, the ARP has proven to be an effec-tive and efficient means of meeting emission reduc-tion goals under the Clean Air Act. A 2005 study2
estimated the program’s benefits at $122 billionannually in 2010, while cost estimates are around$3 billion annually (in 2000$). Despite the pro-gram’s historic and projected benefits, however,EPA analyses of recent studies of human health,data from long-term monitoring networks, andecological assessments have revealed the need foradditional emission reductions to protect humanhealth and continue ecological recovery and pro-tection. EPA recognized the need for further SO2and NOx controls on the power industry to addresstransport problems many states face in efforts to
attain National Ambient Air Quality Standards(NAAQS) for ozone and fine particles.The successof the ARP and NOx control programs, along withthe need for further reductions, provided the impe-tus for a suite of new rules promulgated in 2005:the Clean Air Interstate Rule (CAIR), the CleanAir Visibility Rule (CAVR), and the Clean AirMercury Rule (CAMR).
Building on the ARP model, EPA promulgatedCAIR in March 2005 to address transport of fineparticles and ozone in the eastern United States;CAVR to improve visibility in national parks andwilderness areas; and CAMR to reduce nationwide
mercury emissions from coal-fired power plants. Starting in2009 and 2010, CAIR establishesregional caps on SO2 and NOxemissions for affected easternstates.Annual SO2 emissions arecapped at 3.7 million tons in2010 and 2.6 million tons in2015.Annual NOx emissions arecapped at 1.5 million tons in2009 and 1.3 million tons in2015. CAIR will operate concur-rently with the ARP.
CAVR addresses SO2 andNOx emissions from non-CAIRstates located in the West andparts of New England. Affectedsources under CAVR must
reduce SO2 and NOx emissions impairing visibilityin national parks and wilderness areas. Notably,EPA has proposed to allow power plants and otherstationary sources to establish regional cap andtrade programs to accomplish these reductions.
CAMR establishes a national cap on mercuryemissions beginning in 2010 and utilizes a market-based cap and trade program.Additionally, new andexisting coal-fired power plants—the nation’slargest sources of mercury emissions—will berequired to meet standards of performance thatlimit mercury emissions.These programs will serveas a key component of strategies to protect humanhealth and the environment across the UnitedStates into the next decade.
acidrain05_mockup_FINAL.qxp 1/11/2007 5:04 PM Page 3
4 ✧ Acid Rain Program, 2005 Progress Report
Acid deposition, more com-monly known as acid rain, occurswhen emissions of sulfur dioxide(SO2) and nitrogen oxides (NOx)react with water, oxygen, and oxi-dants in the atmosphere to formvarious acidic compounds.Prevailing winds transport thesecompounds hundreds of miles,often across state and national bor-ders, where they impair air qualityand damage public health, acidifylakes and streams, harm sensitiveforests and coastal ecosystems,degrade visibility, and acceleratethe decay of building materials.
The Acid Rain Program(ARP), established under Title IVof the 1990 Clean Air ActAmendments, requires majorreductions of SO2 and NOx emis-sions from the electric powerindustry.The SO2 program sets a permanent capon the total amount of SO2 that may be emittedby electric generating units in the contiguousUnited States.The program is phased in, with thefinal 2010 SO2 cap set at 8.95 million tons, a levelof about one-half of the emissions from the powersector in 1980.
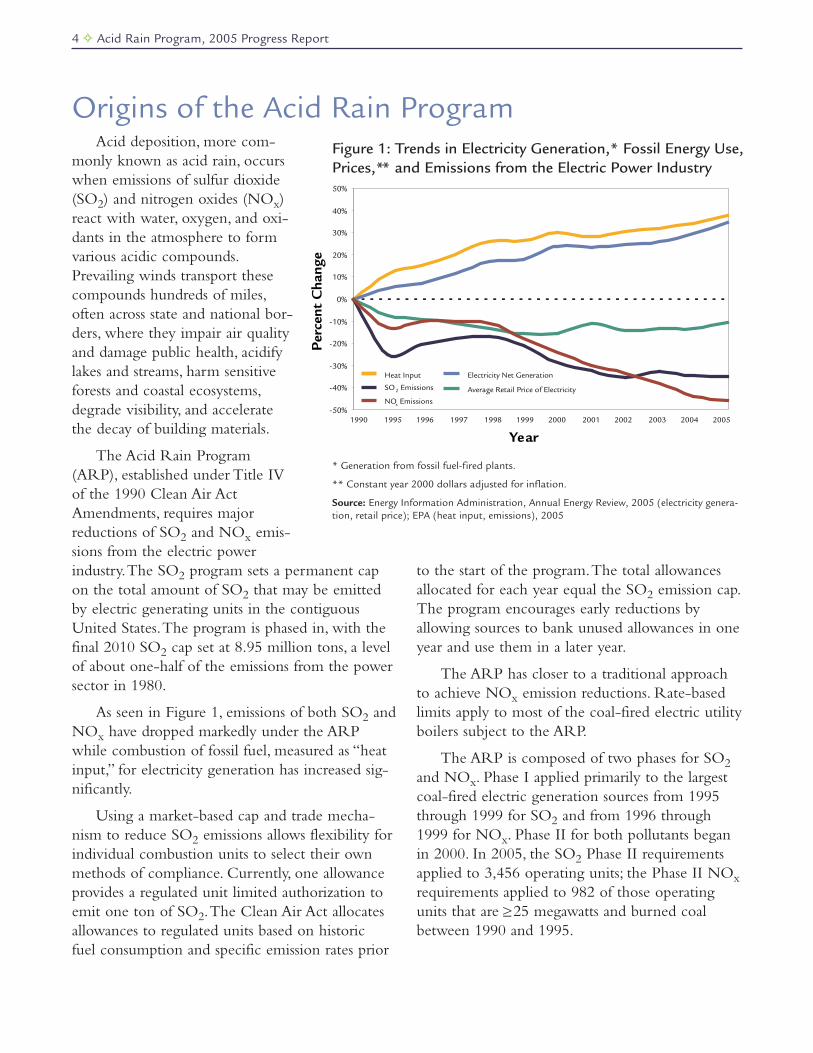
As seen in Figure 1, emissions of both SO2 andNOx have dropped markedly under the ARPwhile combustion of fossil fuel, measured as “heatinput,” for electricity generation has increased sig-nificantly.
Using a market-based cap and trade mecha-nism to reduce SO2 emissions allows flexibility forindividual combustion units to select their ownmethods of compliance. Currently, one allowanceprovides a regulated unit limited authorization toemit one ton of SO2.The Clean Air Act allocatesallowances to regulated units based on historic fuel consumption and specific emission rates prior
to the start of the program.The total allowancesallocated for each year equal the SO2 emission cap.The program encourages early reductions byallowing sources to bank unused allowances in oneyear and use them in a later year.
The ARP has closer to a traditional approachto achieve NOx emission reductions. Rate-basedlimits apply to most of the coal-fired electric utilityboilers subject to the ARP.
The ARP is composed of two phases for SO2and NOx. Phase I applied primarily to the largestcoal-fired electric generation sources from 1995through 1999 for SO2 and from 1996 through1999 for NOx. Phase II for both pollutants beganin 2000. In 2005, the SO2 Phase II requirementsapplied to 3,456 operating units; the Phase II NOxrequirements applied to 982 of those operatingunits that are >_25 megawatts and burned coalbetween 1990 and 1995.
Origins of the Acid Rain Program
Heat Input
SO2 Emissions
Electricity Net Generation
Average Retail Price of Electricity
NOx Emissions-50%
-40%
-30%
-20%
-10%
0%
10%
20%
30%
40%
50%
Per
cent
Change
1990 1995 1996 1997 1998 1999 2000 2001 2002 2003 2004 2005
Year
Figure 1: Trends in Electricity Generation,* Fossil Energy Use,Prices,** and Emissions from the Electric Power Industry
* Generation from fossil fuel-fired plants.
** Constant year 2000 dollars adjusted for inflation.
Source: Energy Information Administration, Annual Energy Review, 2005 (electricity genera-tion, retail price); EPA (heat input, emissions), 2005
acidrain05_mockup_FINAL.qxp 1/11/2007 5:04 PM Page 4

Acid Rain Program, 2005 Progress Report ✧ 5
Electric power generation is by far the largest single source ofSO2 emissions in the United States, accounting for approximately 67 percent of total SO2 emissions nationwide.3
As shown in Figure 2, Acid Rain Program (ARP) sourceshave reduced annual SO2 emissions by 41 percent compared to 1980 levels and 35 percent compared to 1990 levels. Reductions in SO2 emissions from other sources not affected by the ARP(including industrial and commercial boilers and the metals and
SO2 Emission Reductions
9.4 9.3 8.7
5.3 5.4 5.5 5.3 4.9
17.3
16.1 15.7
11.912.5
13.0 13.112.5
11.210.6 10.2 10.6 10.3 10.2
8.78.3
7.1 7.0
9.6 9.510.0
0.0
2.0
4.0
6.0
8.0
10.0
12.0
14.0
16.0
18.0
20.0
All Affected Sources
Phase II (2000 on) Sources
Phase I (1995-1999) Sources
Allowances Allocated
7.0
9.5 9.5 9.5
1980 1985 1990 1995 1996 1997 1998 1999 2000 2001 2002 2003 2004 2005
SO
2 E
mis
sio
ns
(mill
ion t
ons)
Year
Figure 2: SO2 Emissions from Acid Rain Program Sources
SO2 EmissionReductions from Acid RainProgram Sources:Cost-EffectiveProgress✧ In 1995, the first
year of implementa-tion, SO2 emissionsdecreased by 24 percent—nearly 4 million tons—from1990 levels.
✧ During the pastdecade, SO2 emis-sions dropped anadditional 14 percentfrom 1995 levelsdespite a 24 percentincrease in powergeneration (based onheat input).
✧ In 2005, SO2 emis-sions from all ARPunits totaled 10.2million tons, a 35percent decreasefrom 1990 levels(15.7 million tons).
✧ Until SO2 allowanceprices began toincrease in 2004 inanticipation of EPA’s2005 Clean AirInterstate Rule(CAIR), prices gener-ally remained under$200/ton, well belowexpected control costsfor the program. 0
5
10
15
20
25
8.7
11.7
13.4
15.0
16.6
21.6
19.918.8
18.217.1
16.4
SO
2 E
mis
sio
ns
(mill
ion t
ons)
Year
1995 1996 1997 1998 1999 2000 2001 2002 2003 2004 2005
Allowances Allocated that Year
Unused Allowances from Previous Year (bank)
Actual Emissions from Affected Sources
Figure 3: SO2 Emissions and the Allowance Bank, 1995-2005
Source: EPA, 2006
Source: EPA, 2006
acidrain05_mockup_FINAL.qxp 1/11/2007 5:04 PM Page 5

refining industries) and use of cleaner fuels in resi-dential and commercial burners have contributedto a similar overall decline (42 percent) in annualSO2 emissions from all sources since 1980. NationalSO2 emissions have fallen from 25.9 million tons in1980 to an estimated 15 million tons in 2005 (see<www.epa.gov/airtrends>).
For 2005, EPA allocated approximately 9.5million SO2 allowances under the ARP. Togetherwith more than 6.8 million unused allowances car-ried over (or banked) from prior years, there werenearly 16.4 million allowances available for use in2005. Sources emitted 10.2 million tons of SO2 in2005, somewhat more than the allowances allocat-ed for the year, but far less than the totalallowances available (see Figure 3).4
The number of banked allowances dropped from6.8 million available for 2005 compliance to 6.2 mil-lion available for 2006 and future years, a 10 percentreduction of the total bank. In the next several years,industry anticipation of stringent emission require-ments under the Clean Air Interstate Rule (CAIR) isexpected to encourage sources to pursue additionalreductions.While these reductions will result in anincrease in banked allowances, tighter retirementratios under CAIR will lead to depletion of the bankand further emission reductions. In 2010, the totalnumber of Title IV allowances allocated annuallydrops to 8.95 million (about half of the emissionsfrom the power industry in 1980) and remains statu-torily fixed at that annual level permanently.Table 1explains in more detail the origin of the allowancesthat were available for use in 2005, and Table 2 onpage 7 shows how those allowances were used.
The states with the highest emitting sources in1990 have seen the greatest SO2 reductions duringthe ARP (see Figure 4). Most of these states areupwind of the areas the ARP was designed to protect, and reductions have resulted in important environmental and health benefits over a largeregional scale. In addition, the states that reducedemissions from 1990 to 2005 had total annual reduc-tions of approximately 6 million tons, while thestates that increased emissions—largely attributable togrowth and not increases in emission rates—hadmuch smaller annual increases of approximately
6 ✧ Acid Rain Program, 2005 Progress Report
Type ofAllowanceAllocation
Number of SO2Allowances
Explanation of AllowanceAllocation Type
InitialAllocation
9,191,897 Initial allocation is thenumber of allowancesgranted to units*based on the productof their historic uti-lization and emissionrates specified in theClean Air Act.
AllowanceAuction
250,000 The allowance auc-tion providesallowances to themarket that were setaside in a SpecialAllowance Reservewhen the initialallowance allocationwas made.
Opt-inAllowances
97,678 Opt-in allowances areprovided to unitsentering the programvoluntarily. Therewere eight opt-inunits in 2005.
Total 2005Allocation
9,539,575
TotalBankedAllowances**
6,845,477 Banked allowancesare those allowancesaccrued in accountsfrom previous years,which can be used forcompliance in 2005or any future year.
Total 2005AllowableEmissions
16,385,052
Table 1: Origin of 2005 Allowances
Source: EPA, 2006
*In this report, the term “unit” means a fossil fuel-fired combustor thatserves a generator that provides electricity for sale. The vast majority ofSO2 emissions under the program result from coal-fired generation units,but oil and natural gas units are also included in the program.
**Total banked allowances are adjusted from the 2004 Progress Report toaccount for additional deductions made for electronic data reporting(EDR) resubmissions after 2004 reconciliation was completed.
acidrain05_mockup_FINAL.qxp 1/11/2007 5:04 PM Page 6

470,000 tons. For 32 states andthe District of Columbia, annu-al SO2 emissions in 2005 werelower than 1990 emissions.Among these states, 13decreased their annual emissionsby more than 100,000 tonsbetween 1990 and 2005:Florida, Georgia, Illinois,Indiana, Kentucky,Massachusetts, Missouri, NewYork, Ohio, Pennsylvania,Tennessee,West Virginia, andWisconsin.The states with thegreatest annual reductions werein the Midwest and includeOhio (1.1 million tonsreduced), Illinois, Indiana,Missouri,Tennessee, and WestVirginia, each of which reducedover 500,000 tons per year.
Acid Rain Program, 2005 Progress Report ✧ 7
Scale: Largest bar equals2.2 million tons of
emissions in Ohio, 1990SO2
SO Emissions in 19902
SO Emissions in 19952
SO Emissions in 20002
SO Emissions in 20052
Figure 4: State-by-State SO2 Emission Levels, 1990–2005
Source: EPA, 2006
Approximately 10.2 millionallowances were deducted fromsources’ accounts in 2005 to coveremissions.Table 2 displays theseallowance deductions, as well as theremaining banked allowances from1995 through 2005. In 2005, all AcidRain Program (ARP) units were incompliance with the allowance hold-ing requirements and no excess emis-sions penalties were paid.5 Title IVset a penalty of $2,000 per ton in1990, which is adjusted annually forinflation.The 2005 penalty level wasset at $3,042 per excess ton, but nopenalties were levied.The ARP’s capand trade approach offers emissionsources the flexibility to comply withregulations using their choice of themost cost-effective strategies avail-able. Since the program’s inception,the compliance rate has consistentlybeen extraordinarily high.
SO2 Program Compliance
TOTAL HELD ON MARCH 1, 2006* 16,385,052
Unit Accounts Subject to Reconciliation 13,102,070
Other Accounts** 3,282,982
TOTAL DEDUCTIONS 10,222,847
Emissions*** 10,222,847
Penalties (2006 Vintage) 0
TOTAL BANKED 6,162,205
Unit Accounts Subject to Reconciliation 2,879,223
Other Accounts 3,282,982
Table 2: SO2 Allowance Reconciliation Summary, 2005
Source: EPA, 2006
* March 1, 2006, is the allowance transfer deadline, the point in time at which unitaccounts were frozen and after which no transfers of 1995 through 2005 allowances wererecorded. The freeze on these accounts was removed when annual reconciliation wascomplete.
** Other accounts include general accounts and unit accounts that are not subject to recon-ciliation. General accounts can be established in the Allowance Tracking System (ATS) byany utility, individual, or other organization.
*** Includes 310 allowances deducted from opt-in sources for reduced utilization.
acidrain05_mockup_FINAL.qxp 1/11/2007 5:04 PM Page 7

8 ✧ Acid Rain Program, 2005 Progress Report
The allowance trading mechanism enables AcidRain Program (ARP) sources to pursue a varietyof compliance options, while the cap on SO2emissions ensures that reductions are achieved andmaintained over time. Some sources have opted toreduce their SO2 emissions below the level of theirallowance allocation in order to bank theirallowances for use in future years or to sell them.Other sources have been able to postpone orreduce expenditures for control by purchasingallowances from sources that controlled belowtheir allowance allocation level.The allowanceprices ultimately reflectthese flexible compliancedecisions. Economists referto this as the marginal costof compliance—the cost ofreducing the next ton ofSO2 emitted from thepower sector.
The cost of emissionallowances was initiallyprojected to be between$250 and $500 per tonduring Phase I (1995 to1999) and $500 to $1,000per ton in Phase II (beyond 2000). As shown inFigure 5, actual allowance prices were in the $100to $200 range, with a low of $65 in 1996. Even asthe more stringent Phase II requirements becameeffective in 2000, prices were generally below the$200 per allowance mark until they started to riseat the end of 2003. Market observers believe thatthe lower than expected prices early in the pro-gram were due primarily to reduced compliancecosts.The availability of low-cost, low-sulfur coal resulted in larger than expected emissionreductions, which increased the supply ofallowances and put downward pressure on themarket. In addition, technological innovationreduced the expected marginal costs of scrubbersby over 40 percent from original estimates.Thesecost and emission reductions led to a large bank ofallowances from Phase I that were available for
compliance in Phase II, contributing to the lowerthan anticipated prices.
In 2004, the market started to react to the like-lihood of future emission reduction requirementsthat went beyond the existing caps of the ARP.The price of SO2 allowances continued to riseduring 2005, ending the year at about $1,550 afterbeginning the year at about $700. Marketobservers believe this price run-up occurred dueto initial uncertainty as EPA finalized the CleanAir Interstate Rule (CAIR). CAIR requires fur-ther SO2 reductions from sources in many easternstates beginning in 2010.These additional reduc-
tions cause an increase inthe expected marginalcost of compliance infuture years. Becauseallowances are bankabletoday for use in futureyears, estimates of futurecontrol costs impact thecurrent market price ofallowances. However, anapparent overly conserva-tive reaction by buyers,who wanted assurancethat they could cover cur-rent and future allowance
needs, caused market prices to exceed EPA’s esti-mate of future control costs. In the first half of2006, however, allowance prices have fallen sharply,and were just over $600 per ton at the end of June2006.This price level is more consistent withwhere EPA has expected allowances to be today,given estimates of the marginal cost of reducingSO2 emissions under CAIR. EPA has seentemporary run-ups in the allowance marketsbefore, with appropriate downward adjustments asbuyers and sellers more completely assess marketfundamentals. For instance, at the beginning ofcompliance with the NOx Budget Program,EPA observed a similar pattern of market run-upfollowed by a self-correction.
In fact, current SO2 allowance market condi-tions (as of September 2006) track closely withEPA’s estimates.The current SO2 allowance market
SO2 Allowance Market
acidrain05_mockup_FINAL.qxp 1/11/2007 5:04 PM Page 8

Acid Rain Program, 2005 Progress Report ✧ 9
has factored the costs of com-pliance with the new suite ofregulatory programs into itspricing decisions.As can beseen in Figure 6, EPA has pro-jected that pre-2010 vintageallowances would be worth$721 per allowance in 2010,and that 2010–2014 vintageallowances would be worthapproximately $360 perallowance due to the 2:1 retire-ment ratio that applies to thosevintage allowances for sourcesin the CAIR region.
July 2006 spot market pricesshow that prices for the earliervintage are trading for $610 to$740 per ton, and the later vin-tages (2010–2014) are trading for$308 to $390 per ton.
In 2005, nearly 5,700 privateallowance transfers (movingroughly 19.9 million allowancesof past, current, and future vin-tages) were recorded in the EPA Allowance Tracking System(ATS).About 10 million (50 percent) were transferred ineconomically significant transac-tions (i.e., between economicallyunrelated parties).Transfersbetween economically unrelatedparties are a better indicator of avibrant market than are transac-tions among the various units ofa given company. In the majorityof these transfers, allowanceswere acquired by power compa-nies. Figure 7 shows the annualvolume of SO2 allowances trans-ferred under the ARP (exclud-ing allocations, retirements, andother transfers by EPA) sinceofficial recording of transfersbegan in 1994.
19.9
15.316.5
21.422.5
25.0
18.7
13.515.2
8.2
16.7
9.2
0
5
10
15
20
25
30
1994 1995 1996 1997 1998 1999 2000 2001 2002 2003 2004 2005
Allo
wance
s (m
illio
ns)
Year
Between economically related organizations.
Between economically unrelated organizations (significant transfers).
Figure 7: SO2 Allowances Transferred under theAcid Rain Program
Source: EPA, 2006
$0
$200
$400
$600
$800
$1,000
$1,200
$1,400
$1,600
$1,800
1994
1995
1996
1997
1998
1999
2000
2001
2002
2003
2004
2005
2006
Pri
ce (
no
min
al d
olla
rs p
er t
on
)
Year
Influence of CAIR
Figure 5: SO2 Allowance Prices for Current Vintage
Source: Cantor Fitzgerald Market Price Index, 2006
$721
$360
EPA Projected Allowance Price in 2010 (in 2006 Dollars)
2010-2014 VintageUp to 2010 Vintage
July 2006 Spot Market Price Range*
2006 Vintage 2010 Vintage
$308
$390
$610
$740
* EPA analysis suggests that 2006 vintage allowances should be selling for about$600 per allowance and 2010 allowances should be about $300 per allowance.
Source: EPA, 2006, and Evolution Markets, LLC, 2006
Figure 6: Actual and Forecast Allowance Prices
acidrain05_mockup_FINAL.qxp 1/11/2007 5:04 PM Page 9

Figure 8 shows the cumulative volume ofSO2 allowances transferred under the ARP. Thefigure differentiates between allowances trans-ferred in private transactions and those annuallyallocated and transferred to sources’ accounts byEPA. Private transactions are indicative of bothmarket interest and use of allowances as a com-pliance strategy. Of the nearly 300 millionallowances transferred since 1994, about 63 per-cent were traded in private transactions. InDecember 2001, parties began to use a systemdeveloped by EPA to allow online allowancetransfers. In 2005, account holders registeredabout 98 percent of all private allowance transfersthrough EPA’s online transfer system.6
10 ✧ Acid Rain Program, 2005 Progress Report
Other Renewables
0
500,000
1,000,000
1,500,000
2,000,000
2,500,000
3,000,000
3,500,000
4,000,000
4,500,000
19901992
19941996
19982000
20022004
Gig
aw
att
Ho
urs
Year
Hydroelectric
Nuclear
Natural Gas
Petroleum
Coal
Figure 9: Net Electric Generation by Energy Source
Source: EPA, 2006
Since 1995, the majority of units affected bythe Acid Rain Program (ARP) have chosen tocomply with the emission reduction requirementsby using or blending low-sulfur coal, installingSO2 and NOx controls such as scrubbers andlow-NOx burners, or purchasing allowances fromthe market or using banked allowances.
According to the Energy InformationAdministration, the 1987 repeal of the PowerPlant and Industrial Fuel Use Act prohibiting theuse of natural gas by new electric generating unitsled to a large increase in natural gas generatingcapacity through 2000.7 Additional factors
contributing to this increase were low natural gasprices through the 1990s, the availability ofincreasingly efficient natural gas technology in theform of advanced combined cycle units, the shortconstruction-to-operation time to build new com-bined cycle units, and the attractiveness ofnatural gas as a trace SO2-emitting fuel source.
However, coal-fired generation grew from1990 to 2004, taking advantage of the excesscapacity available at existing plants.Today, coalremains the largest single fuel used for generatingelectricity in the United States, at 50 percent ofnet generation in 2005 (see Figure 9).
SO2 Compliance Options
0
50
100
150
200
250
300
Allo
wance
s (m
illions) EPA Transfers to Account
Private Transactions
Year
1994 1995 1996 1997 1998 1999 2000 2001 2002 2003 2004 2005
Figure 8: Cumulative SO2 AllowancesTransferred through 2005
Source: EPA, 2006.
00.5
11.5
22.5
33.5
44.5
5
Existingpulverizedcoal plantretrofitted
with SCR andFGD
Exisitingpulverizedcoal plant
w/o SCR andFGD
Newpulverizedcoal plantwith BACTcontrols
Newcombinedcycle plantwith BACTcontrols
Newpulverizedcoal plantw/o BACTcontrols
Newcombinedcycle plantw/o BACTcontrols
Capital costs
Fuel costs
Variable O & M
Fixed O & M
Cen
ts p
er k
Wh (
19
95
$)
Figure 10: Comparison of Electric Generation Costs in 1995 ofBase Load Coal-fired and Gas-fired Electric Generation Units*
*Unit sizes used in this analysis are around 325 megawatts.
Source: EPA, 2006
acidrain05_mockup_FINAL.qxp 1/11/2007 5:04 PM Page 10

These factors contributed to an economic situ-ation where it became more economical in manyregions of the country to retrofit existing baseloadcoal plants with scrubbers than to build new coal-fired capacity to enhance existing load or to buildnew coal-fired capacity where excess coal capacitywas available at existing plants.Where excess coal-fired capacity was not an alternative, building newcombined cycle units was the cheapest alternativeto meet new load requirements (see Figure 10).
Finally, most of the new naturalgas capacity built in the last 15 yearshas been in three particular Censusregions:West South Central (Arkansas,Louisiana, Oklahoma,Texas); PacificContiguous (California, Oregon,Washington); and South Atlantic(Washington DC, Delaware, Florida,Georgia, Maryland, North Carolina,South Carolina,Virginia,WestVirginia). For the most part, theseareas have been, and continue to be,comparatively high users of natural gasand oil and have the infrastructure tosupport natural gas-fired electric gen-
eration. In particular, the West South Central andPacific Contiguous regions, which contributeover half of the electricity generated by naturalgas in the United States, have a long history ofoil and gas generation that precedes the imple-mentation of the ARP in 1995 (see Figure 11).Additionally, the West South Central and PacificContiguous regions have not traditionally beenheavily affected by the requirements of the ARP.
Acid Rain Program, 2005 Progress Report ✧ 11
Title IV of the 1990 CleanAir Act Amendments requiresNOx emission reductions forcertain coal-fired electric gener-ating units. Unlike the SO2 pro-gram, Congress appliedrate-based emission limits basedon a unit’s boiler type to achieveNOx reductions (see Table 3).The NOx emission limit isexpressed as pounds of NOx perunit of heat input (lbs/millionBritish thermal units [mmBtu])for each boiler subject to a NOxlimit. Owners can meet theNOx limits for each individualunit or meet group NOx limitsthrough averaging plans forgroups of units that share a common owner and designated
NOx Emission Reductions and Compliance
Source: EPA, 2006
Table 3: Number of NOx-Affected Title IV Units by Boiler Typeand NOx Emission Limit
Coal-Fired Boiler Type Title IV StandardEmission Limits
(lb/mmBtu)
Number ofUnits
Phase I Group 1 Tangentially Fired 0.45 132
Phase I Group 1 Dry Bottom,Wall-fired
0.50 113
Phase II Group 1 Tangentially Fired 0.40 301
Phase II Group 1 Dry Bottom,Wall-fired
0.46 295
Cell Burners 0.68 37
Cyclones >155 MW 0.86 54
Wet Bottom >65 MW 0.84 24
Vertically Fired 0.80 26
Total n/a 982
0
50,000,000
100,000,000
150,000,000
200,000,000
250,000,000
300,000,000
New E
ngland
Mid
dle Atla
ntic
East
North C
entra
l
Wes
t North
Cen
tral
Sout
h Atla
ntic
East
South
Cen
tral
Wes
t Sou
th C
entra
l
Mounta
in
Pacifi
c Contig
uous
To
tal G
ener
ati
on
(M
Wh)
1990
1995
2000
2004
Figure 11: Distribution of Natural Gas Generation, 1990–2004
Source: Energy Information Administration, 2006
acidrain05_mockup_FINAL.qxp 1/11/2007 5:04 PM Page 11

representative. In 2005, allsources met their emission limitrequirements under the AcidRain NOx program.
The NOx program seeks toattain a 2 million ton annualreduction from all Acid RainProgram (ARP) sources relativeto the NOx emission levels thatwere projected to occur in2000 absent the ARP (8.1 mil-lion tons).This goal was firstachieved in 2000 and has beenmet every year thereafter,including 2005. Figure 12shows that NOx emissions fromall ARP sources were 3.6 mil-lion tons in 2005.This level is4.5 million tons less than theprojected level in 2000 withoutthe ARP, or more than doublethe Title IV NOx emissionreduction objective.Thesereductions have been achievedwhile the amount of fuel burnedto produce electricity at all ARPunits in 2005, as measured byheat input, has increased 38 per-cent since 1990.While the ARPwas responsible for a large por-tion of these annual NOx reduc-tions, other programs (such asthe Ozone TransportCommission’s NOx BudgetProgram, EPA’s NOx StateImplementation Plan (SIP) Call,and regional NOx emission con-trol programs) also contributedsignificantly to the NOx reduc-tions achieved by sources in2005.
As with SO2, the states with the highest NOx-emitting sources in 1990 tended to see thegreatest power plant NOx emission reductions (see Figure 13).The sum of reductions in the 39states and the District of Columbia that had lower
annual NOx emissions in 2005 than in 1990 wasapproximately 2.8 million tons, while the sum ofincreases in the nine states that had higher annualNOx emissions in 2005 than in 1990 was muchsmaller, about 61,000 tons. Eight of the 11 stateswith NOx emission decreases of more than100,000 tons were in the Ohio River Basin.
12 ✧ Acid Rain Program, 2005 Progress Report
3.3
4.04.14.5
4.8
5.35.55.45.45.5
3.83.4
3.63.8
4.24.5
4.7
5.15.5
6.06.05.96.1
6.7
0
1
2
3
4
5
6
7
1990 1995 1996 1997 1998 1999 2000 2001 2002 2003 2004 2005
Year
NO
x E
mis
sio
ns
(mill
ion t
ons)
NOx Program Affected Sources
Title IV Sources Not Affected by NOx Program
Figure 12: NOx Emission Trends for Acid Rain Program Units,1990–20058
Source: EPA, 2006
NO Emissions in 1990x
NO Emissions in 1995x
NO Emissions in 2000x
NO Emissions in 2005x
Scale: Largest bar equals 500,000 tons of NOx emissions in Ohio, 1990
Note: 2005 NOx Budget Program states shaded in gray
Figure 13: State-by-State NOx Emission Levels for Acid RainProgram Sources, 1990–2005
Source: EPA, 2006
acidrain05_mockup_FINAL.qxp 1/11/2007 5:04 PM Page 12

Acid Rain Program, 2005 Progress Report ✧ 13
The Acid Rain Program(ARP) requires program partic-ipants to measure, record, andreport emissions using continu-ous emission monitoring sys-tems (CEMS) or an approvedalternative measurementmethod.The vast majority ofemissions are monitored withCEMS while the alternativesprovide an efficient means ofmonitoring emissions from thelarge universe of units withlower overall mass emissionlevels (see Figures 14 and 15).
Since the program’s incep-tion in 1995, emissions havebeen continuously monitoredand reported, verified, andrecorded by EPA, and providedto the public through EPA’sWeb site. Hourly emissions dataare reported for all affectedsources in quarterly electronicreports, and EPA conductsautomated software audits thatperform rigorous checks to ensure the complete-ness, quality, and integrity of the emissions data.CEMS and approved alternatives are a cornerstoneof the ARP’s accountability and transparency. All emissions data are available to the public at EPA’sClean Air Markets Data and Maps Web site at<http://cfpub.epa.gov/gdm/>.The site also pro-vides access to a variety of other data associatedwith emission trading programs, including reports,queries, maps, charts, and file downloads coveringsource information, emissions, allowances, programcompliance, and air quality.
The emission monitoring requirements for theARP are found in 40 CFR Part 75.These provi-sions are also required for participation in the NOxBudget Trading Program, a NOx summer seasontrading program implemented by many easternstates in response to EPA’s 1998 NOx SIP Call.The Part 75 requirements will also be used in thefuture to implement the Clean Air Interstate Rule(CAIR) and the Clean Air Mercury Rule(CAMR).
Emission Monitoring and Reporting
1,065
56
2,136
18176
5
Coal Units w/ CEMS Waste Units w/CEMS Oil Units w/ CEMS
Gas Units w/ CEMSOil Units w/o CEMS Gas Units w/o CEMS
Figure 14: Monitoring Methodology for the Acid Rain Program, Number of Units
96%
<0.3%<0.1%1% 2%<0.1%
Coal Units w/ CEMS Waste Units w/CEMS Oil Units w/ CEMS
Gas Units w/ CEMSOil Units w/o CEMS Gas Units w/o CEMS
Figure 15: Monitoring Methodology for the Acid Rain Program,Total SO2 Mass
Source: EPA, 2006
Source: EPA, 2006
acidrain05_mockup_FINAL.qxp 1/11/2007 5:04 PM Page 13

14 ✧ Acid Rain Program, 2005 Progress Report
The emission reductions achieved under the Acid Rain Program(ARP) have led to important environmental and public health benefits.These include improvements in air quality with significant benefits tohuman health, reductions in acid deposition, the beginnings of recoveryfrom acidification in fresh water lakes and streams, improvements in visi-bility, and reduced risk to forests, materials, and structures.Table 4 showsthe regional changes in key air quality and atmospheric depositionmeasurements linked to the ARP’s SO2 and NOx emission reductions.
Status and Trends in Air Quality, Acid Deposition, and Ecological Effects
The National AcidPrecipitationAssessment ProgramThe National AcidPrecipitation AssessmentProgram (NAPAP) 2005Report concluded thatTitle IV has been quite suc-cessful in reducingemissions of SO2 and NOxfrom power generation.These reductions haveimproved air quality,visibility, and humanhealth at a relatively lowcost compared to thebenefits generated.
However, the report alsonoted that several scientificstudies indicate thatrecovery of acid-sensitiveecosystems will require40 to 80 percent furtheremission reductionsbeyond those anticipatedwith full implementation ofTitle IV. Power generationcurrently contributesapproximately 67 percentof the SO2 emissions and22 percent of the NOxemissions nationwide. Evenif all SO2 emissions frompower plants were elimi-nated, reductions fromother source categorieswould be needed forfull protection of all acid-sensitive ecosystems affect-ed by acid deposition.
To view the report, visit:
<www.al.noaa.gov/AQRS/reports/napapreport05.pdf>
Measurement Unit Region Average PercentChange*1989–1991 2003–2005
Wet Sulfate Deposition
kg/ha Mid-AtlanticMidwestNortheastSoutheast
27232318
20161415
-24-32-36-19
Wet Sulfate Concentration
mg/L Mid-AtlanticMidwestNortheastSoutheast
2.42.31.91.3
1.61.61.11.1
-33-30-40-21
Ambient SulfurDioxide Concentration
μg/m3 Mid-AtlanticMidwestNortheastSoutheast
13106.85.2
8.45.83.13.4
-34-44-54-35
Ambient SulfateConcentration
μg/m3 Mid-AtlanticMidwestNortheastSoutheast
6.45.63.95.4
4.53.82.54.1
-30-33-36-24
Wet InorganicNitrogen Deposition
kg/ha Mid-AtlanticMidwestNortheastSoutheast
5.96.05.34.3
5.55.54.14.4
-8-8
-23+2
Wet Nitrate Concentration
mg/L Mid-AtlanticMidwestNortheastSoutheast
1.51.41.30.8
1.01.20.90.7
-29-14-33-9
Ambient NitrateConcentration
μg/m3 Mid-AtlanticMidwestNortheastSoutheast
0.92.10.40.6
1.01.80.50.7
+5-14+20+17
Total Ambient Nitrate Concentra-tion (Nitrate +Nitric acid)
μg/m3 Mid-AtlanticMidwestNortheastSoutheast
3.54.02.02.2
3.03.51.72.1
-14-12-13-5
Table 4: Regional Changes in Air Quality and Deposition ofSulfur and Nitrogen, 1989–1991 Versus 2003–2005
Source: Clean Air Status and Trends Network (CASTNET) and the National AtmosphericDeposition Program/National Trends Network (NADP/NTN)
* Percent change is estimated from raw measurement data, not rounded; some of the measure-ment data used to calculate percentages may be at or below detection limits.
acidrain05_mockup_FINAL.qxp 1/11/2007 5:04 PM Page 14

Acid Rain Program, 2005 Progress Report ✧ 15
Framework for AccountabilityEPA is expanding its capacity to track the effectiveness of programs to protect ecosystemsfrom air pollution and examine the effects of changes in deposition and air concentrations onthe health of sensitive receptor species in aquatic and forest ecosystems, human health, andvisibility.
This effort stems from the recommendations in the 2004 National Academy of Sciences(NAS) report, Air Quality Management in the United States, which recognized the significantreduction in air pollution achieved under the Clean Air Act, and recommended a course ofaction to achieve further progress. For ecosystem protection, the recommendations include:
✧ Improving monitoring and tracking of ecosystems and science to support secondary oralternative standards.
✧ Taking an “airshed” approach.
✧ Emphasizing results, accountability, and dynamic, data-based program adjustment.
EPA’s Clean Air Act Advisory Committee (CAAAC) expanded on the NAS recommendationswith further ecosystem-related recommendations, including the establishment of:
✧ A framework for accountability
✧ Benchmarks and measures of the ecological impacts of air pollution
✧ Effects of multiple pollutants
✧ Measures of ecosystem response
✧ Collaborative integrated assessments
✧ Critical loads and thresholds
Air Quality Management in the United States, National Academies Press: <www.nap.edu/catalog/10728.html>
acidrain05_mockup_FINAL.qxp 1/11/2007 5:04 PM Page 15
16 ✧ Acid Rain Program, 2005 Progress Report
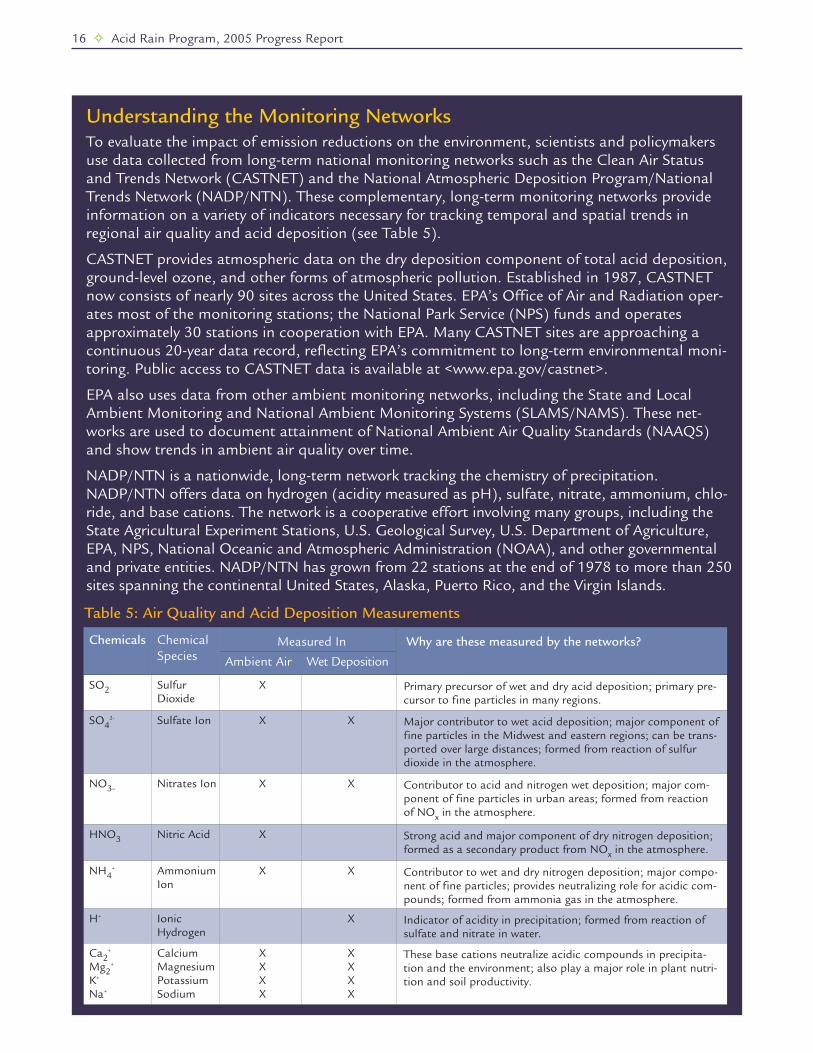
Understanding the Monitoring Networks To evaluate the impact of emission reductions on the environment, scientists and policymakersuse data collected from long-term national monitoring networks such as the Clean Air Statusand Trends Network (CASTNET) and the National Atmospheric Deposition Program/NationalTrends Network (NADP/NTN). These complementary, long-term monitoring networks provideinformation on a variety of indicators necessary for tracking temporal and spatial trends inregional air quality and acid deposition (see Table 5).
CASTNET provides atmospheric data on the dry deposition component of total acid deposition,ground-level ozone, and other forms of atmospheric pollution. Established in 1987, CASTNETnow consists of nearly 90 sites across the United States. EPA’s Office of Air and Radiation oper-ates most of the monitoring stations; the National Park Service (NPS) funds and operatesapproximately 30 stations in cooperation with EPA. Many CASTNET sites are approaching acontinuous 20-year data record, reflecting EPA’s commitment to long-term environmental moni-toring. Public access to CASTNET data is available at <www.epa.gov/castnet>.
EPA also uses data from other ambient monitoring networks, including the State and LocalAmbient Monitoring and National Ambient Monitoring Systems (SLAMS/NAMS). These net-works are used to document attainment of National Ambient Air Quality Standards (NAAQS)and show trends in ambient air quality over time.
NADP/NTN is a nationwide, long-term network tracking the chemistry of precipitation.NADP/NTN offers data on hydrogen (acidity measured as pH), sulfate, nitrate, ammonium, chlo-ride, and base cations. The network is a cooperative effort involving many groups, including theState Agricultural Experiment Stations, U.S. Geological Survey, U.S. Department of Agriculture,EPA, NPS, National Oceanic and Atmospheric Administration (NOAA), and other governmentaland private entities. NADP/NTN has grown from 22 stations at the end of 1978 to more than 250sites spanning the continental United States, Alaska, Puerto Rico, and the Virgin Islands.
Chemicals ChemicalSpecies
Measured In Why are these measured by the networks?
Ambient Air Wet Deposition
SO2 SulfurDioxide
X Primary precursor of wet and dry acid deposition; primary pre-cursor to fine particles in many regions.
SO42- Sulfate Ion X X Major contributor to wet acid deposition; major component of
fine particles in the Midwest and eastern regions; can be trans-ported over large distances; formed from reaction of sulfurdioxide in the atmosphere.
NO3- Nitrates Ion X X Contributor to acid and nitrogen wet deposition; major com-ponent of fine particles in urban areas; formed from reactionof NOx in the atmosphere.
HNO3 Nitric Acid X Strong acid and major component of dry nitrogen deposition;formed as a secondary product from NOx in the atmosphere.
NH4+ Ammonium
IonX X Contributor to wet and dry nitrogen deposition; major compo-
nent of fine particles; provides neutralizing role for acidic com-pounds; formed from ammonia gas in the atmosphere.
H+ IonicHydrogen
X Indicator of acidity in precipitation; formed from reaction ofsulfate and nitrate in water.
Ca2+
Mg2+
K+
Na+
CalciumMagnesiumPotassiumSodium
XXXX
XXXX
These base cations neutralize acidic compounds in precipita-tion and the environment; also play a major role in plant nutri-tion and soil productivity.
Table 5: Air Quality and Acid Deposition Measurements
acidrain05_mockup_FINAL.qxp 1/11/2007 5:04 PM Page 16

Acid Rain Program, 2005 Progress Report ✧ 17
Figure 17a: Annual Mean Ambient SulfurDioxide Concentration, 1989–1991*
Source: CASTNET
Figure 17b: Annual Mean Ambient SulfurDioxide Concentration, 2003–2005
Source: CASTNET
Sulfur DioxideSulfur data collected from the State and Local
Air Monitoring Stations (SLAMS) and the NationalAir Monitoring Stations (NAMS) monitoring net-works show that the decline in SO2 emissions fromthe power industry has improved air quality. In theentire United States, there has not been a singlemonitored violation of the SO2 ambient air qualitystandard since 2000. Based on EPA’s latest air qualitytrends data located at <www.epa.gov/airtrends>,the national composite average of SO2 annual meanambient concentrations decreased 48 percentbetween 1990 and 2005, as shown in Figure 16.The largest single-year reduction (21 percent)occurred in the first year of the Acid Rain Program(ARP), between 1994 and 1995.
These trends are consistent with the ambienttrends observed in Clean Air Status and TrendsNetwork (CASTNET). During the late 1990s,following implementation of Phase I of the ARP,dramatic regional improvements in SO2 and ambient sulfate concentrations were observed at
CASTNET sites throughout the eastern UnitedStates due to the large reductions in SO2 emissionsfrom ARP sources.Three-year mean annual concentrations of SO2 and sulfate from CAST-NET long-term monitoring sites are comparedfrom 1989 through 1991 and 2003 through 2005in both tabular form (see Table 4 on page 14) andgraphically in maps (see Figures 17a through 18b).
Air Quality
Co
nce
ntr
ati
on, p
pm
0.00
0.01
0.02
0.03
0.04
1980 1985 1990
90% of sites have concentrations below this line.
1995 2000 2005
163 sites
National Standard
Year
AVERAGE
10% of sites have concentrations below this line.
Figure 16: National SO2 Air Quality,1980–2005 (Based on Annual Arithmetic Average)
Source: EPA air emission trends, <www.epa.gov/airtrends/sulfur.html>
*Dots on all maps represent monitoring sites. Lack of shading for southern Florida on Figures 17a, 18a, and 19a indicates lack of monitoring coverage.
acidrain05_mockup_FINAL.qxp 1/11/2007 5:04 PM Page 17

18 ✧ Acid Rain Program, 2005 Progress Report
Figure 18a: Annual Mean Ambient SulfateConcentration, 1989–1991
Source: CASTNET
Figure 18b: Annual Mean Ambient SulfateConcentration, 2003–2005
Source: CASTNET
Figure 19a: Annual Mean Total Ambient Nitrate Concentration, 1989–1991
Source: CASTNET
Figure 19b: Annual Mean Total Ambient Nitrate Concentration, 2003–2005
Source: CASTNET
acidrain05_mockup_FINAL.qxp 1/11/2007 5:04 PM Page 18

Acid Rain Program, 2005 Progress Report ✧ 19
The map in Figure 17a shows that from 1989through 1991, prior to implementation of Phase Iof the ARP, the highest ambient concentrations ofSO2 in the East were observed in westernPennsylvania and along the Ohio River Valley.Figure 17b indicates a significant decline in thoseconcentrations in nearly all affected areas afterimplementation of the ARP.
Also, in 1989 through 1991, the highest ambient sulfate concentrations, greater than 7 micrograms per cubic meter (μg/m3), were also
observed in western Pennsylvania, along the OhioRiver Valley, and in northern Alabama. Most of theeastern United States experienced annual ambientsulfate concentrations greater than 5 μg/m3. LikeSO2 concentrations, ambient sulfate concentrationshave decreased since the ARP was implemented,with average concentrations decreasing approxi-mately 30 percent in all regions of the East. Boththe size of the affected region and magnitude ofthe highest concentrations have dramaticallydeclined, with the largest decreases observed alongthe Ohio River Valley (see Figures 18a and 18b).
Assessing Recent Monitoring Data—SulfateAir quality monitoring networks such as the Clean Air Status and Trends Network (CASTNET),report air concentration data for both primary (sulfur dioxide) and secondary (sulfate) pollu-tants as an indication of changes in power plant emissions. Continuous emission monitors onfossil fuel-burning power plants at the unit or stack level provide the data for SO2 emissions,which show a national decrease from 2004 to 2005. Interestingly, ambient monitoring data fromCASTNET for 2005 show an increase in sulfate (SO4
2) concentrations—an important constituentof fine particulate matter—across much of the eastern United States. This observed increase doesnot correlate with the relatively steady or declining emissions data from regional sources and islikely to be the result of year-to-year variations in meteorological conditions or other factors.
Sulfate ion formation is the result of complex chemical and physical processes involving emis-sions from Acid Rain Program (ARP) sources, non-ARP sources (i.e., industrial processes, agri-culture and transportation), meteorological conditions, and other phenomena. EPA employs arange of analytical and assessment protocols to understand these processes, including modelingof source/receptor relationships, source apportionment, and atmospheric transport processes.
Although the ARP has achieved significant reductions in SO2 from coal-burning power plants—over35 percent since 1990—sulfate deposition and concentrations vary from year to year. This illustratesthe importance of long-term monitoring and accounting for annual variability to determine status
and trends over time. Another steep reductionin SO2 emissions is projected to be achieved bythe Clean Air Interstate Rule (CAIR), which willcap eastern SO2 emissions at 2.6 million tons in2015, much lower than the ARP’s toughest capthat starts in 2010. As with the ARP, this programis expected to result in significant emission reduc-tions. These reductions may be followed by periodicfluctuations in regional and source-specificemissions as sources seek to comply with the cap,as well as fluctuating signals from the air qualityand deposition monitoring networks.
Sulfate Concentrations
Source: CASTNET
acidrain05_mockup_FINAL.qxp 1/11/2007 5:04 PM Page 19

Nitrogen OxidesThe ARP has met its NOx reduction targets,
and these reductions are correlated with decreasesin total ambient nitrate concentrations (the sum ofparticulate nitrate and nitric acid) at CASTNETsites.The ratio of these two components in theatmosphere is dependent on emissions of NOx,SO2, and other pollutants from electric generationand other sectors (such as motor vehicles andagriculture).
In some areas, NOx levels can also be affected byemissions transported via air currents over wide
regions. From 2003 to 2005, reduced NOx emissionsfrom power plants under the NOx Budget TradingProgram led to more significant region-specificimprovements in some indicators. For instance, meantotal annual ambient nitrate concentrations (nitricacid plus particulate nitrate) for 2003 through 2005decreased in the Midwest by about 12 percent fromthe annual mean concentration in 1989 through1991 (see Figures 19a and 19b).While the cause ofthe reductions has not yet been determined conclu-sively, these improvements may be partly attributedto added NOx controls installed for compliance withthe NOx Budget Trading Program.
20 ✧ Acid Rain Program, 2005 Progress Report
National Atmospheric Deposition Program/National Trends Network (NADP/NTN) moni-toring data show significant improvements in mostdeposition indicators. For example, wet sulfatedeposition—sulfate that falls to the earth throughrain, snow, and fog—hasdecreased since the implemen-tation of the Acid RainProgram (ARP), particularlythroughout the early 1990s inmuch of the Ohio River Valleyand northeastern UnitedStates. Some of the greatestreductions have occurred inthe mid-Appalachian region,including Maryland, NewYork,West Virginia,Virginia,and most of Pennsylvania.Other less dramatic reductionshave been observed acrossmuch of New England,portions of the southernAppalachian Mountains, andin some areas of the Midwest.Between the 1989–1991and 2003–2005 observationperiods, average decreases in wet deposition ofsulfate ranged from 36 percent in the Northeast to19 percent in the Southeast (see Table 4 on page
14 and Figures 20a and 20b).Along with wet sul-fate deposition, wet sulfate concentrations havealso decreased significantly. Since 1991, averagelevels decreased 40 percent in the Northeast, 33percent in the Mid-Atlantic, and 30 percent in the
Midwest.A strong correlationbetween large-scale SO2 emis-sion reductions and largereductions in sulfate concentra-tions in precipitation has beennoted in the Northeast, one ofthe areas most affected by aciddeposition.
A reduction in the long-range transport of sulfate fromemission sources located in theOhio River Valley is a principalreason for reduced concentra-tions of sulfate in precipitationin the Northeast.The reductionsin sulfate documented in theNortheast, particularly acrossNew England and portions ofNew York, were also affectedby SO2 emission reductions in
eastern Canada. NADP data indicate that similarreductions in precipitation acidity, expressed ashydrogen ion (H+) concentrations, occurredconcurrently with sulfate reductions.
Acid Deposition
acidrain05_mockup_FINAL.qxp 1/11/2007 5:04 PM Page 20

Acid Rain Program, 2005 Progress Report ✧ 21
Figure 20a: Annual Mean Wet SulfateDeposition, 1989–1991
Source: National Atmospheric Deposition Program
Figure 20b: Annual Mean Wet SulfateDeposition, 2003–2005
Figure 21a: Annual Mean Wet InorganicNitrogen Deposition, 1989–1991
Figure 21b: Annual Mean Wet InorganicNitrogen Deposition, 2003–2005
Reductions in nitrogen deposition recordedsince the early 1990s have been less dramaticthan those for sulfur.As noted earlier, emissionsfrom source categories other than ARP sourcessignificantly affect air concentrations and nitrogen
deposition. Inorganic nitrogen deposition decreasedin the Mid-Atlantic and Midwest (8 percent) andmore significantly in the Northeast (23 percent), butremained virtually unchanged in the Southeast (seeFigures 21a and 21b).
Source: National Atmospheric Deposition Program
Source: National Atmospheric Deposition Program Source: National Atmospheric Deposition Program
acidrain05_mockup_FINAL.qxp 1/11/2007 5:04 PM Page 21

22 ✧ Acid Rain Program, 2005 Progress Report
Acid rain is only one ofmany large-scale anthro-pogenic impacts affectinglakes and streams in theUnited States. Climatechange, forest maturation, bio-logical disturbances (e.g., pestoutbreaks), and land usechange can have an impacton ecosystems that are alsoaffected by acid deposition.Nevertheless, scientists havedemonstrated measurableimprovements in some lakesand streams resulting from theAcid Rain Program (ARP).Scientists studied lakes andstreams in four regions—NewEngland, the AdirondackMountains, the northernAppalachians (including theCatskill Mountains), and thesouthern Appalachians(including the Blue Ridge)—and found signs of recovery inmany, but not all, of thoseareas (see Figure 22).Thesesigns of recovery includereductions in sulfate and alu-minum concentrations anddecreases in acidity.
The monitoring datashow that sulfate concentra-tions are declining substan-tially in all but one of theregions. Statistically signifi-cant decreases in nitrate con-centrations are evident in allof the regions, although themagnitude of these changesis small, especially in New
Recovery ofAcidified Lakesand Streams
Improvements in Surface WaterLong-term monitoring networks provide information on thechemistry of lakes and streams, which demonstrates howwater bodies are responding to changes in emissions.9 Thedata presented in the figure below show regional trends inacidification from 1990 to 2004 in areas of the eastern UnitedStates. For each lake or stream in the network, measurementsof various indicators of recovery from acidification were taken.These measurements were plotted against time, and trends forthe given lake or stream during the 15-year period were thencalculated as the change in each of the measurements per year(e.g., change in concentration of sulfate per year). Using thetrends calculated for each water body, median regionalchanges were determined for each recovery measure. A nega-tive value of the “slope of the regional trend” means that themeasure has been declining in the region, while a positive valuemeans it has been increasing. The greater the value of thetrend, the greater the yearly change in the measurement.Movement toward recovery is indicated by positive trends inacid neutralizing capacity (ANC) and negative trends in sul-fate, nitrate,hydrogen ion, and aluminum.Negativetrends inbase cationsand positivetrends inorganic acidscan balanceout thedecreasingtrends in sulfate andnitrate and prevent ANC from increasing. The results of theseregional trend analyses are shown in Figure 22 and Table 6.
Increasing ANC was evident in two of the regions studied(Adirondacks and northern Appalachians). One-quarter toone-third of the lakes and streams in these regions previouslyaffected by acid rain are no longer acidic at base-flow condi-tions, although they are still highly sensitive to future changesin deposition.
-5- -4 3 -2 -1 0 1 2
Sulfate(μeq/L/yr)
Slope of Regional Trend
Nitrate(μeq/L/yr)
ANC(μeq/L/yr)
Hydrogen Ion (μeq/L/yr)
Base Cations(μeq/L/yr)
So. Appalachian Streams (n=65)No. Appalachian Streams (n=9)Adirondack Lakes (n=49)New England Lakes (n=21)
Figure 22: Regional Trends, Lakes andStreams, 1990–2004
Source: EPA
acidrain05_mockup_FINAL.qxp 1/11/2007 5:04 PM Page 22

Acid Rain Program, 2005 Progress Report ✧ 23
England. It should be noted, however, that decreas-ing nitrate concentrations do not appear to berelated to the magnitude of changes in emissionsor deposition in these areas, but are likely a resultof ecosystem factors that are not yet fully under-stood.
As a result of declining sulfate (and to someextent nitrate) concentrations, the acidity of lakeand stream water is decreasing in three of the fourregions. In the Adirondacks and northernAppalachians, acid neutralizing capacity (ANC, anindicator of aquatic ecosystem recovery) is increas-ing. For example, 48 out of 49 monitoredAdirondack lakes showed reductions in sulfate con-centrations that coincide with reductions in atmos-pheric concentrations of sulfur.These decreases insulfate, as well as decreases in nitrate concentrationsthat do not appear to be due to changes in atmos-pheric nitrogen deposition, have resulted inincreased pH and ANC as well as decreases in theamount of toxic inorganic aluminum in Adirondacklakes. In New England,ANC appears to be increas-ing only slightly, and is not statistically significant,but hydrogen ion concentrations are declining.Declining hydrogen ion concentrations represent anincrease in pH, which also is elevated by statisticallysignificant levels in the Adirondacks. In contrast,increasing sulfate concentrations are evident in thesouthern Appalachians.This regional increase maybe explained in part by the region’s soils, which canstore large amounts of sulfate delivered by deposi-
tion.When large amounts of sulfate have accumu-lated in the soils over time, stream water sulfate con-centrations can also continue increasing over time.Thus, despite decreasing sulfate in atmospheric dep-osition, an increase in sulfate concentrations in-stream has been observed in that region.
Base cations are important because they bufferthe impact of sulfur and nitrogen deposition. Basecation concentrations in lakes and streams areexpected to decrease when rates of atmosphericdeposition decline, but if they decrease too much,they limit recovery in pH and ANC.While thehigh rates of base cation decline in the northernAppalachians may be of concern, they do not cur-rently seem to be preventing recovery. However,their behavior in the future will bear watching.
Organic acids are natural forms of acidity.Lakes and streams vary widely in how much natu-ral acidity they have, and increases in organic acids,like declining base cations, over time can limitrecovery. Organic acid concentrations are currentlyincreasing in many parts of the world, but thecause is still being debated. Of the regions moni-tored by EPA, only the Adirondacks are showingsignificant increases in organic acids, and theirincrease may be responsible for 10 to 15 percentless recovery (in ANC) than expected. In order tofully understand and assess response and recoveryof sensitive ecosystems to emission reduction pro-grams, this area may require further investigation.
Table 6: Results of Regional Trend Analyses on Lakes and Streams, 1990–2004
Values show the slope of the regional trend (the median value for the trends in all of the sites in the region). Regional trends that are statistically signif-icant are shown in bold.
Source: EPA, 2004
Chemical VariableNew England
Lakes(n = 21)
AdirondackLakes
(n = 49)
No. AppalachianStreams(n = 9)
So. AppalachianStreams(n = 65)
Sulfate (μeq/L/yr) -1.4 -2.0 -2.3 +1.7
Nitrate (μeq/L/yr) -0.02 -0.45 -0.31 -0.55
Acid Neutralizing Capacity (μeq/L/yr) +0.18 +1.08 +0.76 -4.44
Base Cations (μeq/L/yr) -1.35 -1.24 -2.63 -4.56
Hydrogen (μeq/L/yr) -0.02 -0.26 -0.01 -0.01
Organic Acids (μeq/L/yr) +0.02 +0.15 -0.03 Insufficient data
Aluminum (μg/L/yr) Insufficient data -4.72 Insufficient data Insufficient data
acidrain05_mockup_FINAL.qxp 1/11/2007 5:04 PM Page 23
24 ✧ Acid Rain Program, 2005 Progress Report
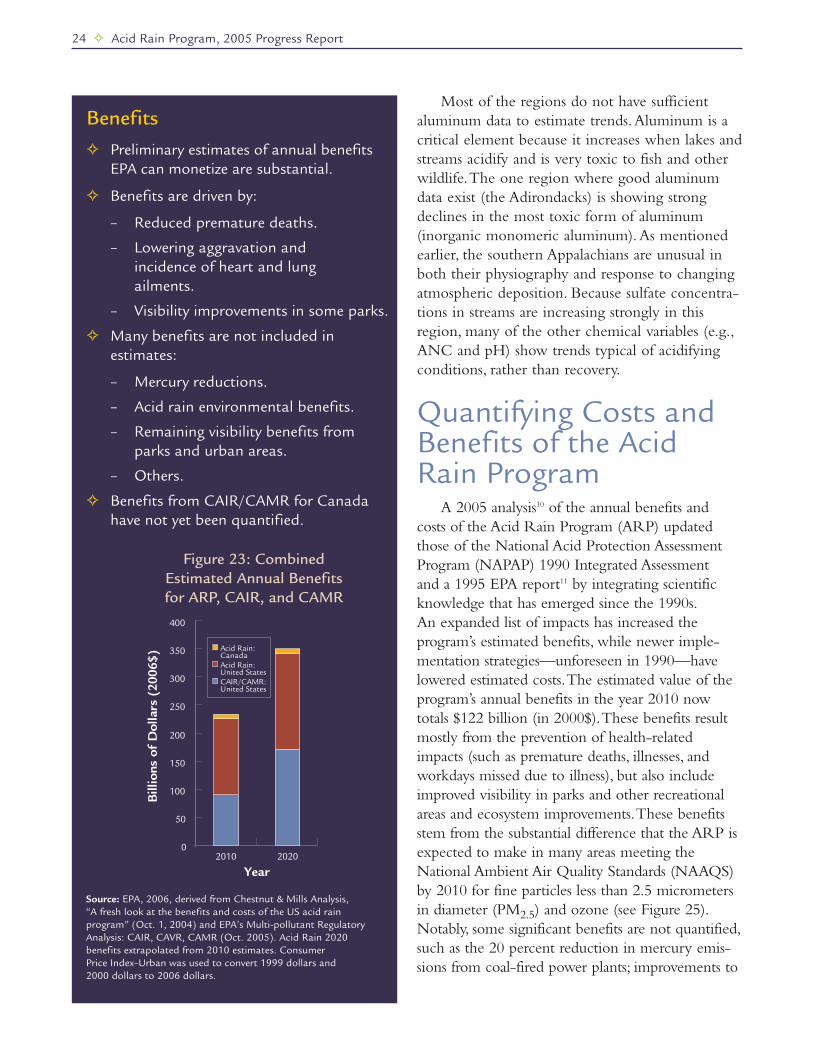
A 2005 analysis10 of the annual benefits and costs of the Acid Rain Program (ARP) updatedthose of the National Acid Protection AssessmentProgram (NAPAP) 1990 Integrated Assessment and a 1995 EPA report11 by integrating scientificknowledge that has emerged since the 1990s.An expanded list of impacts has increased the program’s estimated benefits, while newer imple-mentation strategies—unforeseen in 1990—havelowered estimated costs.The estimated value of theprogram’s annual benefits in the year 2010 nowtotals $122 billion (in 2000$).These benefits resultmostly from the prevention of health-relatedimpacts (such as premature deaths, illnesses, andworkdays missed due to illness), but also includeimproved visibility in parks and other recreationalareas and ecosystem improvements.These benefitsstem from the substantial difference that the ARP isexpected to make in many areas meeting theNational Ambient Air Quality Standards (NAAQS)by 2010 for fine particles less than 2.5 micrometersin diameter (PM2.5) and ozone (see Figure 25).Notably, some significant benefits are not quantified,such as the 20 percent reduction in mercury emis-sions from coal-fired power plants; improvements to
Quantifying Costs andBenefits of the AcidRain Program
✧ Preliminary estimates of annual benefitsEPA can monetize are substantial.
✧ Benefits are driven by:
– Reduced premature deaths.
– Lowering aggravation and incidence of heart and lung ailments.
– Visibility improvements in some parks.
✧ Many benefits are not included inestimates:
– Mercury reductions.
– Acid rain environmental benefits.
– Remaining visibility benefits fromparks and urban areas.
– Others.
✧ Benefits from CAIR/CAMR for Canadahave not yet been quantified.
Benefits
0
50
100
150
200
250
300
350
400
2010 2020
Billions
of
Dollar
s (2
006$
) Acid Rain:CanadaAcid Rain: United StatesCAIR/CAMR:United States
Year
Figure 23: CombinedEstimated Annual Benefitsfor ARP, CAIR, and CAMR
Source: EPA, 2006, derived from Chestnut & Mills Analysis,“A fresh look at the benefits and costs of the US acid rainprogram” (Oct. 1, 2004) and EPA’s Multi-pollutant RegulatoryAnalysis: CAIR, CAVR, CAMR (Oct. 2005). Acid Rain 2020benefits extrapolated from 2010 estimates. ConsumerPrice Index–Urban was used to convert 1999 dollars and 2000 dollars to 2006 dollars.
Most of the regions do not have sufficient aluminum data to estimate trends.Aluminum is acritical element because it increases when lakes andstreams acidify and is very toxic to fish and otherwildlife.The one region where good aluminumdata exist (the Adirondacks) is showing strongdeclines in the most toxic form of aluminum(inorganic monomeric aluminum).As mentionedearlier, the southern Appalachians are unusual inboth their physiography and response to changingatmospheric deposition. Because sulfate concentra-tions in streams are increasing strongly in thisregion, many of the other chemical variables (e.g.,ANC and pH) show trends typical of acidifyingconditions, rather than recovery.
acidrain05_mockup_FINAL.qxp 1/11/2007 5:04 PM Page 24
Acid Rain Program, 2005 Progress Report ✧ 25
Environmental Justice AnalysisIn September 2005, EPA published a staff report evaluatingthe public health benefits of the ARP, focusing on thechanges in exposure of minority and low-income popula-tions to ambient concentrations of PM2.5 as a result ofthe ARP. Analyses of SO2 and NOx emissions show that,in general, the areas with highest emissions prior to theprogram have also experienced the greatest emissionreductions. However, since the ARP does not mandatereductions from specific sources, the exact effects of theARP on specific populations or localities are harder toassess. To explore the potential environmental justiceissues related to the ARP, EPA investigated how tradingSO2 emissions under the ARP might affect minority andlow-income communities, and how trading SO2 emis-sions has impacted air quality at both regional and locallevels. In formulating this analysis of the ARP, EPA meas-ured exposure to PM2.5 concentrations in relation to region-al locations, population size, race, and income levels. Thisinvestigation led EPA to the following conclusions:
✧ There is no evidence that the cap and trade mechanism has led to increased humanexposure to air pollution.
✧ The ARP improved air quality substantially overall.
✧ The ARP improved air quality substantially for all population groups.
✧ No disproportionately high and adverse human health or environmental effects were foundfor minority or low-income groups.
To view the complete report, visit <www.epa.gov/airmarkets/staff_analysis.pdf>.
urban visibility, forest health, and surface water quality; and increased longevity and reduced soilingof painted and stone surfaces.
The 2005 study finds that the estimated annualcost of the ARP in 2010 will be $3 billion, withthe SO2 program accounting for about $2 billion.These findings are generally consistent with otherrecent independent findings and are far less thanthe original NAPAP estimates.12 EPA expects NOx costs to be no more than $1 billion annually,and likely less, from the limited analysis that hasbeen completed in this area.This leads to a morethan 40:1 benefit-cost ratio.Among the most
important factors in reducing SO2 program costswere changes in transportation and production ofcoal, which enabled sources to increase the use oflow-sulfur coal.The flexibility offered by the SO2program also may have enabled technologicalinnovations that lowered compliance costs. Forinstance, boiler adaptations and lower than expect-ed installation and operation costs for flue gasdesulfurization systems (scrubbers) reduced costsbelow original estimates.13 See Figure 23 on page24 for the combined estimated benefits of theARP, Clean Air Interstate Rule (CAIR), andClean Air Mercury Rule (CAMR).
acidrain05_mockup_FINAL.qxp 1/11/2007 5:04 PM Page 25

26 ✧ Acid Rain Program, 2005 Progress Report
Further National Controls to Protect HumanHealth and the Environment
A combination of existingprograms and future regulationsthat address the interstate trans-port of ozone and fine particlesand mercury deposition willhelp ensure further improve-ments in human health andenvironmental protection.Withthe Acid Rain Program (ARP),the NOx SIP Call in the easternUnited States, and mobile sourcerules covering new cars, trucks,buses, and nonroad equipment,states have critical controls tohelp achieve ozone and fineparticle National Ambient AirQuality Standards (NAAQS).
In the spring of 2005, EPApromulgated a suite of air qualityrules designed to achieve addi-tional reductions of SO2, NOx,and mercury from power plants.These rules include Clean AirInterstate Rule (CAIR), CleanAir Mercury Rule (CAMR),and Clean Air Visibility Rule(CAVR).14 See Figure 27 for animplementation timeline.
EPA expects that the airquality impacts of these regula-tions, coupled with recent rulesto reduce fine particles and NOxfrom motor vehicles, will beextensive. Figures 24-26 showareas projected to attain theNAAQS in 2010 and 2020 withthese regulations, compared totoday. Figure 24 shows ozoneand PM2.5 nonattainment areasprimarily occurring in easternstates and California.As the newrules are implemented, nonat-tainment is expected to declinesteadily, with 92 fewer areas by
LegendBoth PM and Ozone Nonattainment
PM Only Nonattainment
Ozone Only Nonattainment
Area Count
3
90
36
Figure 24: Ozone and Fine Particle Nonattainment Areas, April 2006
Source: EPA, 2006
LegendBoth PM and Ozone Nonattainment
PM Only Nonattainment
Ozone Only Nonattainment
Area Count
15
16
6
92Nonattainment Areas Projected to Attain
Figure 25: Projected Nonattainment Areas in 2010 AfterReductions From CAIR and Existing Clean Air Act Programs
Source: EPA, 2006
LegendBoth PM and Ozone Nonattainment
PM Only Nonattainment
Ozone Only Nonattainment
Area Count
13
7
3
106Nonattainment Areas Projected to Attain
Figure 26: Projected Nonattainment Areas in 2020 After ReductionsFrom CAIR, CAVR, and Existing Clean Air Act Programs
Source: EPA, 2006
Note: 129 areas currently designated as nonattainment for PM2.5 and/or 8-hour ozone.
Note: Areas forecast to remain in nonattainment may need to adopt additional local or regional controlsto attain the standards by dates set pursuant to the Clean Air Act. These additional local or regionalmeasures are not forecast here, and therefore this figure overstates the extent of expected nonattainment.
Note: Areas forecast to remain in nonattainment may need to adopt additional local or regional controlsto attain the standards by dates set pursuant to the Clean Air Act. These additional local or regionalmeasures are not forecast here, and therefore this figure overstates the extent of expected nonattainment.
acidrain05_mockup_FINAL.qxp 1/11/2007 5:05 PM Page 26

Acid Rain Program, 2005 Progress Report ✧ 27
Phase I : CAIR NOx Programs (ozone -season and annual)
(09)
Phase I : CAIR SO2 Program (10)
States develop SPs(18 months)
SIPs due(Sep 06)
CSP Early Emission Reduction Period (annual CAIR NOx program)
(07 and 08)
Phase II : CAIR NOx and SO2 Programs Begin
(15)
Early reductions for CAIR NOx ozone-seasonprogram and CAIR SO2 program begin
immediately because NOx SIP Call and Title IV allowances can be banked into CAIR.
Note: Dotted lines indicate a range of time.
05 06 07 08 09 10 12 13 1411 15
CAMR signed
181716
CAIR
CAMR and CAVR
CAIRsigned
SPs Due(Nov 06)
Phase I : CAMR Hg Program (10)
Phase II : CAMR Hg Program (18)Regional Haze (RH)
SIPs Due (Dec 07)CAVR BART Controls Required (5 years after RH SIPs approved)
CAVRsigned
FIP(June 06)
2010 (see Figure 25), and106 fewer areas by 2020 (seeFigure 26).
As the maps indicate,implementing these threenew regulations is an impor-tant step toward improvingair quality in the UnitedStates, protecting humanhealth and the environment,and helping states and localcommunities meet NAAQSfor fine particles and ozone.
Figure 27: CAIR, CAMR, CAVR Implementation Timeline
Source: EPA, 2006
About the Clean Air Markets DivisionThe availability and transparency of data, from emissionmeasurement to allowance trading to deposition monitoring,is a cornerstone of effective cap and trade programs. TheClean Air Markets Division in the Office of Air andRadiation’s Office of Atmospheric Programs develops andmanages programs for collecting these data and assessing theeffectiveness of cap and trade programs, including the AcidRain Program (ARP).
<www.epa.gov/airmarkets>
Regulatory InformationTo learn more about how emissions cap and trade programs work, see:
www.epa.gov/airmarkets/arpAcid Rain Program
www.epa.gov/airmarkets/progsregs/noxview.htmlNOx Budget Trading Program
www.epa.gov/airmarkets/capandtrade/index.htmlGeneral Cap and Trade Information
Also, See Recent Related Rulemakings:
www.epa.gov/cairClean Air Interstate Rule (CAIR)
www.epa.gov/CAMR/index.htmClean Air Mercury Rule (CAMR)
www.epa.gov/visibilityClean Air Visibility Rule (CAVR)
http://www.epa.gov/airmarkets/cair/analyses/naaqsattainment.pdfCAIR, CAMR, CAVR and NAAQS Attainment
Progress and ResultsSeveral reports have assessed the progress and results, and projectedfuture impacts of the Acid Rain Program.
www.sciencedirect.com/science/ journal/03014797Chestnut, L. G., Mills, D. M. (2005, November). A fresh look atthe benefits and costs of the U.S. acid rain program. Journal ofEnvironmental Management, Vol. 77, Issue 3, 252-256.
www.al.noaa.gov/AQRS/reports/napapreport05.pdf2005 National Acid Precipitation Assessment Program Report toCongress.
www.epa.gov/airmarkets/articles/adaq.html U.S. Environmental Protection Agency, Office of Air andRadiation, Clean Air Markets Division. (2005, September).The Acid Rain Program and Environmental Justice: Staff Analysis.
www.rff.org/Documents/RFF-RPT-Adirondacks.pdfBanzhaf, S., Burtraw, D., Evans, D., and Krupnick, A. (2004,September). Valuation of natural resource improvements in theAdirondacks. Resources for the Future.
www.adirondacklakessurvey.orgJenkins, J., Roy, K., Driscoll, C., Beurkett, C. (2005, October).Acid rain and the Adirondacks: A Research Summary. AdirondackLakes Survey Corporation.
Emissions, Allowances, and Environmental DataFor more information on emissions, allowances, and environmentaldata, see:
cfpub.epa.gov/gdmEPA Clean Air Markets Data and Maps
www.epa.gov/castnetClean Air Status and Trends Network (CASTNET)
www.epa.gov/airmarkets/deposition/2005atlas.pdfAtmosphere in Motion Results from the National DepositionMonitoring Networks: 2005 Atlas
nadp.sws.uiuc.eduNational Atmospheric Deposition Program/National Trends Network
Online Information, Data, and Resources
acidrain05_mockup_FINAL.qxp 1/11/2007 5:05 PM Page 27

28 ✧ Acid Rain Program, 2005 Progress Report
Endnotes1 See: <www.epa.gov/ttn/chief/trends.html> (Based on 2002 National Emissions Inventory).
2 Chestnut, L. G., Mills, D. M. (2005, November).A fresh look at the benefits and costs of the U.S. acid rain program. Journal of Environmental Management, Vol. 77, Issue 3, 252-256.
3 See: <www.epa.gov/ttn/chief/trends.html>.
4 Detailed emissions data for ARP sources are available on the Data and Maps portion of EPA’s Clean Air Markets Web site at<www.epa.gov/airmarkets>.Allowance transfers are posted and updated daily on <www.epa.gov/airmarkets>.
5 During 2005, EPA found that there were two small units at a plant that the Agency believes should have been in the ARP since 2000,and EPA is now working to resolve this legal issue.
6 Allowance transfers are posted and updated daily on <www.epa.gov/airmarkets>.
7 Gruenspecht, Howard. (2006, February 9). Deputy Administrator of the Energy Information Administration, Department of Energy.Statement before the Subcommittee on Clean Air, Climate Change, and Nuclear Safety of the Committee on Environment and PublicWorks in the United States Senate. p.3.
8 Other programs such as the NOx SIP Call, the OTC NOx Budget Program, and state laws also contribute to reductions, especiallyafter 2000.
9 Monitoring data from the Temporally Integrated Monitoring of Ecosystems (TIME) and Long-Term Monitoring network.
10 Chestnut and Mills, 2005.
11 Human Health Benefits from Sulfate Reduction under Title IV of the 1990 Clean Air Act Amendments. EPA-430-R-95-010.
12 See, for example:
Ellerman, D. (2003). Lessons from Phase 2 compliance with the U.S.Acid Rain Program. Cambridge, Massachusetts: MIT Center for Energyand Environmental Policy Research.
Carlson, C.P., Burtraw, D., Cropper, M., and Palmer, K. SO2 control by electric utilities:What are the gains from trade? Journal of Political
Economy,Vol. 108, No. 6: 1292-1326.
Office of Management and Budget. (2003). Informing Regulatory Decisions: 2003 Report to Congress on the Costs and Benefits of FederalRegulations and Unfunded Mandates on State, Local, and Tribal Entities. Office of Information and Regulatory Affairs.<www.whitehouse.gov/omb/inforeg/2003_cost-ben_final_rpt.pdf>.
13 EPA estimates recognize that some switching to lower-sulfur coal (and accompanying emission reductions) would have occurred in theabsence of Title IV as railroad deregulation lowered the cost of transporting coal from Wyoming’s Powder River Basin electric powerplants in the Midwest and as plant operators adapted boilers to different types of coal.
14 CAIR (see <www.epa.gov/cair/index.html>), CAMR (see <www.epa.gov/air/mercuryrule>), CAVR (see <www.epa.gov/oar/visibility/index.html>).
acidrain05_mockup_FINAL.qxp 1/11/2007 5:05 PM Page 28

acidrain05_mockup_FINAL.qxp 1/11/2007 5:05 PM Page 29

Recycled/Recyclable—Printed with Vegetable Oil Based Inks on 100% Postconsumer, Process Chlorine Free Recycled Paper
United StatesEnvironmental Protection Agency
Office of Air and RadiationClean Air Markets Division
1200 Pennsylvania Avenue, NW (6204J)Washington, DC 20460
EPA-430-R-06-015October 2006
www.epa.gov/airmarkets
acidrain05_mockup_FINAL.qxp 1/11/2007 5:05 PM Page 30