acknowledgements - abr magazinetotal automotive export earnings r164,9 billion r178,8 billion...
TRANSCRIPT


1
ACKNOWLEDGEMENTS
The author of the publication is Dr Norman Lamprecht. The report was produced and compiled on behalf of the Automotive Industry Export Council using various official sources of domestic and international data and information provided by NAAMSA, NAACAM, SARS and other industry stakeholders.
The data processing and editing by Prof Alet Tolmay, and design and outlay of the publication by Dr Selma Schiller are acknowledged with appreciation.
Financial support provided by the Department of Trade and Industry, to ensure the success of the Auto-motive Export Manual - 2019 - South Africa project, is also acknowledge with appreciation.
AIECP O Box 74166
Lynnwood Ridge0040
Tel: +27 12 807 0086Fax: +27 12 807 0671
Website: www.aiec.co.za

2
CONTENTS
Automotive Export Manual – 2019 – South Africa publication .......................................................................................4
South Africa and its automotive industry ...............................................................................................................................5
Representative South African automotive industry bodies..............................................................................................8
The Automotive Industry Export Council ............................................................................................................................. 10
The South African new vehicle market .................................................................................................................................. 14
Exports of vehicles ........................................................................................................................................................................ 19
Imports of vehicles ....................................................................................................................................................................... 23
Automotive clusters ..................................................................................................................................................................... 25
Automotive policy regime ......................................................................................................................................................... 29
Global new vehicle market features ....................................................................................................................................... 36
Methodology – Automotive trade data ................................................................................................................................ 39
Exports to regions ......................................................................................................................................................................... 41
Exports to countries ..................................................................................................................................................................... 63
Automotive components – exports by country ................................................................................................................. 70
Automotive components – exports by product ................................................................................................................ 82
Imports by country of origin ..................................................................................................................................................... 93
Automotive parts and components – imports ................................................................................................................... 97
Automotive industry trade balance .....................................................................................................................................100
Main automotive trading regions and countries .............................................................................................................103
South African automotive industry growth prospects ..................................................................................................108
Key motor industry contact details.......................................................................................................................................110

3
ABBREVIATIONS
AGOA African Growth and Opportunity Act
AIEC Automotive Industry Export Council
AIS Automotive Investment Scheme
APDP Automotive Production Development Programme
BLNS Botswana, Lesotho, Namibia and Swaziland (renamed eSwatini)
BRICS Brazil, Russia, India, China and South Africa
CBU Completely Built-up
CKD Completely Knocked Down
COMESA Common Market for Eastern and Southern Africa
CPI Consumer Price Index
DTI The Department of Trade and Industry
EAC East African Community
EU European Union
FDI Foreign Direct Investment
FOB Free on Board
FTA Free Trade Agreement
GDP Gross Domestic Product
IDZ Industrial Development Zone
MERCOSUR Mercado Común del Sur – Common Market of South America
MIDP Motor Industry Development Programme
NAACAM National Association of Automotive Component and Allied Manufacturers
NAAMSA National Association of Automobile Manufacturers of South Africa
NAFTA North American Free Trade Area
OEM Original Equipment Manufacturer (Vehicle Manufacturer)
OICA International Organisation of Motor Vehicle Manufacturers
PTA Preferential Trade Agreement
SA South Africa
SACU Southern African Customs Union
SADC Southern African Development Community
SARS South African Revenue Service
WTO World Trade Organisation
4
AUTOMOTIVE EXPORT MANUAL – 2019 – SOUTH AFRICA PUBLICATION
Market intelligence provides companies with a competitive edge. It entails the provision of information about a company’s markets (national or international), which has been gathered and analysed specifically for the purpose of accurate and confident decision-making in determining corporate strategies to either develop, penetrate or grow the market. Accurate and timeous data provides insight into current trading conditions, acts as an indicator of where the market is headed and assists companies to develop appropriate and enhanced strategies. Hence, in a rapidly changing business environment, the high value of data requires the availability of an efficient data management system to be prepared for both current and future business operations, and also to identify risks and pursue opportunities.
The Automotive Export Manual – 2019 – South Africa publication is an annual publication produced and compiled by the Automotive Industry Export Council (AIEC) – the recognised source of South African automotive trade data. The 2019 publication, as well as the previous 12 publications since 2007, provides a comprehensive guide on the export and import performance of the South African automotive industry under the current Automotive Production Development Programme (APDP). The aim of the manual is to identify and report on the major automotive export destinations, the major countries of origin, the main automotive export trade blocs, the most important automotive products being exported and imported, the top growth markets and products, as well as the impact of the trade arrangements enjoyed by South Africa on automotive trade patterns.
This Automotive Export Manual has become an essential publication that provides data to provide automotive decision-makers both in South Africa and internationally with market intelligence on the performance of automotive exports and imports in the country.

5
SOUTH AFRICA AND ITS AUTOMOTIVE INDUSTRY
The global economy is entering the Fourth Industrial Revolution, or Industry 4.0 – defined by evolving technological trends that are spearheading the computerisation of manufacturing and which have the potential to profoundly change the lives of millions of people around the world. Increasingly, technology is connecting the digital world with the physical one, resulting in new innovations such as artificial intelligence and self-driving cars. Smarter equipment and devices result in many advantages, while new technologies make production and use of new innovations cheaper and easier than ever. The benefits of Industry 4.0 span across several areas, such as cost, productivity, profitability and operations and manufacturers are actively seeking to control, streamline, optimise or enhance their operations.
The automotive industry is regarded as one of the most global of all industries with value chains spanning multiple countries across the globe. Consequently, the global automotive industry is predicated around trade as not even the US or China can produce every single automotive product. The emerging circumstances of Industry 4.0 call on countries to be more resolute and indeed smart in advancing their own national interests. Multidisciplinary solutions will be required to meet the additional demand and complexity of projects. Crucial steps to successfully make the transition include, responding effectively to changes by assisting business leaders and employees to become sensitive to the new environment, retraining, acquiring new skills, and setting up structures that support research and development with a focus on Industry 4.0 transition.
In South Africa, the automotive industry continues to reflect the power of combining good industrial policy and foreign investment, and is not only the backbone of the industrialisation drive in South Africa but is also key to ensuring greater economic growth. Manufacturing-driven growth has the highest impact on job creation. Furthermore, with its linkages throughout the economy, the country’s automotive industry is a turbo-charged engine for the manufacture and export of vehicles and automotive components to world markets.
In 2018, the export of automotive products reached a record amount of R178,8 billion, equating to 14,3% of South Africa’s total exports. As the largest manufacturing sector in the country’s economy, vehicle and component production accounted for 29,9% of South Africa’s manufacturing output in 2018, while the broader automotive industry’s contribution to the GDP stood at 6,8% (4,3% manufacturing and 2,5% retail). In addition, investments by the seven major OEMs in the country amounted to a further substantial R7,2 billion in 2018, along with the investment of R3,5 billion by the automotive component suppliers. The total automotive revenue in the ambit of the automotive business sphere in South Africa amounted to R503 billion in 2018.
The direct value-addition impact of the automotive industry on the South African economy is multiple times the level of support it receives from government, most of which is paid in the form of duty rebates, rather than direct fiscal costs. The following table highlights the significant social and economic contribution made by the domestic automotive industry in the context of the South African economy for 2017 and 2018.

6
Key performance indicators under the APDP – 2017 to 2018Indicator Performance
2017 2018
Population 56,52 million 57,73 million
Consumer Price Index (CPI) 5,3% 4,7%
South Africa’s GDP (current prices) R4 653,6 billion R4 873,9 billion
Broader automotive industry contribution to GDP 6,9% 6,8%
Vehicle and component production as % of South Africa’s manufacturing output 30,1% 29,9%
Average monthly employment by vehicle manufacturers 30 050 29 855
Automotive component sector employment 80 000 80 000
Capital expenditure – vehicle manufacturers R8,2 billion R7,2 billion
Capital expenditure – component sector R4,0 billion R3,5 billion
Total South African new vehicle sales 557 703 units 552 226 units
Total South African vehicle production 601 338 units 610 854 units
South Africa’s vehicle production as % of Africa’s vehicle production 58,8% 54,3%
South Africa’s global vehicle production ranking 22nd 22nd
South Africa’s global vehicle production market share 0,62% 0,64%
Vehicle ownership ratio per 1 000 persons 176 176
Vehicle parc (number of registered vehicles) 12,21 million 12,46 million
Total automotive export earnings R164,9 billion R178,8 billion
Automotive export value as % of total South African export value 13,9% 14,3%
Number of export destinations 149 155
Number of export destinations with export values more than doubling year-on-year 16 25
Top automotive country export destination in Rand value terms Germany Germany
Total South African vehicle exports 338 096 units 351 139 units
Value of vehicle exports R114,6 billion R127,5 billion
Top vehicle export destination in volume terms UK UK
Value of automotive component exports R50,3 billion R51,3 billion
Top automotive export component category in Rand value terms Catalytic converters Catalytic converters
Top automotive trading partner (imports and exports) in Rand value terms Germany Germany
Top automotive trading region (imports and exports) in Rand value terms EU EU
Top country of origin for total automotive imports in Rand value terms Germany Germany
Top country of origin for vehicle imports India India
Source: AIEC, Econometrix, NAAMSA/Lightstone Auto, NAACAM, OICA, SARS, StatsSA

7
The automotive industry in South Africa is a success story owing to the partnership between government and the sector to develop the industry. The automotive industry is a crucial job creator in the country’s economy and makes a significant contribution to the South African economy as a whole in terms of GDP, employment, compensation, government revenue, exports and capital investment.
It is encouraging that in spite of domestic and foreign economic headwinds, the seven OEMs have made investment commitments of R40 billion over the next five years. Investment at this scale is significant and will promote local value-addition, with almost R25 billion expected to be invested in domestically sourced components. The industry is therefore of key importance to the domestic economy, while the socio-economic contribution of the multinational corporations in the country is vital in contributing to the social upliftment of the regional communities where the industry is concentrated.
Government’s announcement of its commitment and support post-2020 provides an attractive proposition to global OEMs and their suppliers to realise the aspirations of a significant expansion in vehicle production volumes, much higher levels of localisation, substantial employment growth, as well as transformation in the domestic automotive industry.
The automotive industry in South Africa is a success story
owing to the partnership between government and the
sector to develop the industry.
8
REPRESENTATIVE SOUTH AFRICAN AUTOMOTIVE
INDUSTRY BODIES
South Africa’s pro-automotive government policy programme, favourable trade agreements, public-private partnerships, and industry associations have created an appealing environment for global automotive OEMs and automotive component suppliers to manufacture products in South Africa. Automotive industry bodies in the manufacturing and retail sectors of the industry include the National Association of Automobile Manufacturers of South Africa (NAAMSA), the National Association of Automotive Component and Allied Manufacturers (NAACAM), and the Retail Motor Industry Organisation (RMI). The major OEMs in South Africa, as well as NAACAM, are also affiliated to the independent African Association of Automotive Manufacturers (AAAM).
Businesses need a strong collective voice to do business in domestic and global markets. Representation at the highest levels, when new legislation is introduced or when changes to legislation may impact on businesses’ ability to do business or to protect their investments, is imperative. The automotive industry bodies in South Africa have a track record of making a difference and promoting the concept of unity, whilst affording members the opportunity to shape important decisions.
NAAMSA represents the collective, non-competitive interests of the new vehicle manufacturing industry in South Africa and comprises 20 companies involved in the production of passenger cars and commercial vehicles which collectively employ in the order of 30 000 people. NAAMSA also represents the interests of a further 21 companies involved in the importation and distribution of new motor vehicles in South Africa. The monthly NAAMSA/Lightstone Auto new vehicle sales reports and other data products are not only used by automotive industry professionals but also by various government departments and analysts looking to assess the financial health of the country. More information on NAAMSA and its activities can be accessed at www.naamsa.co.za.
NAACAM represents the interests of the automotive component manufacturers in the country. The association has 120 members, of which approximately 80% are first-tier suppliers with 200 regional manufacturing sites, in addition to 27 associate members who provide a wide range of services to members. The association currently also administers the South African Tyre Manufacturers Conference (SATMC) representing the four international companies that manufacture tyres in South Africa, namely Bridgestone, Continental, Goodyear and Sumitomo. Employment in the component sector, including enterprises that are not members of NAACAM, comprised around 80 000 people in 2018. More information on NAACAM, including the profiles and contact details of the major automotive component suppliers in South Africa, can be accessed at www.naacam.co.za.
The RMI represents the retail motor trade sector of the automotive industry, which includes more than 7 500 member businesses across 14 trade associations that are serviced out of six offices around the country. The National Automobile Dealers’ Association (NADA) is one of the 14 trade associations focusing on new vehicle franchise dealerships and qualifying used vehicle outlets. NADA represents and promotes the interests of 1 323 franchise and pre-owned motor vehicle dealers in South Africa. More information on the RMI can be accessed at www.rmi.org.za.

9
The AAAM was inaugurated in November 2015. The aim of the AAAM is to unlock the economic potential of the African continent by promoting a policy environment that is conducive to the development of the automotive sector. The AAAM aims to connect the major countries in Africa to establish a pan-African automotive industry collaboration which would lead to the creation of an automotive cluster. The AAAM’s mandate is therefore to engage with government, industry bodies and representatives from the African motor sector to provide advice on opportunities to formalise, develop and grow all aspects of the relevant domestic automotive industry. This includes promoting an investor-friendly regulatory framework that will support the development and implementation of policies to establish a viable automotive manufacturing industry on the continent for both vehicle assemblers and automotive component suppliers.
The aim of the AAAM is to unlock the economic potential of the African
continent by promoting a policy environment that is
conducive to the development of the automotive sector.

10
THE AUTOMOTIVE INDUSTRY EXPORT
COUNCIL
The global automotive landscape today is vastly different from that of 10, or even five years ago, and companies need to respond effectively to the changes. Exporters want to achieve the right exposure, establish and maintain their company’s position in a particular foreign market, while still being in control of what happens to the company’s product/s, its clients, its company’s reputation and brand, and of course, achieve results.
The Automotive Industry Export Council (AIEC) was established in 1999 and serves as the umbrella body for the South African automotive industry’s export promotion and development activities, and represents an important link between the industry and the Department of Trade and Industry (Dti). The purpose of the AIEC is to provide a cost-effective means of assisting companies in the automotive sector that are currently exporting, may be interested in exporting in future, or may become capable of exporting in future. The activities and administration of the AIEC are co-ordinated by the AIEC Board. The AIEC Board of Directors consists of Mr Renai Moothilal (Executive Director – NAACAM – Chairperson), Dr Norman Lamprecht (Executive Manager – NAAMSA), Mr Mike Mabasa (Executive Director – NAAMSA), as well as two ex-officio members from the Department of Trade and Industry, Mr Mzwakhe Mbatha and Mr Adriaan Adams.
Dr Norman LamprechtExecutive Manager
NAAMSA
Mr Mike MabasaExecutive Director
NAAMSA
Mr Renai MoothilalExecutive Director
NAACAM - Chairperson
Mr Mzwakhe MbathaEx-officio MemberDTI
Mr Adriaan AdamsEx-officio Member
DTI

11
The AIEC represents the interests of seven major motor vehicle manufacturers/exporters, namely, BMW, Ford, Isuzu, Mercedes-Benz, Nissan, Toyota and Volkswagen, as well as 13 manufacturers/exporters of trucks and buses, and about 500 automotive component suppliers in South Africa.
Together with the Dti, the seven major light vehicle OEMs and NAACAM currently fund the AIEC as a way of contributing towards developing, broadening and deepening the automotive supply chain in the country, and also to support smaller enterprises to ultimately become part of the supply chain.
Export promotion mechanisms that are employed by Trade and Investment South Africa (TISA) and the Dti, through support from the Export Marketing and Investment Assistance (EMIA) scheme, include national pavilions at trade shows, trade missions, and investment and trade initiatives. These interventions are aimed at creating visibility and market access for South African automotive component manufacturers to enable them to diversify into new export markets, as well as to integrate into global and regional value chains.
One of the AIEC’s key service offerings to stimulate export growth and deepen the export base is to facilitate participation in major automotive events abroad. Personal contact at trade shows, in particular those with a regional impact, remains a priority focus in the pursuit of opportunities. This is an effective way of establishing and building business relationships and forms the foundation for business strategies. During the 2018/2019 financial year, the AIEC and automotive component manufacturing companies participated in the Automechanika Frankfurt national pavilion in Germany from 11 to 15 September 2018 (www.automechanika.messefrankfurt.com), the South African national pavilion at Midest, Lyon, from 5 to 8 March 2019 (www.midest.com), as well as the NAACAM Show 2019, South Africa’s automotive component initiative, from 12 to 14 March 2019 (www.naacamshow.co.za).
South African automotive events in the 2019/2020 financial year include the South African Festival of Motoring scheduled to take place from 22 to 25 August 2019 at the Kyalami Grand Prix Circuit and International Convention Centre, Johannesburg (www.safestivalofmotoring.com) and a national pavilion at the Automechanika Johannesburg event which coincides with Futureroad Expo Johannesburg (commercial vehicles) and Scalex Johannesburg (transport systems, infrastructure and logistics solutions), scheduled to take place from 18 to 21 September 2019 at Nasrec, Johannesburg (www.Automechanikasa.co.za).
More information on the Automotive Industry Export Council can be accessed at www.aiec.co.za.


14
THE SOUTH AFRICAN NEW VEHICLE MARKET
South African new vehicle demand is met by a range of imported and domestically manufactured vehicles. The country has one of the most competitive trading environments in the world, and in 2018 offered consumers a choice of no fewer than 49 passenger car brands and 3 716 model derivatives. This afforded car buyers the widest choice to market-size ratio anywhere in the world. Similarly, in the light commercial vehicle segment, for the same period, there were 30 brands, with 656 model derivatives to choose from. South Africa had a vehicle parc (number of registered vehicles) of 12,46 million at the end of 2018, of which 7,34 million, or 58,9%, comprised passenger cars. The average age of the passenger car parc in 2018 was 9 years and 10 months, for the commercial vehicle parc, 10 years, and overall for the total vehicle parc, 9 years and 11 months. The vehicle ownership ratio in South Africa is in the order of 176 vehicles per 1 000 persons.
A close correlation exists between domestic new vehicle sales and the overall performance of the economy, as well as business and consumer confidence levels. Due to low GDP growth and pressure on consumers’ disposable income, South African new vehicle sales retreated into negative territory in 2018, to 552 226 units, down by 1,0% from the 557 703 units sold in 2017. Passenger cars and light commercial vehicles (LCVs), which contributed 66,1% and 28,9% of the total market, respectively, were down by 0,8% and 2,4%, from 2017 to 2018. Record fuel prices, a VAT increase from 14% to 15% in 2018, increases in emissions taxes, and the fuel levy all contributed to consumers delaying purchasing decisions. The 0,25% increase in interest rates, announced in November 2018, also negatively impacted new vehicle sales. However, new passenger car pricing in real terms continued to decline and ongoing incentivisation improved affordability. The South African truck market, however, provided some optimism with year-on-year sales increasing by 4,8%. The following table reveals the sales of passenger cars and commercial vehicles for 2014 through to 2018.
Sales of passenger cars and commercial vehicles – 2014 to 2018
Year Passenger cars Light commercial vehiclesMedium and heavy
commercial vehicles and buses
Total new vehicle sales
2014 438 937 173 811 31 509 644 257
2015 412 397 174 812 30 441 617 250
2016 361 265 159 316 26 971 547 552
2017 368 114 163 317 26 272 557 703
2018 365 242 159 449 27 535 552 226
Source: NAAMSA/Lightstone Auto
The domestic new vehicle market is likely to consolidate further in 2019. Current market conditions are characterised by a buying-down trend in favour of entry-level vehicles, as well as small SUVs and crossovers, and moving out of the premium market segment. SUVs, however, comprised a substantial 28,8% of total passenger car sales, and the performance of this popular segment was aligned with global trends. Passenger car sales through the dealer channel, which is representative of consumer activity, comprised 81,0% of total sales in 2018, followed by 12,8% to the vehicle rental industry, 3,6% to industry corporate fleet sales and 2,6% to government.

15
The business environment is changing at a rapid pace in view of new technologies, changed customer expectations and new market players. Qualified sales and service partners, an established logistics network, a strong product portfolio and extremely loyal customers would place a company on a strong footing for the future. A wide variety of tailor-made offerings and solutions, adapted to changing customer needs, will be key ingredients for success.
Passenger car models manufactured in South Africa in 2018 included the following:
BMW 3-Series 4-door and X3 (launched in 2018)Ford EverestMercedes-Benz C-Class 4-doorToyota Corolla 4-door new and previous series (designated Quest) and FortunerVolkswagen Polo new and previous series (designated Vivo)
Light commercial vehicle models manufactured in South Africa in 2018 included the following:
Ford Ranger Isuzu Motors KB and D-MaxNissan NP200, NP300 HardbodyToyota Hilux and Quantum
Toyota was the leading automotive brand in South Africa in 2018, celebrating 39 years of market leadership with a market share of 24,2%, followed by Volkswagen Group of SA, Ford Motor Company of Southern Africa and Nissan South Africa. The Volkswagen Group brand retained leadership in the South African passenger car market for the eighth successive year, with the Polo Vivo and Polo once again the two best-selling passenger cars in the country in 2018.
Nine of the top 10 selling vehicles in 2018 were South African-built passenger cars and light commercial vehicles. The top 10 most popular models sold included five light commercial vehicle models, namely, the Toyota Hilux, Ford Ranger, Nissan NP200, Toyota Quantum, and Isuzu KB/D-Max and five passenger cars, namely, the Volkswagen Polo Vivo, Volkswagen Polo, Toyota Fortuner, Hyundai Grand i10 (imported from India, the only exception), and the Toyota Corolla Quest.
Light commercial vehicles remained the most popular vehicle sold in South Africa. The Toyota Hilux has been the top-selling one ton light commercial vehicle for the 46th time in its 49 years on the domestic market. This also ensured that a light commercial vehicle remained the most popular vehicle sold in the South African market, with the Hilux selling 40 022 units and the Ford Ranger selling 30 135 units, followed by sales of 26 514 units by the top-selling passenger car, the Volkswagen Polo Vivo. The following graph reveals the market shares of the top 10 OEMs/Importers in the country in 2018.

16
Overall new vehicle market share – 2018
Source: NAAMSA/Lightstone Auto
In 2018, new diesel passenger car and light commercial vehicle sales accounted for 35,9% of the market share of total light vehicle sales, up from 34,6% in 2017. The trend in Europe and the UK is on phasing out diesel engines by making diesel fuel very expensive. Hybrid petrol and diesel vehicle sales in the domestic market comprised 144 units in 2018, down from the 303 units in 2017, while electric car sales declined from 68 units in 2017 to 58 units in 2018.
Although electric vehicles (EVs) are making headlines, they are not yet a market force and currently comprise only about 1,5% to 2% of global vehicle sales. EV sales, in general, enjoy support from a large number of governments worldwide in an effort to reduce the transport industry’s carbon footprint within cities, especially those battling pollution. An increasing number of South African OEMs have indicated that they plan to introduce EVs in the next two years in the domestic market. An increase in sales would depend on customer preferences and the development of public charging infrastructure. The following table reveals the split between the sales of new petrol and diesel cars and light commercial vehicles in South Africa from 2014 through to 2018.
Petrol versus diesel passenger cars and light commercial vehicle sales – 2014 to 2018
2014 2015 2016 2017 2018
Diesel cars and diesel LCVs 190 332 190 305 175 842 184 000 188 284
Petrol cars and petrol LCVs 421 756 396 397 344 258 347 060 336 286
Total cars and LCVs 612 088 586 702 520 100 531 060 524 570
Diesel vehicles as % of total cars and LCV sales 31,1% 32,4% 33,8% 34,6% 35,9%Source: NAAMSA/Lightstone Auto
Toyota 24.2%
Volkswagen group SA 16.3%
FMC 10.5%Nissan 10.0%
Hyundai automotive SA 6.5%
Renault 4.6%
Mercedes-Benz SA 4.1%
Isuzu motors SA 3.7%
BMW group 3.3%
Kia South Africa 3.1%
Other 13.7%

17
The heavy commercial vehicle sector in South Africa is characterised by a large number of company brands. The challenge does not lie in the total numbers but in the massive variety of vehicle applications that make up the relatively small market, from a 4-ton gross vehicle mass (GVM) freight carrier up to a 56-ton gross combination mass (GCM) vehicle combination. In 2018, the medium commercial vehicle segment consisted of 17 brands with 156 model derivatives to choose from; in the heavy commercial vehicle segment there were 14 brands with 135 model derivatives; in the extra-heavy commercial vehicle segment there were 19 brands with 502 model derivatives; and in the bus segment there were 8 brands with 46 model derivatives.
In 2018, the following medium, heavy and extra-heavy commercial vehicle companies were represented in South Africa:
Babcock Bell Equipment Eicher TrucksFAW Trucks Fiat Chrysler Automobiles SA Ford Motor CompanyHyundai Automotive SA Isuzu Motors SA IvecoJMC MAN Mercedes-Benz SA (Freightliner and Fuso)Peugeot Citroen SA Powerstar SA ScaniaTata Trucks Toyota (Hino) Volkswagen Group SA Volvo Group Southern Africa
In 2018, the following bus companies were represented in South Africa:
Isuzu Motors SA Iveco MANMarcoPolo Mercedes-Benz ScaniaTata Volvo Group Southern Africa
The truck market is linked directly to the economy as it is business confidence that inspires investment in trucks. Mobility and economic growth enjoy a mutually reinforcing, interdependent relationship due to the strong correlation between economic growth and the ability to move goods and services. A key driver of economic growth is the investment in transport, logistics and infrastructure, to improve the movement of goods.
All heavy commercial vehicle segments recorded improvements from 2017 to 2018, reflecting an improvement in capital investment, but this could largely be attributed to replacement of ageing vehicles within existing fleets rather than expansion of those fleets. The sharp increase in diesel prices remains a source of great concern to the transport industry. Isuzu Truck South Africa has held onto its position for five consecutive years as the best-selling truck brand in the medium and heavy commercial segments, Volvo Group Southern Africa was the leader in the extra-heavy commercial vehicle segment, and MAN in the bus segment in 2018. The following table reveals the sales of medium, heavy, extra-heavy commercial vehicles and buses from 2014 through to 2018.
Sales of medium and heavy commercial vehicles and buses – 2014 to 2018 MEDIUM AND HEAVY COMMERCIAL VEHICLES AND BUSES
Market
MCV HCV XHCV Buses Total
2014 10 983 5 487 13 775 1 264 31 509
2015 10 522 5 668 13 128 1 123 30 441
2016 8 436 5 468 11 815 1 252 26 971
2017 7 890 5 305 11 978 1 099 26 272
2018 7 914 5 392 13 159 1 070 27 535Source: NAAMSA/Lightstone Auto

18
The commercial vehicle sector provides a vital service to consumers. It is not just movement itself, but how efficiently movement takes place, that fuels the economy. This means the better the road network and its maintenance, the more effective the transport businesses, and the more sophisticated the logistics solutions, the more smoothly the economy will run.
Growth in the South African economy is dependent on a successful transport industry. Medium and heavy commercial vehicles are regarded as productive assets and essential capital inputs in the economy. The level of protection on these vehicles has therefore been set at 20% ad valorem, which is lower than the level on light commercial vehicles and passenger cars, which attract an import duty of 25% ad valorem. Assembly operations of trucks and buses receive the benefit of the duty-free importation of all driveline components, which include the engines, transmissions, drive-axles and gearboxes. However, tyres, which are manufactured domestically, attract a 15% import duty.
The commercial vehicle sector provides a vital service
to consumers. It is not just movement itself, but how
efficiently movement takes place, that fuels the economy.

19
EXPORTS OF VEHICLES
South Africa manufactures a broad range of vehicles, including passenger cars, light commercial vehicles, medium commercial vehicles, heavy commercial vehicles, extra-heavy commercial vehicles and buses. Domestic vehicle production increased to 610 854 units in 2018, from 601 338 units in 2017 – rising by 9 516 vehicles, or 1,6%. Vehicle production in 2018 was supported by the record number of 351 139 left- and right-hand drive vehicles that were exported to 104 countries around the world.
In 2018, light vehicle (passenger cars and light commercial vehicles) exports accounted for 60,1% of total domestic light vehicle production. Of the 351 139 units exported in 2018, passenger car exports comprised 221 681 units, or 63,1% of the total; light commercial vehicles comprised 128 322 units, or 36,6% of the total; and medium and heavy commercial vehicles and buses comprised 1 136 units, or 0,3% of the total. Five OEMs have export contracts beyond Africa, with two OEMs producing mainly for the South African and sub-Saharan African market.
The South African market is generally not large enough to generate sufficient economies of scale, consequently exporting remains key to achieving improved international competitiveness, and hence, ensuring the sustainability and viability of the vehicle manufacturing industry in South Africa. Domestically manufactured vehicles are therefore not necessarily destined for sale in the domestic market, but are destined to generate import credits so that the imported vehicles demanded by consumers can be offered at more favourable prices by rebating the import duty.
Most OEMs have grown their volumes substantially and now produce a very high proportion of vehicles for the export market. During 2018, three models achieved production volumes in excess of 100 000 units and one at 99 700 units. Significant rationalisation of the production of light vehicle models in South Africa has taken place under the MIDP and the APDP, resulting in a reduction from 42 platforms two decades ago to 11 platforms in 2018. A key challenge that remains in the industry is to raise local value-addition levels in South African manufactured vehicles, which would result in benefits such as improved supplier efficiencies, the avoidance of currency volatility, logistics cost savings, domestic job creation, skills development, and technology transfers.
The following table reveals that the top export destinations for passenger cars and LCVs in terms of number of units in 2018 were the UK, Japan, Germany and France. Mercedes-Benz, with its C-Class model, continued to be the pace-setter in terms of exported vehicles in 2018. Although the appetite of African countries to import built-up vehicles from South Africa increased again in 2018, no African country, for the third consecutive year, featured under South Africa’s top 10 vehicle export destinations. Kenya, with 3 213 units, was the top destination for South African vehicle exports on the African continent in 2018. Regulation changes deprived support for new imported vehicles purchases in a number of countries on the continent. Developments in Algeria and Nigeria in particular, two of the domestic industry’s top export destinations in recent years, exacerbated the situation.

20
Top 10 destinations for light vehicles (passenger cars and light commercial vehicles) exported – 2014 to 2018
Country 2014 2015 2016 2017 2018
Total (R billion) 66,3 98,0 114,0 110,9 123,2
Ranking of exportersNumber 1 to Number 5
ToyotaBMW
VWFord
MBSA
MBSAVW
BMWFord
Toyota
MBSAVW
BMWFord
Toyota
MBSAVW
FordBMW
Toyota
MBSAVW
FordToyotaBMW
UK 61 073 104 098 110 356 98 358 119 578
Japan 25 097 15 828 33 296 42 492 44 027
Germany 9 337 9 915 12 297 10 423 25 513
France 13 558 16 130 19 204 19 055 23 400
Australia 13 100 21 197 21 446 23 336 21 594
USA 42 319 48 899 47 627 40 414 11 440
Spain 3 351 4 541 3 895 5 770 10 833
Italy 1 403 2 892 6 238 5 088 8 870
Belgium 4 788 8 772 8 116 6 902 6 338
Poland 981 947 5 188 5 285 5 425
Other 100 515 99 506 76 103 79 982 72 985
Total (units) 275 522 332 725 343 766 337 105 350 003
Light vehicle production 533 650 583 883 571 791 574 075 582 183
% of production exported 51,6% 57,0% 60,1% 58,7% 60,1%Source: NAAMSA/Lightstone Auto, SARS
A strong domestic and regional base is imperative for exports to other regions. The following table reveals that vehicle exports into Europe, Africa, Central and South America reflected growth in 2018, with the EU, on the whole, dominating as a region. Africa’s medium- to long-term potential remains positive as the continent has a low level of motorisation, as well as a growing middle class – ingredients which predict a growing demand for new vehicles. The increase in vehicle exports into Africa suggests that demand from the continent has stabilised and is starting to recover, albeit from a low base over the past three years, compared to the 61 015 vehicles exported in 2014. Exports to North America declined substantially from 2017 to 2018, which could be attributed to the same BMW and Mercedes-Benz models being manufactured in the US, which used to be the top export market for previous model ranges manufactured in South Africa by the two OEMs.
A strong domestic and regional base is imperative for exports to other regions.

21
Changing composition of South African vehicle exports by major regions: 2014 to 2018
Region 2014 2015 2016 2017 2018 % change2018 / 2017
Europe 116 064 173 883 196 727 190 503 233 772 +22,7%
Asia 34 031 34 929 46 655 52 827 50 277 -4,8%
Africa 61 015 41 431 21 505 21 848 23 988 +9,8%
Australasia 14 608 22 946 22 735 25 125 22 767 -9,4%
North America 48 136 53 606 52 024 43 393 13 037 -70,0%
South America 2 482 6 554 4 750 3 588 5 787 +61,3%
Central America 600 496 410 812 1 511 +86,1%
Total 276 936 333 845 344 816 338 096 351 139 +3,9%
Source: NAAMSA/Lightstone Auto
Exports of medium and heavy commercial vehicles and buses comprised only 0,3% of the total vehicle exports in 2018, and in relation to passenger cars and light commercial vehicles, have been relatively insignificant in terms of volumes. In 2018, a total of 1 136 trucks and buses were exported, up by 145 units, or 14,6%, from the 991 units exported in 2017. With the exception of extra-heavy commercial vehicle exports, which declined by 5,6%, from 662 units in 2017 to 625 units in 2018, the other segments performed exceptionally well. Heavy commercial vehicle exports reflected a year-on-year increase of 35%, from 160 units in 2017 to 216 units in 2018; medium commercial vehicle exports increased by a substantial 61,2%, from 116 units in 2017 to 187 units in 2018; while bus exports rose by a significant 107,7% to 108 units in 2018 from the 52 units in 2017.
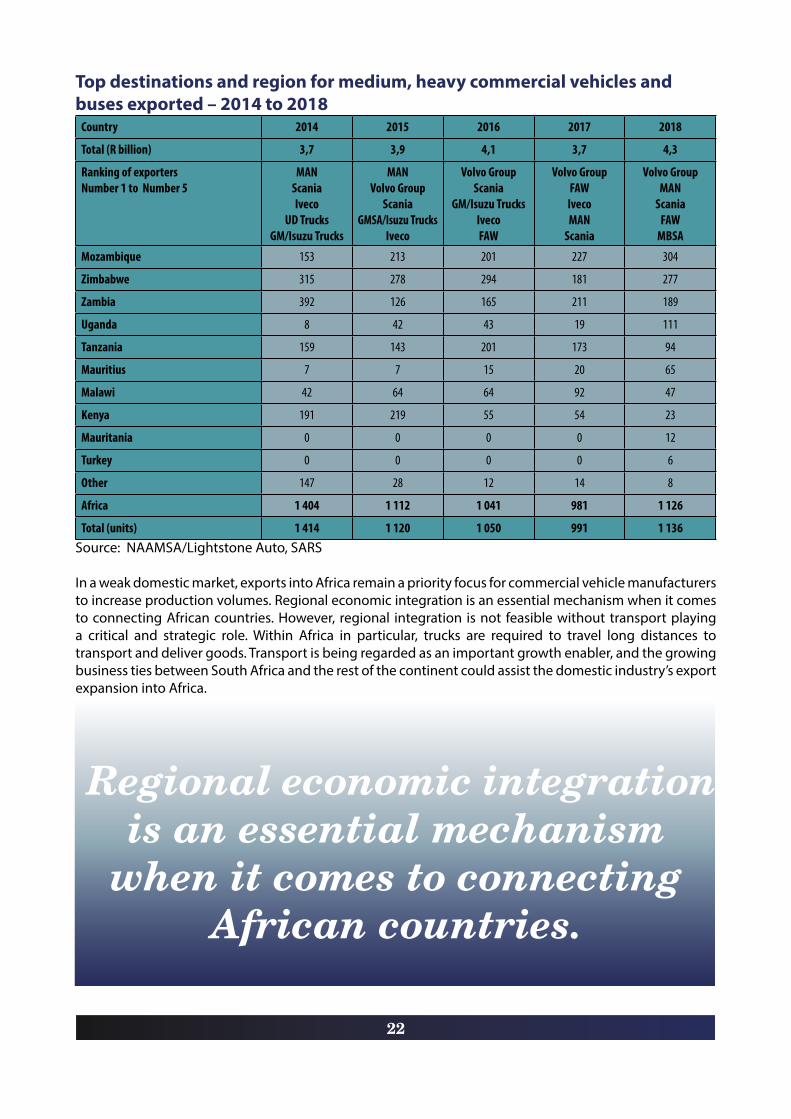
Mozambique was the overall top destination for all truck and bus exports in 2018. For extra-heavy commercial vehicles and buses, the top destination in 2018 was Mozambique, while for heavy commercial and medium commercial vehicles the top destination was Zimbabwe. The following table reveals that the main export destinations for trucks and buses have consistently been South Africa’s neighbouring countries in the SADC region.
Mozambique was the overall top destination for all truck
and bus exports in 2018.
22
Top destinations and region for medium, heavy commercial vehicles and buses exported – 2014 to 2018
Country 2014 2015 2016 2017 2018
Total (R billion) 3,7 3,9 4,1 3,7 4,3
Ranking of exportersNumber 1 to Number 5
MANScaniaIveco
UD TrucksGM/Isuzu Trucks
MANVolvo Group
ScaniaGMSA/Isuzu Trucks
Iveco
Volvo GroupScania
GM/Isuzu TrucksIvecoFAW
Volvo GroupFAW
IvecoMAN
Scania
Volvo GroupMAN
ScaniaFAW
MBSA
Mozambique 153 213 201 227 304
Zimbabwe 315 278 294 181 277
Zambia 392 126 165 211 189
Uganda 8 42 43 19 111
Tanzania 159 143 201 173 94
Mauritius 7 7 15 20 65
Malawi 42 64 64 92 47
Kenya 191 219 55 54 23
Mauritania 0 0 0 0 12
Turkey 0 0 0 0 6
Other 147 28 12 14 8
Africa 1 404 1 112 1 041 981 1 126
Total (units) 1 414 1 120 1 050 991 1 136Source: NAAMSA/Lightstone Auto, SARS
In a weak domestic market, exports into Africa remain a priority focus for commercial vehicle manufacturers to increase production volumes. Regional economic integration is an essential mechanism when it comes to connecting African countries. However, regional integration is not feasible without transport playing a critical and strategic role. Within Africa in particular, trucks are required to travel long distances to transport and deliver goods. Transport is being regarded as an important growth enabler, and the growing business ties between South Africa and the rest of the continent could assist the domestic industry’s export expansion into Africa.
Regional economic integration is an essential mechanism
when it comes to connecting African countries.
23
IMPORTS OF VEHICLES
In 2018, the 291 402 new light vehicles (passenger cars and light commercial vehicles) imported into South Africa originated from 24 countries. Imports of light vehicles declined by 1 863 units, or 0,6%, from the 293 265 units in 2017 to 291 402 units in 2018, in line with the decline of 1,0% in aggregate new vehicle sales in the domestic market. Light vehicle imports comprised 55,5% of the total light vehicle sales in 2018, slightly up from the 55,2% in 2017.
In 2018, 72,6% of passenger cars sold in South Africa were imported. An important aspect of the South African automotive industry is the relationship between imports and domestic production as governed by the automotive policy regime in South Africa. The previous MIDP and current APDP encourage domestic OEMs to manufacture high volumes of selected models linked to export contracts to obtain economies of scale, coupled with low-volume models imported to complement domestic market mixes. The OEMs and independent vehicle importers can offset vehicle and original equipment component import duties through duty rebate mechanisms that have been structured to support both the competitiveness and sustainability of the domestic automotive industry.
South African consumers benefit from access to a wide variety of new models and a highly competitive pricing environment. Every brand has a benchmark product in just about every segment of the market. The domestic model mix is thus arranged to provide the most effective marketing combination of domestically manufactured and imported models to satisfy a consumer-driven market.
India, with 98 586 units and accounting for 33,8% of the total light vehicles imported, was the top country of origin in volume terms for passenger cars and LCVs imported into South Africa in 2018. India’s profile is suited to produce small vehicles, which dominate its large domestic market, and global OEMs have therefore recognised India’s capabilities in this product range by allocating their global production of small vehicles to the country. Most of the vehicles imported from India into the domestic market were therefore entry-level or small vehicles. Volkswagen’s Polo Vivo was the only vehicle in these segments manufactured in the country in 2018.
Although the volume leader with respect to imports was India, the value of Indian imports was less than half of those imported from Germany, which included the premium brands such as Audi, BMW, Mercedes-Benz and Porsche. The following table reveals that in volume terms, India, followed by Germany, Japan and South Korea were the top countries of origin for vehicles imported into South Africa in 2018.
Every brand has a benchmark product in just about every
segment of the market.

24
Top 10 countries of origin for light vehicles (passenger cars and light commercial vehicles) imported – 2014 to 2018
Country of origin 2014 2015 2016 2017 2018 2018
Total value (R billion) R53,7 R59,6 R53,6 R57,7 R57,1 Import value %
India 95 279 87 892 73 003 89 724 98 586 15%
Germany 60 012 58 366 56 072 55 480 41 791 22%
Japan 30 891 34 753 36 059 37 795 36 386 12%
South Korea 49 211 40 343 36 649 32 643 27 458 6%
Thailand 8 816 9 213 7 849 6 620 15 711 6%
UK 20 472 15 817 12 260 10 591 10 314 7%
Spain 15 124 17 980 14 544 10 387 9 439 5%
Indonesia 7 033 6 231 5 793 5 476 7 928 2%
France 10 619 9 231 8 348 6 255 6 670 2%
Romania 4 339 7 308 6 295 5 052 5 773 2%
Other 50 807 47 315 34 620 33 242 31 346 21%
Number of light vehicle imports 352 603 334 449 291 492 293 265 291 402
Total light vehicle market 612 748 587 209 520 581 531 431 524 691
% of new vehicle market imported 57,5% 57,0% 56,0% 55,2% 55,5%Source: NAAMSA/Lightstone Auto, SARS
A process of homologation is required before any motor vehicle model can be introduced into the South African market. The homologation procedure of the National Regulator for Compulsory Specifications (NRCS) is intended to ensure that all new vehicle models comply with the relevant South African legislation, standards and specifications, as well as codes of practice, before use by the public on public roads. This eliminates the risk of having to withdraw a sub-standard motor vehicle model from the market, and it reduces the possibility of resultant legal action against the supplier.
Used vehicle imports are not allowed into South Africa. Strict control measures ensure that only a limited number of legal import permits are issued to allow specified used vehicles into South Africa. In terms of current legislation, used vehicles qualifying for an import permit include those for immigrants, returning South African residents and nationals, specifically adapted vehicles for persons with physical disabilities, vehicles inherited by South African citizens/nationals, vintage and collectors’ passenger vehicles, and racing cars. Without a legal import permit, imported used vehicles cannot be registered on the National Transport Information System (NaTIS). The system also combats stolen and non-complying vehicle registrations. All vehicle manufacturing plants in South Africa have been linked to the on-line system to facilitate the collation of data of vehicles manufactured. Left-hand drive vehicles are also not allowed into the country. More information with respect to used vehicle imports and relevant application forms can be accessed at www.itac.org.za.

25
AUTOMOTIVE CLUSTERS

26
As the only African member of the G20 and BRICS, South Africa established itself as a dynamic democracy and a regional powerhouse with the most modern and diversified economy on the continent. South Africa remains one of the most appealing destinations in Africa for foreign direct investment, and its demographic profile ensures that it is the ideal springboard to focus on Southern Africa and beyond. With the largest presence of multinationals on the continent, South Africa is the multinationals’ location of choice. Investors seeking to enter the South African market, also often use the country as a gateway into the rest of the African continent. South Africa’s strategic location at the core of major routes affirms itself as a key hub for local, regional and global trade flows.
South Africa’s constitution established nine provinces, each with its own premier, cabinet and legislature. The provinces vary substantially in size, prosperity, geography, ethnicity, population and performance. Per capita GDP is highest in Gauteng and lowest in the Eastern Cape. National, provincial and local government support, in collaboration with several automotive industry associations, has created a favourable environment for vehicle and automotive component production in South Africa. Incentives are administered by the Dti and are uniform throughout the country. However, support for the South African automotive industry exists at two levels – national and regional. National support, like the APDP and the Automotive Supply Chain Competitiveness Initiative (ASCCI), plays an important role in addressing common industry challenges in the context of the national economy. Regional support mechanisms, by contrast, offer the opportunity to address the specific needs of industry in specific geographic areas, and might include mechanisms to foster skills and training development, innovation, and provincial agencies that focus on facilitating export growth or attracting foreign direct investment (FDI), amongst others.
The automotive industry makes a huge impact on the economies of Gauteng, the Eastern Cape and KwaZulu-Natal. The OEMs are at the centre of the three regional clusters, and along with their suppliers, are supported across the economic landscape at national, provincial and municipal levels.
Gauteng
Gauteng produces about a third of South Africa’s GDP. Although it is the smallest province, it is the most populous, being home to 14,72 million people, or 25,5%, of the national population of 57,73 million. Johannesburg is the capital of the Gauteng province, while Pretoria is the administrative capital of South Africa. The province is strategically located on the African continent which makes it a key investment destination for the rest of the world, and a trade gateway for imports and exports. The country’s biggest airport, OR Tambo International Airport, is at the core of the province’s logistical network. Tshwane, which includes Pretoria, is home to many government departments and services, and is the base of the automotive industry in Gauteng. The highest diversity in the country’s automotive profile is found in Gauteng, with the province housing three OEMs and the highest number of automotive component suppliers in the country.
KwaZulu-Natal
KwaZulu-Natal represents the second-largest economy in the country, after Gauteng, and is also the province with the second-highest population, with a share of 19,7%, or 11,38 million, of the country’s 57,73 million population. Durban is South Africa’s third-largest city and the country’s busiest port. The port of Durban is modern and well equipped and the city has emerged as the de facto coastal trade gateway to southern Africa. It boasts the largest port in Africa, in terms of value of cargo, and is South Africa’s premier general cargo and container port. Richards Bay is South Africa’s busiest bulk port, with at its centre, the Richards Bay Industrial Development Zone (IDZ), a purpose-built and secure industrial estate. King Shaka International Airport and the Dube TradePort at La Mercy provide easy access to Durban and also to international markets. The Dube TradePort is Africa’s first purpose-built aerotropolis. It is the only facility in

27
Africa that brings together an international airport, a cargo terminal, warehousing, offices, a retail sector, hotels, and an agricultural area. An expansion of R18 billion has recently been announced for another round of development of the aerotropolis.
Eastern Cape
The Eastern Cape, comprising 6,52 million, or 11,3%, of the country’s 57,73 million population, enjoys an abundance of natural and human resources, as well as an established industrial infrastructure that drives the economy of the province. The province is well served logistically with airports situated in Port Elizabeth, East London, Mthatha and Bisho, and with ports situated in Port Elizabeth, Coega and East London. The Coega IDZ is the largest IDZ in the country, and is the main catalyst for socio-economic development in the Eastern Cape, while the East London IDZ, one of the country’s leading specialised industrial parks, has also established an Automotive Supplier Park. The biggest news for the Coega IDZ in 2016 was the announcement of an R11 billion investment by Chinese state automotive manufacturer, Beijing Automotive International Corporation (BAIC) and South Africa’s Industrial Development Corporation (IDC). BAIC is taking a 65% stake in a joint venture with the IDC, at 35%, in the Coega IDZ. This follows the R600 million investment of First Automotive Works (FAW), also a Chinese enterprise.
Automotive clusters – key automotive features – 2018 Key automotive features Gauteng KZN EC
Number of OEMs (manufacturing plants) BMW SANissan SA
Ford Motor Company of Southern Africa
Toyota SA Motors Volkswagen Group SAMercedes-Benz SA
Isuzu Motors SAFord Motor Company of Southern Africa engine
plant
Medium, heavy, extra-heavy commercial vehicle and bus companies
Babcock, Eicher Trucks, Fiat Group, Ford, Hyundai, Iveco, JMC, MAN Truck & Bus, MarcoPolo, Peugeot
Citroen, Powerstar SA, Scania, Tata Trucks and Volvo Group Southern
Africa
Bell Equipment, MAN Truck & Bus and Toyota (Hino)
FAW Trucks, Isuzu Truck, Mercedes-Benz SA
(Freightliner and Fuso) and Volkswagen Group SA
Number of automotive component companies 200 80 150
Motor vehicle parc as % of South Africa’s total vehicle parc of 12,46 million vehicles 38,5% 13,3% 6,6%
Passenger car sales as % of total 2018 passenger car sales of 365 242 units 35,2% 12,6% 3,8%
LCV sales as % of total 2018 LCV sales of 159 449 units 34,6% 12,4% 5,4%
MCV/HCV sales as % of total 2018 MCV/HCV sales of 27 535 units 37,7% 13,4% 4,6%
Light vehicle production by OEMs in the province as % of total 2018 light vehicle production of 582 183 units 33,2% 23,5% 43,3%
Light vehicle exports by OEMs in the province as % of total 2018 light vehicle exports of 350 003 units 34,6% 14,8% 50,6%
Source: NAACAM, NAAMSA/Lightstone Auto

28

29
AUTOMOTIVE POLICY REGIME
On 22 November 2018, Cabinet adopted Phase 2 of the APDP, to support the South African Automotive Masterplan (SAAM) from 2021 to 2035. SAAM is the newly developed strategy plan for the long-term development of the South African automotive industry, and the APDP Phase 2 will now operate within the framework of the Masterplan. The framework places local value-addition at the centre of any future support for the industry. The SAAM’s 2035 vision is the achievement of “a globally competitive and transformed industry that actively contributes to the sustainable development of South Africa’s productive economy, creating prosperity for industry stakeholders and broader society”. Amendments to the APDP will provide the incentive framework for the industry for the period from 2021 to 2035. The Masterplan will create a framework to secure even higher levels of investments and production, and will enable the industry to plan for the future and invest with confidence. A key summary of the SAAM 2021-2035 is as follows:
• Grow South African vehicle production to 1% of global production by 2035;
• Increase local content in South African manufactured vehicles to 60%;
• Double automotive employment in the supply chain;
• Improve automotive industry competitiveness levels to that of leading international competitors;
• Transformation of the South African automotive value chain; and
• Deepen value-addition within South African automotive value chains.
The Masterplan will have to cement the domestic industry’s position in a rapidly changing and ever-more competitive global environment. The APDP Phase 2 operates within the framework of the Masterplan, as do interventions in a number of other focus areas. The sector recognises that the SAAM vision will only be realised if the six development objectives are met. Achieving the SAAM objectives indicated will require careful co-ordination and a close working relationship between government, the private sector and organised labour. Six industry development pillars have been identified as being critical to the realisation of the SAAM. The six pillars relate to domestic market optimisation, regional market development, localisation, infrastructure development, industry transformation and the development of industry-required technologies and skills.
The APDP policy amendments under the SAAM 2021-2305 are summarised in the following tables, covering light vehicles, medium and heavy commercial vehicles, and motorcycles.

30
Light vehicle policy amendments – 2021 to 2035Incentive Amendments SAAM Rationale
Tariffs (CBU and CKD) • No change to CBU and CKD tariffs• Align CBU duties from the EU-SADC EPA (subject to
engagements with the EU)
• South African market adequately protected• Address misalignment
Vehicle assembly (VALA) • Volume Assembly Localisation Allowance (VALA) to replace Volume Assembly Allowance (VAA) in 2021: VALA based on local value addition and not manufacturing sales value
• VALA set at 35% of local value add for OEMs above 10 000 units annually from 2026. Transition set at 40% in 2021 and reducing annually
• Tie incentive directly to South African localisation levels of OEMs, thereby eliminating existing VAA distortions
• Existing OEM model investments covered by transition to VALA over six years (2021-2026)
• Ensure CKD duty exposure for local market assembly
Production (Production incentive) • Production incentive benefit factor increased to 25% (was 20%) for components (increase from 10% to 12,5% of value addition)
• Duty credits to replace Production Rebate Credit Certificates (PRCCs)
• Removal of vulnerable status benefits
• Incentive for deeper localisation: Additional support for Tier 1 and Tier 2 automotive activity
• Increased support for aftermarket and export component production
• Remove use of PRCC distortions within the APDP
Investment (AIS) • Maintain cash grant for investment, but reduce by 5% if not South African tooling/machinery
• Maintain capital investment support, but encourage sourcing of SA tooling and machinery
Other policy elements • Introduce new CBU import certification – minimum dealerships and service parts supply
• Ensure SA vehicle market has established dealership, workshop infrastructure, and parts availability
MCV/HCV policy amendments – 2021 to 2035Incentive Amendments SAAM Rationale
Tariffs (CBU and CKD) • No change to present base duty structure (20% CBU and 0% CKD)
• M&HCVs are intermediate capital inputs • Tariff structure deemed appropriate
Vehicle assembly (VALA) • Not applicable to M&HCVs • As intermediate capital inputs, low volume assembly of imported CBU sub-systems deemed appropriate
Production (Production incentive) • Component firms to continue earning PI for M&HCV parts production
• Benefit level to be adjusted as per light vehicle amendments, and to be earned as a PRC, and no longer a PRCC
• As per light vehicle programme – bolster incentive for feasible component production in South Africa
Investment (AIS) • As per light vehicle recommendation • Support SA automotive industry investments, especially when using local tooling and machinery
Other policy elements • SA to introduce new M&HCV CBU import certification – minimum number of dealerships and specified supply of service parts
• Ensure SA M&HCV market comprises models, with established dealership/workshop infrastructures, and associated parts availability
31
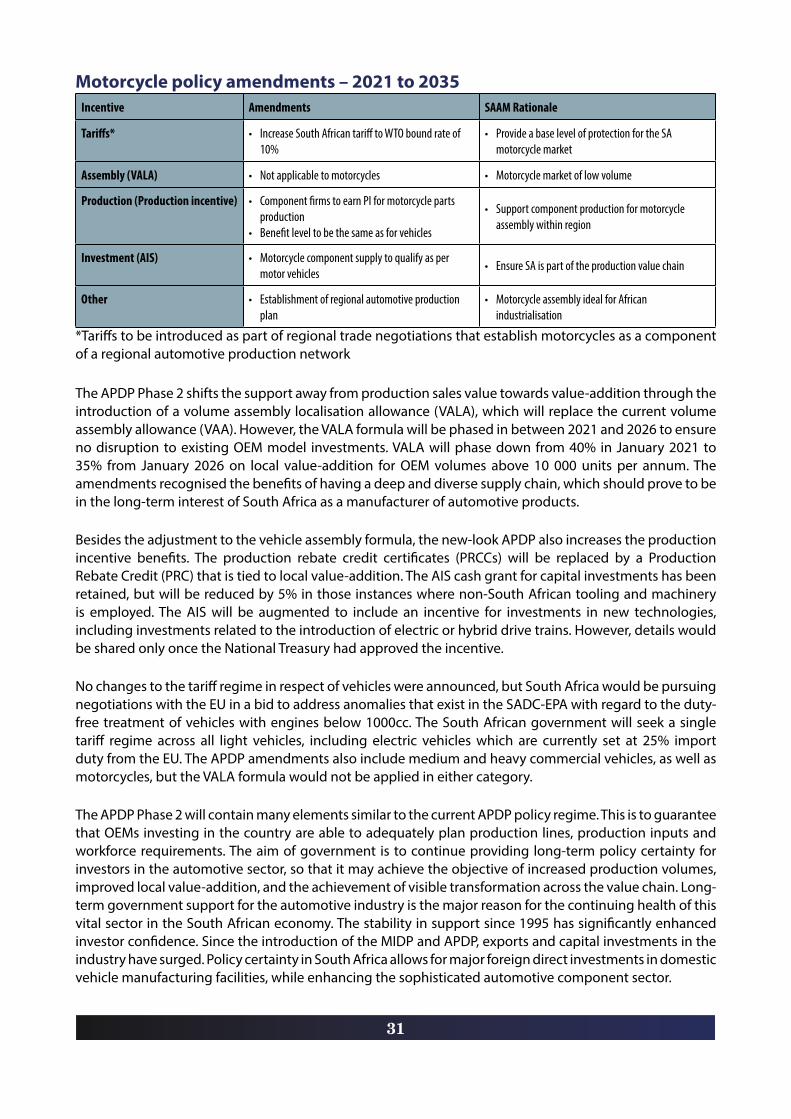
Motorcycle policy amendments – 2021 to 2035Incentive Amendments SAAM Rationale
Tariffs* • Increase South African tariff to WTO bound rate of 10%
• Provide a base level of protection for the SA motorcycle market
Assembly (VALA) • Not applicable to motorcycles • Motorcycle market of low volume
Production (Production incentive) • Component firms to earn PI for motorcycle parts production
• Benefit level to be the same as for vehicles
• Support component production for motorcycle assembly within region
Investment (AIS) • Motorcycle component supply to qualify as per motor vehicles
• Ensure SA is part of the production value chain
Other • Establishment of regional automotive production plan
• Motorcycle assembly ideal for African industrialisation
*Tariffs to be introduced as part of regional trade negotiations that establish motorcycles as a component of a regional automotive production network
The APDP Phase 2 shifts the support away from production sales value towards value-addition through the introduction of a volume assembly localisation allowance (VALA), which will replace the current volume assembly allowance (VAA). However, the VALA formula will be phased in between 2021 and 2026 to ensure no disruption to existing OEM model investments. VALA will phase down from 40% in January 2021 to 35% from January 2026 on local value-addition for OEM volumes above 10 000 units per annum. The amendments recognised the benefits of having a deep and diverse supply chain, which should prove to be in the long-term interest of South Africa as a manufacturer of automotive products.
Besides the adjustment to the vehicle assembly formula, the new-look APDP also increases the production incentive benefits. The production rebate credit certificates (PRCCs) will be replaced by a Production Rebate Credit (PRC) that is tied to local value-addition. The AIS cash grant for capital investments has been retained, but will be reduced by 5% in those instances where non-South African tooling and machinery is employed. The AIS will be augmented to include an incentive for investments in new technologies, including investments related to the introduction of electric or hybrid drive trains. However, details would be shared only once the National Treasury had approved the incentive.
No changes to the tariff regime in respect of vehicles were announced, but South Africa would be pursuing negotiations with the EU in a bid to address anomalies that exist in the SADC-EPA with regard to the duty-free treatment of vehicles with engines below 1000cc. The South African government will seek a single tariff regime across all light vehicles, including electric vehicles which are currently set at 25% import duty from the EU. The APDP amendments also include medium and heavy commercial vehicles, as well as motorcycles, but the VALA formula would not be applied in either category.
The APDP Phase 2 will contain many elements similar to the current APDP policy regime. This is to guarantee that OEMs investing in the country are able to adequately plan production lines, production inputs and workforce requirements. The aim of government is to continue providing long-term policy certainty for investors in the automotive sector, so that it may achieve the objective of increased production volumes, improved local value-addition, and the achievement of visible transformation across the value chain. Long-term government support for the automotive industry is the major reason for the continuing health of this vital sector in the South African economy. The stability in support since 1995 has significantly enhanced investor confidence. Since the introduction of the MIDP and APDP, exports and capital investments in the industry have surged. Policy certainty in South Africa allows for major foreign direct investments in domestic vehicle manufacturing facilities, while enhancing the sophisticated automotive component sector.

32
The original framework of the APDP is outlined below.
The APDP is a Trade Related Investment Measure (TRIM) and consists of four pillars that drive the programme:
1. Import Duty
2. Vehicle Assembly Allowance (VAA) (rebate mechanism)
3. Production Incentive (PI) (rebate mechanism)
4. Automotive Investment Scheme (AIS) (cash grant)
The four key elements of the APDP may be described as follows:
Tariffs: There is a set tariff regime on vehicles and automotive components imported into South Africa. Import duties on vehicles and automotive components will remain at 2012 levels (25% on light vehicles and 20% on original equipment components) through to 2020. A preferential agreement results in imported vehicles from the EU paying only 18% duty. These tariffs are meant to provide adequate protection to justify continued domestic vehicle manufacturing. The purpose of the tariff structure under the APDP is to incentivise industry, and not to generate revenue.
Vehicle Assembly Allowance (VAA): This support is in the form of a rebate calculated on the ex-factory vehicle price and is applicable to domestic vehicle manufacturers of light motor vehicles. It was set at 20% in 2013, reduced to 19% in 2014, and to 18% in 2015. The realisable component import duty rebate to the OEMs is the above value multiplied by the duty rate of 20%. This represented 4% of the ex-factory vehicle price in 2013, which was reduced to 3,6% in 2015. This support effectively provides a lower duty rate for domestic vehicle manufacturers and is intended to provide enough encouragement for high-volume vehicle production.
Production Incentive (PI): In 2013, the PI conversion factor started at 55% of the designated local value-addition, which was reduced progressively by 1% annually to 50%, in the form of duty-free import credits. The equivalent value is the incentive multiplied by the component/vehicle duty rate, so this represented between 5% to 11% (on components) of value-added in 2013, and was reduced to 4% to 10% by 2018. There is an additional amount for “vulnerable products” which earned a PI of 80% in 2013 and 2014, reduced thereafter by 5% annually to 50% in 2020, with the exception of catalytic converters, which will remain at 65%. “Value-added” has been defined in simple terms as the manufacturer’s selling price less the value of non-qualifying material and imported components. The incentive is calculated through the supply chain and is earned by the end user, which is the OEM, or, in the case of component exports or replacement parts, the component manufacturer.
There are certain eligibility requirements to ensure that the beneficiaries are companies producing substantial components for vehicle manufacturing, and to exclude accessories. While materials are generally excluded from value-added, certain local materials, which have been domestically beneficiated to suit automotive specifications, have a standard 25% of their value included in the value-addition, or 40% (reduced by 5% annually from 2015 to 25% in 2017) where they are used to produce vulnerable products. The value-add support is planned to encourage increasing levels of local value-addition along the automotive value chain, with positive spin-offs for employment creation. A 25% standard value is regarded as local value-added on the following qualifying raw materials originating in the Southern African Customs Union (SACU) which have been beneficiated to suit automotive specifications:
• Aluminium • Brass

33
• Leather• Platinum Group Metals (PGMs)• Stainless steel• Steel
With regard to vulnerable products, these high material content products have received additional support to avoid a sudden and significant loss of export business due to the transition from the export-oriented MIDP. In this regard, 40% of the standard material(s) listed above, and applicable to the following list of products, was initially regarded as local value-added:
• Alloy wheels • Aluminium products (engine and transmission components, heat exchangers and tubes, suspension components and heat shields)• Cast iron components (engine/axle/brake/transmission and related types of components)• Catalytic converters• Flexible couplings• Leather interiors• Machined brass components • Steel jacks
The 40% level was reduced by 5 percentage points per annum from 1 January 2015 to reach 25% from 1 January 2017 onwards.
Automotive Investment Scheme (AIS): The AIS marks the implementation of the first cash-based incentive for the South African automotive industry. The AIS represents the only industry support that is of physical cost to the fiscus in the form of a non-taxable cash grant. The total investment approved since inception of the AIS until the end of 2018 amounts to R60,39 billion, while the sum total of incentives approved since inception amounts to R16,91 billion. Since inception, 477 projects have been approved under the AIS, creating 19 294 additional jobs. The Dti implemented a change to the AIS guidelines in 2017 for all new applications approved from 1 September 2017 which now requires applicants to maintain base year employment levels throughout the entire incentive period, from application stage until claim periods.
The AIS became effective in July 2009, immediately after the announcement of the APDP framework. The amended AIS guidelines, including the People-Carrier AIS, became effective in July 2014, and provided clarity on the non-taxability of the grant, as well as on the eligibility of automotive tooling companies to apply for the same benefits as those enjoyed by component manufacturers under the scheme. The AIS provides for a non-taxable cash grant of 20% of the value of qualifying investment in productive assets by light motor vehicle manufacturers, and increased support of 25% of the value of qualifying investment in productive assets by component manufacturers and tooling companies, as approved by the Dti. In addition, by achieving certain performance objectives, companies will be able to earn an additional 5% or 10%. This support is available to encourage investments by OEMs and component manufacturers in a manner that supports productive capacity upgrading.
A competitiveness improvement cost grant of 20% of qualifying costs will also be available for automotive component manufacturers. The objective of this benefit is to enhance the competitiveness of component manufacturers through the improvement of processes, products, quality standards and related skills development through the use of business development services. The grant is a function of the expenditure incurred by component suppliers to improve competitiveness, and must be linked to a new or replacement model of a light vehicle manufacturer.
The APDP applies to only light vehicles (passenger cars and light commercial vehicles), although components produced for heavy commercial vehicles also qualify for the Production Incentive (PI). In

34
parallel with the launch of the APDP, other significant developments on other complementary fronts include the design of the Electric Vehicle Roadmap, and the medium and heavy commercial vehicle (MCV/HCV) development strategy. The medium and heavy commercial vehicle sector and bus sector have also received increased attention. The rationale behind this is the fact that the MCV/HCV sector is labour intensive in terms of assembly, while a more active sector could also broaden South Africa’s component manufacturing industry. It is believed that this could be an opportunity for the component sector to grow its base and create additional employment. Progress includes the Automotive Investment Scheme (AIS) for this sector which was published in November 2014 and was backdated to April 2014. The intention is to use AIS support to drive the future growth and development of the MCV/HCV sector and to promote additional localisation and employment creation. A PI, under the same regulations as for light vehicles, can be earned on components produced for trucks. The PI, however, is earned by the component manufacturer and not passed through to the heavy commercial vehicle manufacturer, as is done on light vehicles.
A key feature of the automotive industry in South Africa is the constructive way in which industry and government co-operate to maximise the contribution of the automotive sector to the economy under a Trade Related Investment Measure (TRIM). The TRIM provides protection for foreign direct investment whilst allowing duty rebates for localisation activities. The automotive sector is therefore increasingly being used as a benchmark for other sectors. It is recognised that the achievement of the economic objectives of the country will largely depend on the ongoing successes of the domestic automotive industry, as one of the prioritised sectors in the country’s economy.
It is recognised that the achievement of the economic objectives of the country will
largely depend on the ongoing successes of the domestic
automotive industry, as one of the prioritised sectors in the
country’s economy.

35

36
GLOBAL NEW VEHICLE MARKET FEATURES
Modern vehicles are rolling computers. The speed at which automotive technology is advancing means that today’s innovation is tomorrow’s standard, and OEMs can no longer be market leaders just by differentiating on the latest technology trends. The four automotive megatrends, namely, mobility, independent driving, digitisation and electrification will continue to shape the future of the automotive industry and will also affect the supplier industry. With the rise of connected cars and artificial intelligence, OEMs will require a suite of solution providers and data aggregators to deliver meaningful data to consumers across industries, government agencies, and smart city implementers. The new synergies among automotive and ICT companies are giving rise to a new breed of business models. When developing these models, OEMs have to take into account the value customers place on data, mobility, connectivity, customer centricity, and cybersecurity. Consequently, innovation will continue to be a priority among top OEMs.
In 2018, global vehicle production declined by 1,1% to reach 95,6 million vehicles, down from the 96,7 million units produced in 2017. The weaker performance could mainly be attributed to the 2,04 million units, or 2,8%, decline in passenger car production from the 72,72 million produced in 2017 to the 70,68 million produced in 2018. Twenty countries exceeded the one million vehicle production mark in 2018, which is regarded as the international benchmark. Despite a year-on-year decline of 1,21 million units, or 4,2%, China still topped the list with vehicle production of 27,8 million units in 2018, followed by the US with production of 11,3 million units, and Japan with production of 9,7 million units in 2018. Production declined in most of the world’s largest vehicle producing economies, including Germany, Canada, South Korea, Spain, the UK and Iran, but major growth has been recorded in Thailand, Indonesia, Brazil and India, the latter which surpassed Germany into fourth place in the global vehicle production rankings in 2018. Global production follows demand, therefore production increasingly focuses on high growth markets, or economies adjacent to large developed markets.
South Africa is regarded as a global tier 2 player, and forms part of the group of countries producing below one million vehicles per annum. South African vehicle production increased by 1,6% to 610 854 units in 2018 from the 601 338 units in 2017, supported mainly by record vehicle exports. However, the country’s global vehicle production ranking remained at 22nd in 2018, with a market share of 0,64%. In terms of global LCV production, South Africa was ranked 15th with a market share of 1,24%, while with regards to global passenger car production, the country was ranked 26th with a market share of 0,46% in 2018. South Africa remained the dominant market on the African continent and accounted for 54,3% of total vehicle production in Africa. However, Morocco, conveniently positioned next to the EU market, for the second successive year, produced more passenger cars than South Africa. The following table reveals global vehicle production by country for 2017 and 2018.
Modern vehicles are rolling computers.

37
Global vehicle production by country – 2017 to 2018Country Total units produced
2017Total units produced
2018Passenger cars Commercial vehicles
1. China 29 015 434 27 809 196 23 709 782 4 099 414
2. USA 11 189 985 11 314 705 2 795 971 8 518 734
3. Japan 9 690 674 9 728 528 8 358 220 1 370 308
4. India 4 792 231 5 174 645 4 064 774 1 109 871
5. Germany 5 645 584 5 120 409 5 120 409 0
6. Mexico 4 094 832 4 100 525 1 575 808 2 524 717
7. South Korea 4 114 913 4 028 834 3 661 730 367 104
8. Brazil 2 736 802 2 879 809 2 386 758 493 051
9. Spain 2 848 317 2 819 565 2 267 396 552 169
10. France 2 226 000 2 270 000 1 763 000 507 000
11. Thailand 1 988 823 2 167 694 877 015 1 290 679
12. Canada 2 194 003 2 020 840 655 896 1 364 944
13. Russia 1 551 909 1 767 674 1 563 572 204 102
14. UK 1 749 385 1 604 328 1 519 440 84 888
15. Turkey 1 695 731 1 550 150 1 026 461 523 689
16. Czech Republic 1 305 865 1 345 041 1 345 041 0
17. Indonesia 1 218 106 1 343 714 1 055 774 287 940
18. Slovakia 1 032 445 1 090 000 1 090 000 0
19. Italy 1 142 210 1 060 068 670 932 389 136
20. Iran 1 515 396 1 095 526 1 027 313 68 213
21. Poland 689 783 659 646 451 600 208 046
22. South Africa 601 338 610 854 321 097 289 757
Global 96 671 427 95 634 593 70 678 747 24 926 233Source: Lightstone Auto/NAAMSA, OICA
Global passenger car and LCV sales fell as the European, US and Chinese markets stalled in 2018. China continued to lead the world rankings with 28,08 million sales, followed by Europe with 17,7 million sales, and the US with 17,3 million sales. In what was one of the most significant results from 2018, India became the world’s fourth largest car market, as it was finally able to outsell Germany. Elsewhere, Russia climbed the rankings and overtook South Korea, while Argentina and Turkey – two big producers of vehicles – saw declines, having felt the effects of challenging economic times. Meanwhile, Latin America outsold Japan, recording 5,6 million and 5,2 million sales, respectively.
The dip in the Chinese market, in particular, had ramifications for the rest of the global market in 2018, as China makes up nearly 30% of global vehicle sales and any change that happens there is felt across the rest of the world. Besides declining sales in China, the automotive industry had to deal with uncertainty in the European market following the fallout from Brexit and the introduction of more complex environmental regulations. Many OEMs also felt the effect of trade tensions between the world’s biggest economies, political changes in key markets, and new threats to the status quo of the industry.
It was a particularly challenging year for the global passenger car market as year-on-year sales declined for the first time since 2009. However, electric vehicles (EVs) recorded their best-ever year. Passenger electric

38
cars recorded 1,26 million sales in 2018, up by a huge 74%. It was one of the highest increases among all car categories in the global market. Firstly, the Chinese demand for EVs soared in 2018, as this car-type gained more visibility among consumers, partly due to being promoted by local governments for their environmental impact. Secondly, Tesla finally took off. The Model 3 became the world’s best-selling EV, as it was supported by sales in North America.
A record 29,77 million SUVs were sold in 2018, comprising 36% of passenger car sales, with volume up by 7% on the 2017 figures. Even though growth in this segment remained strong, it was the lowest growth result over the past four years and was almost half of the growth registered in 2017, when sales increased year-on-year by 13%. The continuous demand for SUVs came at the expense of sales of traditional cars, as global volume totalled 5,2 million units, up by 5% from 2017. The Ford F-series maintained its position as the world’s best-selling vehicle, as it was the only vehicle to register more than one million sales. This was due to the enormous popularity of the vehicle in the US, where 84% of its global volume was recorded. The Toyota Corolla also maintained its position in the rankings, where it was once again the second-best selling vehicle in the world. The Toyota Rav4 became the world’s best-selling SUV, and fourth best-selling car.
Demand for vehicles remains high and currently there are globally approximately 1,3 billion vehicles on the road. Driven by emerging market consumption, China, with a significant sales growth of 198,9% over the past decade, from 9,4 million units in 2008 to 28,1 million units in 2018, is largely responsible for global vehicle sales growth increasing by 50,5% from 63,8 million units to 96 million units over the same period. China’s vehicle production of 27,81 million units and sales of 28,08 million units in 2018 were both higher than the next three major markets, namely the US, Japan and India combined.
The trends in China and India are clearly emphasising the shift from the “traditional west” to the “emerging east” in terms of vehicle production and consumption. Hence, global liberalisation of the automotive industry has benefitted developing economies with their strong demand and cheaper factors of production.
Demand for vehicles remains high and currently there are globally approximately 1,3
billion vehicles on the road.

39
METHODOLOGY – AUTOMOTIVE TRADE DATA
The methodology utilised and applied in the Automotive Export Manual – 2019 – South Africa publication remains unchanged from the previous publications in order to enable meaningful comparisons. All values are presented in nominal prices. The trade data in this publication is reflected for South Africa. A significant change in the South African trade statistics, as approved by the Minister of Finance on 14 November 2013, was that South African trade with member countries of the Southern African Customs Union (SACU), comprising Botswana, Lesotho, Namibia and Swaziland (renamed eSwatini) (BLNS), would now be included in South Africa’s trade data to provide a more accurate reflection of the country’s trade. BLNS country trade data had previously not been included in the country’s trade statistics because of the free movement of goods between member countries from a customs point of view within SACU. The automotive industry’s trade performance has subsequently been revised with BLNS country data, with retrospective effect, where applicable, in the 2014 to 2018 as well as in the 2019 publication. The trade data in the Automotive Export Manual – 2019 – South Africa publication is based on the detailed Customs and Excise statistics for products eligible under the APDP, obtained from the South African Revenue Service (SARS). The Customs and Excise export values reflect free on board (FOB) values in nominal terms. The export values of the latest year (2018) are used to rank the countries in order of priority, from the most to the least important export country destination. The same principle is applied so as to prioritise the export data regarding regions, vehicles and component categories. There are 263 country export destinations listed by SARS. For purposes of relevance, one million Rand (R1 million) is used in the Automotive Export Manual – 2019 – South Africa publication as a cut-off level (measure) to determine the top South African export country destinations. For ease of reference and for comparison purposes, the data with respect to the component categories, where applicable, is placed in alphabetical order. Percentages are rounded off. The main purpose of this publication is to discern and highlight trends in export and import data, to prioritise export country destinations, to prioritise countries of origin, to identify opportunities via potential country and region growth destinations, to measure the impact of the country’s trade arrangements on automotive trade patterns, as well as to identify growth in products exported to specific country destinations. The publication also serves as a guide to track the export and import performance of the South African automotive industry under the APDP. Due to certain limitations, Customs and Excise statistics cannot always distinguish between the automotive components eligible in terms of the APDP and non-eligible components, therefore certain categories, such as automotive tooling, may contain a small percentage of non-APDP components.
For currency comparison purposes, the following table reveals the movement of the Rand against the currencies of the South African automotive industry’s main trading partners, namely, the EU, the UK, the US, Japan and China from 2014 through to 2018.

40
Currency indices for the Rand versus major trading partners (foreign currency: Rand – annual averages)
Currency 2014 2015 2016 2017 2018
Euro 14,40 14,14 16,28 15,04 15,60
Index 2014 100 98 113 104 108
UK Pound 17,86 19,49 20,00 17,15 17,63
Index 2014 100 109 120 96 99
US$ 10,84 12,75 14,71 13,31 13,23
Index 2014 100 118 136 123 122
Japan (100 Yen) 10,26 10,53 13,54 11,87 11,97
Index 2014 100 103 132 116 117
Chinese Yuan 176,05 202,72 221,65 197,08 199,79
Index 2014 100 115 126 112 113Source: South African Reserve Bank
The primary mandate of the South African Reserve Bank (SARB) is to achieve and maintain price stability in the interest of balanced and sustainable economic growth. The goal of price stability is quantified by the setting of an inflation target range of 3% to 6%. The country’s consumer price inflation (CPI) of 4,7% in 2018 had remained within the target band. South Africa’s central bank, in November 2018, increased its benchmarking lending rate for the first time in nearly three years, by 25 basis points to 6,75% despite weak economic growth, in an effort to curb inflation. The SARB stated that delaying the adjustment could cause inflation expectations to become entrenched at higher levels, and spur a stronger monetary policy response in future. Among the risks for inflation identified by the monetary policy committee was the strength of the US dollar, sustained high oil prices, escalating trade tensions and higher domestic electricity prices.
The Rand performed well against most major currencies from 2017 to 2018. However, exchange rate forecasts for the Rand remain widely dispersed. The continued tightening in global financial conditions, a change in investor sentiment towards emerging markets, escalating trade conflicts, and geo-political developments remain the key risks to the Rand. The domestic economic outlook remains challenging, although growth in 2019 is still expected to outperform the outcomes of recent years.
The Rand performed well against most major currencies
from 2017 to 2018.

41 EXPORTSEXPORTS
EXPORTS TO REGIONS
Free trading relations, which have underpinned the globalisation process, are being seriously challenged for the first time in many years, mainly due to developments in the US and the UK. In a situation where trading patterns are changing, the level of uncertainty for the global and South African automotive industry remains high.
South Africa’s trade negotiations are being conducted alongside the country’s partners in the Southern African Customs Union (SACU), comprising Botswana, Lesotho, Namibia and Swaziland (renamed eSwatini), following the renewed SACU Agreement in 2004 that requires SACU to negotiate all trade agreements as a bloc. Access to global markets has been enhanced through bilateral agreements with most of South Africa’s major trading partners and by participating in regional economic communities. SACU, at present, enjoys free trade agreements (FTAs) with the 28-country European Union and the European Free Trade Association (EFTA) comprising Iceland, Lichtenstein, Norway and Switzerland. SACU is also part of the 15-country Southern African Development Community (SADC) free trade area, has a preferential trade agreement (PTA) with Mercosur, comprising Argentina, Brazil, Paraguay, Uruguay and Venezuela, while South Africa also enjoys duty-free and quota-free entry into the US market under the African Growth and Opportunity Act (AGOA), a unilateral trade preference programme.
South Africa is a member of the 164-member World Trade Organisation (WTO). Global trading in automotive products is particularly influenced by multilateral agreements under the auspices of the WTO and the increasingly bilateral or regional agreements which are signed between different geographical areas. Given escalating trade protectionism in key export markets around the world, regional integration arrangements offer South Africa an opportunity to expand into new markets. With regards to the latter, South Africa’s current regional trade negotiations include the tripartite free trade area (TFTA) consisting of the Southern African Development Community (SADC), the East African Community (EAC) and the Common Market for Eastern and Southern Africa (COMESA). The TFTA will serve as a building block for the African Continental Free Trade Area (AfCFTA). The AfCFTA is aimed at creating a single continental market for goods and services, allowing for the free movement of business persons and investments, and expanding intra-Africa trade through better harmonisation and co-ordination. This would unlock an improvement in intra-Africa traded goods and services, better customs co-operation between the countries, the elimination of non-tariff barriers, and the improvement of investment prospects on the back of economies of scale.
The tables on the following pages reveal the South African automotive industry’s trade patterns with major trading blocs, including the European Union (EU), which remains the South African automotive industry’s main trading partner, the North American Free Trade Area (NAFTA), Africa, the Southern African Development Community (SADC) and the Common Market of South America (Mercosur).

42 EXPORTSEXPORTS
European Union
Europe remained the domestic automotive industry’s most important regional export destination in 2018, accounting for R105,2 billion, or 58,8%, of total automotive exports of R178,8 billion. In view of the significance of the EU for the South African automotive industry, developments in the region have a direct and measurable impact on the South African automotive industry’s overall performance. The UK political developments, therefore, have been closely monitored, since a great deal is at stake for South Africa in the eventual outcome of Brexit, considering the relevance of the EU and the UK for the domestic automotive industry.
According to the International Organisation of Motor Vehicle Manufacturers (OICA), vehicle production in the EU declined by 2,6% from 18,37 million units in 2017 to 17,89 million units in 2018. Germany, with vehicle production of 5,12 million units led the region, followed by Spain with 2,82 million units, and France with 2,27 million units. The estimated vehicle parc in the EU was in the order of 303 million units, and the motorisation rate at 581 vehicles per 1 000 persons. The following table reveals the EU’s vehicle production for 2017 and 2018.
EU vehicle production – 2017 to 20182017 2018 % change 2018/2017
Vehicle production 18 369 704 17 893 218 -2,6%
Source: OICA
The trade framework between South Africa and the EU is well entrenched, and up to 2016, had been governed by the Trade, Development and Co-operation Agreement (TDCA) which became effective on 1 January 2000. The automotive part of the TDCA was only concluded on 15 December 2006. As a result, the 3% import duty on original equipment components and the 4,5% duty on aftermarket parts were reduced to duty-free on 15 December 2006, while the 10% import duty on passenger cars was reduced to 3,5% on 15 December 2006, was further reduced to 1,5% on 1 January 2007, and fell away completely in January 2008.
South Africa, in turn, granted the EU a 7% preference on passenger cars and light commercial vehicles and an 8% preference on medium and heavy commercial vehicles and buses. Original equipment components received no preference, but a large number of aftermarket automotive parts qualified for lower import duties. In order to qualify for zero tariffs into the EU, South African vehicles and automotive components must contain at least 60% local content with respect to the rules of origin. The definition of local content includes South African raw materials, labour, parts, transport, manufacturing costs and profit margins, as well as the value of components and sub-components originally sourced from the EU.
On 10 June 2016, the EU and six member states of SADC, namely Botswana, Lesotho, Mozambique, Namibia, South Africa and Swaziland (renamed eSwatini) signed an Economic Partnership Agreement (EPA), which came into force on 10 October 2016. The EPA between the EU and the SADC group replaced the trade provisions of the bilateral TDCA between South Africa and the EU, and will harmonise the trading regime between SACU as a whole and the EU. The EU–SADC EPA is the first EPA signed between the EU and an African region. All of the six countries, barring Mozambique, are also members of SACU.
The new deal preserves coherence within SACU, particularly with regard to maintaining the common external tariff. South Africa’s rationale for participation in the EPA was an effort to harmonise the region’s

43 EXPORTSEXPORTS
trade relations vis-à-vis the EU, with the aim to strengthen regional integration in SACU and SADC, as well as further African integration, given that there are also EPA discussions under way with regional blocs in West, East and Central Africa.
The EPA is intended to be development-oriented and will allow for deeper regional integration. The EPA allows for more flexibility on rules of origin, and under the SADC-EU EPA, manufacturers in either a SADC EPA state or the EU can use originating materials in the other country as if they originated in their own country to grant preferential originating status on goods traded between them. Since the EPA rules of origin allow for extended cumulation, they will also facilitate intra-regional trade and industrialisation, as countries will be able to source inputs from any other country in the respective EPA or another EPA region to benefit from duty- and quota-free access to the EU. Overall the EPA represents a commercial improvement over the TDCA, and will translate into better trade performance, and aspire towards greater integration and industrialisation.
In view of the free trade agreement (FTA) that SACU enjoys with the EU and also for the harmonisation of trade relations with Western Europe, SACU signed a free trade agreement with the European Free Trade Association (EFTA), which came into force on 1 May 2008. EFTA consists of Iceland, Liechtenstein, Norway and Switzerland. EFTA offered South Africa full duty- and quota-free access for industrial products. For its part, South Africa offered EFTA what it had already offered the EU on both processed agricultural products and industrial products, with some marginal adjustments. The free trade agreement brings about a number of benefits to South African exporters, which include duty-free market access for SACU products, including vehicles and automotive components, to EFTA markets. Automotive exports to EFTA markets, although still relatively small, amounted to R1 001,6 million in 2018, up from the R725,2 million in 2017.
The following table reveals that total automotive exports (vehicles and components) to the EU amounted to R105,2 billion in 2018, substantially up by R19,3 billion, or 22,5%, compared to the R85,9 billion export value in 2017. Exports in Euro terms increased by 17,9% year-on-year, reflecting the increase in real terms. Vehicle exports to the EU increased in volume terms from 190 503 units in 2017 to 233 772 units in 2018 and in value terms increased from R63,3 billion in 2017 to R81,8 billion in 2018. Automotive component exports increased by R0,89 billion, or 3,9%, from the R22,56 billion exported in 2017 to R23,45 billion in 2018. Exports to the 13 new member countries, forming part of the expanded EU, comprised R4,50 billion, or 4,3%, of the R105,2 billion export value in 2018, compared to the R3,64 billion export value in 2017.
The EPA is intended to be development-oriented and
will allow for deeper regional integration.

44 EXPORTSEXPORTS
Exports to the EU by product category – 2014 to 2018Component 2014 2015 2016 2017 2018
Total (R million) 43 801,2 67 113,9 86 013,9 85 908,4 105 218,0
Total (average Euro million) 3 041,8 4 746,4 5 283,4 5 712,0 7 736,1
Air conditioners 31,2 38,9 4,2 2,8 3,9
Alarm systems 22,2 14,2 18,6 8,0 6,5
Automotive glass 380,4 307,2 383,8 349,4 418,8
Automotive tooling 202,3 229,1 286,0 258,6 217,4
Axles 146,0 195,2 281,5 300,2 268,2
Batteries 103,0 70,2 4,9 3,3 6,3
Body parts / panels 59,4 91,1 100,5 126,0 139,7
Brake parts 33,2 29,3 78,0 65,3 99,6
Car radios 1,1 1,1 1,3 3,9 0,8
Catalytic converters 14 124,0 13 904,5 14 951,1 13 769,4 14 129,6
Clutches / shaft couplings 196,9 221,5 271,5 386,6 372,4
Engines 9,2 75,2 78,0 64,8 64,9
Engine parts 1 366,8 1 109,5 980,3 961,3 1 197,8
Filters 164,3 171,3 262,8 211,1 210,6
Gaskets 41,7 41,3 37,6 35,2 33,0
Gauges / instruments / parts 94,9 62,3 67,0 44,1 53,9
Gear boxes 18,3 4,7 12,9 15,4 19,5
Ignition / starting equipment 35,6 19,5 43,2 23,9 40,4
Jacks 0,9 5,8 4,3 2,2 1,4
Lighting equipment / parts 145,0 136,8 144,5 126,8 134,4
Radiators / parts 690,3 685,4 797,3 883,6 965,2
Road wheels / parts 81,7 121,8 118,0 267,0 206,2
Seats 1,6 3,7 2,3 3,1 2,3
Seat belts 1,3 0,6 0,6 0,5 0,6
Shock absorbers / suspension parts 388,6 324,6 421,5 434,1 453,5
Silencers / exhausts 214,3 236,8 306,6 295,8 276,5
Springs 6,3 3,3 8,1 8,8 12,4
Steering wheels / columns / boxes 13,1 11,1 10,3 11,8 12,2
Stitched leather seats / parts 1 244,1 916,6 693,0 438,2 448,5
Transmission shafts 286,0 194,1 137,3 158,4 150,6
Tyres 443,6 425,5 549,0 707,6 824,6
Wiring harnesses 94,5 92,0 60,4 34,8 22,5
Other parts 1 472,5 1 983,1 2 414,3 2 559,4 2 657,7
Light vehicles 21 653,5 45 376,1 62 454,5 63 318,6 81 759,5
Medium / Heavy vehicles 33,4 10,5 28,7 28,4 6,6Source: AIEC, SARS

45 EXPORTSEXPORTS
Top export destinations in the EU with export values –
2018 (R million)
Source: AIEC, SARS
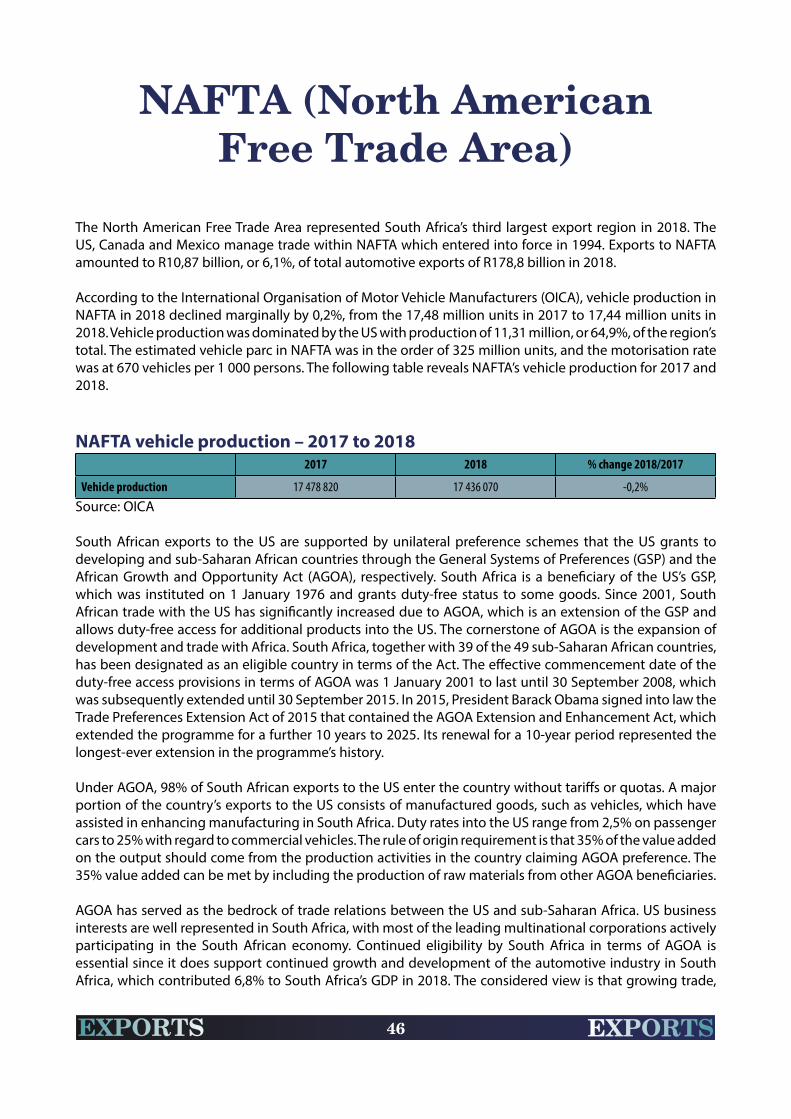
46 EXPORTSEXPORTS
NAFTA (North American Free Trade Area)
The North American Free Trade Area represented South Africa’s third largest export region in 2018. The US, Canada and Mexico manage trade within NAFTA which entered into force in 1994. Exports to NAFTA amounted to R10,87 billion, or 6,1%, of total automotive exports of R178,8 billion in 2018.
According to the International Organisation of Motor Vehicle Manufacturers (OICA), vehicle production in NAFTA in 2018 declined marginally by 0,2%, from the 17,48 million units in 2017 to 17,44 million units in 2018. Vehicle production was dominated by the US with production of 11,31 million, or 64,9%, of the region’s total. The estimated vehicle parc in NAFTA was in the order of 325 million units, and the motorisation rate was at 670 vehicles per 1 000 persons. The following table reveals NAFTA’s vehicle production for 2017 and 2018.
NAFTA vehicle production – 2017 to 20182017 2018 % change 2018/2017
Vehicle production 17 478 820 17 436 070 -0,2%
Source: OICA
South African exports to the US are supported by unilateral preference schemes that the US grants to developing and sub-Saharan African countries through the General Systems of Preferences (GSP) and the African Growth and Opportunity Act (AGOA), respectively. South Africa is a beneficiary of the US’s GSP, which was instituted on 1 January 1976 and grants duty-free status to some goods. Since 2001, South African trade with the US has significantly increased due to AGOA, which is an extension of the GSP and allows duty-free access for additional products into the US. The cornerstone of AGOA is the expansion of development and trade with Africa. South Africa, together with 39 of the 49 sub-Saharan African countries, has been designated as an eligible country in terms of the Act. The effective commencement date of the duty-free access provisions in terms of AGOA was 1 January 2001 to last until 30 September 2008, which was subsequently extended until 30 September 2015. In 2015, President Barack Obama signed into law the Trade Preferences Extension Act of 2015 that contained the AGOA Extension and Enhancement Act, which extended the programme for a further 10 years to 2025. Its renewal for a 10-year period represented the longest-ever extension in the programme’s history.
Under AGOA, 98% of South African exports to the US enter the country without tariffs or quotas. A major portion of the country’s exports to the US consists of manufactured goods, such as vehicles, which have assisted in enhancing manufacturing in South Africa. Duty rates into the US range from 2,5% on passenger cars to 25% with regard to commercial vehicles. The rule of origin requirement is that 35% of the value added on the output should come from the production activities in the country claiming AGOA preference. The 35% value added can be met by including the production of raw materials from other AGOA beneficiaries.
AGOA has served as the bedrock of trade relations between the US and sub-Saharan Africa. US business interests are well represented in South Africa, with most of the leading multinational corporations actively participating in the South African economy. Continued eligibility by South Africa in terms of AGOA is essential since it does support continued growth and development of the automotive industry in South Africa, which contributed 6,8% to South Africa’s GDP in 2018. The considered view is that growing trade,

47 EXPORTSEXPORTS
investment and business relationships benefit both parties, and there are considerable mutual benefits to be derived from two-way trade in vehicles and components, for both the US and South Africa. Multinational corporations source their requirements globally at world best prices, therefore, US companies benefit from duty-free access to products manufactured in South Africa. Furthermore, the South African automotive industry is increasingly involved in regional integration and the building of capacity in other African countries. Both the US and countries involved under AGOA have the potential of generating economic benefits from trade as AGOA countries continue to develop, modernise and industrialise.
However, on 23 May 2018 the US Secretary of Commerce initiated an investigation to determine the effects on the national security of the imports of automobiles, including cars, SUVs, vans and light trucks, and automotive parts into the US. This investigation was initiated under Section 232 of the Trade and Expansion Act of 1962, as amended. If the Secretary finds that automobiles and/or automotive parts are being imported into the US in such quantities or under such circumstances as to threaten to impair the national security, the Secretary shall recommend actions and steps that should be taken to adjust automobile and/or automotive parts imports so that they will not threaten to impair the national security. If Section 232 duties were to be imposed on automotive imports, including those from South Africa, AGOA benefits for South Africa would be significantly eroded, taking into account that Section 232 tariffs effectively suspend AGOA preferences. In view of the importance of the US market for the South African automotive industry, developments have been closely monitored with regards to the outcome of the investigation.
The following table reveals that in 2018, exports to NAFTA, at R10,87 billion, declined by 45,5%, compared to the R19,45 billion exported in 2017, while in US dollar terms, the decline was at 45,3% year-on-year in 2018. The reason for the decline in automotive exports could mainly be attributed to the decline in vehicle exports to the US in 2018. Vehicle exports to the US in 2018, at 11 440 units, were down by 28 974 units from the 40 414 units exported in 2017. Exports comprised mainly of the left-hand drive BMW 3-series, as well as smaller volumes of the new generation Mercedes-Benz C-Class and the Ford Ranger. However, the BMW 3-series was replaced by the X3 model in South Africa in 2018 which is also being manufactured in the US, and therefore not exported from South Africa to the US anymore.
Both the US and countries involved under AGOA have the potential of generating
economic benefits from trade as AGOA countries continue to develop, modernise and
industrialise.
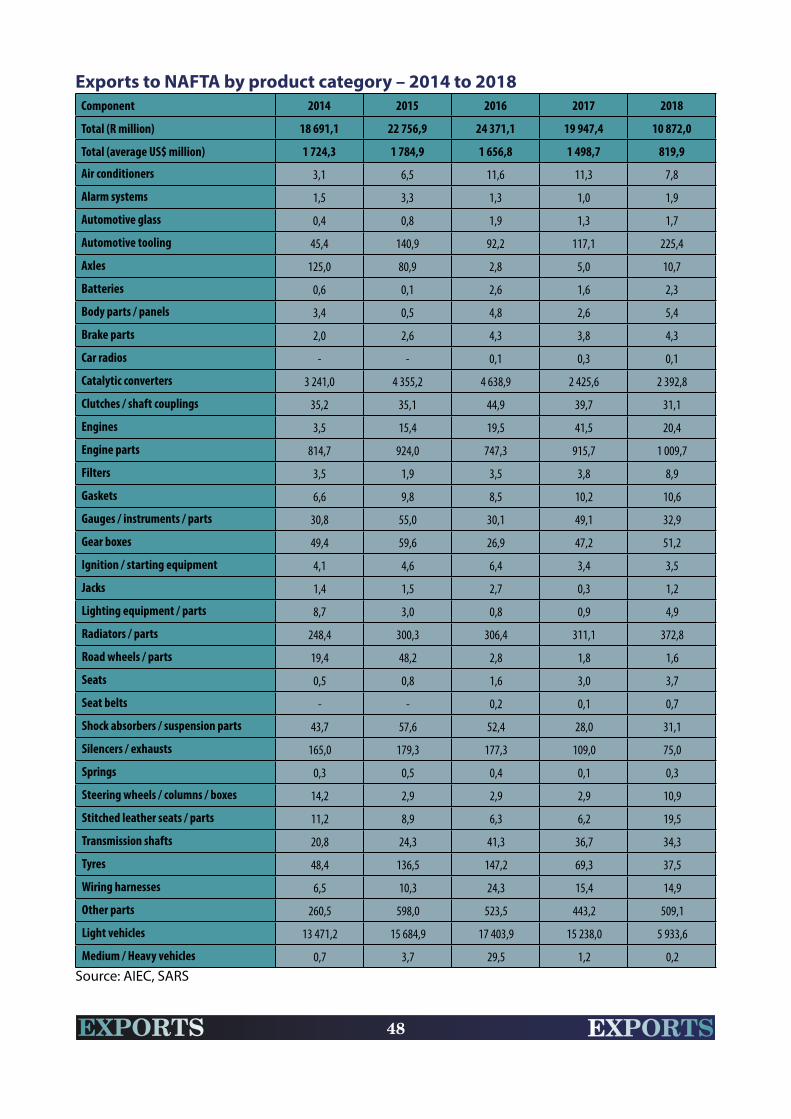
48 EXPORTSEXPORTS
Exports to NAFTA by product category – 2014 to 2018Component 2014 2015 2016 2017 2018
Total (R million) 18 691,1 22 756,9 24 371,1 19 947,4 10 872,0
Total (average US$ million) 1 724,3 1 784,9 1 656,8 1 498,7 819,9
Air conditioners 3,1 6,5 11,6 11,3 7,8
Alarm systems 1,5 3,3 1,3 1,0 1,9
Automotive glass 0,4 0,8 1,9 1,3 1,7
Automotive tooling 45,4 140,9 92,2 117,1 225,4
Axles 125,0 80,9 2,8 5,0 10,7
Batteries 0,6 0,1 2,6 1,6 2,3
Body parts / panels 3,4 0,5 4,8 2,6 5,4
Brake parts 2,0 2,6 4,3 3,8 4,3
Car radios - - 0,1 0,3 0,1
Catalytic converters 3 241,0 4 355,2 4 638,9 2 425,6 2 392,8
Clutches / shaft couplings 35,2 35,1 44,9 39,7 31,1
Engines 3,5 15,4 19,5 41,5 20,4
Engine parts 814,7 924,0 747,3 915,7 1 009,7
Filters 3,5 1,9 3,5 3,8 8,9
Gaskets 6,6 9,8 8,5 10,2 10,6
Gauges / instruments / parts 30,8 55,0 30,1 49,1 32,9
Gear boxes 49,4 59,6 26,9 47,2 51,2
Ignition / starting equipment 4,1 4,6 6,4 3,4 3,5
Jacks 1,4 1,5 2,7 0,3 1,2
Lighting equipment / parts 8,7 3,0 0,8 0,9 4,9
Radiators / parts 248,4 300,3 306,4 311,1 372,8
Road wheels / parts 19,4 48,2 2,8 1,8 1,6
Seats 0,5 0,8 1,6 3,0 3,7
Seat belts - - 0,2 0,1 0,7
Shock absorbers / suspension parts 43,7 57,6 52,4 28,0 31,1
Silencers / exhausts 165,0 179,3 177,3 109,0 75,0
Springs 0,3 0,5 0,4 0,1 0,3
Steering wheels / columns / boxes 14,2 2,9 2,9 2,9 10,9
Stitched leather seats / parts 11,2 8,9 6,3 6,2 19,5
Transmission shafts 20,8 24,3 41,3 36,7 34,3
Tyres 48,4 136,5 147,2 69,3 37,5
Wiring harnesses 6,5 10,3 24,3 15,4 14,9
Other parts 260,5 598,0 523,5 443,2 509,1
Light vehicles 13 471,2 15 684,9 17 403,9 15 238,0 5 933,6
Medium / Heavy vehicles 0,7 3,7 29,5 1,2 0,2Source: AIEC, SARS

49 EXPORTSEXPORTS
Top export destinations in NAFTA with export values –
2018 (R million)
Source: AIEC, SARS

50 EXPORTSEXPORTS
Africa
Africa remains a priority focus for the South African automotive industry, and the continent accounted for R31,69 billion, or 17,7%, of South Africa’s total automotive exports of R178,8 billion in 2018. Automotive exports to Africa increased by R1,97 billion, or 6,6%, from the R29,72 billion exported in 2017.
According to the International Organisation of Motor Vehicle Manufacturers (OICA), vehicle production in Africa grew by 12,1%, from 1 003 859 units in 2017, to 1 125 636 units in 2018. The continent’s market share comprised 1,2% of global vehicle production in 2018. South Africa, with 610 854 units, accounted for 54,3% of Africa’s total vehicle production, while Morocco, with 402 085 units, Egypt, with 71 400 units, and Algeria with 70 597 units, accounted for the balance. With regard to passenger car production, Morocco, at 368 601 units in 2018, for the second successive year, surpassed South Africa’s passenger car production of 321 097 units. The estimated vehicle parc in Africa was in the order of 44,8 million units, and the motorisation rate was at 42 vehicles per 1 000 persons. The following table reveals Africa’s vehicle production for 2017 and 2018.
Africa vehicle production and sales – 2017 to 20182017 2018 % change 2018/2017
Vehicle production 1 003 859 1 125 636 +12,1%Source: OICA
South Africa and northern African countries constituted the main new vehicle markets on the continent. Due to the absence of suitable vehicle financing options, and fierce competition from low-cost imported used vehicles dampening new vehicle sales, the potential African new vehicle consumer market is yet to be realised. Used car imports are not allowed in South Africa and in northern African countries, and hence the reason for the successful growth and development of their automotive industries. The African continent remains an untapped opportunity for global OEMs intent on growing their global business, as new vehicles sales are projected to reach two million units per annum in the next five to 10 years. The good news is that Afrilennials, as opposed to Millennials, still want to own a vehicle. They are the first generation of the middle class that are actively in asset-catch-up mode. Africa offers growth that continues to outpace established nations. The continent is as big as the US, Western and Eastern Europe, India and China combined, and in 2018 had a population of 1,29 billion. As the continent becomes more populous, companies with an established presence in Africa will be better positioned to sell into burgeoning African markets. They will have the advantage of local market knowledge and connections, as well as established distribution channels to beat out rivals who failed to invest early. Africa, however, is not one homogenous entity where each country can be approached with the same business strategy. It is a heterogeneous jigsaw puzzle of different economies and consists of vastly different, disconnected countries and economies.
To consider the context of an African average growth rate of 3,6% for 2019/2020, as projected by the World Bank, it is important to look at the various regions, rather than looking at Africa as a continent. Large economies are also growing at a much slower pace than the smaller economies. East Africa is a region of small countries, and the top fastest growing countries in Africa are smaller economies with growth rates in excess of 6%. The fastest growing countries on the African continent are those that have introduced policies that make it easy to do business, cut red tape and have rational and clear tax regimes. Infrastructure has also been a barrier to growth. If Africa is to seize the opportunities of the future, it needs to mobilise large-scale, sustained investment, especially in infrastructure. Infrastructure is the backbone of a country’s economy and it has a ripple effect to open up markets, accelerate industrialisation and unlock manufacturing.

51 EXPORTSEXPORTS
The success of the South African automotive industry is closely linked to the fortunes of Africa. At present the automotive industry plays a disproportionately small manufacturing role in the region outside of South Africa. This is to the detriment of the region, resulting in limited industrial activity, employment, and technology transfer. South Africa needs to be part of a larger automotive regional production system. The aim is therefore the establishment of a sub-Saharan African automotive development plan or Automotive Pact, built around South Africa, Nigeria, Kenya, Ghana, and potentially one or two other larger economies. This will lead to an associated spread of value-adding activity to neighbouring countries that participate in the value chain based on their comparative locational advantages. Key to the plan is unlocking automotive value-addition within the sub-Saharan African economy, and substantially growing CBU production in the region.
Countries that invest in developing the industrial capacity to create and manufacture motor vehicles will build businesses, create jobs, grow their economies, and generate skills and capabilities that are transferable to multiple industries and sectors. It is, however, recognised that the development of all global automotive industries had been preceded by government policy intervention. If African governments do not develop sustainable, long-term automotive industry policies, including policy measures that address the issue of the sale of used vehicles, they will fail to develop automotive sectors within their economies. The absence of such policies provides challenges to establishing vehicle finance houses within many African countries, which further hinders the sale of new vehicles, as it affects affordability. The necessity of regions or countries is therefore in developing sustainable, long-term automotive industry policies, which will include putting some form of limitation on used car imports if they wish to develop their domestic motor industries.
The founding of the independent African Association of Automotive Manufacturers (AAAM) was based on the strategic view that Africa is extremely important to the future of the OEMs in South Africa, and as such, South Africa is playing a mentoring and knowledge-sharing role for African countries considering car assembly operations in their industrialisation policies. The AAAM, together with the relevant countries, aim to develop a self-sustaining and internationally-competitive African automotive industry. As a result, the promotion of a cohesive automotive strategy for the African continent has been gaining new impetus.
The focus on Africa aligns well with the focus of the South African Automotive Masterplan 2021-2035, which has a major focus on regional integration and trade. South Africa is the only country in sub-Saharan Africa where vehicle manufacturing has reached the scale able to drive a cumulative process of linkage building. The country, with its expertise and geographic advantage is ideally placed to benefit from the increased demand for vehicles and automotive components on the continent. South Africa’s proximity, compared to other emerging markets, and its understanding of business conditions and practices in other African countries, places it in the favourable position of being the ideal partner for becoming increasingly involved with semi-knocked down assembly operations in African countries. The incentive for South Africa to assist other countries in the region lies in the economies of scale and increased foreign investment that can be realised in the long term in terms of specialising in certain models and parts in different countries.
The following table reveals South African automotive exports to the African continent. Annual comparisons should take account of the following – the 2015 to 2018 total automotive export data to Africa provides two comparisons: one comparison includes exports to Botswana, Lesotho, Namibia and Swaziland (renamed eSwatini) (BLNS countries) in line with the revised publishing format of South African trade data provided by SARS, and the other comparison excludes exports to BLNS countries in order to facilitate historical comparisons. Although SACU is a customs union allowing for the free movement of goods between member states, trade with the BLNS countries is regarded as imports and exports for statistical purposes only. Total automotive exports to Africa, excluding BLNS country data, increased by R835 million, or 4,9%, from R16,97 billion in 2017 to R17,81 billion in 2018, while total automotive exports, including BLNS country data, increased by R1,97 billion, or 6,6%, from the R29,72 billion in 2017 to R31,69 billion in 2018. Vehicle exports to 33 African countries increased from the 21 847 units in 2017 to 23 988 units in 2018. Automotive component exports into the continent declined marginally by 0,3%, from R13,16 billion in 2017 to R13,12 billion in 2018.

52 EXPORTSEXPORTS
Exports to Africa by product category – 2015 to 2018Component 2015* 2016* 2017* 2018* 2015** 2016** 2017** 2018**
Total (R million)Including BLNS country data 34 090,2** 31 277,3** 29 721,1** 31 689,1**
Total (R million) Excluding BLNS country data 17 598,8* 14 628,2* 16 970,7* 17 805,7*
Air conditioners 23,5 33,1 21,0 15,4 42,3 46,3 37,7 32,4
Alarm systems 45,2 45,2 35,9 43,4 77,7 89,3 68,1 64,7
Automotive glass 17,2 18,0 17,4 19,4 73,4 89,5 84,6 85,6
Automotive tooling 540,3 222,4 249,0 235,7 688,6 333,3 373,0 352,7
Axles 51,3 45,3 57,3 127,7 128,3 61,5 85,5 161,9
Batteries 190,2 205,5 250,1 245,6 285,2 328,1 383,7 415,1
Body parts / panels 38,2 24,1 37,5 67,9 126,7 134,8 106,4 145,3
Brake parts 79,2 84,7 86,4 75,6 182,1 198,2 192,2 192,1
Car radios 7,5 7,7 7,9 3,0 22,1 18,6 29,8 17,1
Catalytic converters 99,5 84,8 79,4 114,0 118,3 110,3 112,5 147,0
Clutches / shaft couplings 36,7 40,9 46,8 49,4 95,6 105,2 115,3 128,7
Engines 333,2 382,9 406,0 437,5 443,0 493,4 636,6 606,0
Engine parts 475,7 466,9 504,4 566,8 791,5 815,7 827,4 902,5
Filters 179,3 187,7 216,9 219,4 273,6 308,9 347,2 364,7
Gaskets 90,4 95,0 77,9 73,3 133,7 131,1 118,2 113,3
Gauges / instruments / parts 358,9 304,3 330,2 330,6 480,0 441,0 444,5 445,2
Gear boxes 35,8 33,5 45,3 78,2 79,0 93,9 96,8 141,3
Ignition / starting equipment 96,6 87,0 91,5 84,6 207,1 204,9 208,1 211,8
Jacks 23,1 20,3 17,4 20,3 28,0 27,0 24,2 28,8
Lighting equipment / parts 47,8 50,1 54,2 59,6 89,6 108,1 117,7 132,3
Radiators / parts 28,8 37,2 46,1 51,3 73,5 88,2 104,9 110,8
Road wheels / parts 36,8 25,5 27,2 29,4 82,4 80,7 67,7 70,0
Seats 8,4 6,9 9,6 9,3 18,1 16,8 20,2 22,1
Seat belts 2,8 2,4 3,0 2,9 5,9 6,0 6,6 6,4
Shock absorbers / suspension parts 45,8 34,7 35,5 43,4 79,3 82,5 92,5 119,5
Silencers / exhausts 5,4 4,8 6,4 8,2 14,5 15,3 15,9 17,3
Springs 7,8 13,7 13,9 15,5 13,6 20,9 23,7 23,7
Steering wheels / columns / boxes 11,0 9,7 15,1 12,2 23,8 26,2 35,5 37,3
Stitched leather seats / parts 4,3 5,9 7,7 7,1 54,1 41,3 21,7 19,2
Transmission shafts 389,6 406,1 399,3 456,9 542,7 562,9 560,1 654,5
Tyres 762,6 850,3 768,2 770,1 1 455,0 1 619,2 1 607,7 1 486,6
Wiring harnesses 21,5 20,3 19,3 19,6 139,4 229,0 118,6 53,6
Othr parts 3 204,5 2 848,9 2 834,1 3 279,8 6 273,4 5 798,2 6 076,1 5 814,3
Light vehicles 8 487,9 5 750,8 8 159,9 7 583,5 17 091,8 14 566,8 12 980,2 14 324,7
Medium / Heavy vehicles 1 812,0 2 171,6 1 992,9 2 649,1 3 856,9 3 984,2 3 580,2 4 240,6Source: AIEC, SARS* Comparison excluding BLNS (Botswana, Lesotho, Namibia and Swaziland (renamed eSwatini)) country exports** Comparison including BLNS (Botswana, Lesotho, Namibia and Swaziland (renamed eSwatini)) country exports
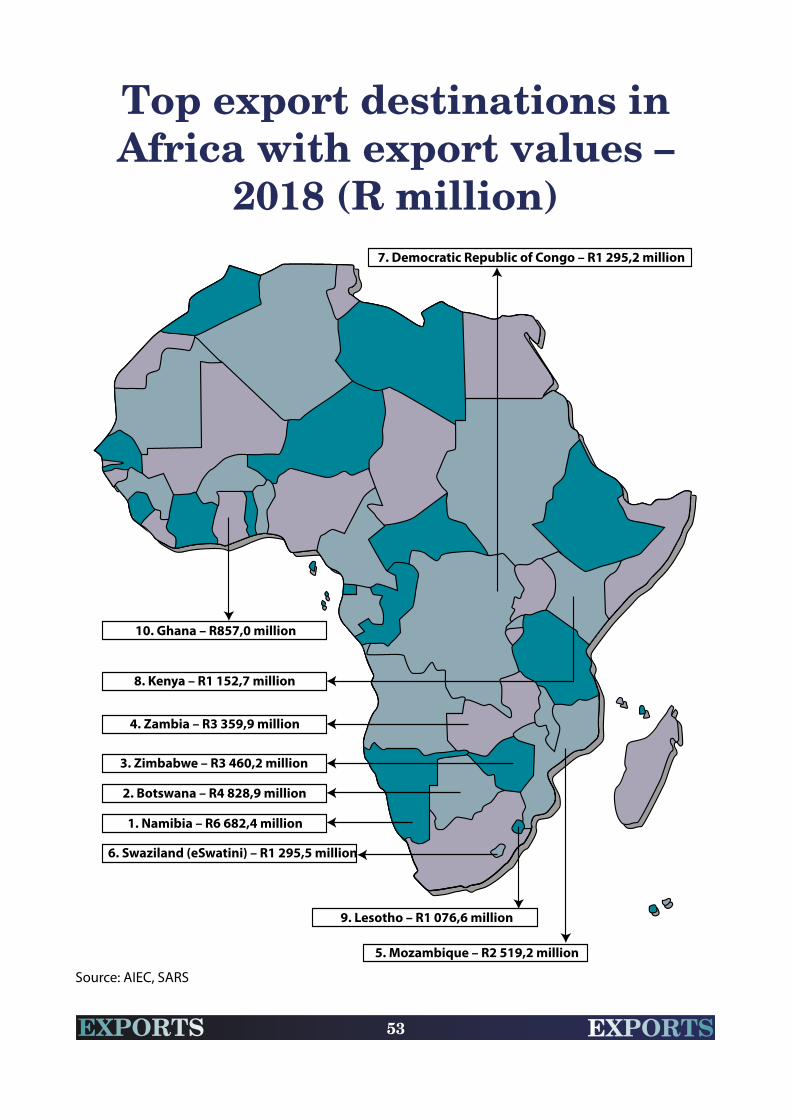
53 EXPORTSEXPORTS
Top export destinations in Africa with export values –
2018 (R million)
Source: AIEC, SARS

54 EXPORTSEXPORTS
Southern African Development Community
(SADC)South Africa’s automotive exports to the Southern African Development Community (SADC) comprised 85,5%, or R27,10 billion, of its total R31,69 billion of automotive exports to the African continent in 2018. Exports of automotive goods to nine of the 15 countries within SADC exceeded the R1 billion level in 2018. The free trade area within SADC, as well as the geographical proximity of these markets, which are relatively easily accessible by road or by rail, contributed to the significant automotive trade with neighbouring countries.
South Africa’s participation in SADC, comprising 15 sub-Saharan African countries, allows access to a market of approximately 352 million people and an estimated regional GDP of US$600 billion. SADC which operates as a free trade area includes the following 15 countries: Angola, Botswana, Democratic Republic of Congo, Lesotho, Madagascar, Malawi, Mauritius, Mozambique, Namibia, Seychelles, South Africa, Swaziland (renamed eSwatini), Tanzania, Zambia and Zimbabwe. South Africa joined SADC in August 1994. The SADC Protocol on Trade was signed on 24 August 1996 and amended in the years 2000, 2007 and 2008, with the specific simplification of rules of origin and other matters. The objective of the SADC Trade Protocol is to liberalise intra-regional trade by creating mutually beneficial trade arrangements, and thus improving investment and productivity in the region.
The SADC FTA was launched in 2008 when 85% of tariff lines became duty-free. Currently, Angola and the Democratic Republic of Congo remain outside the agreement. SADC member states are committed to eliminating barriers to trade, to ease customs procedures, harmonise trade policies, prohibit unfair business practices, and to eliminate about 98% of SADC’s merchandise trade to zero tariffs. To date, all signatories, except for Zimbabwe, have translated their commitments into domestic enabling legislation. The current rule of origin for SADC in terms of vehicles is a maximum of 60% imported content, expressed as a percentage of the ex-works price, plus a completely knocked-down (CKD) assembly rule. For automotive components, the rule is a maximum of 50% imported content.
Trade within Africa is dominated by trade within regional blocs, not between regional blocs. In SADC, the focus currently is on consolidating the achievements of the free trade area, and working to extend African integration through the pursuit of the tripartite free trade area (TFTA) including SADC, the East African Community (EAC) and the Common Market for Eastern and Southern Africa (COMESA). The TFTA aims to bring about a unified and liberalised single market. The TFTA is anchored on the developmental integration approach, which recognises the complementaries between market integration, industrial development and the addressing of infrastructure constraints. The TFTA provides better alignment of trade rules between countries, and the standardisation of tariffs and duties. There are numerous benefits that would accrue to South Africa as a result of the agreement. These include access to new and dynamic markets characterised by a combined GDP of US$1,3 trillion and a combined population of about 733 million people, which is over half the total Africa population and economy. Some TFTA countries, such as Ethiopia, Rwanda and Tanzania, are among the fastest growing economics on the continent. This has the potential to stimulate industrial development, investment and job creation.
With regard to the TFTA negotiations, SACU has exchanged offers with the EAC in 2016 and with Egypt in 2017, with Ethiopia to follow. The two important elements that were discussed in consultation between

55 EXPORTSEXPORTS
South Africa’s social partners at the National Economic Development and Labour Council (Nedlac) are the rules of origin and offers for the elimination of import tariffs between countries, to create preferential market access. SACU, of which South Africa is the dominant member, is negotiating as a group in the TFTA. The ratification of the TFTA would bring exporters a step closer to enjoying preferential treatment under the agreement. To date, 22 of 26 members have signed the agreement and it will enter into full force once it has been ratified by 14 countries. So far, besides South Africa, only Egypt, Uganda and Kenya have ratified the agreement.
Some overlapping occurs with the same countries being part of more than one Regional Economic Community (REC) but vehicle and automotive component exports to the three RECs in 2018 amounted to R27,11 billion with respect to SADC (R25,56 billion in 2017); R2,29 billion with respect to the EAC (R1,92 billion in 2017); and R12,79 billion with respect to COMESA (R9,51 billion in 2017). Presently, South Africa does not import automotive goods in significant numbers from any African country. The greatest barrier to regional integration is the lack of demand, capacity and industry in other countries. Regional integration is not only critical and important, but is a necessary tool and strategy for development. Establishing regional value chains via the harmonisation of trade regimes, increased market liberalisation, and various other areas of co-operation remain important to present the South African automotive industry with increased export opportunities in future. Regional integration is about co-operation and economies of scale. Volumes can only be achieved if member states continue to make it easier to trade across regional borders. For South African-based OEMs to attain higher production volumes, exports to regional markets should be an attractive proposition. The challenge for South Africa is to offer regional markets an alternative proposition to the importation of used vehicles. In this regard, motorcycle manufacturing in the region, as part of the SAAM 2021-2035 policy amendments, could be ideal for industrialisation in the region.
The TFTA not only marks an important step in promoting regional integration in Africa but is also a building block for the African Continental Free Trade Area (AfCFTA). Continental integration has long been recognised as critical to advancing Africa’s endogenous growth and development. Beyond the TFTA, the AfCFTA will provide new export opportunities for South African automotive products in West Africa and North Africa. The AfCFTA is also being pursued under the development integration approach which combines market integration with industrial and infrastructure development. The AfCFTA has the potential to establish a sizeable market for a range of manufactured products, and in doing so will support the industrialisation of African countries. Improved transport, logistics and foreign investment, however, are essential to smooth the way for the African continent to reduce trade hurdles. Africa’s competitive labour advantage must be accompanied by quality transport hubs, more efficient cross-border movement of goods and services, better port procedures and predictable logistics management.
The AfCFTA will bring together all African countries with a combined population of 1,29 billion people and a combined GDP of more than US$2,3 trillion. Africa is divided into 55 national markets of varying size and diverging growth patterns, none of which on its own has the population or market to support deep industrialisation. Of the 55 African Union member states, 44 signed the agreement to create the AfCFTA on 21 March 2018. Five more countries signed the AfCFTA on 1 July 2018, including South Africa, taking the total to 49. The countries which have not signed yet are Benin, Botswana, Eritrea, Guinea-Bissau, Nigeria and Zambia. The current agreed Phase 1 covers trade in goods and services, it addresses the issues of trade liberalisation, non-tariff barriers, rules of origin, trade facilitation (co-operation between Customs authorities and document harmonisation), transit and transit facilities, technical barriers to trade, standards, institutional arrangements and dispute settlement. To come into effect, the AfCFTA has to be ratified by 22 countries.
Economic integration, in particular, remains a critical component of the continent’s efforts to ensure sustainable and inclusive economic growth, particularly in promoting economies of scale, enabling competitiveness, promoting diversification and addressing constraints in supply. South Africa has been at the forefront of growth in intra-Africa trade and is one of the key sources of investment in the rest of

56 EXPORTSEXPORTS
Africa. These investments are critical in promoting intra-regional value chains and are mutually beneficial in that they not only provide benefits to the countries in which South African firms invest, but also create job opportunities in South Africa. South Africa’s economic growth is intrinsically linked to Africa’s economic growth, and its sustained growth is dependent on its ability to integrate into the regional, continental and global markets.
The following table reveals South Africa’s automotive exports to SADC. Annual comparisons should take account of the following – the 2015 to 2018 total automotive export data to SADC provides two comparisons: one comparison includes exports to Botswana, Lesotho, Namibia and Swaziland (renamed eSwatini) (BLNS countries) in line with the revised publishing format of South African trade data provided by SARS, and the other comparison excludes exports to BLNS countries in order to facilitate historical comparisons. Total automotive exports to SADC, excluding BLNS country data, increased by R407 million, or 3,2%, from R12,81 billion in 2017 to R13,22 billion in 2018. Total automotive exports, including BLNS country data, increased by R1,54 billion, or 6,0%, from R25,56 billion in 2017 to R27,10 billion in 2018. Several SADC countries have consistently remained amongst the South African automotive industry’s top export destinations over the past three decades.
South Africa’s economic growth is intrinsically linked to Africa’s economic growth, and its sustained growth is dependent on its ability to integrate into the regional,
continental and global markets.

57 EXPORTSEXPORTS
Exports to SADC by product category – 2015 to 2018Component 2015* 2016* 2017* 2018* 2015** 2016** 2017** 2018**
Total (R million)Including BLNS country data 27 318,0** 27 279,5** 25 560,6** 27 100,9**
Total (R million) Excluding BLNS country data 10 826,6* 10 630,4* 12 810,4* 13 217,7*
Air conditioners 19,5 32,3 18,6 11,7 38,3 45,5 35,3 28,7
Alarm systems 32,4 27,6 26,4 37,4 64,9 71,7 58,7 58,6
Automotive glass 13,6 14,0 14,0 15,0 69,8 85,5 81,2 81,3
Automotive tooling 193,7 131,7 163,0 185,1 342,0 242,6 287,0 302,1
Axles 48,8 41,2 52,1 122,1 125,8 57,4 80,3 156,2
Batteries 185,6 203,7 247,4 243,2 280,6 326,3 381,0 412,6
Body parts / panels 34,2 18,7 29,4 62,9 122,7 129,4 98,3 140,2
Brake parts 65,6 66,9 71,8 67,9 168,5 180,4 177,7 184,5
Car radios 6,5 6,6 7,1 2,5 21,1 17,5 28,9 16,6
Catalytic converters 76,1 54,6 65,9 100,5 94,9 80,1 99,0 133,5
Clutches / shaft couplings 32,0 33,7 40,5 43,5 90,9 98,0 109,0 122,8
Engines 325,8 357,7 386,2 422,5 435,6 468,2 616,8 590,9
Engine parts 410,7 372,5 428,9 492,6 726,5 721,3 751,9 828,3
Filters 155,7 157,8 187,1 196,8 250,0 279,0 317,3 342,2
Gaskets 79,2 84,0 65,3 63,9 122,5 120,1 105,6 103,9
Gauges / instruments / parts 279,7 244,7 270,0 272,2 400,8 381,4 384,3 386,7
Gear boxes 31,7 26,4 37,5 68,3 74,9 86,8 89,0 131,4
Ignition / starting equipment 82,2 74,9 82,8 76,8 192,7 192,8 199,4 204,0
Jacks 18,7 17,4 13,5 15,3 23,6 24,1 20,3 23,8
Lighting equipment / parts 40,3 40,6 43,0 45,8 82,1 98,6 106,6 118,6
Radiators / parts 24,9 32,0 32,1 46,9 69,6 83,0 90,9 106,4
Road wheels / parts 32,0 21,7 24,9 26,5 77,6 76,9 65,4 67,1
Seats 6,2 5,7 8,1 8,0 15,9 15,6 18,7 20,7
Seat belts 2,4 1,6 2,7 2,6 5,5 5,2 6,3 6,1
Shock absorbers / suspension parts 43,9 32,5 33,6 38,3 77,4 80,3 90,5 114,4
Silencers / exhausts 4,6 4,0 5,6 7,3 13,7 14,5 15,1 16,4
Springs 7,2 11,8 13,2 14,9 13,0 19,0 23,0 23,1
Steering wheels / columns / boxes 9,0 8,1 13,4 9,8 21,8 24,6 33,8 34,9
Stitched leather seats / parts 4,1 5,7 6,5 6,6 53,9 41,1 20,4 18,7
Transmission shafts 342,4 328,4 324,3 401,4 495,5 485,2 485,2 599,0
Tyres 603,6 680,0 606,8 584,2 1 296,0 1 448,9 1 446,3 1 300,8
Wiring harnesses 20,7 16,9 18,6 18,8 138,6 225,6 117,8 52,9
Other parts 2 705,6 2 372,9 2 330,4 2 717,6 5 774,5 5 322,2 5 572,3 5 252,0
Light vehicles 3 354,6 3 137,8 5 202,4 4 210,2 11 958,5 11 953,8 10 022,7 10 951,4
Medium / Heavy vehicles 1 533,4 1 964,3 1 937,3 2 578,6 3 578,3 3 776,9 3 524,6 4 170,1Source: AIEC, SARS * Comparison excluding BLNS (Botswana, Lesotho, Namibia and Swaziland (renamed eSwatini)) country exports** Comparison including BLNS (Botswana, Lesotho, Namibia and Swaziland (renamed eSwatini)) country exports
58 EXPORTSEXPORTS
Top export destinations in SADC with export values –
2018 (R million)
Source: AIEC, SARS
COMESABurundi*Comoros*
Democratic Republic of Congo*Djibouti*
Egypt*Eritrea*
Ethiopia*Kenya*Libya*
MadagascarMalawi
MauritiusRwanda*Seychelles
Sudan*Swaziland (eSwatini)
Uganda*Zambia
Zimbabwe
EACBurundi*Kenya*
Rwanda*TanzaniaUganda*
SADCAngola*
BotswanaDemocratic Republic of Congo*
LesothoMadagascar
MalawiMauritius
MozambiqueNamibia
SeychellesSouth Africa
Swaziland (eSwatini)TanzaniaZambia
Zimbabwe
*The countries marked with an asterix are the ones to which South Africa does not yet have preferential access to with regards to the TFTA.

59 EXPORTSEXPORTS
Mercosur (Mercado Común del Sur - Common Market
of South America)
Mercosur is an economic and political bloc comprising Argentina, Brazil, Paraguay, Uruguay, and Venezuela, with Bolivia, Chile, Colombia, Ecuador, Guyana, Peru, and Suriname as associate members. The associate members receive tariff reductions but do not enjoy full voting rights or complete access to the markets of Mercosur’s full members. Trade with Mercosur remains relatively small in the context of South Africa’s overall automotive trade regime. Total automotive exports to Mercosur amounted to R1,65 billion, or 0,9%, of total South African automotive exports of R178,8 billion in 2018. The decline in automotive exports to Mercosur over recent years could be attributed to the sharp decline of automotive exports to Brazil, related to the country’s Inovar-Auto programme with its objective to reduce automotive imports into the country.
According to the International Organisation of Motor Vehicle Manufacturers (OICA), vehicle production in Mercosur increased by 4,2%, from 3,16 million units in 2017 to 3,29 million units in 2018. Brazil dominated production in the region and recorded a 5,2% year-on-year increase in vehicle production, from the 2,74 million units produced in 2017 to 2,88 million units in 2018. The estimated vehicle parc in Mercosur was in the order of 58,1 million units and the motorisation rate was at 232 vehicles per 1 000 persons. The following table reveals Mercosur’s vehicle production for 2017 and 2018.
Mercosur vehicle production – 2017 to 20182017 2018 % change 2018/2017
Vehicle production 3 158 210 3 291 458 +4,2%
Source: OICA
The Preferential Trade Agreement (PTA) between Mercosur and SACU came into force on 1 April 2016 and covers in the order of 1 000 tariff lines, offering preferential margins of between 10% and 100% on these tariff lines. The PTA was initially concluded in 2004, and it was updated and signed in 2008. The PTA was the first trade agreement concluded by SACU as a single entity. This agreement is also the first with another developing region, giving meaning to the objectives of the South-South co-operation. The PTA creates a basis for further integration and co-operation, including possible further exchanges of tariff preferences, and possible co-operation in other areas. The aim of the agreement is to strengthen existing relations, promote the expansion of trade, and to establish the conditions for the creation of a FTA between Mercosur and SACU. Automotive products are excluded from the arrangement on the side of both parties. However, future negotiations may involve the granting and winning of tariff concessions with respect to automotive products.
The Brazilian government had been discussing a new automotive policy to replace Inovar-Auto, which expired on 31 December 2017. In November 2018, at the inauguration ceremony of the Salão do Automóvel (International Motor Show) in São Paulo, President Temer signed the decree called “Rota 2030” (the Road to 2030) on new rules for Brazil’s vehicle manufacturing industry to shape the evolution of the sector for the next 10 years. The signing took place hours after the Senate passed the measure to create the initiative. The programme has installed a new tax regime for OEMs in Brazil, and they will have to invest in new products,
60 EXPORTSEXPORTS
and new technology research and development in vehicle production to make the Brazilian motor industry competitive on a global scale. Rota 2030 is anticipated to attract more investment to the country with more advanced technologies to be showcased in the next edition of the Salão do Automóvel. The Brazil automotive sector represents in the order of 22% of the country’s GDP and generates over 1,3 million jobs.
With Inovar-Auto, the country was accused of protectionism by several countries. The programme has introduced large increases in the taxation on all cars, especially imports, although manufacturers conforming to a lengthy set of regulations could avoid the charges on their products. Inovar-Auto added a 30% tax to industrial products, except those built in Mexico or the Mercosur countries. Moreover, the increase was in addition to a 35% import duty applicable to vehicles. The 30% tax increase could be negated if OEMs invested in R&D in Brazil and achieved the production of more economical, lower priced and safer vehicles.
The main opportunity offered by Inovar-Auto was the motivation for the automotive industry to internalise international technology and to decrease the wide gap with respect to technological development that exists between Brazil and developed countries. Inovar-Auto has been running since the start of 2013 and was valid until 2017. The tax increase was mostly felt by those automotive component manufacturers and OEMs without plants in Brazil, or those that only assembled vehicles in the country with a high level of imported components. Inovar-Auto had succeeded in its objective of reducing imports of vehicles into Brazil.
In March 2016, the Brazilian authorities published a list of automotive components that were not being manufactured in Brazil, and which would since then attract an import tariff of 2%, compared to the 14%, 16% and 18% tariffs that had been previously charged. The list included 61 automotive parts, some of which are still subject to import quotas. The tax reduction was requested by industry associations, and was aimed at increasing the competitiveness of the domestic OEMs. The products listed include gasoline and diesel engines, volumetric pumps and gear boxes, amongst others, which could potentially present opportunities for exporters from South Africa.
The following table reveals that automotive exports to Mercosur consisted of a limited range of products. Automotive exports to the region increased from R1,43 billion in 2017 to R1,65 billion in 2018. The bulk of exports to the region was destined for Argentina, accounting for R1,32 billion, with Brazil only accounting for R188 million of exports. The substantial decline in vehicles and automotive components to Mercosur over recent years could mainly be attributed to the protectionist policies in Brazil succeeding in its objective of reducing new vehicle imports into the country.
The bulk of exports to the region was destined for
Argentina, accounting for R1,32 billion, with Brazil
only accounting for R188 million of exports.
61 EXPORTSEXPORTS
Exports to Mercosur by product category – 2014 to 2018Component 2014 2015 2016 2017 2018
Total (R million) 2 270,8 3 481,7 1 764,7 1 427,9 1 646,4
Air conditioners 0,1 - 1,0 0,6 -
Alarm systems 0,5 0,1 0,5 1,3 0,9
Automotive glass 0,9 1,2 0,9 - -
Automotive tooling 44,7 9,5 22,5 4,2 9,1
Axles 1,5 14,7 11,3 5,9 5,1
Batteries 0,2 0,6 - - -
Body parts / panels 5,0 0,5 1,4 0,3 0,2
Brake parts 0,1 0,4 0,8 0,3 0,1
Car radios 0,9 - - - -
Catalytic converters 243,4 174,6 196,9 222,0 256,6
Clutches / shaft couplings 5,7 4,0 3,3 3,7 5,8
Engines 0,5 - - 8,0 0,1
Engine parts 215,2 232,8 319,4 284,7 314,8
Filters 2,2 1,7 4,4 5,8 1,3
Gaskets 0,5 0,9 1,3 0,4 0,4
Gauges / instruments / parts 3,3 7,8 9,5 9,4 13,8
Gear boxes 0,1 - - 0,1 0,1
Ignition / starting equipment 0,1 0,1 1,5 1,6 0,1
Lighting equipment / parts 0,2 0,3 0,1 2,5 0,3
Radiators / parts 0,1 17,4 20,6 20,6 48,1
Road wheels / parts 152,1 92,7 46,1 89,7 114,0
Seat belts - 0,1 - - -
Seats 0,2 0,2 0,2 - -
Shock absorbers / suspension parts 0,2 - 0,4 0,1 0,7
Silencers / exhausts 27,1 14,8 19,0 11,2 8,7
Springs 0,2 - - - -
Steering wheels / columns / boxes 0,1 - 1,0 - -
Stitched leather seats / parts 2,1 3,4 1,8 0,8 1,8
Transmission shafts 67,6 68,8 45,7 60,1 120,2
Tyres 14,0 0,6 2,1 2,7 10,4
Wiring harnesses 1,3 0,4 3,6 0,4 0,2
Other parts 540,3 399 2 429,6 427,0 418,0
Light vehicles 939,3 2 427,7 617,5 260,2 315,6
Medium / Heavy vehicles 0,9 7,2 2,3 4,3 -
Source: AIEC, SARS

62 EXPORTSEXPORTS
Top export destinations in Mercosur with export values –
2018 (R million)
Source: AIEC, SARS

63 EXPORTSEXPORTS
EXPORTS TO COUNTRIES
According to the World Bank, global economic growth is projected to moderate from 3% in 2018 to 2,9% in 2019 amid rising downside risks. International trade and manufacturing activity have softened, trade tensions remain elevated, and some large emerging markets have experienced substantial financial market pressures. A deceleration in global growth may start to weigh on export growth going forward, and thus, in an emerging borderless, connected and globalised economy new strategies will be key to maintaining and increasing the importance of global trade. International trade is a primary vehicle for the movement of international capital to developing nations, which ultimately drives economic development. Although the world trade in goods is maintaining a healthy robust recovery, it still might falter if trade tensions escalate further and if governments resort to restrictive trade policies. New trade restrictions could trigger cycles of retaliation that weigh on global trade and output, and a cycle of retaliation is the last thing the world economy needs.
Global trade has operated within a rules-based framework, with at its pinnacle the 164 membership World Trade Organisation’s (WTO) multilateral trading system, established in 1994. Many countries, including South Africa, have accepted that a multilateral rules-based system is desirable. It creates space for developed and developing countries alike to participate in negotiating binding and enforceable rules.
South Africa’s established export markets in the Eurozone and NAFTA remain important as they are long-standing relationships that come with technology and knowledge transfers, and offer markets that are not without further possibilities. However, in recent years, Africa and Asia have become important destinations for South African automotive products, as these economies have grown and trade ties have strengthened. The wider geographical exposure also mitigates the impact of domestic or regional cyclical economic conditions by diversifying risk.
It is therefore becoming increasingly important for the domestic automotive industry to diversify into new markets with exports, and to intensify its present export basket of value-added, manufactured and beneficiated automotive products. Diversity places the emphasis on high-growth emerging markets and will facilitate opportunities for collaboration between large businesses, such as the OEMs and first-tier automotive component suppliers and SMMEs, and create export-orientated opportunities for these enterprises in the automotive supply chain.
It is therefore becoming increasingly important for
the domestic automotive industry to diversify into
new markets with exports.
64 EXPORTSEXPORTS
South African automotive industry’s top export destinations - 2018 (R million)
Source: AIEC, SARS
The focus of the domestic automotive industry is to build on existing exports and to escalate the importance of exploring and exploiting new export opportunities. The following table reveals that export destinations, for values in excess of R1 million, reached the record number of 155 in 2018, up from the 149 in 2017, with 25 countries recording export values in excess of R1 billion, and 71 countries recording export values in excess of R100 million. The South African automotive industry forms an important part of international supply chains by being fully integrated into the global automotive environment. Diversification into new emerging markets is a continuing trend and underlines the automotive industry’s competitiveness drive and the continuous widening of the country’s traditional trading base. The latter is highlighted by new export destinations appearing in the industry’s export list of countries every year, as well as the specific destinations to which the export values more than doubled on a year-on-year basis. From 2017 to 2018, the total export values more than doubled in the case of 25 countries, which include: the UK, Mexico, Switzerland, Nigeria, Cape Verde Islands, Benin, Cameroon, Georgia, Barbados, Paraguay, Algeria, Bahamas, St Lucia, East Timor, Dominica, Central African Republic, Macao, Slovak Republic, Andorra, Puerto Rico, Tokelau Islands, Equatorial Guinea, Syria, Malta and Fiji.
1 Germany R57 614.3
2 United Kingdom R17 170.1
3 Belgium R11 537.3
4 Japan R9 429.6
5 United States R9 304.7
6 Spain R7 913.9
7 Namibia R6 682.4
8 Botswana R4 828.9
9 Australia R4 142.7 10 South Korea R3 492.7

65 EXPORTSEXPORTS
Total automotive export value and ranking by country – 2017 to 2018
Country 2017R million
2017Ranking
2018R million
2018Ranking
Germany 46 721,7 1 57 614,3 1
UK* 8 474,3 5 17 170,1 2
Belgium 13 948,1 3 11 537,3 3
Japan 8 884,8 4 9 429,6 4
USA 18 821,2 2 9 304,7 5
Spain 7 440,8 6 7 913,9 6
Namibia 7 124,8 7 6 682,4 7
Botswana 4 702,9 9 4 828,9 8
Australia 4 724,5 8 4 142,7 9
South Korea 2 403,4 13 3 492,7 10
Zimbabwe 2 560,5 12 3 460,2 11
Zambia 2 905,6 11 3 359,9 12
France 3 136,1 10 3 076,7 13
Mozambique 1 973,6 15 2 519,2 14
Thailand 2 166,0 14 2 400,2 15
Czech Republic 1 485,1 18 2 259,1 16
India 1 938,4 16 1 507,5 17
Mexico* 278,7 45 1 409,2 18
Argentina 1 203,9 20 1 318,0 19
United Arab Emirates 756,1 27 1 299,2 20
Swaziland (renamed eSwatini) 1 375,8 19 1 295,5 21
Democratic Republic of Congo 1 027,6 22 1 295,2 22
Taiwan 1 110,5 21 1 221,8 23
Kenya 985,8 24 1 152,7 24
Lesotho 1 552,7 17 1 076,6 25
25 COUNTRIES ABOVE R1 BILLION
Netherlands 528,2 33 921,4 26
Hungary 804,3 26 881,7 27
Ghana 988,1 23 857,0 28
Turkey 736,1 28 747,9 29
Switzerland* 230,9 49 701,5 30
Malawi 683,8 30 689,3 31
Singapore 697,3 29 634,3 32
Tanzania 565,8 32 621,7 33
Poland 596,1 31 519,2 34
Italy 479,8 34 507,6 35
Angola 408,8 37 501,2 36
Nigeria* 198,2 51 481,2 37
Mauritius 411,0 36 461,3 38
Hong Kong, China 354,1 39 443,2 39
Portugal 341,6 40 422,2 40

66 EXPORTSEXPORTS
Sweden 285,7 43 418,0 41
Uganda 269,5 46 392,6 42
Saudi Arabia 195,9 53 331,6 43
Greece 182,8 56 322,7 44
Romania 285,1 44 319,4 45
New Zealand 304,1 41 286,6 46
Madagascar 223,6 50 277,8 47
Gibraltar 169,0 58 267,3 48
Estonia 139,4 62 265,0 49
China 298,1 42 263,0 50
Panama 188,8 55 253,2 51
Cape Verde Islands* 101,6 68 223,8 52
Ivory Coast 240,0 48 217,8 53
Norway 418,9 35 211,0 54
Brazil 148,3 60 188,1 55
Austria 196,1 52 186,7 56
Qatar 368,0 38 185,4 57
Malaysia 149,7 59 175,3 58
Finland 192,6 54 165,1 59
Canada 848,0 25 158,6 60
Gabon 145,0 61 142,6 61
Ethiopia 255,1 47 140,3 62
Senegal 107,6 67 139,8 63
Chile 73,4 78 131,8 64
Trinidad & Tobago 92,9 71 129,9 65
Rwanda 95,3 69 125,4 66
Slovenia 120,5 63 120,4 67
Ireland 74,7 77 119,2 68
Reunion 116,8 64 106,8 69
Denmark 94,4 70 106,1 70
Benin* 40,7 95 100,7 71
71 COUNTRIES ABOVE R100 MILLION
Guadeloupe 78,9 75 99,3 72
Iceland 75,4 76 89,1 73
Oman 110,3 65 84,1 74
Dominican Republic 69,7 82 78,7 75
Surinam 50,3 88 74,6 76
Djibouti 57,9 84 62,2 77
Sri Lanka 44,1 94 60,4 78
Martinique 79,6 74 59,9 79
Bulgaria 172,2 57 59,5 80
French Guiana 53,1 86 57,5 81
Guatemala 70,1 81 55,9 82
Guinea 46,9 91 54,4 83

67 EXPORTSEXPORTS
Costa Rica 39,2 97 53,7 84
Jamaica 51,6 87 50,3 85
Pakistan 109,2 66 48,5 86
Mali 87,4 73 48,3 87
Honduras 46,0 92 47,2 88
Kazakhstan 36,6 98 46,2 89
Cameroon* 17,1 112 42,1 90
Indonesia 29,7 105 38,5 91
Burkina Faso 72,7 79 38,5 92
Israel 45,9 93 37,9 93
Sierra Leone 53,3 85 36,4 94
Seychelles 47,4 89 36,1 95
Russia 22,0 109 34,9 96
Philippines 61,2 83 32,4 97
Republic of Congo 20,8 110 31,8 98
Morocco 36,6 99 31,3 99
Togo 35,4 100 31,1 100
Tunisia 34,7 101 27,5 101
Peru 40,7 96 27,2 102
Egypt 34,7 102 26,8 103
Cyprus 25,3 107 25,8 104
Croatia 47,1 90 25,2 105
Georgia* 0,5 - 22,4 106
Bahrain 33,7 103 19,8 107
Liberia 32,3 104 19,2 108
Latvia 13,2 115 17,5 109
Netherlands Antilles 8,8 118 15,4 110
Mauritania 28,2 106 14,8 111
El Salvador 13,3 114 14,6 112
Barbados* 1,6 141 13,4 113
Eritrea 8,7 119 10,7 114
Nicaragua 5,7 125 10,1 115
Kuwait 89,8 72 8,7 116
Vietnam Republic 10,5 117 8,6 117
Ecuador 12,8 116 8,4 118
St Helena 17,6 111 8,3 119
Brunei 4,6 129 8,1 120
Paraguay* 0,2 - 7,1 121
Antigua 6,2 123 6,8 122
Bangladesh 7,4 121 6,7 123
Somalia 5,3 128 6,0 124
Algeria* 1,6 143 5,4 125
Jordan 71,2 80 5,4 126
Bahamas* 2,0 139 4,8 127

68 EXPORTSEXPORTS
Lebanon 5,3 127 4,6 128
Colombia 5,5 126 4,3 129
St Lucia* 0,4 - 4,2 130
East Timor* 1,2 144 3,6 131
Dominica* 0,4 - 3,5 132
Central African Republic* 0,5 - 3,4 133
Macao* - - 3,0 134
Papua New Guinea 2,7 134 2,9 135
Cuba 13,6 113 2,9 136
Slovak Republic* 0,3 - 2,7 137
Myanmar 3,5 132 2,6 138
Aruba 3,5 133 2,3 139
Gambia 7,8 120 2,2 140
Andorra* - - 2,2 141
Burundi 5,9 124 1,8 142
Sudan 2,5 135 1,8 143
Puerto Rico* 0,1 - 1,8 144
Tokelau Islands* - - 1,5 145
Equatorial Guinea* 0,5 - 1,3 146
Syria* 0,1 - 1,3 147
Antarctica 2,2 137 1,3 148
Guyana 1,6 142 1,3 149
Grenada 1,7 140 1,2 150
Malta* - - 1,2 151
Fiji* 0,5 - 1,2 152
Niger 1,1 147 1,1 153
Bolivia 7,0 122 1,1 154
Iran 2,2 136 1,0 155
155 COUNTRIES ABOVE R1 MILLIONSource: AIEC, SARS*Countries with export values more than doubling year-on-year
In recent years, the importance of BRICS and south-south co-operation has grown tremendously, especially in light of the recent increase in protectionist measures pursued by traditional powerhouses in North America and Europe. Located in Asia, Africa, Europe and South America, the five member countries of BRICS are all regional or sub-regional economic leaders. For South Africa, admission into BRICS (Brazil, Russia, India, China and South Africa) on 24 December 2010 has enhanced the country’s international stature, and trade and economic relations with these major economic forces. Although South Africa’s economy is small compared with the other BRICS countries, the country’s invitation into BRICS was a show of confidence in Africa’s largest economy and the realisation of the importance of South Africa, not only in Africa, but on the global stage.
Every BRICS country has different resource endowments, industrial advantages and economic systems, each complementing an already solid foundation for industrial co-operation. With a population of 1,3 billion, China is the second largest economy in the world and is increasingly playing an important and influential role in the development of the global economy. Integrating South Africa into BRICS and continental value chains will play a critical role in expanding its growth momentum. Both South Africa’s

69 EXPORTSEXPORTS
exports to and imports from other BRICS countries have grown at a faster rate than South Africa’s global trade, thus increasing the importance of other BRICS countries in South Africa’s trade basket. South Africa’s participation in BRICS, therefore, provides opportunities to build its domestic manufacturing base, enhance value-added exports, promote technology sharing, support small business development and expand trade and investment opportunities. This is more likely to be achieved through participation in the value chains of these countries.
In an automotive context, China, with 27,81 million units, was the biggest global vehicle-producing country in 2018, with India in the 4th position, Brazil in 8th and Russia in 13th position. China and India were among South Africa’s top 10 automotive trading partners in 2018. However, the automotive trade balance remains in favour of all four of these countries. In 2018, the automotive import to export value ratio was 67,3 to 1 in favour of China, 22,8 to 1 in favour of Brazil, 7,6 to 1 in favour of India, and 2,2 to 1 in favour of Russia. Hence, the need for BRICS nations to identify complementarities, share experiences and promote capacity building in automotive trade and investment-related issues. With regard to India, the Southern African Customs Union (SACU) and India began a formal process of trade negotiations on a preferential trade agreement (PTA) in 2008. The proposed PTA has been dormant for some time but has been resuscitated through a directive of the SACU Ministers of Trade to consider additional tariff lines for preferences to India, while also increasing the margins. A PTA is confined to products (or tariff lines) of special interest to the respective parties and could be used as an incremental building block to enhance trade in future. Automotive products also feature in these lists of export interest and could potentially enhance trade and investment opportunities in the domestic automotive industry. Many synergies between South Africa and India already exist that could be used to enhance two-way automotive trade between the two countries. India was South Africa’s 8th largest automotive trading partner in 2018, as well as the domestic industry’s main country of origin for vehicle imports in volume terms over recent years. Although the South African automotive industry is pursuing efforts to increase and diversify its automotive exports to India, it relies on government to focus on resolving barriers that are impeding infrastructure and trade.
China and India were among South Africa’s top
10 automotive trading partners in 2018.

70 EXPORTSEXPORTS
AUTOMOTIVE COMPONENTS – EXPORTS BY COUNTRY
South African component manufacturers have a proven track record as competent, professional and reliable suppliers who respect intellectual property obligations, manufacture to the highest international quality standards and supplier requirements to many of the world’s largest OEMs, either directly, or as tier suppliers into their global value chains. The automotive component sector in South Africa consists of a diverse group of various tier-level automotive suppliers. There are in the order of 180 first-tier suppliers of which about 75% are foreign multinational companies. South African-owned companies are more represented within the second- and third-tier supplier bases that supply the sub-parts built into completed components. At present, the OEMs create and capture the most value from the sector, while in comparative economies there are many more domestic suppliers undertaking a greater level of value addition. The shallow lower-tier base in the country, in particular, is a focus area for intervention and rejuvenation, as this space is expected to deliver many opportunities for the big drive in terms of developing transformed value chains and introducing new black-owned entrants into the sector.
Localisation, however, is not the sole domain of the OEMs, but also the Tier 1 firms need to duplicate localisation opportunities. Developing localisation is a multi-dimensional challenge requiring a multi-faceted response. At the most basic level it is associated with improving South Africa’s factor cost profile (overheads, labour, and materials costs) and productivity, along with the economy’s ability to ensure technology and skills availability ahead of industry demand. Additional key elements relate to the creation of targeted specialisation within the automotive value chain, and the potential to strategically link South Africa’s materials base with emerging automotive opportunities.
The automotive sector is the mainstay of the country’ industrialisation landscape, and a deep and competitive supply chain is where the major economic benefits would be leveraged. The post-2020 policy environment has heightened the focus on localisation. Although a major portion of the domestic vehicle production is exported, a vibrant and growing domestic market is also vital for the automotive industry that is expected to make huge investments in localisation. Export volumes are decided by the parent companies, and are dependent on the cost and reliability of production. Higher vehicle production volumes will improve industry competitiveness through improved economies of scale and the broader benefits associated with increased product and production specialisation. However, whilst the production of the local OEMs is crucial, the largest economic spin-offs will be realised in the supply chain. Wider and deeper localisation, therefore, remains one of the critical factors in ensuring the sustainability of the South African automotive industry. Localisation of components creates jobs, increases international competitiveness, facilitates technology transfer and deepens industrialisation.
Transformation goes hand in hand with localisation. The automotive industry supports this imperative, especially that of black supplier development. Various automotive industry initiatives are underway to identify and develop black-owned businesses which would benefit from a government funding programme for black industrialists, and which would contribute towards further value-addition and diversification. At industry level, the focus is on an ambitious multi-billion Rand initiative known as the Automotive Transformation Fund – a proposed black-managed fund to drive automotive industry black supplier development, downstream enterprise supplier development, upstream dealer initiatives, and job creation. In essence, the initiative represents an equity equivalent project in lieu of the BBBEE scorecard ownership points. At individual company level, OEMs, component manufacturers, as well as importers and distributors, are pursuing a broad range of transformation projects with a specific focus on enterprise development,

71 EXPORTSEXPORTS
black component supplier development in the automotive sector value chain, as well as black-owned dealerships. The deepening of the local component supplier base under the APDP is important, as it will reduce the risks associated with exchange rate fluctuations and logistics costs.
Top automotive component export destinations by value – 2018 (R million)
Source: AIEC, SARS
The following table reveals that the main destinations for automotive component exports remain first-world markets. Germany has remained the South African automotive industry’s top export destination for component exports over the past three decades. However, emerging markets are starting to feature as important export destinations for the country’s automotive component exports, indicating progress in the South African component manufacturers’ ability to compete globally. In this regard, significant increases in component exports to Thailand, the Czech Republic, South Korea and Mexico are a case in point. South African automotive manufacturers will also increasingly need to drive a strong regionalisation strategy in Africa as one of the key pillars of the SAAM 2021-2035. The approach to localisation is to view it as a regional imperative, as opposed to a domestic focus.
1Germany
2USA
3Namibia
4Thailand
5UK
6Czech
Republic
7Botswana
8Spain
9Zambia
10India
R'million R13 700.5 R4 357.1 R2 519.6 R2 391.5 R2 319.4 R2 259.1 R1 964.7 R1 926.6 R1 620.9 R1 507.5

72 EXPORTSEXPORTS
Automotive component export value and ranking by country – 2017 to 2018Country 2017
R million2017
Ranking2018
R million2018
RankingGermany 14 100,4 1 13 700,5 1
USA 4 235,0 2 4 357,1 2
Namibia 2 610,8 3 2 519,6 3
Thailand 2 159,1 6 2 391,5 4
UK 2 179,0 5 2 319,4 5
Czech Republic 1 485,1 10 2 259,1 6
Botswana 2 123,6 7 1 964,7 7
Spain 2 210,2 4 1 926,6 8
Zambia 1 582,2 9 1 620,9 9
India 1 938,0 8 1 507,5 10
Japan 1 440,0 11 1 479,3 11
Mozambique 1 093,7 13 1 359,4 12
Zimbabwe 1 149,6 12 1 256,3 13
Democratic Republic of Congo 846,1 17 1 196,3 14
Belgium 931,2 16 1 185,1 15
Argentina 1 002,6 14 1 045,0 16
Netherlands 463,2 21 790,9 17
Turkey 721,6 18 628,4 18
Swaziland (renamed eSwatini) 624,3 19 625,9 19
South Korea 527,6 20 592,2 20
Lesotho 984,4 15 440,4 21
Mexico 277,9 25 423,9 22
Hungary 242,8 29 414,5 23
United Arab Emirates 374,2 22 337,6 24
Angola 325,3 23 313,3 25
Poland 316,6 24 309,2 26
Ghana 202,5 31 291,1 27
Australia 235,1 30 271,3 28
Malawi 257,6 27 252,6 29
China 276,2 26 251,4 30
Tanzania 245,4 28 201,6 31
Kenya 172,1 34 194,5 32
Brazil 143,3 36 185,2 33
Canada 195,9 32 157,0 34
Nigeria 87,1 - 139,4 35
Italy 97,2 - 134,9 36
France 146,1 35 128,3 37
Madagascar 70,9 - 109,8 38
Romania 90,7 - 105,1 39
Panama 60,0 - 103,3 40
Malaysia 60,1 - 100,1 41Source: AIEC, SARS

73 EXPORTSEXPORTS
The following tables reveal the automotive component export details for the 41 export destinations recording an export value above R100 million, or 0,2%, of the total automotive component export value of R51,3 billion in 2018. It should be noted that various miscellaneous parts and sub-components, eligible in terms of the APDP and classifiable in the Customs Tariff as “other parts”, have not been included in the following tables.
(1)Country Germany R13 700,5 million
1Catalytic converters
R8 093,8
2Engine parts
R1 083,0
3Radiators / parts
R564,1
4Shock absorbers / suspension parts
R448,0
5Clutches / shaft couplings
R357,9
6Axles
R259,7
7Stitched leather seats /
partsR251,3
8FiltersR145,6
9Body parts / panels
R121,7
10Silencers / exhausts
R113,4
(2)Country USA R4 357,1 million
1Catalytic converters
R2 218,9
2Engine parts
R1 007,6
3Radiators / parts
R200,7
4Automotive tooling
R150,9
5Silencers / exhausts
R68,5
6Gear boxes
R51,1
7Transmission shafts /
cranksR33,4
8TyresR32,9
9Gauges / instruments /
partsR31,6
10Shock absorbers / suspension parts
R29,9
(3)Country Namibia R2 519,6 million
1Tyres
R298,9
2Engine parts
R191,6
3Batteries
R95,7
4Transmission shafts /
cranksR79,9
5FiltersR68,9
6Engines
R55,2
7Ignition / starting
equipmentR53,8
8Gauges / instruments /
partsR52,6
9Lighting equipment /
partsR45,9
10Body parts / panels
R43,3
(4)Country Thailand R2 391,5 million
1Catalytic converters
R835,1
2Engine parts
R661,5
3Transmission shafts /
cranksR81,0
4Shock absorbers / suspension parts
R9,5
5TyresR9,2
6FiltersR7,1
7Clutches / shaft couplings
R5,9
8AxlesR1,7
9Gear boxes
R1,6
10Wiring harnesses
R1,5

74 EXPORTSEXPORTS
(5)Country United Kingdom (UK) R2 319,4 million
1Catalytic converters
R1 606,3
2Automotive glass
R129,5
3Road wheels / parts
R72,2
4TyresR52,6
5Engine parts
R36,8
6Gauges / instruments /
partsR34,9
7Automotive tooling
R28,4
8Engines
R24,1
9Lighting equipment /
partsR16,1
10GasketsR12,8
(6)Country Czech Republic R2 259,1 million
1Catalytic converters
R2 003,9
2Road wheels / parts
R106,3
3Silencers / exhausts
R68,1
4Radiators / parts
R13,0
5Automotive tooling
R7,6
6Engine parts
R2,7
7Wiring harnesses
R1,7
8Stitched leather seats /
partsR1,5
9Lighting equipment /
partsR0,7
10Brake parts
R0,1
(7)Country Botswana R1 964,7 million
1Tyres
R213,7
2Engine parts
R100,3
3Engines
R87,1
4Transmission shafts /
cranksR60,1
5FiltersR56,6
6Automotive tooling
R56,3
7Batteries
R56,2
8Ignition / starting
equipmentR48,4
9Gauges / instruments /
partsR40,2
10Brake parts
R32,0
(8)Country Spain R1 926,6 million
1Catalytic converters
R1 487,4
2Radiators / parts
R201,5
3Silencers / exhausts
R48,9
4Automotive glass
R40,3
5FiltersR18,9
6Automotive tooling
R17,7
7TyresR7,4
8Transmission shafts /
cranksR5,5
9Gear boxes
R4,7
10Engine parts
R1,6
(9)Country Zambia R1 620,9 million
1EnginesR189,8
2Tyres
R121,7
3Engine parts
R110,0
4Transmission shafts /
cranksR84,5
5Batteries
R74,6
6Gauges / instruments /
partsR54,3
7FiltersR50,4
8Automotive tooling
R47,3
9AxlesR45,1
10Catalytic converters
R22,0
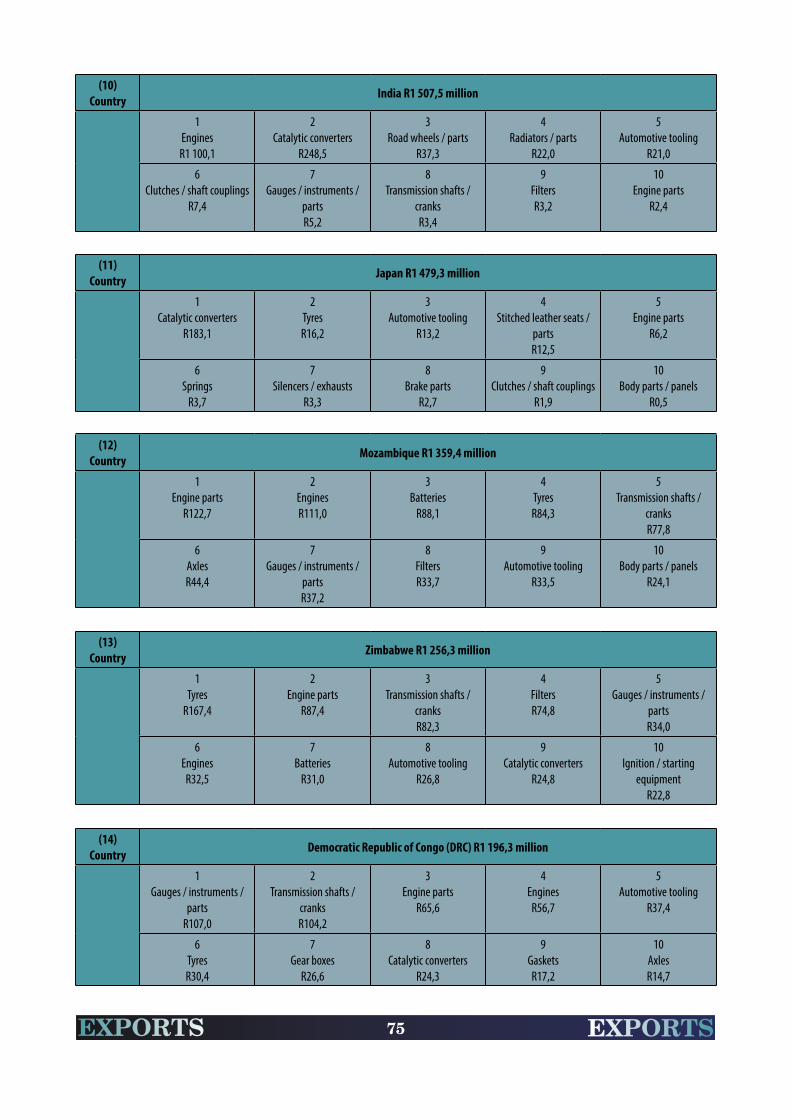
75 EXPORTSEXPORTS
(10) Country India R1 507,5 million
1EnginesR1 100,1
2Catalytic converters
R248,5
3Road wheels / parts
R37,3
4Radiators / parts
R22,0
5Automotive tooling
R21,0
6Clutches / shaft couplings
R7,4
7Gauges / instruments /
partsR5,2
8Transmission shafts /
cranksR3,4
9FiltersR3,2
10Engine parts
R2,4
(11) Country Japan R1 479,3 million
1Catalytic converters
R183,1
2TyresR16,2
3Automotive tooling
R13,2
4Stitched leather seats /
partsR12,5
5Engine parts
R6,2
6Springs
R3,7
7Silencers / exhausts
R3,3
8Brake parts
R2,7
9Clutches / shaft couplings
R1,9
10Body parts / panels
R0,5
(12) Country Mozambique R1 359,4 million
1Engine parts
R122,7
2EnginesR111,0
3Batteries
R88,1
4TyresR84,3
5Transmission shafts /
cranksR77,8
6AxlesR44,4
7Gauges / instruments /
partsR37,2
8FiltersR33,7
9Automotive tooling
R33,5
10Body parts / panels
R24,1
(13) Country Zimbabwe R1 256,3 million
1Tyres
R167,4
2Engine parts
R87,4
3Transmission shafts /
cranksR82,3
4FiltersR74,8
5Gauges / instruments /
partsR34,0
6Engines
R32,5
7Batteries
R31,0
8Automotive tooling
R26,8
9Catalytic converters
R24,8
10Ignition / starting
equipmentR22,8
(14) Country Democratic Republic of Congo (DRC) R1 196,3 million
1Gauges / instruments /
partsR107,0
2Transmission shafts /
cranksR104,2
3Engine parts
R65,6
4Engines
R56,7
5Automotive tooling
R37,4
6TyresR30,4
7Gear boxes
R26,6
8Catalytic converters
R24,3
9GasketsR17,2
10AxlesR14,7

76 EXPORTSEXPORTS
(15) Country Belgium R1 185,1 million
1Tyres
R415,3
2Radiators / parts
R146,2
3Automotive glass
R145,8
4Catalytic converters
R88,8
5Brake parts
R64,6
6Engine parts
R51,5
7Automotive tooling
R40,9
8FiltersR28,1
9Body parts / panels
R15,7
10Clutches / shaft couplings
R13,7
(16) Country Argentina R1 045,0 million
1Engine parts
R313,8
2Catalytic converters
R240,5
3Road wheels / parts
R113,9
4Transmission shafts /
cranksR39,6
5Silencers / exhausts
R3,1
6Shock absorbers / suspension parts
R0,7
7Stitched leather seats /
partsR0,5
8Automotive tooling
R0,3
9Radiators / parts
R0,2
10Gaskets
R0,1
(17) Country Netherlands R790,9 million
1Catalytic converters
R437,0
2Tyres
R192,5
3Radiators / parts
R37,8
4Transmission shafts /
cranksR31,4
5Ignition / starting
equipmentR8,8
6Engine parts
R6,6
7Automotive glass
R6,4
8Stitched leather seats /
partsR5,0
9Silencers / exhausts
R4,8
10Automotive tooling
R4,6
(18) Country Turkey R628,4 million
1Catalytic converters
R544,1
2Silencers / exhausts
R31,1
3Radiators / parts
R26,5
4TyresR14,6
5Stitched leather seats /
partsR3,2
6Transmission shafts /
cranksR1,2
7Automotive tooling
R1,1
8Engine parts
R0,9
9Clutches / shaft couplings
R0,6
10Springs
R0,3
(19) Country Swaziland (renamed eSwatini) R625,9 million
1Tyres
R131,6
2Engine parts
R35,6
3Brake parts
R29,7
4Ignition / starting
equipmentR18,2
5Transmission shafts /
cranksR18,1
6Clutches / shaft couplings
R14,6
7FiltersR13,0
8Gauges / instruments /
partsR12,2
9Body parts / panels
R10,1
10Gaskets
R8,9

77 EXPORTSEXPORTS
(20) Country South Korea R592,2 million
1Catalytic converters
R454,3
2Silencers / exhausts
R40,0
3Automotive tooling
R37,5
4FiltersR20,2
5Radiators / parts
R13,5
6Engine parts
R10,8
7TyresR1,2
8Transmission shafts /
cranksR0,3
9 Lighting equipment /
partsR0,3
10Stitched leather seats /
partsR0,2
(21) Country Lesotho R440,4 million
1TyresR72,4
2Transmission shafts /
cranksR39,6
3Engines
R20,7
4Brake parts
R16,9
5Automotive tooling
R11,4
6Batteries
R9,9
7Gauges / instruments /
partsR9,5
8Shock absorbers / suspension parts
R8,6
9Engine parts
R8,1
10FiltersR6,9
(22) Country Mexico R423,9 million
1Radiators / parts
R171,9
2Catalytic converters
R125,0
3Automotive tooling
R73,1
4Clutches / shaft couplings
R14,1
5Silencers / exhausts
R6,4
6TyresR4,6
7Stitched leather seats /
partsR2,7
8Shock absorbers / suspension parts
R1,2
9Engine parts
R0,4
10Brake parts
R0,1
(23) Country Hungary R414,5 million
1Catalytic converters
R343,6
2Transmission shafts /
cranksR36,8
3Stitched leather seats /
partsR3,3
4Engine parts
R1,5
5Brake parts
R1,1
6Gaskets
R0,6
7Automotive tooling
R0,4
8Shock absorbers / suspension parts
R0,1
9Gear boxes
R0,1
10Radiators / parts
R0,1
(24) Country United Arab Emirates (UAE) R337,6 million
1TyresR62,1
2Automotive tooling
R52,7
3Wiring harnesses
R45,6
4Air conditioners
R23,7
5Gauges / instruments /
partsR22,2
6Ignition / starting
equipmentR14,2
7Engine parts
R6,7
8Body parts / panels
R4,6
9AxlesR4,3
10Engines
R4,3

78 EXPORTSEXPORTS
(25) Country Angola R313,3 million
1TyresR73,9
2Engine parts
R49,9
3Automotive tooling
R20,3
4Gauges / instruments /
partsR14,0
5FiltersR13,8
6Transmission shafts /
cranksR11,9
7Engines
R11,0
8Batteries
R7,5
9Gear boxes
R5,6
10Body parts / panels
R4,5
(26)
Country Poland R309,2 million
1Stitched leather seats /
partsR133,5
2TyresR26,4
3Silencers / exhausts
R19,4
4Lighting equipment /
partsR8,8
5Automotive glass
R6,2
6FiltersR5,1
7Catalytic converters
R3,3
8Wiring harnesses
R3,1
9Gauges / instruments /
partsR0,8
10Transmission shafts /
cranksR0,2
(27) Country Ghana R291,1 million
1TyresR44,4
2Gauges / instruments /
partsR15,7
3Transmission shafts /
cranksR12,9
4Engine parts
R11,3
5Lighting equipment /
partsR6,2
6Catalytic converters
R5,5
7Automotive tooling
R4,9
8FiltersR4,6
9Brake parts
R2,4
10Gaskets
R2,0
(28) Country Australia R271,3 million
1Gauges / instruments /
partsR15,6
2FiltersR11,8
3Transmission shafts /
cranksR10,2
4Engine parts
R7,1
5Automotive tooling
R6,7
6TyresR6,2
7Body parts / panels
R4,7
8Alarm systems
R4,2
9Silencers / exhausts
R3,9
10AxlesR3,7
(29) Country Malawi R252,6 million
1TyresR54,2
2Batteries
R18,4
3Engine parts
R10,1
4FiltersR7,9
5Transmission shafts /
cranksR7,6
6Gauges / instruments /
partsR7,3
7Brake parts
R5,1
8Alarm systems
R4,5
9Clutches / shaft couplings
R4,2
10Engines
R2,9

79 EXPORTSEXPORTS
(30) Country China R251,4 million
1Radiators / parts
R94,7
2Automotive tooling
R56,0
3Clutches / shaft couplings
R39,1
4Engine parts
R7,6
5TyresR7,5
6Transmission shafts /
cranksR6,3
7Gauges / instruments /
partsR4,1
8Silencers / exhausts
R1,4
9Brake parts
R1,0
10Gear boxes
R0,8
(31)
Country Tanzania R201,6 million
1TyresR41,3
2Transmission shafts /
cranksR19,5
3Engine parts
R13,0
4Gauges / instruments /
partsR10,0
5Batteries
R7,2
6Engines
R4,7
7FiltersR3,5
8Automotive tooling
R3,2
9Catalytic converters
R2,9
10Body parts / panels
R2,0
(32) Country Kenya R194,5 million
1TyresR56,6
2Engine parts
R14,3
3Gauges / instruments /
partsR10,7
4Automotive tooling
R9,7
5FiltersR4,8
6Transmission shafts /
cranksR3,6
7Brake parts
R2,5
8Clutches / shaft couplings
R2,1
9Gaskets
R2,1
10Ignition / starting
equipmentR2,1
(33) Country Brazil R185,2 million
1Radiators / parts
R47,9
2Catalytic converters
R16,0
3Gauges / instruments /
partsR12,8
4Automotive tooling
R8,1
5Clutches / shaft couplings
R5,8
6Silencers / exhausts
R5,6
7AxlesR4,9
8TyresR2,4
9Stitched leather seats /
partsR1,3
10FiltersR0,8
(34) Country Canada R157,0 million
1Catalytic converters
R48,9
2Steering wheels / columns / boxes
R10,5
3Wiring harnesses
R7,8
4Air conditioners
R6,7
5Engines
R3,5
6SeatsR3,2
7Lighting equipment /
partsR2,1
8Engine parts
R1,7
9Stitched leather seats /
partsR1,6
10Automotive tooling
R1,4

80 EXPORTSEXPORTS
(35) Country Nigeria R139,4 million
1TyresR27,0
2Automotive tooling
R21,2
3Engine parts
R8,7
4FiltersR5,3
5Gauges / instruments /
partsR4,5
6Transmission shafts /
cranksR2,5
7Air conditioners
R2,1
8Gaskets
R1,3
9JacksR1,0
10Alarm systems
R1,0
(36) Country Italy R134,9 million
1Automotive glass
R23,7
2Automotive tooling
R23,6
3Silencers / exhausts
R9,1
4Catalytic converters
R7,8
5Engine parts
R6,0
6Gaskets
R4,0
7TyresR3,7
8Transmission shafts /
cranksR1,6
9Gauges / instruments /
partsR1,1
10Road wheels / parts
R1,0
(37) Country France R128,3 million
1Automotive glass
R48,9
2FiltersR11,5
3TyresR11,3
4Catalytic converters
R8,4
5Engines
R7,6
6Automotive tooling
R4,6
7Lighting equipment /
partsR4,5
8Engine parts
R2,4
9Transmission shafts /
cranksR2,2
10Gauges / instruments /
partsR1,9
(38) Country Madagascar R109,8 million
1Engine parts
R28,6
2Transmission shafts /
cranksR11,5
3Gauges / instruments /
partsR4,9
4Gaskets
R4,1
5Batteries
R2,4
6FiltersR1,8
7TyresR1,8
8Catalytic converters
R1,3
9Automotive tooling
R1,3
10Ignition / starting
equipmentR1,3
(39) Country Romania R105,1 million
1Stitched leather seats /
partsR35,0
2Catalytic converters
R34,2
3Road wheels / parts
R1,0
4Silencers / exhausts
R0,5
5Alarm systems
R0,1
6Automotive tooling
R0,1- - - -
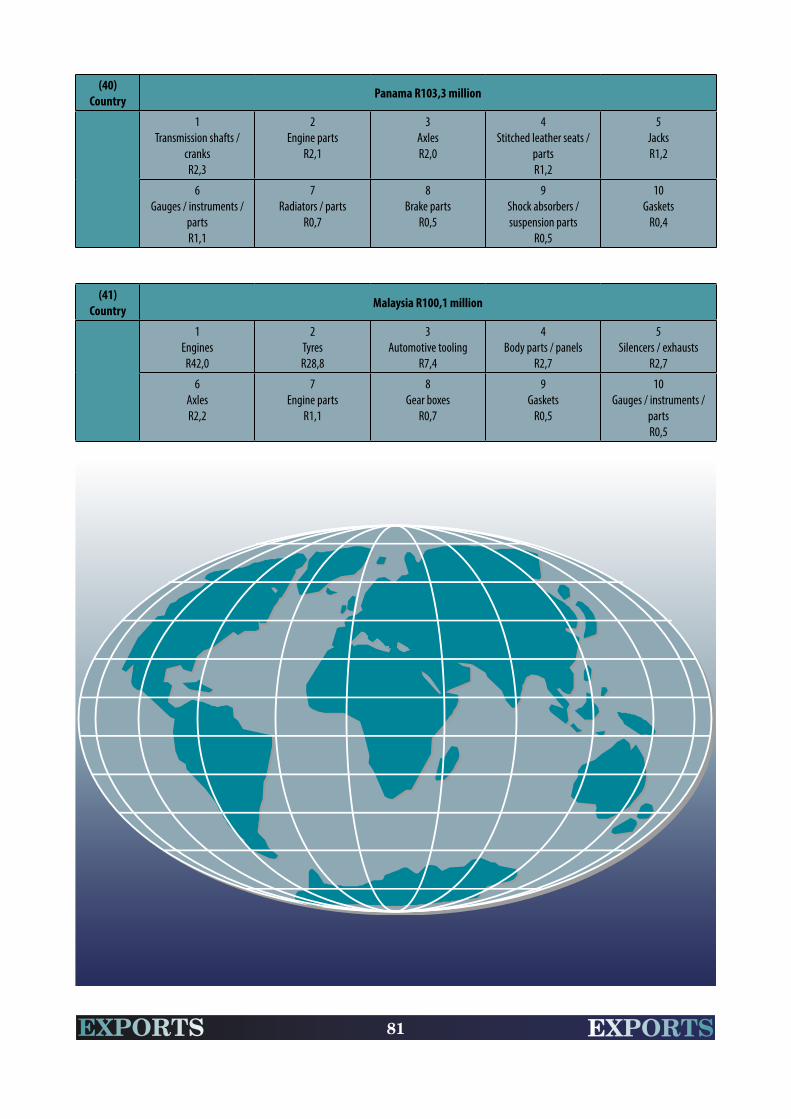
81 EXPORTSEXPORTS
(40) Country Panama R103,3 million
1Transmission shafts /
cranksR2,3
2Engine parts
R2,1
3AxlesR2,0
4Stitched leather seats /
partsR1,2
5JacksR1,2
6Gauges / instruments /
partsR1,1
7Radiators / parts
R0,7
8Brake parts
R0,5
9Shock absorbers / suspension parts
R0,5
10Gaskets
R0,4
(41) Country Malaysia R100,1 million
1Engines
R42,0
2TyresR28,8
3Automotive tooling
R7,4
4Body parts / panels
R2,7
5Silencers / exhausts
R2,7
6AxlesR2,2
7Engine parts
R1,1
8Gear boxes
R0,7
9Gaskets
R0,5
10Gauges / instruments /
partsR0,5
82 EXPORTSEXPORTS
AUTOMOTIVE COMPONENTS – EXPORTS BY PRODUCT
A diverse range of original equipment components and aftermarket parts are manufactured in South Africa. The bulk of the domestically manufactured automotive components are sold as original equipment components to the OEMs or as replacement parts. However, automotive component manufacturers are also active in the export market, selling their products into international OEM supply chains. Requirements for successful export growth include economies of scale, cost competitiveness, reliability of supply, and just-in-time delivery performance.
Along with other vehicle manufacturing subsidiaries, South Africa is strategically located to manufacture certain vehicle models for the global market, which means that a domestically manufactured vehicle is identical to vehicles manufactured elsewhere. This implies that domestic automotive component suppliers must be able to deliver technology and quality levels that are on par with those found anywhere else in the world, at a comparable cost. The South African Automotive Supplier Benchmarking Report 2018 shows that South African component suppliers have advanced their competitiveness and productivity in recent years. Suppliers are making real progress, and leading performance is attainable and possible within the domestic environment.
The country’s automotive component sector will be well served by implementing innovative growth strategies in the short to medium term. These include pursuing increased value-addition of products through forward or backward vertical integration; assessing whether the company’s existing manufacturing capability and technology fit the needs of what is driving domestic and targeted export markets; as well as securing contracts linked to large-scale export platforms. The potential for high value-adding automotive component manufacturing segments, such as the drivetrain and telematics segments, exists under the SAAM 2021-2035, as higher vehicle production volumes would make investment projects more viable.
However, for any localisation to be achieved, supplier competitiveness against global peers is key. Since localisation is a critical tool for industrial development, a national co-ordinating body, the Automotive Supply Chain Competitiveness Initiative (ASCCI) was established in December 2013, with the mandate of co-ordinating supply chain development activities within the South African automotive industry. ASCCI is a jointly-funded, collaborative initiative between the suppliers, OEMs, government and labour, with the objectives of increasing supplier manufacturing value-add, enabling local supply chain capabilities, increasing local content, growing employment, and advancing transformation. The increase of local value-addition is key not only to the sustainability of the local automotive industry but to the multitude of benefits that the sector delivers being felt more widely across the economy. For example, projects involving 75 suppliers over the last three years significantly reduced waste and improved processes to support their competitiveness. ASCCI highlights not only the need for focused interventions, but also the value of co-operation between stakeholders in the industry in making these initiatives a success.

83 EXPORTSEXPORTS
Top automotive component exports by value – 2018 (R million)
Source: AIEC, SARS
The following table reveals the automotive component export ranking by product category from 2014 through to 2018. In 2018, automotive component exports, including sales to the BLNS (Botswana, Lesotho, Namibia and Swaziland (renamed eSwatini)) countries, increased by 2,0% to R51,30 billion, from R50,28 billion in 2017. South Africa remains a strategic supplier of catalytic converters to the world, and by value, this component category maintained its dominant export position under the APDP in 2018, as the focus of exporters tends to be on high-value domestically beneficiated, logistics-friendly automotive components. The significant increase in the exports of engines over recent years relates to the EA111 engine for the VW Polo and Polo Vivo, and the Duratorq TDCi turbodiesel engine for the Ford Ranger, Ford Raptor and Ford Everest sports-utility vehicle, both linked to export programmes, and which are manufactured in South Africa, illustrating the country’s manufacturing capabilities.
1Catalytic
convertors
2Engineparts
3Tyres
4Engines
5Radiators
6Transmis-sion shafts
7Automotive
tooling
8Filters
9Gauges /
Instrumentparts
10Shock
absorbers
R'million R19 219.6 R4 162.4 R2 547.2 R1 873.7 R1 658.7 R1 112.2 R1 056.1 R637.2 R634.8 R618.0
South Africa remains a strategic supplier of catalytic
converters to the world.

84 EXPORTSEXPORTS
Automotive component export ranking by product category – 2014 to 2018
Component category 2014 2015 2016 2017 2018% of total
export value
Ranking
Total (R million)Including BLNS country data 45 682 49 641 53 041 50 275 51 296
Catalytic converters 19 493 20 326 21 892 18 702 19 220 37,5% 1
Engine parts 3 732 3 941 3 901 3 773 4 162 8,1% 2
Tyres 2 206 2 193 2 527 2 516 2 547 5,0% 3
Engines 364 1 448 2 110 2 447 1 874 3,7% 4
Radiators / parts 1 172 1 190 1 378 1 525 1 659 3,2% 5
Transmission shafts / cranks 1 102 1 060 982 975 1 112 2,2% 6
Automotive tooling 936 1 459 861 839 1 056 2,1% 7
Filters 475 460 600 588 637 1,2% 8
Gauges / instruments / parts 640 685 627 626 635 1,2% 9
Shock absorbers / suspension parts 518 480 560 560 618 1,2% 10
Clutches / shaft couplings 383 430 538 653 612 1,2% 11
Stitched leather seats / parts 1 286 993 768 525 538 1,0% 12
Automotive glass 451 389 480 440 510 1,0% 13
Axles 377 421 362 401 464 0,9% 14
Silencers / exhausts 504 535 618 521 463 0,9% 15
Road wheels / parts 367 471 427 531 438 0,9% 16
Batteries 383 358 337 393 428 0,8% 17
Body parts / panels 269 301 325 284 315 0,6% 18
Brake parts 225 230 297 274 305 0,6% 19
Lighting equipment / parts 239 237 263 258 279 0,5% 20
Ignition / starting equipment 255 257 280 255 276 0,5% 21
Gear boxes 153 145 137 187 222 0,4% 22
Gaskets 176 192 184 171 162 0,3% 23
Wiring harnesses 264 260 415 257 147 0,3% 24
Alarm systems 125 102 116 90 92 0,2% 25
Air conditioners 94 102 66 63 70 0,1% 26
Steering wheels / columns / boxes 51 39 43 53 65 0,1% 27
Springs 35 28 45 48 45 0,1% 28
Seats 21 26 28 32 37 0,1% 29
Jacks 39 36 38 30 34 0,1% 30
Car radios 25 24 21 36 18 0,1% 31
Seat belts 7 7 7 8 8 - 32
Other parts 9 315 10 816 11 808 12 214 12 248 23,9%Source: AIEC, SARS
The following tables reveal the top five destinations for the automotive product category exports from South Africa from 2014 through to 2018.


86 EXPORTSEXPORTS
Catalytic converters (1)Country 2014 2015 2016 2017 2018
Total (R million) 19 492,7 20 325,7 21 891,5 18 702,2 19 219,6
Germany 42% 44% 45% 48% 42%
USA 15% 20% 20% 12% 12%
Czech Republic 4% 3% 5% 7% 10%
UK 6% 9% 9% 9% 8%
Spain 9% 9% 7% 8% 8%
Engine parts (2)Country 2014 2015 2016 2017 2018
Total (R million) 3 732,4 3 941,4 3 901,4 3 773,3 4 162,4
Germany 20% 25% 22% 23% 26%
USA 22% 23% 19% 24% 24%
Thailand 13% 21% 23% 18% 16%
Argentina 5% 6% 8% 8% 8%
Namibia 3% 4% 5% 5% 5%
Tyres (3)Country 2014 2015 2016 2017 2018
Total (R million) 2 205,8 2 193,0 2 526,6 2 515,7 2 547,2
Belgium 2% 1% 1% 9% 16%
Namibia 10% 12% 13% 14% 12%
Botswana 11% 12% 10% 12% 8%
Netherlands 2% 2% 4% 5% 8%
Zimbabwe 8% 7% 8% 8% 7%
Engines (4)Country 2014 2015 2016 2017 2018
Total (R million) 363,7 1 447,9 2 109,8 2 446,6 1 873,7
India - 60% 67% 63% 59%
Zambia 29% 9% 8% 8% 10%
Mozambique 15% 7% 5% 3% 6%
Botswana 15% 4% 2% 7% 5%
Democratic Republic of Congo 8% 3% 2% 1% 3%
Radiators and parts (5)Country 2014 2015 2016 2017 2018
Total (R million) 1 172,1 1 190,2 1 377,5 1 525,1 1 658,7
Germany 12% 36% 35% 35% 34%
Spain 10% 11% 11% 11% 12%
USA 17% 19% 14% 13% 12%
Mexico 4% 6% 8% 8% 10%
Belgium 9% 8% 8% 7% 9%

87 EXPORTSEXPORTS
Transmission shafts and cranks (6)Country 2014 2015 2016 2017 2018
Total (R million) 1 102,1 1 060,0 981,6 975,3 1 112,2
Democratic Republic of Congo 8% 11% 7% 8% 9%
Zambia 10% 6% 8% 7% 8%
Zimbabwe 4% 5% 5% 6% 7%
Thailand 8% 12% 11% 7% 7%
Chile 2% 1% 1% 1% 7%
Automotive tooling (7)Country 2014 2015 2016 2017 2018
Total (R million) 935,8 1 458,7 861,1 839,3 1 056,1
USA 3% 8% 9% 8% 14%
Germany 4% 3% 9% 5% 7%
Mexico 1% 2% 1% 6% 7%
Botswana 2% 2% 2% 6% 5%
China 2% - 3% 1% 5%
Filters (8)Country 2014 2015 2016 2017 2018
Total (R million) 474,8 460,1 599,8 588,0 637,2
Germany 25% 28% 32% 26% 23%
Zimbabwe 16% 15% 12% 13% 12%
Namibia 8% 8% 10% 11% 11%
Botswana 8% 9% 8% 8% 9%
Zambia 8% 9% 6% 8% 8%
Gauges, instruments and parts (9)Country 2014 2015 2016 2017 2018
Total (R million) 640,3 685,3 626,6 625,5 634,8
Democratic Republic of Congo 13% 13% 11% 19% 17%
Zambia 7% 8% 11% 6% 9%
Namibia 7% 12% 12% 8% 8%
Botswana 5% 4% 8% 8% 6%
Mozambique 4% 6% 4% 4% 6%
Shock absorbers and suspension parts (10)Country 2014 2015 2016 2017 2018
Total (R million) 517,7 480,3 560,2 560,0 618,0
Germany 75% 67% 75% 76% 72%
Botswana 4% 3% 3% 3% 5%
USA 8% 12% 9% 5% 5%
Namibia 2% 4% 5% 5% 5%
Zimbabwe 5% 5% 3% 3% 2%

88 EXPORTSEXPORTS
Clutches and shaft couplings (11)Country 2014 2015 2016 2017 2018
Total (R million) 382,8 429,8 537,5 652,7 611,7
Germany 46% 47% 48% 57% 59%
China 4% 5% 5% 5% 6%
Namibia 5% 6% 5% 5% 6%
Botswana 4% 5% 4% 3% 4%
USA 7% 5% 6% 4% 3%
Stitched leather seats and parts (12)Country 2014 2015 2016 2017 2018
Total (R million) 1 285,9 992,7 767,5 524,7 538,1
Germany 59% 59% 59% 51% 47%
Poland 12% 14% 22% 24% 25%
Romania 2% 6% 7% 6% 7%
Croatia - - 2% 8% 5%
USA 1% 1% 1% 1% 3%
Automotive glass (13)Country 2014 2015 2016 2017 2018
Total (R illion) 450,6 389,0 479,5 439,5 509,5
Belgium 19% 20% 22% 25% 29%
UK 24% 23% 25% 26% 25%
France 14% 9% 9% 10% 10%
Spain 5% 8% 8% 8% 8%
Namibia 6% 8% 8% 8% 7%
Axles (14)Country 2014 2015 2016 2017 2018
Total (R million) 377,3 421,0 361,5 401,0 463,6
Germany 36% 45% 76% 73% 56%
Zambia 2% 1% 4% 3% 10%
Mozambique 1% 5% 1% 5% 10%
Namibia 2% 3% 1% 4% 4%
Democratic Republic of Congo 6% 3% 5% 2% 3%
Silencers and exhausts (15)Country 2014 2015 2016 2017 2018
Total (R million) 503,8 535,3 617,7 521,4 462,6
Germany 18% 18% 19% 25% 25%
USA 32% 33% 28% 21% 15%
Czech Republic 5% 8% 11% 15% 15%
Spain 2% 4% 8% 7% 11%
South Korea 2% 3% 4% 7% 9%

89 EXPORTSEXPORTS
Road wheels and parts (16)Country 2014 2015 2016 2017 2018
Total (R million) 367,1 471,1 427,4 530,7 438,3
Argentina 22% 17% 11% 17% 26%
Czech Republic - - 7% 17% 24%
UK 1% - 4% 10% 16%
India 7% 23% 40% 19% 9%
Namibia 6% 12% 5% 19% 5%
Batteries (17)Country 2014 2015 2016 2017 2018
Total (R million) 383,4 357,9 337,0 393,4 427,5
Namibia 8% 15% 23% 19% 22%
Mozambique 25% 23% 24% 23% 21%
Zambia 13% 13% 20% 17% 17%
Botswana 9% 9% 13% 13% 13%
Zimbabwe 6% 9% 7% 10% 7%
Body parts and panels (18)Country 2014 2015 2016 2017 2018
Total (R million) 269,4 301,3 325,1 283,7 315,4
Germany 14% 24% 24% 38% 39%
Namibia 16% 13% 15% 12% 14%
Mozambique 2% 2% 1% 2% 8%
Botswana 12% 10% 14% 8% 7%
Belgium 4% 4% 5% 5% 5%
Brake parts (19)Country 2014 2015 2016 2017 2018
Total (R million) 225,2 229,7 297,1 274,3 304,8
Belgium 10% 10% 22% 20% 21%
Namibia 12% 13% 14% 14% 12%
Botswana 14% 17% 13% 10% 10%
Swaziland (renamed eSwatini) 10% 10% 8% 10% 10%
Germany 8% 7% 6% 8% 10%
Lighting, signalling and wiping equipment (20)Country 2014 2015 2016 2017 2018
Total (R million) 239,0 236,9 262,7 258,1 279,3
Germany 45% 35% 39% 34% 32%
Namibia 6% 11% 13% 15% 16%
Botswana 4% 5% 7% 8% 7%
UK 5% 5% 6% 6% 6%
Belgium 2% 2% 2% 6% 5%

90 EXPORTSEXPORTS
Ignition and starting equipment (21)Country 2014 2015 2016 2017 2018
Total (R million) 255,2 256,6 279,5 254,8 275,6
Namibia 12% 17% 16% 18% 20%
Botswana 16% 19% 18% 20% 18%
Zimbabwe 8% 9% 10% 11% 8%
Zambia 11% 7% 7% 7% 8%
Swaziland (renamed eSwatini) 5% 5% 6% 7% 7%
Gear boxes (22)Country 2014 2015 2016 2017 2018
Total (R million) 153,4 144,8 136,7 186,5 222,0
USA 32% 41% 20% 25% 23%
Botswana 21% 12% 32% 17% 14%
Namibia 13% 14% 9% 7% 12%
Democratic Republic of Congo 2% 4% 2% 2% 12%
Mozambique 3% 6% 7% 6% 7%
Gaskets (23)Country 2014 2015 2016 2017 2018
Total (R million) 176,1 192,0 184,2 170,8 162,2
Namibia 7% 11% 9% 10% 11%
Democratic Republic of Congo 16% 12% 13% 11% 11%
UK 9% 9% 6% 9% 8%
Mozambique 7% 11% 7% 6% 8%
Zambia 8% 5% 11% 7% 7%
Wiring harnesses (24)Country 2014 2015 2016 2017 2018
Total (R million) 264,4 260,2 415,3 257,3 146,9
United Arab Emirates - 2% 23% 31% 31%
Botswana 52% 43% 49% 36% 16%
Germany 9% 28% 11% 9% 9%
Namibia 1% 1% 1% 2% 6%
Canada - 1% 4% 4% 5%
Alarm systems (25)Country 2014 2015 2016 2017 2018
Total (R million) 124,5 102,3 116,4 89,9 92,4
Zimbabwe 4% 5% 4% 6% 13%
New Zealand 1% - - 1% 11%
Botswana 13% 11% 16% 14% 10%
Namibia 11% 15% 14% 14% 8%
Democratic Republic of Congo 2% 5% 2% 3% 6%

91 EXPORTSEXPORTS
Air conditioners (26)Country 2014 2015 2016 2017 2018
Total (R million) 94,2 102,2 65,6 62,9 69,7
United Arab Emirates - 11%% - 1% 34%
Namibia 7% 9% 5% 11% 11%
Canada 3% 4% 11% 14% 10%
Botswana 7% 5% 6% 11% 9%
Zambia 4% 5% 9% 8% 6%
Steering wheels, columns and boxes (27)Country 2014 2015 2016 2017 2018
Total (R million) 50,5 38,9 42,8 53,3 64,9
Namibia 10% 14% 23% 19% 19%
Canada 1% 7% 6% 1% 16%
Germany 8% 2% 2% 7% 10%
Botswana 6% 10% 7% 11% 9%
Belgium 12% 17% 16% 9% 6%
Springs (28)Country 2014 2015 2016 2017 2018
Total (R million) 35,2 27,6 44,8 48,2 45,1
Zimbabwe 6% 6% 14% 13% 13%
Germany 2% 1% 4% 8% 11%
UK 13% 7% 4% 8% 11%
Namibia 8% 8% 6% 8% 9%
Japan 13% 16% 11% 11% 8%
Seats (29)Country 2014 2015 2016 2017 2018
Total (R million) 21,3 25,6 28,2 31,9 36,6
Botswana 20% 17% 16% 15% 17%
Namibia 9% 13% 15% 14% 12%
Singapore 9% 9% 18% 9% 11%
Canada 2% - 5% 9% 9%
Zambia 10% 7% 9% 8% 7%
Jacks (30)Country 2014 2015 2016 2017 2018
Total (R million) 39,1 35,5 38,0 29,5 34,1
Namibia 4% 4% 8% 14% 15%
Zimbabwe 18% 19% 13% 12% 10%
Zambia 22% 12% 9% 17% 10%
Mozambique 5% 12% 14% 6% 9%
Botswana 3% 7% 5% 5% 6%

92 EXPORTSEXPORTS
Car radios (31)Country 2014 2015 2016 2017 2018
Total (R million) 25,4 23,5 21,0 36,2 18,4
Namibia 21% 28% 20% 21% 41%
Botswana 13% 23% 21% 36% 28%
Zambia 16% 12% 21% 14% 7%
Swaziland (renamed eSwatini) 6% 5% 8% 3% 5%
UK 1% 1% 1% 3% 3%
Seat belts (32)Country 2014 2015 2016 2017 2018
Total (R million) 6,8 6,8 7,3 7,5 8,1
Namibia 14% 28% 27% 25% 27%
Botswana 15% 10% 14% 17% 12%
USA - - 3% 1% 9%
Democratic Republic of Congo 6% 12% 5% 11% 7%
Zambia 8% 7% 7% 7% 7%

93 IMPORTSIMPORTS
IMPORTS BY COUNTRY OF ORIGIN
Imports of automotive products into South Africa remain a function of the success of the APDP, domestic market demand, and currency movements. Under the APDP, the level of imports remains a function of the success of the programme, as the benefits can only be used to rebate the import duties on vehicles and eligible automotive components that are imported. To offer imported cars at favourable prices, OEMs require the most favourable import duties. South African manufactured vehicles are not necessarily for domestic sales, but to generate import credits so that the imported vehicles demanded by the market or original equipment components to accommodate production of the domestically manufactured vehicles could be offered at more favourable prices by rebating the relevant import duties. Imports of vehicles and original equipment components as well as replacement parts for the growing vehicle parc of 12,46 million vehicles at the end of 2018, remained high.
The movement of the Rand remained relatively stable on a nominal trade-weighted basis in 2018. The Rand exchange rate, however, has reacted differently to different countries, and this is particularly important with regard to the exchange rates of the source countries for South African imports. Against the US dollar the Rand appreciated, for the second successive year, by 0,6% on an annual average basis in 2018, but marginally depreciated against the Euro by 3,7%, against the Pound by 2,8%, against the Chinese Yuan by 1,4%, and against the Yen by 0,8%. At a an individual company level, depending on the particular firm’s exposure to imports and exports, and the firm’s balance of trade, the impact of exchange rate fluctuations may vary.

94 IMPORTSIMPORTS
Top automotive countries of origin – 2018 (R million)
Source: AIEC, SARS
The countries of origin for vehicles and automotive components imported into South Africa generally reflect the global linkages with the head offices of parent companies. The notable exception amongst the top countries of origin in 2018 was China, where most of the imports were for aftermarket parts.
1Germany
2Thailand
3Japan
4China
5USA
6India
7UK
8Spain
9Czech
Republic
10SouthKorea
R'million R61 387.8 R22 927.2 R20 907.5 R17 693.4 R12 795.2 R11 466.7 R7 191.3 R6 708.5 R5 295.0 R5 213.6
The countries of origin for vehicles and automotive
components imported into South Africa generally reflect the global linkages with the head offices of
parent companies.

95 IMPORTSIMPORTS
The following table reveals the import values and rankings for the 57 countries of origin for vehicles and automotive component imports into South Africa, above the R20 million threshold, for 2017 and 2018.
Import value and ranking by country of origin – 2017 to 2018
Country 2017R million
2017Ranking
2018R million
2018Ranking
Germany 69 333,0 1 61 387,8 1
Thailand 18 711,0 3 22 927,2 2
Japan 20 142,0 2 20 907,5 3
China 15 007,1 4 17 693,4 4
USA 10 951,0 6 12 795,2 5
India 11 482,5 5 11 466,7 6
United Kingdom 7 241,5 7 7 191,3 7
Spain 6 381,9 8 6 708,5 8
Czech Republic 3 661,5 12 5 295,0 9
South Korea 4 633,1 9 5 213,6 10
Brazil 3 712,8 11 4 286,9 11
Sweden 3 044,1 13 3 706,2 12
Italy 3 897,7 10 3 535,7 13
Romania 2 165,7 16 3 489,3 14
France 2 538,5 15 3 215,7 15
Poland 2 736,0 14 3 062,7 16
Mexico 1 571,7 21 2 791,7 17
Slovak Republic 2 018,1 18 2 444,3 18
Turkey 2 095,2 17 1 949,6 19
Indonesia 1 247,6 24 1 875,8 20
Hungary 1 600,2 19 1 874,5 21
Botswana 1 598,9 20 1 727,5 22
Argentina 1 069,8 27 1 565,7 23
Belgium 1 086,9 26 1 423,1 24
Taiwan 1 289,3 23 1 408,1 25
Portugal 1 139,4 25 1 259,1 26
26 COUNTRIES ABOVE R1 BILLION
Netherlands 1 503,9 22 977,6 27
Austria 890,7 28 865,0 28
Philippines 854,3 29 859,6 29
Malaysia 602,5 30 705,8 30

96 IMPORTSIMPORTS
Canada 555,4 31 500,9 31
Denmark 306,2 33 434,9 32
Australia 300,8 34 332,8 33
Switzerland 370,6 32 321,5 34
Slovenia 161,6 37 271,6 35
Finland 210,9 36 225,9 36
United Arab Emirates 107,3 41 181,8 37
Bulgaria 82,2 43 159,5 38
Israel 150,7 38 134,1 39
Vietnam Republic 112,4 40 132,9 40
Luxembourg 140,4 39 126,4 41
Morocco 71,1 44 87,7 42
Russia 48,4 48 76,0 43
Singapore 63,8 46 72,6 44
Namibia 102,5 42 71,7 45
Hong Kong, China 41,3 50 57,1 46
Ireland 55,7 47 40,3 47
Zambia 37,2 49 39,1 48
Swaziland (renamed eSwatini) 14,3 - 39,1 49
Tunisia 69,0 45 35,2 50
Malta 28,8 50 32,6 51
Egypt 15,8 - 27,1 52
Croatia 18,6 - 26,9 53
Norway 26,9 51 23,5 54
Lesotho 277,9 35 23,5 55
Ukraine 21,2 52 21,3 56
Angola 5,6 - 20,2 57
57 COUNTRIES ABOVE R20 MILLION
Source: AIEC, SARS

97 IMPORTSIMPORTS
AUTOMOTIVE PARTS AND COMPONENTS – IMPORTS
Original equipment component imports by the OEMs amounted to R97,8 billion in 2018, up by 9,2% from the R89,6 billion in 2017. The increase is in line with new model launches and higher year-on-year vehicle production volumes supported by record vehicle exports in 2018. Global sourcing principles apply in the vehicle manufacturing industry, and original equipment components are components or systems supplied directly to the national or international OEMs and have global recognisable brands. High value, capital-intensive componentry, such as the drivetrain and telematics, which collectively account for about 50% to 60% of the value in a modern vehicle, are mainly imported into South Africa and the remainder sourced in the domestic market.
After local value-adding processes, completely built-up vehicles are then exported or sold in the domestic market. The development and deepening of the South African component-supplier base under the APDP is an important focal point, as it will reduce the risks associated with exchange rate fluctuations and logistics costs. Higher volumes relating to the expansion of vehicle production in the country under the APDP and APDP Phase 2 post-2020, as well as various supplier competitiveness initiatives and localisation efforts, could improve the viability of further foreign direct investment and export contracts in future.
The following table reveals that imports of original equipment components in 2018 originated mainly from Germany, Thailand and Japan.
Top 10 countries of origin for original equipment components imported (Chapter 98) – 2014 to 2018
Country 2014 2015 2016 2017 2018
Total (R billion) 70,2 79,6 88,0 89,6 97,8
Germany 38% 47% 46% 46% 38%
Thailand 12% 12% 16% 16% 17%
Japan 20% 15% 11% 11% 11%
USA 3% 2% 2% 3% 5%
China 3% 4% 4% 4% 4%
Czech Republic 1% 1% 1% 2% 4%
Brazil 5% 5% 4% 3% 4%
Sweden 3% 2% 2% 2% 3%
Spain 2% 2% 2% 2% 2%
UK 3% 2% 2% 2% 2%
Other 10% 8% 10% 9% 10%Source: AIEC, SARS
The independent aftermarket is responsible for the manufacture and sale of automotive replacement parts and accessories through independent retailers and repair shops directly to the consumer rather than to the OEMs themselves. The aftermarket also re-manufactures, distributes, retails and installs motor vehicle parts and products, other than the original equipment components.

98 IMPORTSIMPORTS
In 2018, imported passenger cars accounted for 72,6% of the total passenger car market in South Africa, as a brand conscious, consumer-driven market prompted the widest choice of new passenger cars to market-size ratio in the world. The growing variety of models and ever more complex technologies have therefore led to an increasing number of aftermarket parts in the market. The growth of cheaper products, imported mainly from China, has exacerbated this trend. In 2018, the import of replacement parts increased by R2,3 billion, or 3,9%, to R61,3 billion, from the R59,0 billion in 2017.
The following table reveals the import of aftermarket parts to complement the parts not manufactured in the domestic market, and more particularly, to service the increasing imported share of the vehicle parc of 12,46 million vehicles in 2018 for which most parts have to be imported.
Top 10 replacement parts imported (R million) – 2014 to 2018Parts category 2014 2015 2016 2017 2018
Tyres 4 856 4 771 6 067 5 819 6 401
Automotive tooling 4 095 5 084 3 748 5 188 4 307
Engine parts 3 879 4 231 4 412 4 200 4 247
Stitched leather seats / parts 1 592 1 985 2 461 2 440 2 324
Gauges / Instruments / parts 1 622 1 895 2 106 2 021 2 303
Wiring harnesses 1 011 1 870 2 254 2 063 2 150
Transmission shafts / cranks 1 913 2 065 1 942 2 103 2 123
Engines 1 707 2 811 2 297 2 059 1 692
Filters 896 979 1 210 1 385 1 499
Brake parts 1 212 1 277 1 229 1 141 1 302
Other 25 264 28 413 32 021 30 610 32 976
Total 48 047 55 381 59 747 59 029 61 324
Source: AIEC, SARS
The growing variety of models and ever more complex
technologies have therefore led to an increasing
number of aftermarket parts in the market.
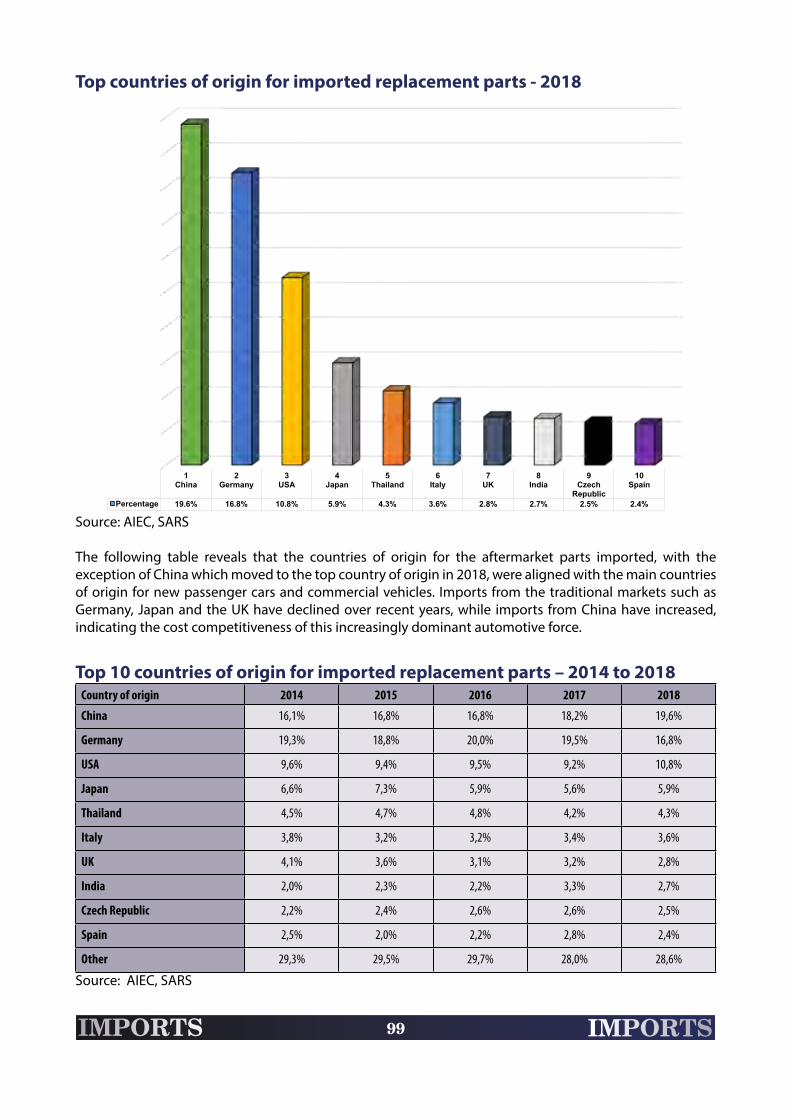
99 IMPORTSIMPORTS
Top countries of origin for imported replacement parts - 2018
Source: AIEC, SARS
The following table reveals that the countries of origin for the aftermarket parts imported, with the exception of China which moved to the top country of origin in 2018, were aligned with the main countries of origin for new passenger cars and commercial vehicles. Imports from the traditional markets such as Germany, Japan and the UK have declined over recent years, while imports from China have increased, indicating the cost competitiveness of this increasingly dominant automotive force.
Top 10 countries of origin for imported replacement parts – 2014 to 2018Country of origin 2014 2015 2016 2017 2018
China 16,1% 16,8% 16,8% 18,2% 19,6%
Germany 19,3% 18,8% 20,0% 19,5% 16,8%
USA 9,6% 9,4% 9,5% 9,2% 10,8%
Japan 6,6% 7,3% 5,9% 5,6% 5,9%
Thailand 4,5% 4,7% 4,8% 4,2% 4,3%
Italy 3,8% 3,2% 3,2% 3,4% 3,6%
UK 4,1% 3,6% 3,1% 3,2% 2,8%
India 2,0% 2,3% 2,2% 3,3% 2,7%
Czech Republic 2,2% 2,4% 2,6% 2,6% 2,5%
Spain 2,5% 2,0% 2,2% 2,8% 2,4%
Other 29,3% 29,5% 29,7% 28,0% 28,6%
Source: AIEC, SARS
1China
2Germany
3USA
4Japan
5Thailand
6Italy
7UK
8India
9Czech
Republic
10Spain
Percentage 19.6% 16.8% 10.8% 5.9% 4.3% 3.6% 2.8% 2.7% 2.5% 2.4%

100
THE AUTOMOTIVE INDUSTRY’S TRADE
BALANCE
South Africa’s exports of R1 246,9 billion in 2018 surpassed imports of R1 235,6 billion to register a surplus of R11,3 billion. As the leading manufacturing sector in South Africa’s economy, the automotive industry’s export value under the APDP in 2018, amounted to R178,8 billion, which comprised a substantial 14,3% (13,9% in 2017) of the total South African exports of R1 246,9 billion, while the industry’s imports of R162,0 billion under the APDP comprised 13,1% (14,0% in 2017) of the total South African imports of R1 235,6 billion.
Under the APDP between 2013 and 2018, the nominal automotive export value grew by 74,1%, while the rate of the nominal import value was much slower, with an increase of 27,9%. Record automotive exports of R178,8 billion in 2018 reflected a substantial increase of R13,9, or 8,4%, compared to the R164,9 billion total export value in 2017. Record vehicle exports of 351 139 units in 2018 resulted in the vehicle export revenue increasing by R12,9 billion, or 11,3%, to R127,5 billion compared to the R114,6 billion in 2017, while automotive component exports also reflected an increase of R1,0 billion, or 2,0%, from the R50,3 billion exported in 2017 to R51,3 billion exported in 2018.
Over recent years the trade balance related to vehicles has remained positive but the trade balance related to automotive components has remained negative. Since the South African vehicle manufacturing industry accounted for only 0,64% of global vehicle production in 2018, the industry remains reliant on global design, technologically sophisticated plant and machinery, and imported high-value components. This has contributed to the outflow of foreign exchange. Since the APDP Phase 2 post-2020 places localisation at the centre of any future support for the industry, with government having set the target of raising local content in South African manufactured vehicles from the current less than 40% to 60% by 2035, the reliance on imported components is set to decline substantially in future.
The following table reveals that the trade surplus under the APDP measurement widened to R16,8 billion in 2018, compared to the R10,3 billion in 2017, mainly due to an increase in original equipment component imports to accommodate higher vehicle production and new model launches in 2018.
Under the APDP between 2013 and 2018, the nominal
automotive export value grew by 74,1%.

101
APDP-related trade balance for the automotive industry: 2014 – 2018
Year Imports into SA(R billion)
Exports from SA(R billion)
Trade surplus/ (deficit)(R billion)
2013 126,7 102,7 (24,0)
2014 131,5 115,7 (15,8)
2015 146,2 151,5 5,3
2016 147,9 171,1 23,2
2017 154,6 164,9 10,3
2018 162,0 178,8 16,8
2018
Vehicles 59,9 127,5 67,6
Automotive components (excluding aftermarket parts) 102,1 51,3 (50,8)
Source: AIEC, SARSIncluding BLNS (Botswana, Lesotho, Namibia and Swaziland (renamed eSwatini)) country trade data
It should be noted that under the APDP, the basis for calculating the duty-free import credits is based on value-added through the supply chain in the automotive manufacturing industry. There are certain eligibility requirements under the programme, to ensure that the beneficiaries are companies producing substantial quantities of components for vehicle manufacturing, and to exclude accessories. Automotive component manufacturers have to supply at least 25% of their total turnover, or R10 million annually, as part of an OEM supply chain domestically and/or internationally to comply under the APDP. In this regard, with the exception of automotive tooling, which is used in the production processes of vehicles and automotive components, the imported replacement parts are generally not linked to value-addition in the country under the APDP, and they are therefore not included in the automotive trade balance which is used to monitor the progress of the APDP. When all automotive products, including vehicles, OE components and aftermarket parts are included, the industry as a whole, still reflects a trade deficit (refer to the memo item and the following table).
Memo item:For the purposes of comparison of the 2012 MIDP data with the 2013 to 2018 trade balance data under the APDP, based on a holistic view of total automotive exports and imports (including vehicles, OE components and aftermarket parts), total automotive imports amounted to R219,1 billion in 2018, up R10,7 billion, or 5,1%, compared to the R208,4 billion in 2017. The imported replacement parts, not linked to value-addition in the country under the APDP, with the exception of automotive tooling, amounted to R61,3 billion in 2018, reflecting an increase of 3,9% compared to the R59,7 billion imported in 2017. The trade deficit declined in 2018 to R40,3 billion, compared to the R43,5 billion in 2017, and narrowed substantially from its peak of R63,8 billion in 2013, to reflect a significant reduction in real terms over recent years.

102
Automotive industry trade balance, including all automotive products – 2012 to 2018
YearImports into SA
(R billion)Exports from SA
(R billion)Trade surplus/(deficit)
(R billion)
2012* 137,2 94,9 (42,3)
2013 166,5 102,7 (63,8)
2014 177,9 115,7 (62,2)
2015 196,7 151,5 (45,2)
2016 204,0 171,1 (32,9)
2017 208,4 164,9 (43,5)
2018 219,1 178,8 (40,3)
Vehicles 59,9 127,5 67,6
Automotive components (including aftermarket parts) 159,2 51,3 (107,9)
Source: AIEC, SARS*MIDP calculationRevised retrospective from 2012 to include BLNS (Botswana, Lesotho, Namibia and Swaziland (renamed eSwatini)) country trade data
Generally, domestic economic growth rates are the most important driver of market demand and therefore new vehicle and automotive component export growth in 2019 will remain a function of the direction and performance of global markets, domestic OEMs’ export programmes, and movements in the Rand exchange rate. In view of the dependence on exports, domestic OEMs and automotive component suppliers remain exposed to international market developments that are outside their control and influence.
Generally, domestic economic growth rates are the most important driver
of market demand and therefore new vehicle and automotive component export growth in 2019 will remain
a function of the direction and performance of global markets,
domestic OEMs’ export programmes, and movements in the Rand
exchange rate.
103
MAIN AUTOMOTIVE TRADING REGIONS
AND COUNTRIES
South Africa’s top regional trading partner in 2018 remained the European Union (EU). Vehicle and automotive component exports to the EU increased from R85,9 billion in 2017 to R105,2 billion in 2018, mainly driven by record vehicle exports to the region. Africa was the only region providing a trade surplus in 2018. Elsewhere, the country’s automotive trade was in deficit in 2018.
South Africa’s main automotive regional trade partners
Year Imports into SA(R billion)
Exports from SA(R billion)
Trade surplus/ (deficit)(R billion)
2018 Total 219,1 178,8 (40,3)
EU 107,8 105,2 (2,6)
NAFTA 16,1 10,9 (5,2)
AFRICA (incl. SADC) 2,1 31,7 29,6
MERCOSUR 5,9 1,6 (4,3)
OTHER REGIONS 87,2 29,4 (57,8)Source: AIEC, SARS
The South African automotive industry’s biggest single trading country partner in 2018 was Germany – home to BMW, Volkswagen and Mercedes-Benz. The total automotive trade between the two countries notched a significant R119,0 billion. With the exception of the UK, Spain and Belgium, South Africa’s relationship with other automotive trading partners in the top 10 was in deficit. South Africa’s main automotive trading partners (exports and imports combined) for 2018, reflected the country’s global linkages with the OEMs’ parent companies in Germany, the US and Japan.
South Africa’s top regional trading partner
in 2018 remained the European Union.

104
South Africa’s main automotive trading partners - 2018
Source: AIEC, SARS
The following tables reveal details and rankings of the South African automotive industry’s top 10 automotive trading partners in 2018, and also reflect the top 10 products exported and imported, where applicable. Germany remained the domestic automotive industry’s main trading partner over the past three decades.
1. Germany (Total trade R119 002,1 million) – 2018
Main products Exports from SAR57 614,3 million Main products Imports into SA
R61 387,8 million
Light vehicles 43 911,2 Original equipment components 37 297,2
Catalytic converters 8 093,8 Light vehicles 12 837,0
Engine parts 1 083,0 MCV / HCV vehicles 978,2
Radiators / parts 564,1 Engine parts 717,2
Shock absorbers / suspension parts 448,0 Automotive tooling 588,3
Clutches / shaft couplings 357,9 Tyres 524,9
Axles 259,7 Transmission shafts / cranks 460,6
Stitched leather seats / parts 251,3 Gauges / instrument parts 408,8
Filters 145,6 Steering wheels / columns / boxes 284,0
Body parts / panels 121,7 Body parts / panels 276,8
Other 2 378,0 Other 7 014,8
R 0.0
R20 000.0
R40 000.0
R60 000.0
R80 000.0
R100 000.0
R120 000.0
1Germany
2Japan
3Thailand
4UK
5USA
6China
7Spain
8India
9Belgium
10SouthKorea
Export R'million R57 614.3 R9 429.6 R2 400.2 R17 170.1 R9 304.7 R 263.0 R7 913.9 R1 507.5 R11 537.3 R3 492.7Import R'million R61 387.8 R20 907.5 R22 927.2 R7 191.3 R12 795.2 R17 693.4 R6 708.5 R11 466.7 R1 423.1 R5 213.6Total R'million R119 002.1 R30 337.1 R25 327.4 R24 361.4 R22 099.9 R17 956.4 R14 622.4 R12 974.2 R12 960.4 R8 706.3

105
2. Japan (Total trade R30 337,1 million) – 2018
Main products Exports from SAR9 429,6 million Main product Imports into SA
R20 907,5 million
Light vehicles 7 950,3 Original equipment components 10 427,1
Catalytic converters 183,1 Light vehicles 6 775,1
Tyres 16,2 Automotive tooling 444,6
Automotive tooling 13,2 Tyres 374,7
Stitched leather seats / parts 12,5 Engine parts 299,9
Engine parts 6,2 Ignition / starting equipment 222,9
Springs 3,7 Filters 184,0
Silencers / exhausts 3,3 Transmission shafts / cranks 172,9
Brake parts 2,7 Stitched leather seats / parts 107,5
Clutches / shaft couplings 1,9 Clutches / shaft couplings 98,8
Other 1 236,5 Other 1 800,0
3. Thailand (Total trade R25 327,4 million) – 2018
Main products Exports from SAR2 400,2 million Main products Imports into SA
R22 927,2 million
Catalytic converters 835,1 Original equipment components 16 857,2
Engine parts 661,5 Light vehicles 3 443,4
Transmission shafts / cranks 81,0 Stitched leather seats / parts 445,6
Shock absorbers / suspension parts 9,5 Tyres 314,9
Tyres 9,2 Wiring harnesses 214,2
Light vehicles 8,4 Filters 208,8
Filters 7,1 Engine parts 85,6
Clutches / shaft couplings 5,9 Car radios 82,1
Axles 1,7 Brake parts 60,8
Gear boxes 1,6 Lighting equipment / parts 49,1
Other 779,2 Other 1 165,5
4. United Kingdom (UK) (Total trade R24 361,4 million) – 2018
Main products Exports from SAR17 170,1 million Main products Imports into SA
R7 191,3 million
Light vehicles 14 850,7 Light vehicles 3 739,4
Catalytic converters 1 606,3 Original equipment components 1 751,4
Automotive glass 129,5 Engines 208,5
Road wheels / parts 72,2 Engine parts 168,3
Tyres 52,6 Gauges / instruments / parts 139,0
Engine parts 36,8 Alarm systems 92,8
Gauges / instruments / parts 34,9 Catalytic converters 91,1
Automotive tooling 28,4 Automotive tooling 89,5
Engines 24,1 Transmission shafts / cranks 70,0
Lighting equipment / parts 16,1 Filters 50,3
Other 318,5 Other 791,0
106
5. United States of America (USA) (Total trade R22 099,9 million) – 2018
Main products Exports from SAR9 304,7 million Main products Imports into SA
R12 795,2 million
Light vehicles 4 946,9 Original equipment components 4 576,5
Catalytic converters 2 218,9 Light vehicles 1 612,4
Engine parts 1 007,6 Automotive tooling 682,3
Radiators / parts 200,7 Engine parts 568,4
Automotive tooling 150,9 Transmission shafts / cranks 369,4
Silencers / exhausts 68,5 Tyres 363,4
Gear boxes 51,1 Engines 321,2
Transmission shafts / cranks 33,4 Gauges/ instrument parts 276,5
Tyres 32,9 Axles 258,3
Gauges / instrument parts 31,6 Steering wheels / columns / boxes 215,3
Other 562,2 Other 3 551,5
6. China (Total trade R17 956,4 million) – 2018
Main products Exports from SAR263,0 million Main products Imports into SA
R17 693,4 million
Radiators / parts 94,7 Original equipment components 4 172,5
Automotive tooling 56,0 Tyres 2 415,5
Clutches / shaft couplings 39,1 Light vehicles 1 363,7
Light vehicles 8,7 Automotive tooling 903,4
Engines parts 7,6 Engine parts 835,3
Tyres 7,5 Stitched leather seats / parts 390,3
Transmission shafts / cranks 6,3 Transmission shafts / cranks 319,4
Gauges / instruments / parts 4,1 Brake parts 311,0
Silencers / exhausts 1,4 Road wheels / parts 282,3
Brake parts 1,0 Ignition / starting equipment 278,2
Other 36,6 Other 6 421,8
7. Spain (Total trade R14 622,4 million) – 2018
Main products Exports from SAR7 913,9 million Main products Imports into SA
R6 708,5 million
Light vehicles 5 987,2 Light vehicles 2 753,9
Catalytic converters 1 487,4 Original equipment components 2 360,9
Radiators / parts 201,5 Tyres 210,3
Silencers / exhausts 48,9 Stitched leather seats / parts 154,3
Automotive glass 40,3 Batteries 134,2
Filters 18,9 MCV / HCV vehicles 113,2
Automotive tooling 17,7 Automotive tooling 67,9
Tyres 7,4 Engine parts 53,9
Transmission shafts / cranks 5,5 Shock absorbers / suspension parts 44,0
Gear boxes 4,7 Brake parts 43,2
Other 94,4 Other 772,7

107
8. India (Total trade R12 974,2 million) – 2018
Main products Exports from SAR1 507,5 million Main products Imports into SA
R11 466,7 million
Engines 1 100,1 Light vehicles 8 749,6
Catalytic converters 248,5 Original equipment components 1 016,4
Road wheels / parts 37,3 Gauges / instruments / parts 162,5
Radiators / parts 22,0 Engine parts 135,6
Automotive tooling 21,0 Automotive tooling 110,7
Clutches / shaft couplings 7,4 Engines 92,8
Gauges / instruments / parts 5,2 Tyres 82,4
Transmission shafts / cranks 3,4 MCV / HCV vehicles 75,4
Filters 3,2 Transmission shafts / cranks 69,3
Engine parts 2,4 Lighting equipment / parts 46,2
Other 57,0 Other 925,8
9. Belgium (Total trade R12 960,4 million) – 2018
Main products Exports from SAR11 537,3 million Main products Imports into SA
R1 423,1 million
Light vehicles 10 352,0 Light vehicles 746,8
Tyres 415,3 Original equipment components 207,3
Radiators / parts 146,2 Lighting equipment / parts 84,6
Automotive glass 145,8 MCV / HCV vehicles 46,6
Catalytic converters 88,8 Automotive tooling 19,4
Brake parts 64,6 Engine parts 18,2
Engine parts 51,5 Transmission shafts / cranks 12,1
Automotive tooling 40,9 Catalytic converters 9,3
Filters 28,1 Automotive glass 7,2
Body parts / panels 15,7 Gauges / instruments / parts 7,2
Other 188,4 Other 264,4
10. South Korea (Total trade R8 706,3 million) – 2018
Main products Exports from SAR3 492,7 million Main products Imports into SA
R5 213,6 million
Light vehicles 2 900,5 Light vehicles 3 695,3
Catalytic converters 454,3 Original equipment components 278,4
Silencers / exhausts 40,0 Tyres 152,2
Automotive tooling 37,5 Batteries 124,3
Filters 20,2 MCV / HCV vehicles 95,2
Radiators / parts 13,5 Filters 61,3
Engine parts 10,8 Automotive tooling 59,7
Tyres 1,2 Clutches / shaft couplings 59,1
Transmission shafts / cranks 0,3 Engine parts 41,5
Lighting equipment / parts 0,3 Engines 29,2
Other 14,1 Other 617,4
108
SOUTH AFRICAN AUTOMOTIVE INDUSTRY
GROWTH PROSPECTS
Rapid technological advances in the global automotive manufacturing landscape have changed the way in which vehicle and automotive component manufacturers function – from product design and development, to production optimisation, to techniques selected to penetrate new markets, and in delivering products to customers. Interest and investment in disruptive technologies have increased significantly in recent years. Amidst all these global developments, South Africa needs to advance its own national interests. South Africa critically needs to achieve higher economic growth to fulfil its potential and to address the many challenges in the country in terms of development and employment. The South African automotive manufacturing industry remains the most dynamic manufacturing sector and major driver of economic growth and development for the country. This is due largely to a supportive automotive industrial policy framework that has been sustained over the last three decades.
As the most sophisticated industrial manufacturing base on the African continent, South Africa remains an attractive destination of choice for companies wanting to establish manufacturing plants or wanting to expand their existing plants. The disruptions currently faced by the South African automotive industry include, responding to market changes, optimising regional integration (exports into Africa), establishing infrastructure as an enabler (cleaner fuels, paved roads, port and rail), achieving global competitiveness, and developing an inclusive value chain (empowerment, training initiatives in both up- and downstream operations).
However, under the SAAM 2021-2035, the future is paved with numerous opportunities revealing the extent of the potential for the long-term development of the South African automotive industry which may be summarised as follows:
• Attracting new vehicle assembly opportunities through improved competitiveness and exports.
• Increased localisation of automotive components at all tier levels.
• Increased vehicle and automotive component exports into Africa.
• Pursuing new trade partnerships in Africa with other vehicle assembly countries.
• Regional integration opportunities via the Tripartite Free Trade Area (TFTA) and the African Continental Free Trade Area (AfCFTA).
• South Africa’s participation in BRICS: trade and investment opportunities and improved access into the BRICS markets.
• Expand the exports of catalytic converters and platinum metal group products, such as fuel cells.
• Building partnerships with parastatals to improve efficiencies and reduce costs.
• Establishment of more R&D, engineering and testing facilities.
• Produce more “affordable vehicles”.
• Growth of South African middle class which would stimulate new vehicle sales.

109
• Beneficiation of materials fabricated for the automotive industry.
• South Africa’s automotive export markets: strong growth anticipated through 2030.
• Introducing more environment-friendly and fuel efficient vehicles, including electric vehicles.
Under the APDP, leading global OEMs have already invested R40 billion into the South African automotive industry. Automotive exports have doubled over the past decade from the 174 947 vehicles exported in 2009 to the 351 159 vehicles exported in 2019, with the sector producing 610 854 vehicles in 2018, and supporting in the order of 110 000 highly skilled jobs. An enabling operating policy environment, a reduction in the cost of doing business, a reduction in regulatory compliance procedures, the roll-out of modern infrastructure, and a greater focus on areas of competitive advantage remain key focus areas.
The South African government recognises the critical importance of the automotive industry to the country’s economy and remains committed to further supporting investment and development of the automotive industry in line with the National Industrial Policy Framework (NIPF) and the Industrial Policy Action Plan (IPAP). In this regard, the announcement of the APDP Phase 2, as part of the South African Automotive Masterplan 2021-2035, as well as interventions in a number of focus areas, will aspire to create a framework to secure even higher levels of investments, and vehicle and component production in the country.
In this regard, the announcement of the APDP
Phase 2, as part of the South African Automotive
Masterplan 2021-2035, as well as interventions in a number of focus areas, will aspire to create
a framework to secure even higher levels of investments, and vehicle and component production in the country.

110
KEY MOTOR INDUSTRY CONTACT DETAILS
Automotive Industry Export Council (AIEC)Telephone: +27 12 807 0086/0152Telefax: +27 12 807 0671Website: www.aiec.co.za
P O Box 74166Lynnwood Ridge0040
Department of Trade & Industry (the dti)Trade and Investment South Africa (TISA)
Export Marketing & Investment Assistance Scheme (EMIA)Telephone: +27 12 394 9500 (International)Telephone: 0861 843 384 (Customer Care Centre)Website: www.thedti.gov.za
Private Bag X84Pretoria0001
National Association of Automotive Component & Allied Manufacturers (NAACAM)Telephone: +27 11 392 4060Telefax: +27 86 659 0494Website: www.naacam.co.za
Postnet Suite # 597Private Bag 29Gallo Manor, 2052
National Association of Automobile Manufacturers of South Africa (NAAMSA)Telephone: +27 12 807 0086/0152Telefax: +27 12 807 0671Website: www.naamsa.co.za
P O Box 74166Lynnwood Ridge0040
National Union of Metalworkers of South Africa (NUMSA)Telephone: +27 11 689 1700/1/2/3Telefax: +27 11 833 6330/6408
P O Box 260483Excom, 2023
Retail Motor Industry Organisation (RMI)Telephone: +27 11 789-2542/886-6300Telefax: +27 11 789-4525Website: www.rmi.org.za
P O Box 2940Randburg2125
111

112
Standard disclaimer
The trade data is based on eligible APDP products. The AIEC cannot vouch for the accuracy of the information obtained from the source. Due to certain limitations, Customs and Excise statistics cannot always distinguish between automotive components eligible in terms of the APDP and non-APDP components. The main purpose of this trade data is to discern trends in exports and export destinations, as well as imports and countries of origin.
ISBN: 978-0-620-83427-8
