acknowledgements - global alliance for clean...
TRANSCRIPT

Table of Contents
ACKNOWLEDGEMENTS....................................................................................................iv
ACRONYMS.........................................................................................................................vi
1. INTRODUCTION.............................................................................................................................8
2. TYPES OF MICROFINANCE INSTITUTIONS IN GHANA........................................................10
2.1 Formal Financial Institutions...............................................................................................10
2.2 Semi-Formal Financial Institutions.....................................................................................10
2.3 Informal Financial System..................................................................................................11
2.4 Apex Bodies........................................................................................................................11
2.5 GHANA MICROFINANCE INSTITUTIONS NETWORK (GHAMFIN).........................12
3. METHODOLOGY..........................................................................................................................13
3.1 Data Collection....................................................................................................................13
3.2 Aggregate Outreach Data....................................................................................................13
3.3. MIX Data Collection and Analysis.....................................................................................13
4. OUTREACH...................................................................................................................................15
4.1 Total Clientele.....................................................................................................................15
4.2 Loans...................................................................................................................................16
4.3 Savings................................................................................................................................19
5. FINANCIAL STRUCTURE ......................................................................................................22
5.1 Capital-Assets Ratio............................................................................................................22
5.2 Debt to Equity Ratio............................................................................................................23

5.3 Gross Loan Portfolio/Total Assets.......................................................................................23
6. OVERALL FINANCIAL PERFORMANCE...............................................................................................24
6.1 Return on Assets..................................................................................................................25
6.2 Return on Equity.................................................................................................................26
6.3Operational Sustainability....................................................................................................26
6.4 Financial Self-Sufficiency (FSS).........................................................................................28
7. REVENUES....................................................................................................................................29
Profit Margin/Yield Gross/Real Yield...................................................................................29
8. EXPENSES ..................................................................................................................................32
(2) Financial Expense/Asset Ratio.........................................................................................32
9. EFFICIENCY..................................................................................................................................34
Operational Expense/ Gross Loans Portfolio........................................................................34
Cost per Borrower................................................................................................................36
10. PRODUCTIVITY......................................................................................................................38
Borrowers per Loans Officer..................................................................................................38
Borrowers per Staff...............................................................................................................39
Personnel Allocation.............................................................................................................40
11. RISK AND LIQUIDITY...............................................................................................................41
Portfolio at Risk 30 days........................................................................................................41
Write-off ratio /Gross Loans Portfolio....................................................................................42
Risk Coverage.........................................................................................................................42
12. CONCLUSIONS...........................................................................................................................44

Annex I.....................................................................................................................................46
LIST OF MFIs CONTRIBUTING DATA............................................................................46
Annex II....................................................................................................................................49
Financial Ratios Formulas.....................................................................................................49
Annex III...................................................................................................................................51
Analytical Adjustments.........................................................................................................51

ACKNOWLEDGEMENTS
GHAMFIN acknowledges the efforts and support of those mentioned below in connection with the production of this report.
Participating Institutions
For time spent in completing the MIX Data Collection Tool and responding to subsequent data verification enquiries.
Apex Bodies
ARB Apex Bank and Ghana Cooperative Credit Unions Association for identifying members capable to be included, and for the initial collection of data including outreach data.
Ghana Cooperative Susu Collectors Association for providing outreach data.
Contributors
For preparing the report:
David O Andah
Solomon Cudjoe-Seshie
Frank Badasu
Kwame Annin
Technical Advisers
For guidance and the analysis of the collected data:
Microfinance Information eXchange
Technical Editor
For meticulously reviewing the manuscript.
William Steel
Formatting
.For painstakingly adjusting the graphs and the scripts
Nenyi “Kobby” Andah
GHAMFIN Staff

Clara Fosu – for coordinating the whole exercise with MIX.
Edwin Benjua Yambor – for coordinating northern training and data collection with the SPEED consultant, Charles Kilibo.
Kwadwo A Appenteng – for the provision of IT support.
Joan Ahorlu – for follow up and administrative support.
Sponsorships
Ministry of Finance and Economic Planning – for supporting the benchmarking of MFIs currently under the World Bank-funded Economic Management and Capacity Building Project.
SPEED Ghana – for supporting the enhanced report on the northern MFIs.

ACRONYMS
ALM Asset and Liability Management
ARB Association of Rural Banks
ASSFIN Association of Financial NGOs
BOG Bank of Ghana
CAR Capital Adequacy Ratio
CUA Ghana Cooperative Credit Unions Association
CUs Credit Unions
Danida Danish Development Assistance
DCT Data Collection Tool (MIX)
DER Debt to Equity Ratio
FNGOs Financial Non-Government Organizations
FSS Financial Self-Sufficiency
GCSCA Ghana Cooperative Susu Collectors Association
GHAMFIN Ghana Microfinance Institutions Network
GHAMP Ghana Microfinance Policy
GLP Gross Loan Portfolio
GNI Gross National Income
GTZ German Development Cooperation
MFIs Microfinance Institutions
MIX Microfinance Information eXchange
NBFIs Non-Bank Financial Institutions
OSS Operational Self-Sufficiency
PAR Portfolio at Risk
RBs Rural Banks (other counties)
RCBs Rural and Community Banks (Ghana)
ROA Return on Assets
ROE Return on Equity
S&Ls Savings and Loan Companies
SEEP Small Enterprise Education and Promotion Network
SPEED Support Programme for Enterprise Empowerment and Development (GTZ/Danida Project)
SECTION ONE:
INTRODUCTION
AND
OVERVIEW

1. INTRODUCTION
While microfinance services are a key component of building a strong economy, the majority of small and micro entrepreneurs still do not have access to credit or savings. The current stage of financial system development in Ghana has not succeeded in adequately addressing the needs and requirements of the microfinance sector. Specialized institutions and other organizations engaged in providing finance for micro, small and medium scale enterprises (MSME) are only now receiving the needed attention. The range of financial instruments has remained rather limited and unsuitable for clientele in the MSME sector.
There is, therefore, an ongoing need to boost services of the microfinance institutions (MFIs) and strengthen them through training, technical assistance, funding, congenial policies and enabling infrastructure. The support will enable the MFIs to increase outreach and to rapidly increase the availability of financial services to the poor and largely rural population. Recent policy initiatives by the Government of Ghana to address problems of the sector have among others, manifested in the setting up of a Microfinance unit within the Ministry of Finance and Economic Planning and a draft Ghana Microfinance Policy which was promoted by the Microfinance Forum. The Government has on its own and with the support of some development partners been providing on-lending funding and logistics to the microfinance sector. The over-riding objective is to establish a comprehensive framework for the development of the microfinance sector for reducing poverty, increasing food security, increasing job opportunities for the rural poor and vulnerable in the country, and achieving economic and social growth.
The Ghana Microfinance Institutions Network (GHAMFIN) is among the policy advocacy organizations that have been beneficiaries of the funding support. This has enabled it to achieve an improved exchange of
Performance Monitoring and Benchmarking continues to be a prime objective of the Ghana Microfinance Institutions Network (GHAMFIN). The current report is the third to be produced by GHAMFIN. The first two covered performance of the MFIs in 2004 and 2005 - 06. Resources made available by the Government under the World Bank-financed Economic Management Capacity Building Project have funded this report as well as the preceding one. This assistance made it possible to train more microfinance institutions in the use of the Microfinance Information Exchange (MIX) Data Collection Tool to enable them to complete the data collection tool for the preparation of this report.
This report follows closely the format for the previous reports, with the addition of a chapter that has been added to compare the data for the institutions in the northern half of the country with the national benchmarks, as requested and supported by SPEED Ghana, a GTZ / DANIDA project. The three northern regions are the most deprived and poorest in the country. Only 11 out of the 125 Rural and Community Banks in the country are in these three regions.

Chapter 4 of this report deals with outreach performance based on the entire population of MFIs, which supply quarterly outreach data to their apex bodies or to GHAMFIN for aggregation and submission to the Ministry of Finance and Economic Planning. Chapters 5-7 analyse the performance benchmarks for the financial structure and performance, revenues, expenses, efficiencies/productivity and portfolio quality.

2. TYPES OF MICROFINANCE INSTITUTIONS IN GHANA
Ghanaian Microfinance Institutions fall into three main categories, based on their legal status: formal, semi-formal, and informal. The regional distribution of the types of microfinance institutions is shown in Annex II.
2.1. Formal Financial Institutions
Formal financial institutions are incorporated under the Companies Code 1963 and licensed by the Bank of Ghana (BOG) under either the Banking Act of 2004 as amended by Act 738 of 2007 or the Financial Institutions (Non-Banking) Law 1993 (under review) to provide financial services which include provision of credit and savings mobilization from the public. The status of regulatory compliance of this formal institution is shown in Annex V.
Rural and Community Banks (RCBs) operate as commercial banks under the Banking Act, except that they cannot undertake any foreign business, and their minimum capital requirement is significantly lower. RCBs operate as unit banks owned by both resident and non resident members of the rural community through the purchase of shares and are licensed by the Bank of Ghana. They were introduced in 1976 to deepen the provision of financial services. As at 2009, there were 129 RCBs with about 560 outlets, spread across all the 10 regions of the country. The three northern regions which constitute about half of the land mass of the country had only about 9% of them. RCBs finance their activities mainly through deposits from clients, borrowings, equity and concessionary loans from microfinance programs of the government and the development partners.
The Savings and Loans companies (S&Ls) are owned by private individuals or entities who hold shares in the companies. These are licensed as non-bank financial institutions,. Their capital requirement is much below that of the commercial banks, but well above that for the rural and community banks. There are 18 S&Ls, mostly located in the urban areas with limited physical presence in the rural areas. None of them operates in any of the three northern regions.
2.2. Semi-Formal Financial InstitutionsFinancial Non Governmental Organizations (FNGOs) and Credit Unions (CUs) are considered as semi formal – legally registered but not licensed by the Bank of Ghana. The Financial NGOs are incorporated as companies limited by guarantee (not for profit) under the Companies Code. Them are multipurpose NGOs providing micro credit and some non financial services. They are excluded from mobilizing savings from the public and hence have to use external funds for their micro credit operations. These funds are from donors, development partners, social investors and government programs. The largest FNGO has been borrowing from the market with a guarantee from its international social investor. There are about 42 FNGOs, of which about 20 are active. FNGOs in Ghana are small in size, most of them having less than 1000 clients. They operate in

the rural and peri-urban areas where the banks cannot reach. A few of them have urban operations.
Credit Unions are registered by the Department of Cooperatives as cooperative thrift societies that do mobilize savings deposits from and give loans to their members only. Even though it has been provided under the Non bank Financial Institutions law to be regulated by the Bank of Ghana, a framework for their regulation is being developed. They are however being self regulated by their association. The credit unions exist at work places, parishes and communities, there are both rural and urban unions. There are about 400 Credit Unions.
2.3. Informal Financial System The informal financial system covers a range of activities, including Susu (which includes itinerant savings collectors, rotating savings and credit associations, savings and credit “clubs” run by an operator companies, and scheme operated by banks), Community Based Organizations and Self Help Groups. The individual itinerant Susu Collectors have long provided an important form of savings in the West African sub region. They collect daily amounts set by each of their clients (usually traders and artisans) and return the accumulated amount at the end of the month, minus one day’s amount as a commission. Of late some susu companies have been set up with employees doing the collection. It is estimated that there are over 3,000 Susu Collectors nationwide of which 1200 are registered with the Ghana Cooperative Susu Collectors Association (GCSCA), the apex body.
2.4. Apex BodiesApex bodies have been formed for five categories of MFIs. The RCBs have two apex bodies. These are the original apex association of Board directors, Association of Rural Banks (ARB) which currently engages in advocacy, and the operational apex body, ARB Apex Bank Ltd, owned by the RCBs and licensed as a bank by the Bank of Ghana (established in 2001) with additional responsibilities to promote, develop and oversee the rural banking operations.
The Ghana Cooperative Credit Unions Association (CUA) was formed as the apex association for the CUs in 1968. The CUA provides training, product development, financing facility, insurance, auditing services and performance monitoring to its members in addition to advocacy. As the apex body for the Susu Collectors, the Ghana Cooperative Susu Collectors Association (GCSCA) provides advocacy, training and some self-regulatory measures to its members. It also promotes the credit union concept of being cooperative thrift societies managing their own resources. The Association of Financial NGOs (ASSFIN) was formed to advocate and enhance the operations of the NGOs providing credit. The last apex association to be formed is the Ghana Association of Savings and Loans Companies (GHASALC), which was formed in 2008 to bring the S&Ls together for advocacy and promote the development of the S&Ls.

2.5. GHANA MICROFINANCE INSTITUTIONS NETWORK (GHAMFIN)GHAMFIN is the Country Level Network of microfinance institutions in Ghana formed in 1998. Its mission statement underscores its vision of being the umbrella network of all micro financial service providers in the country and promoting the development of Ghana’s microfinance industry for its efficiency and effectiveness. Its membership is drawn from all the five categories of MFIs. These are:
(i) Rural and Community Banks
(ii) Savings and Loans Companies
(iii) Credit Unions
(iv) Financial NGOs
(v) Susu Collectors
All the apex bodies are also members of GHAMFIN with special status which provides them with uncontested positions on the governing Council of GHAMFIN. There were 60 paid up members as the end of 2007.
GHAMFIN operates in the following four key areas
(i) Advocacy to promote the ideals of microfinance and the interest of its members;
(ii) Capacity building, both human and non-human resources, of its members to improve on their efficiencies, productivities and effectiveness;
(iii) Performance benchmarking of microfinance institutions and the establishment of an industry data bank; and
(iv) Best practice information sourcing and dissemination for its members and other stakeholders.
GHAMFIN has become the “one stop shop” for information on the microfinance landscape of the country. Consequently its opinion, advice and data have been sought by the government and its agencies, missions from bilateral and multilateral development partners, investors, researchers and the media.
GHAMFIN is a founding and active member of the African Microfinance Institutions Network and a member of the Small Enterprise Education Promotion (SEEP) Network based in Washington DC.

3. METHODOLOGY
3.1 Data Collection
Data for this report were derived by two different methodologies. These are aggregate outreach data collected for Rural Banks, Savings & Loan companies, Financial NGOs, Credit Unions and Susu Collectors mainly through the respective apex associations and detailed performance data collected directly from the MFIs using the abridged MIX Data Collection Tool.
3.2 Aggregate Outreach Data
The data were collected in a simple format from a number of MFIs to generate limited performance data quarterly through the apex bodies and GHAMFIN for the Microfinance Unit of the Ministry of Finance and Economic Planning. The data collected from these MFIs covered their outreach; number of borrowers, loans outstanding, number of savers and outstanding balance of savings mobilized if applicable.
The main limitation to the analysis of the savings activities of MFIs in Ghana is that of double counting. Credit Unions and Susu collectors in the rural areas deposit part of their daily collections with rural banks for safe keeping. It is also possible that there are RB clients (borrowers or savers) who are also Credit Union members saving and borrowing. Furthermore some MFIs adopting the Freedom From Hunger methodology treat a group as one client whilst others count the individuals in the group for their outreach.
3.3. MIX Data Collection and Analysis
Ratios and indicators in this report correspond to what is used by Microfinance Exchange (MIX), an agency knows as The MIX. The ratios and indicators follow industry-accepted standards and definitions and are incorporated in the MIX performance indicators (Annex II).
Data collection was preceded with training of new MFIs in the use of the MIX Data Collection Tool to gather data from their records and reports. In all 10 CUs, 18 RCBs and 10 FNGOs were trained. This in addition to the 71 institutions trained in 2006, as contained in our report on 2004 benchmarks. Data from the reporting MFIs are gathered in the MIX Data Collection Tool (DCT). The completed DCTs are assembled at GHAMFIN for screening and verification. Where there are discrepancies, these are reviewed with the MFI concerned. DCTs are rejected when there are very serious data inconsistencies or when the MFIs concerned cannot provide important data for the completion of the DCT or are unable to provide the supporting audited financial statements. In some cases data were directly collected from the MFI by GHAMFIN staff.
The reviewed data were sent to the MIX office in Washington, D.C. for analysis and production of the benchmarks. The data sent were adjusted for inflation, cost of funds, subsidies and loan loss provisioning. The reporting institutions were put into three categories (RCBs, FNGOs and S&Ls) for benchmarking against MIX data for similar categories of MFIs in West Africa, Africa

and Global.1 For this report, the reference benchmarks come from MIX Benchmarking African Microfinance for 2007 (published in November 2008) and the MIX Microbanking Bulletin (MBB) for Autumn 2007. When the published benchmarks differ, preference is given to the MIX Benchmarking Africa Microfinance report.
1 S&Ls are compared to non-bank financial institutions (NBFIs). Ghana’s RCBs constitute a significant proportion of the African rural banks reporting to the MIX, so are less likely to deviate from the benchmarks.

4. OUTREACH
4.1 Total Clientele
Table 1: Female Composition of Outreach
MFIs %S&L 59RCBs 41CUs 80
FNGOs 94 Susu 60Overall 67
The 67% overall percentage of women clients in Ghana for 2007 was about the same as that for Africa region, which was 65.3%. The percentage of women clients reached with microfinance depends on the category of the microfinance institution (Table 1). Whilst those for the RCBs, the Susu Collectors and the Savings and Loans companies are below the national average, those for the FNGOs and the Credit Unions are on the other hand above the national average. The RCBs ranked above CUs by 14 percentage points in 2007, but were below their African peers by as much as 23 percentage points.
The very high percentage of women among clients of the FNGOs is principally because of their social orientation and specific targeting. The social and philanthropic investors upon whom the FNGOs depend for funding look at social performance indicators, of which access for women is one. Social performance management has therefore become an important aspect of FNGO management.

Fig 1: Number of clients by category in 2007(1,000)
S&Ls RCBs CUs FNGOs Susu
297
2671
243 208 301
4.2 Loans
The aggregate outstanding loan portfolios at the end of 2007 for the various categories of microfinance institutions in the country, excluding the Susu Collectors Association, i.e. Rural and Community banks (RCBs), Savings and Loans companies (S&Ls), Financial Non-governmental Organization (FNGOs),and Credit Unions (CUs) was GHc350.1 million .2
Fig 2: Loan Portfolios as Industry Percentages
2 Figures are given in Ghana cedis (GHc), for which the 2007 year-end exchange rate was 0.93 for one US dollar.

S&Ls RCBs CUs FNGOs
24%
49%
20%
7%
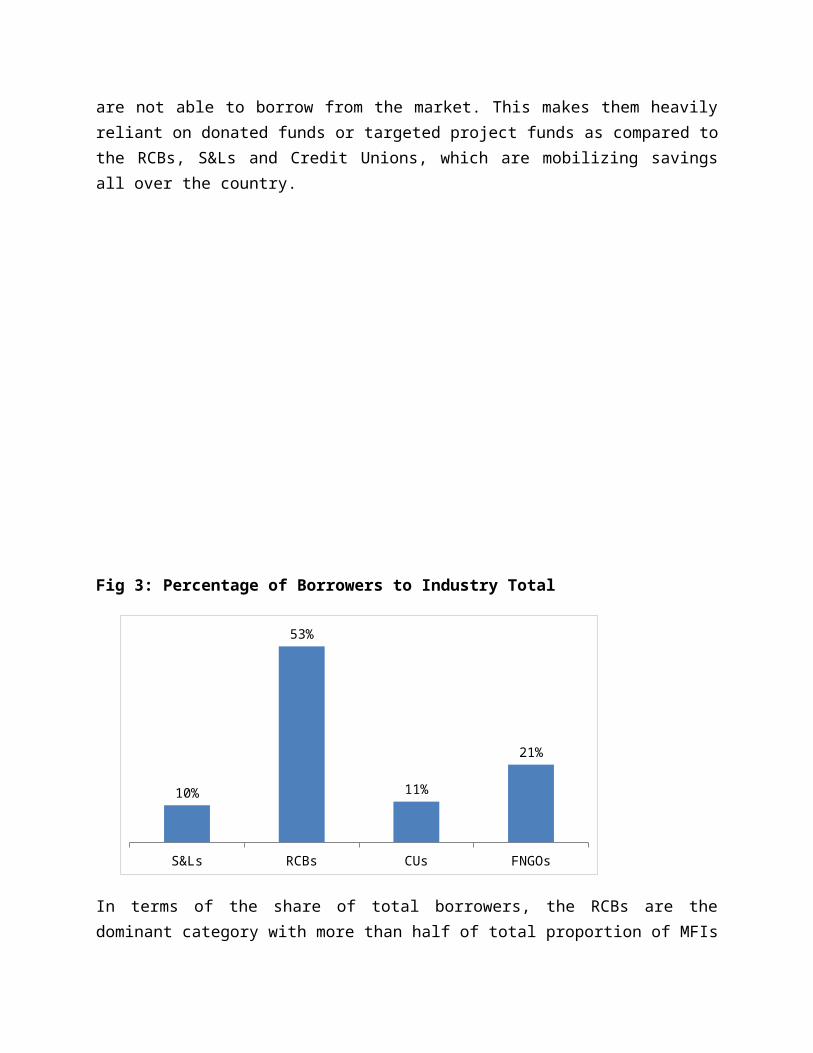
Fig 2 shows the percentage contributions to the total loan portfolio by the different categories of MFIs. The RBs are dominant in the size of their aggregate loans portfolios in 2007, with 49% of the industry total. The S&Ls followed with 24% and the Credit Unions (20%). The FNGO portfolio was the least (7%). The portfolio of the FNGOs remained by far the smallest largely due to the limited access to lending funds by the FNGOs, which are not allowed to mobilise savings from the public and generally are not able to borrow from the market. This makes them heavily reliant on donated funds or targeted project funds as compared to the RCBs, S&Ls and Credit Unions, which are mobilizing savings all over the country.
Fig 3: Percentage of Borrowers to Industry Total

S&Ls RCBs CUs FNGOs
10%
53%
11%
21%
In terms of the share of total borrowers, the RCBs are the dominant category with more than half of total proportion of MFIs (58%). The FNGOs is the second largest share of total borrowers with of 21% of the total industry, followed by the credit unions (11%). The S&Ls had the smallest number of borrowers with 10% of industry total, which is to some large extent due to its operation only in the big cities.
Fig 4: Depth of Outreach (Average Loan Size new cedis)
S&Ls RCBs CUs FNGOs
800
300
660
130
The average loan size relative to Gross National Income (GNI) per capita is often taken as a proxy for the income of the clients relative to the income of a country. This is the standard indicator for the depth of outreach ie how low down the poverty profile an MFI reaches in a country for global comparisons. For this report, the average loan size only is used to determine the depth of outreach for national comparisons. However, it needs to be noted that the size of

available loanable funds and the effective demand for loans may lead to administrative loan rationing, which may result in clients being given loan amounts less than what are actually needed or demanded. This is particularly the case for FNGOs, which depend on limited external funds, so their depth of poverty outreach may be overstated by this indicator.3 The S&Ls had the highest average loan size in 2007 followed by Credit unions, RBs and FNGOs in that order (Fig 4)
4.3 Savings
Fig 5: Composition of Total Savings
S&Ls RCBs CUs Susu
19%
57%
17%
7%
Since the FNGOs do not mobilize savings, they are excluded from this section. However the Susu Collectors, as savings mobilisers, are featured in Fig 5. Total savings mobilised by the reporting MFIs was Ghc518.1. The RCBs have the biggest share of the savings mobilized by the reporting MFIs for the period under review, with 57% of the total savings mobilized by the MFIs. The smallest share for all the categories during the period was the Susu collectors with 7%. The second biggest share of savings mobilized was Savings and Loans companies (19%), closely followed by the credit unions with 17% of the total savings mobilized.
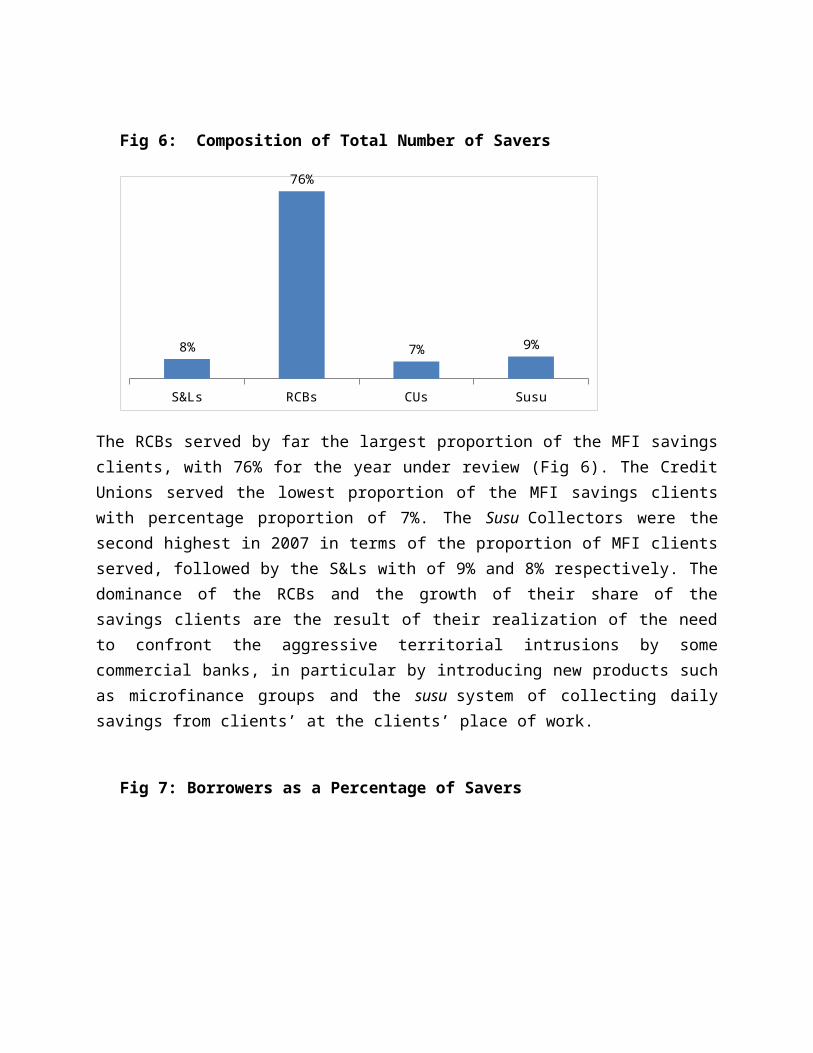
Fig 6: Composition of Total Number of Savers
3 For direct estimates of poverty outreach using the CGAP Poverty Assessment Tool for a sample of 17 MFIs in 2004, see “Microfinance Poverty Outreach and Performance Assessment,” GHAMFIN, 2007.

S&Ls RCBs CUs Susu
8%
76%
7% 9%
The RCBs served by far the largest proportion of the MFI savings clients, with 76% for the year under review (Fig 6). The Credit Unions served the lowest proportion of the MFI savings clients with percentage proportion of 7%. The Susu Collectors were the second highest in 2007 in terms of the proportion of MFI clients served, followed by the S&Ls with of 9% and 8% respectively. The dominance of the RCBs and the growth of their share of the savings clients are the result of their realization of the need to confront the aggressive territorial intrusions by some commercial banks, in particular by introducing new products such as microfinance groups and the susu system of collecting daily savings from clients’ at the clients’ place of work.
Fig 7: Borrowers as a Percentage of Savers
S&Ls RCBs CUs
34%
22%
44%
Fig 7 shows that the RBs had the lowest ratio of borrowers to savers in the year under review (22%). This is related to their high reserve requirements, their historical reliance on Treasury Bills rather than lending for income, and their tendency to be risk-averse. In contrast, 44% of the members of Credit Unions are borrowers at any one time. The members (clients) of Credit

Unions are required to save monthly whether they have loan repayments to make or not. Indeed that is why they are often referred to as savings and credit cooperatives, which emphasize the savings operations rather than the credit. The S&Ls borrowers to savers were 34%, which was 10 percentage points less that of the Credit Unions.
Table 2: Loans to Savings Ratios
MFI category
2007
S&Ls 0.85
Credit Unions
0.79
RCBs 0.59
The savings portfolios of the savings-mobilizing MFIs do exceed their loan portfolios. The RCBs were subjected to higher regulatory liquidity reserve requirements, which together with the Capital Adequacy Requirement restricted their ability to lend out more of their mobilized savings, resulting in the lowest ratio of loans to savings of 59%. The S&Ls with larger equity capital to meet their capital adequacy requirement were able to carry larger risk assets, with loans equal to 85% of the savings portfolio. Despite less stringent liquidity reserve and capital adequacy requirements, the Credit Unions’ ratio was smaller than that of the S&Ls reflecting the savings culture of the Credit Unions.
5.0 FINANCIAL STRUCTURE

5.1 Capital-Assets Ratio
Capital Assets Ratio refers to the level of capital of the MFI used to finance its assets.
Fig 8: Capital Asset Ratio
S&Ls RCBs FNGOs
25%
18%
33%
23% 23% 23%22% 22% 22%
Ghana Africa Global
The capital contribution to the assets of the Ghana MFIs (15%) was below the benchmarks for the West African, Africa and global (Fig 8). The ratio for the Rural Banks (18%) was also smaller than those for the Global and the African peers which were 22% and 23% respectively. This however was above the statutory minimum capital adequacy requirement of 10% which the RBs are to maintain in order to be in compliance. On the other hand the Ghana S&Ls had more capital invested in their assets (25%) than their Global and African peers which had 22% and 23% respectively. Among the Ghanaian MFIs, the FNGOs had the highest ratio (33%) which is not unexpected given their low capitalization and the dependence of the FNGOs on their capital for lending and not having any statutory requirement to comply with. The absence of the major international FNGOs and the inability of the most of the local FNGOs to access adequate funds for on-lending could explain their higher capital component in their assets than their peers in Africa (23%) and globally (22%).
.
5.2 Debt to Equity Ratio
Debt to Equity Ratio measures the overall leverage of the MFI and indicates the ability of the MFI to absorb losses should they occur. The total liability includes deposits, borrowings, account payable and other liability accounts. Total equity is the total assets less the total liability. The aggregate ratio for the Ghana MFIs was higher (4.7) than those of the Global, Africa and West Africa MFIs which were 3.6, 2.7 and 3.4 respectively. . The ratio for the RCBs (6.1) is higher than the aggregate national benchmark. It is also comparatively higher than the ratios of 3.4 and 2.7 attained by their Global and Africa peers respectively (Fig 9). This indicates that the RCBs are taking on more debts to finance their operations than their African and Global peers. Nationally, the RCBs are more debt for their operations than the Savings and Loans companies (3.0) and the FNGOs (2.0).
Fig 9: Debt-Equity Ratio
S&Ls RCBs FNGOs
3
6.1
2
2.7 2.7 2.7
3.4 3.4 3.4
Ghana Africa Global
The FNGOs’ ratio of 2.0 is comparatively lower than the ratios of 3.4 and 2.7 for their Global and the Africa peers respectively. However, the ratio for the Global S&Ls (3.4) was the higher than that of the Ghana peers (3.0) which is also higher than its Africa peers (2.7).
5.3 Gross Loan Portfolio/Total Assets
The Gross Loan Portfolio to Total Assets ratio indicates the proportion of the core earning assets of the MFI.
In Fig 10, loans component of the assets of Ghana MFIs was less than 50% which is far below the ratios for Africa (63%), West Africa (79%) and Global (64%). Among the MFIs in Ghana, the FNGOs had the highest ratio (66%) obviously because they do not have any statutory requirements to meet. This benchmark is the same for their Africa peers but below that for their

Global peers which was 13 percentage points higher. For the rural banks, those in Ghana allocated the lowest proportion of their assets to microcredit (53%) which is below the benchmarks of their Africa and Global peers which were above 60%.
Fig 10: GLP-Total Assets Ratio
S&Ls RCBs FNGOs
59%53%
66%66% 66% 66%
79% 79% 79%
Ghana Africa Global
The Ghana S&Ls also allocated the lowest proportion of their assets to microcredit (59%) compared with their Africa and Global peers. The Africa S&Ls benchmarked 66% while the Global peers’ was the highest (79%).
6.0 OVERALL FINANCIAL PERFORMANCE

6.1 Return on Assets
The ratio, Return on Assets, is the measure of how well an institution uses its total assets to generate income. The ratio includes not only the revenue from the portfolio, but also all other revenues generated.
Fig 11: Return on Assets
S&Ls RCBs FNGOs
3%
4%
-2%
-6% -6% -6%
2% 2% 2%
Ghana Africa Global
Whilst the Africa and the Global MFIs had negative returns, Ghana MFIs had a positive benchmark (1.6) which was about the same for West Africa MFIs (Fig 11). The RCBs produced the best benchmark (4%) among the Ghana MFIs whilst that for the FNGOs (-2%) was the worst as the S&Ls had positive return. Among the rural banks, Ghana’s 4% was the best against the 1.5% and -6% ROA attained by the Global and Africa peers respectively. Comparatively only the Global FNGOs among the peers achieved a positive ROA (1.5%) as against the negative 2.3% and negative 6% ROA achieved by the Ghana and Africa FNGOs respectively. This means that the composition of the assets of the Ghana and for that matter the Africa FNGOs are weaker in generation of revenues. For the S&Ls category, both the Ghana and Global S&Ls achieved positive returns of 2.6% and 1.5% respectively as against the negative 6% return achieved by the Africa S&Ls. This shows that the Ghana S&Ls have a strong revenue earning assets compared with their Africa and Global peers.
6.2 Return on Equity
The Return on Equity (ROE) is the measure of the level of revenue earned on the use of the equity of the MFI. . This ratio is frequently used as a proxy for commercial viability and sensitive to investor decision making.
Fig 12: Return on Equity
S&Ls RCBs FNGOs
9.60%
6.10%
-7.10%
0.50% 0.50% 0.50%
7.30% 7.30% 7.30%
Ghana Africa Global
Overall, Ghana attained the highest return of 11% compared with and the West African peers which had 7.3%, the nil return from Global peers and the negative 3% return from the Africa peers (Fig 12) in 2007. Among the Ghana MFIs, the S&Ls had the highest benchmark (9.6%) followed by the RCBs’ 7.3% and the negative 7.1% of the FNGOs. The Global RCBs attained a higher return (7.3%) than the RCBs (6.1%) which in turn was higher than the 0.5% return from the African peers. Among the FNGOs, Ghana’s negative return (-7.1) was far below the impressive Global peers achievement of 7.3% and the African peers’ benchmark of just 0.5%.
With ROE of 9.6%, Ghana S&Ls performed better than their Global peers who attained 7.3% return and the African peers’ 0.5%.
6.3 Operational Sustainability
Sustainability refers to the ability of repeating performance into the future. There are two sustainability measures in microfinance; these are Operational Self-Sufficiency (OSS) and Financial Self-Sufficiency (FSS). The OSS measures how well an MFI covers its costs through its operating revenues. In other words, OSS is achieved when the operating income is sufficient enough to cover operational costs like salaries, supplies, loan losses, and other administrative costs and FSS is attained when the OSS is adjusted for subsidies, exchange rates and inflation.
Fig 13: Operational Self-Sufficiency Ratio

S&Ls RCBs FNGOs
113%
119%
100%
113% 113% 113%116% 116% 116%
Ghana Africa Global
In Fig 13, all the MFIs irrespective of region or category attained the 100% Operational Self-Sufficiency. For regional comparison, the Ghana MFIs exceeded this by 23 percentage points which was the regional best. In the case of the rural banks, the Ghana RCBs had the biggest margin above the 100% mark. The margin attained by the S&Ls of Ghana was at par with that of their Africa peers and below that for the Global peers. On the other hand, the Ghana FNGOs just made it 100% OSS which was below those of their Africa and Global peers.

6.4 Financial Self-Sufficiency (FSS)
The purpose of the adjustments is to remove regional and local biases in order to make the sustainability globally comparable and also to obtain actual strength of the MFI.
Fig 14: Financial Self-Sufficiency
S&Ls RCBs FNGOs
110%119%
99%99% 99% 99%109% 109% 109%
Ghana Africa Global
In Fig 14, for regional comparison (Fig 6.4), the West Africa MFIs attained FSS at a marginal excess level (109%) just below the attainment of the Ghana MFIs (111%).The MFIs of the Africa and the West Africa regions failed to attain FSS, albeit both were in the upper half of the nineties. For the rural banks, the Ghana RCB and the Global were able to make the FSS mark with excess margins of which Ghana’s 19 percentage points was bigger. The attainment by the Africa rural banks was only one percentage point below full FSS. In the case of the FNGOs, the benchmarks for Ghana and Africa were both one percentage point below full attainment of FSS. The Global benchmark was however over full FSS by 9 percentage points. The Ghana benchmark for the S&Ls was in excess by10 percentage points. Whilst the Global benchmark was 109%, that for Africa was one percentage point short full FSS.

7. REVENUES
7.1 Profit Margin/Yield Gross/Real Yield
The National benchmark of 10% recorded for profit margin compares favourably with the Global benchmark of 10.4% and hence reflects a satisfactory level of profitability for National MFIs. The performance is far above the negative 5% and 2% recorded for Africa and the Western Africa sub- region respectively. The vast differences may have resulted from the complexity of categories of the MFIs and the mode of operations in Africa and the Western Africa sub-region as compared to the Ghana National standards.
Fig15: Revenues
The gross yield portfolio of 41% benchmark attained at the National level is a far better position than the Global All MFIs benchmark of 31.5%. The satisfactory position maintained by the National MFIs demonstrates a viability of operations. At the National level the MFIs have maintained good asset quality that kept loan loss provisions at low levels. However, the real yield benchmark of 24.3% recorded by the Global All MFIs is an improved position on the National benchmark of 27%. These are also strong indications of implementation of cost control measures by managements of the institutions which resulted in effective control of operational expenses.
The benchmarks for National MFIs (27%) in respect of real yield are higher than benchmarks for Africa (23%) and West Africa (21%) respectively but nevertheless lower than Global
Ghana West Africa Africa Global
10%
-2%-5%
10%
41%
28%33% 32%
27%
21% 23% 24%
Profit Margin Yield on Gross Portfolio Real Yield

benchmark of (30%). Efforts ought to be intensified to bring more innovations into the operational areas of the National institutions so as to record performance standards comparable to the Global benchmarks.
The benchmark for yield gross profit by the Ghana FNGOs (37.8%) is higher than the Global FNGOs (35.7%) but lower than the Africa FNGOs (39%). But all these did not measure up to the National benchmark with a profit margin of 41%. The Africa RCBs also recorded 43% and 29% for yield gross and real yields respectively far lower than the Ghana RB benchmarks of 44.7% and 31.7% for gross yield and real yields respectively. The Ghana RBs benchmarks are also higher than the Global RB figures of 23.7% and 10% for yield gross and real yield profits respectively. The Ghana S&Ls benchmarks of 53.3% and 38.4% for gross profit and real yield are also far above the Global S&L figures of 31.1% and 23.8% as well as the Africa S&L figures of 34% and 24% for yield gross and real yield respectively. The Ghana S&L figures are higher than the National benchmarks of 41% and 27% for yield gross and real yield respectively.
7.2 Profit Margin
Fig 16: Profit Margin
S&Ls RCBs FNGOs All MFIs
-50%
-40%
-30%
-20%
-10%
0%
10%
20%
-10.00%
2.90%
-28.50%
10.00%
-45.00%
13.00%
-19.00%
-5.00%
12.00% 14.00%8.00% 10.40%
Ghana Africa Global

Fig 17: Yield on Gross Portfolio
S&Ls RCBs FNGOs All MFIs
53%
45%
38%41%
34%
43%39%
33%31%
24%
35%32%
Ghana Africa Global
Fig 18: Real Yield
S&Ls RCBs FNGOs All MFIs
38%
32%
24%27%
24%
29%27%
23%24%
10%
28%24%
Ghana Africa Global
The negative benchmark of 19% for the Africa FNGOs and the negative 28.5% for Ghana FNGOs which are lower than 8% for Global FNGOs, amply demonstrate the main focus of FNGOs as institutions with greater focus on social orientations. Hence they are more interested

in extending credit to the very poor and deprived people mostly in rural areas to address poverty concerns than for profit motives.
8. EXPENSES
8.1 Financial Expense/Asset Ratio
The Financial Expense: Asset Ratio (Fig 17) shows that the National benchmark registered lower financial costs relative to assets with a ratio of 3% as compared with the benchmarks of 5%, and 6.7% recorded for Africa and Global MFIs respectively. The benchmark recorded for West Africa (3%) is same as the National benchmarks.
The level of efficiency exhibited by National MFIs is greater than the Global and African benchmarks.
Fig.19:Expenses
Ghana West Africa Africa Global
3% 3%
5%
7%
The comparative benchmark figures for FNGOs, S&Ls and RBs in relation to benchmarks recorded at the National, Global and Africa levels are shown in the Fig 18 as below.
The benchmark recorded by Ghana S&Ls (5.9%) is far lower than the Global S&Ls and Africa S&Ls benchmarks of 6.7% and 7% respectively, implying that the Ghana S&Ls had registered lower financial costs per unit of loan. The benchmark of 2.5% for Ghana RBs is however lower than the Global RBs benchmark of 8.3% and the Africa RBs figure of 3%. The Ghana FNGOs figure of 8.5% is higher than the Global FNGOs and Africa FNGOs figures of 6.8% and 6% respectively.

6.70%
8.50%
7%
3%
5%
6%6.80%6.70%
5.90%
2.50%3%
8.30%
00.010.020.030.040.050.060.070.080.09
ALL
MFI
s
FNG
Os
RC
Bs
MFI
sS
&Ls
ALL
MFI
s
FNG
Os
RC
Bs
MFI
s (S
& L
s)
AFR
ICA
MIX
FNG
Os
RC
Bs
MFI
s (S
&Ls
)
NATIONAL(GHANA) GLOBAL AFRICA
Institutions
Percentages
EXPENSES
Financial Expense/ Assets
The Global benchmark (6.7%), FNGOs (6.8%), and RBs (8.3%) recorded for Financial Expenses to Assets Ratio are higher than the Ghana MFIs benchmark of 3% which situation reflects more efficiency in financial management at National than the Global categories.
The position for Africa RBs of 3% as financial expense ratio is the same as the National benchmark, but the figures for Africa FNGOs (6%) and Africa S&Ls (7%) are higher than the National benchmarks.
8.2: Financial Expense/Assets
Fig 20:Expenses (i)

39%
19.20%
32%29%
00.05
0.1
0.150.2
0.250.3
0.350.4
National Global Africa WestAfrica
Institutions
Percentages
EFFICIENCYOperational Expense / GLP
9. EFFICIENCY
9.1 Operating Expense/ Gross Loans Portfolio Ratio
The National benchmark of 39% in respect of Operational Expenses to Gross Loans Portfolio which is a reflection of the overall costs incurred in managing loans portfolios is far higher than the Global figure of 19.2%, the Africa benchmark of 32% and the figure of 29% recorded for the West African sub-region.
This shows that at the National level efforts should be made aimed at attaining improvements in efficiency levels especially through the adoption of cost-cutting measures. The efforts should be directed towards achieving reductions in operational expenses and improvements in loans portfolio management and staff costs as far as the National benchmark is concerned.
Fig 21: Efficiency
The benchmarks for Operational expenses as a ratio of Gross Loans Portfolio as in Fig 20 for the Ghana S&Ls of 27.6% is higher than the Global S&Ls benchmark of 17.9%. The Ghana FNGOs figure of 23.3% is lower than the Global FNGOs figure of 27.1%. The Ghana RBs benchmark of 14.3% is far lower as compared with the Global RBs figure of 78%. The figures for Africa categories of MFIs (26%), FNGOs (38%) and RBs (45%) are all higher than the Ghana categories benchmarks. The Africa RBs benchmark of 45% is also higher than the National benchmark of 39%. The category benchmarks for Ghana S&Ls and FNGOs reflect the situation
0.45

39%
78%
38%
26%
45%
32%23.3%
14.3%
27.6% 27.1%
17.9%19.2%
0
0.1
0.2
0.3
0.4
0.5
0.6
0.7
0.8
0.9
ALL MFIs
FNG
Os
RCBs
MFIs S&Ls
ALL
MFI
s
FNG
Os
RCBs
MFIs (S & Ls)
AFRICA MIX
FNGOs
RCBsMFIs (S &Ls)
NATIONAL GLOBAL AFRICA
Percentages
EFFICIENCY
OperationalExpense / GLP
of some level of efficiency in the management of operational expenses as compared to the Africa category benchmarks and also compare quite favourably with the Global MFIs figure of 19.2%.
9.2
Fig 22: Efficiency (i)
The benchmark of 78% for Global RBs is far higher than all the Ghana categories as well as the National benchmarks and thus depicts a situation of this category recording very high operational expenses as far as loans administration is concerned. It calls for greater efforts by the RBs to keep operations expenses at low levels to enhance profitability.
Institutions

123
116114
105
95
100
105
110
115
120
125
National Global Africa West Africa
Institutions
Figures
EFFICIENCYCost / Borrower
(ii) Cost per Borrower
The National benchmark of $123 is much higher than the Global amount of $116, Africa ($106), and Western Africa figure of ($105) as in Fig 21. This reveals that the cost of servicing an active borrower is much higher at the National level than the other peer groups and measures ought to be adopted to reduce costs. Credit control measures should be instituted by the various MFIs so as to achieve good loan asset quality and to record satisfactory levels of repayments by clients.
Fig 23: Efficiency (Cost per Borrower)
The benchmark for cost per borrower recorded for the Ghana FNGOs (56.9) is lower than the National MFIs benchmark of 123 in Fig. 22. The Ghana FNGOs benchmark is also lower than the Global FNGO benchmark of 84 as well as the Africa FNGO figure of 77. The benchmark for Ghana S&Ls of 551 is far above the National S&L benchmark as well as the Global and Africa S&L benchmarks respectively. The Ghana RBs figure of 310 is as well higher than the National benchmark and at the same time higher than the Global and Africa RBs benchmarks. The benchmarks for the Ghana RBs and S&Ls reveal situations of higher efficiency levels than recorded for the National benchmark of 123 as well as the benchmarks for Global and Africa categories respectively. This is in sharp contrast with the benchmark for Ghana S&Ls benchmark of 551 which is far and above the National benchmarks and the Global and Africa S&Ls benchmarks. This implies that the Ghana S&Ls tend to spend much more on credit administration and in most cases concentrating on individual borrowers instead of adopting group and solidarity lending systems. This is at variance with the group loans methodology normally adopted by FNGOs (56.9) which involves spreading the costs of loans among several borrowers.

Cost / Borrower
12356.9
310
551
116 84 77158
11477
139.599.5
0
100
200
300
400
500
600
ALL
MF
Is
FN
GO
s
RC
Bs
MF
IsS
&Ls
ALL
MF
Is
FN
GO
s
RC
Bs
MF
Is (
S&
Ls)
AF
RIC
AM
IX
FN
GO
s
RC
Bs
MF
Is (
S&
Ls)
NATIONAL(GHANA) GLOBAL AFRICA
Institutions
Figures
Cost / Borrower
Fig 24: Cost per Borrower

159.6
225241.1
220.2
95.7125 124.7
102.5
0
50
100
150
200
250
National Global Africa West Africa
Institutions
Figures
PRODUCTIVITY Borrower /Loan Officer
Borrower / Staff
300
10. PRODUCTIVITY
10.1 Borrowers per Loans Officer
The National benchmark for borrowers per loan officer of 160 compares favourably and is much lower than the figures recorded for the other peers such as the Global figure of 225, Africa (241), West Africa (220) as in Fig 23. The lower productivity levels with respect to borrowers per loans officer figures are largely attributed to the fact that most MFIs in Ghana adopt group lending methodologies and engage in Susu collection methods. Therefore in the administration of micro-credit one loan officer handles more borrowers at a time, hence the lower costs.
Fig 25: Productivity
A comparison of the benchmarks for Borrower to Loans Officers as in Fig 24 in respect of the Ghana FNGOs 0f 343 with the Global FNGO figure of 243 and Africa FNGO figure of 262 shows higher productivity for the Ghana FNGOs over the Global and Africa categories. The Ghana S&Ls benchmark of 138 is however lower than the Global S&Ls and Africa S&Ls benchmarks of 227 and 284 respectively.
The Ghana RCBs benchmark of 253 is also far higher than the Global RCBs figure of 75 and the Africa RCBs benchmark of 139. This shows that the Ghana categories have recorded higher productivity levels. This is supported by the view that in adopting group lending methodologies for credit delivery, one loans officer would normally be dealing with more borrowers and thereby recording lower costs per borrower and thus higher productivity.

342.5
225 243
75
227 241.1284.3
134
261.9
138.6137.6
253.2
159.6
125151.2
77.9124.7114
137
6245.5
124.5
221.9
95.7
0
50100
150200
250300
350400
ALL
MFI
s
FNG
Os
RC
Bs
MFI
sS
&Ls
ALL
MFI
s
FNG
Os
RC
Bs
MFI
s (S
& L
s)
AFR
ICA
MIX
FNG
Os
RC
Bs
MFI
s (S
&Ls
)NATIONAL(GHANA) GLOBAL AFRICA
Institutions
Figures PRODUCTIVITY
Borrower / LoanOfficer
Borrower / Staff
(ii) Borrowers per Staff
The benchmark for Borrowers per Staff for the National MFIs of 96 compares favourably with the Global benchmark of 125, Africa figure 125 and the West Africa benchmark of 103 as shown in Fig 23.
This suggests that National MFIs adopt better lending methodologies than at the Global, Africa and West Africa levels and thereby minimize the costs of credit delivery as far as staff involvement is concerned.
Fig 26: Productivity (i)
The Ghana FNGOs benchmark of 222 recorded in respect of Borrowers per staff is much higher than the National benchmark of 96 and as well higher than the figures recorded for Global and Africa FNGOs of 137 and 151 respectively in Fig 24. The Ghana RBs also recorded a benchmark of 125 which is higher than the Global RBs benchmark of 62 but slightly lower than the Africa RBs benchmark of 125. The benchmark for Ghana S&Ls of 46 is lower than the Global S&Ls benchmark of 114 and the Africa S&Ls figure of 134. The benchmark for Ghana S&Ls show a better level of cost efficiency than the Global and Africa categories as far as the loans performance per staff member is concerned.

61%
50.10% 50% 50%
0
0.1
0.2
0.3
0.4
0.5
0.6
0.7
National Global Africa West Africa
Institutions
Percentages
PRODUCTIVITYPersonnel Allocation
2(i) Personnel Allocation
The Personnel Allocation ratio of 61% registered as the National benchmark in Fig 25 is much higher than 56.1% recorded for Global, 50% for West Africa, 50% for Africa respectively.
This implied that at the National level more staff are dedicated towards credit administration which is the core business of the MFIs than at the Global, Africa and West Africa levels.
Fig 27: Productivity (Personnel Allocation)
The Ghana FNGOs benchmark of 63.2% as in Fig 26 is higher than the National benchmark of 61%, the Global FNGOs benchmark of 56.8% and the Africa FNGOs figure of 63% respectively. The Ghana S&Ls benchmark of 39.6% is however much lower than the National benchmark of 61% and also lower than the Global S&Ls and the Africa S&Ls benchmarks of 56.3% and 56% respectively.
The Ghana RBs benchmark of 59% is lower than the National benchmark of 61% as well as the Global RBs benchmark of 60.3% but much higher than the Africa RBs benchmark of 47%. The benchmark for Africa S&Ls of 56% in respect of personnel allocation is much lower than the benchmark of 61% for National MFIs but higher than the Africa benchmark of 50%. The benchmarks for the Global categories such as the Global (56.1%), Global FNGOs (56.8%), Global RBs (60.3%), are all lower than the National benchmark of 61%. The only peer group which recorded a benchmark above the National benchmark is the Africa FNGOs which recorded 63%.

Personnel Allocation
61% 63% 56%
47%50%
56.3%60.3%56.8%56.1%
39.6%
59%63.2%
0%
10%
20%
30%
40%
50%
60%
70%
ALL
MFI
s
FNG
Os
RC
Bs
MFI
sS
&Ls
ALL
MFI
s
FNG
Os
RC
Bs
MFI
s (S
& L
s)
AFR
ICA
MIX
FNG
Os
RC
Bs
MFI
s (S
&Ls
)
NATIONAL(GHANA) GLOBAL AFRICA Institutions
Percentages
PersonnelAllocation
Fig 28: Comparative Productivity
7.5 RISK AND LIQUIDITY
(i) Portfolio at Risk 30 days.
The National benchmark for Portfolio at Risk >30 days was 7% as in Fig 27. This figure is far above the Global MFIs’ benchmark of 2.6%, Africa benchmark (4.8%) and also the West Africa benchmark (5.9%). This shows that the aggregate portfolio of the Ghanaian MFIs has very highly contaminated by default risk which reflects the comparatively poor portfolio quality of the three categories of Ghanaian MFIs against their Global and African peers
Looking at these three categories, the Ghanaian FNGOs’ portfolio quality (7.3% PAR>30days) is slightly lower than the National benchmark (7%) but much worse than those of its Global peers (2.4%) and its African peers (4.4%) (Fig 28). The Ghana RBs attained a poor portfolio quality benchmark of 22.7% which is in sharp contrast with the Africa RBs benchmark of 7.3% and the Global RBs figure of 4.6%. The Ghana S&Ls benchmark of 5.3% even though lower than the National benchmark, is likewise much higher than the benchmarks for the Global S&Ls (1.9%) and the Africa S&Ls (3.5%).

7% 2.6% 4.8%5.9%
36%
0.9%
58.8%
49.1%
2% 1.2% 1.8%2.0%0
0.1
0.2
0.3
0.4
0.5
0.6
0.7
National Global All MFIS MIX Africa West Affrica
Institutions
Percentages RISK & LIQUIDITY
PAR 30 days
Risk CoverageWrite-off Ratio/GLP
(ii) Write-off ratio /Gross Loans Portfolio
The National write-off ratio to gross loans benchmark indicates that 2% of its portfolio is uncollectable (Fig.27) which is higher than the Global benchmark (1.2%) as well as the West Africa benchmark (1.8%). It is however the same as the Africa benchmark of 2%.
Fig 29: Risk & Liquidity
With respect to comparative figures for the categories as in Fig. 28, the write- off ratio to Gross Loans Portfolio of 2% as a measure of the quality of loans recorded for the National benchmark is higher than the FNGOs’ benchmark (1.4%) and the S&Ls’ benchmark ( 0.9%). But again the write off ratio of the RBs (5.9%) is higher than the National benchmark as well as those of the FNGOs and the S&Ls.
The Ghana FNGOs write-off benchmark (1.4%), even though higher than the Global FNGO benchmark (1.0%), is lower than the Africa FNGO benchmark of 1.6%. The Ghana RBs’ benchmark of 5.9% is well above the Global peers’ figure of 0.4% and that of its Africa peers’ (3.8%). The Ghana S&Ls’ write-off benchmark (0.9%) is lower than the Global S&L benchmark (1.3%) as well as the Africa peers’ figure of 1.9%
(iii) Risk Coverage
The National benchmark for Risk Coverage as indicated in Fig. 27 is 36%. This figure is much lower than the benchmarks for the peer groups of Africa (58.8%), and of West Africa (49.1%). The Global provision for risk coverage is negligible.

36%
58%
7.3%2.6% 2.4% 4.6% 1.9%4.8% 4.4% 3.5%7.3%7%
5.3%
22.7%
0.9% 0.9% 0.6% 1%
34.9%
96%
58.8%
33.6%
63.4%69%
1.2% 1%0.4%
1.3% 2% 1.6% 3.8%1.9%1.4%2% 0.9%
5.9%
0
0.2
0.4
0.6
0.8
1
1.2ALL
MFI
s
FNG
Os
RC
Bs
MFI
sS&Ls
ALL
MFI
s
FNG
Os
RC
Bs
MFI
s (S
& L
s)
AFR
ICA
MIX
FNG
Os
RC
Bs
MFI
s
NATIONAL(GHANA) GLOBAL AFRICAInstitutions
Percentages
RISK &LIQUIDITY
PAR 30days
RiskCoverage
Write-offRatio/GLP
Fig 30: Risk & Liquidity (i)
Among the three categories of Ghanaian MFIS, the FNGOs provided the largest reserve coverage for its contaminated loans (96%) which is more than the National benchmark (36%) and the benchmark for its African peers (63.4%) (Fig.28.) The Ghana RBs provided coverage for about one- third of its contaminated portfolio (34.9%) which is just about the same as the benchmark for Africa RBs (33.6%). The Ghana S&Ls’ benchmark of 58% even though is lower than that of its Africa peers (69%) is larger than the National benchmark of 36%. All the relative Global benchmarks were less than 1.0% except the S&Ls which benchmarked 1%.

8.0 CONCLUSIONS
The review and evaluation of the National benchmarks in Ghana and the comparisons with Global, African and sub-regional benchmarks are important for monitoring progress made towards the institutional strengthening of the MFIs. The National All MFIs have shown strong and improved benchmarks. However when compared with Global standards it shows a situation of very vast differences in some benchmarks and calls for improvements in several operational areas of the MFIs.
The performance benchmarks have established that several MFIs can profitably serve large numbers of relatively poor households. The review has revealed that several commercial banks have increasingly recognized microfinance as a viable product. The benchmarks demonstrate that participation of commercial banks in the microfinance sector along-side the MFIs has contributed to scaling-up access in rural and peri-urban areas to a wider array of financial services.
Among the several challenges facing the microfinance sector, the most critical and pressing relates to the mobilization of the requisite resources for enhancing the performance of micro finance institutions. Efforts to address these should lead to the improvements in the performance of the MFIs and consequently the performance benchmarks.
The policies should be geared towards building and strengthening of capacity of MFIs in terms of structural building, adequate capitalization and competent managements. They should cover the training of personnel of the MFIs in the acquisition of relevant skills especially in credit delivery methods.
Strategies should be initiated to streamline and maintain proper conduct and standards within the microfinance sector and address the challenges in clearly identifying the various players in the sector. It should be useful to identify which MFIs are deposit-taking and those which apply own funds for micro-credit and to design appropriate framework to effectively monitor and regulate their operations.
The challenges when well addressed should strengthen the benchmarks of the MFIs. Above all re-structuring of, and assistance to MFIs should result in improving their efficiency in such areas as loan monitoring and collection, assessment of incidence of loan defaults and adequacy of loan loss provisions, determining their level of solvency or insolvency and sustainability of operations and particularly evaluating the breadth and depth of outreach.
The recent enactment of the Non-Bank Financial Institutions Act, 2008 (Act 774) is expected to constitute the basis for design of the appropriate framework for the supervision of MFIs. The relevant regulations when issued should facilitate the process. For example, Section 1(a) of the Act mandates the Bank of Ghana to bring operators of micro finance services with risk assets above prescribed amounts under some licensing and supervision regime. In due course, the Bank of Ghana should after consultations with the relevant agencies be able to determine the

thresholds to bring the Non-deposit taking microfinance services under some form of supervision so as to address issues of regulatory arbitrage in the system.
Furthermore, it is important also to highlight the provisions in Section 31(2) of the Act that “the Bank under section 4(2), (3), and (4) of the Bank of Ghana Act, 2002 (Act 612) may appoint an authorized agent which includes an apex body, network, industrial association, self regulatory organization, society or group to regulate and supervise, specified activities of a particular tier or category or class of non-bank financial institutions.” The implementation of this provision will help to reduce the burden on the Bank of Ghana to exercise supervision over multiple and rather small institutions and enable it to focus on bigger players and delegate its authority. It will further ensure that smaller MFIs and NGOs which are able to reach remote rural areas should not be suppressed by excessive regulation. Relevant forms of non-prudential regulation could then be designed by the authorized agents to have effective oversight on these categories of MFIs.
In this direction, specialized advocacy agencies such as GHAMFIN would require to be strengthened in terms of structure and capacity to re-enforce its objective of focusing on the building of capacity for the categories of MFIs. They should be encouraged to conduct periodic reviews, continue to collaborate with other agencies (local and international) for improving the benchmarks and standards for evaluating outreach, and, working towards maintaining effective and efficient financial performance and soundness of MFIs in Ghana. This will demonstrate that micro finance services constitute the major instruments for empowering the poor and giving them access to the resources of the society and state.
The measures by the Government and the Central Bank of Ghana in recent years towards the development of the microfinance sector are commendable, and it is expected that the implementation of the provisions of the Act 774 as complemented with related policies an strategies, should help to streamline the regulatory system for a more systematic and thorough supervision of MFIs in the country.

Annex I
LIST OF MFIs CONTRIBUTING DATA
Rural Banks
Ga
Adansi
Ahantaman
Bosomtwe
Kakum
Lower Pra
Otuasekan
South Akim
La Community Bank
Mepe Area
Akuapem
Union
Upper Manya Kro
Wamfie
Sonzele
Toende
Borimange

Bessfa
Gambaga
Nandom
Builsa
Naara
Bonzali
FNGOs
Maata-n-tudu
Grameen
Card
E-life
Cedi Finance
Cran
Aped
ID Ghana
Sinapi Aba Trust
Kraban Support Foundation
Savings and Loans
First Allied
Opportunity International
Women’s World Bank

ProCredit

Annex II
Financial Ratios Formulas
As defined by the Microfinance Information eXchange (MIX)
Financial Performance
Operational Self-Sufficiency
Financial Revenue/ (Financial Expense + Net Loan Loss Provision Expense + Operating Expense)
Financial Self-Sufficiency
Adjusted Financial Revenue/ Adjusted (Financial Expense + Net Loan Loss Provision Expense + Operating Expense)
Return on Assets
Adjusted Net Operating Income, net of taxes/ Adjusted Average Total Assets
Return on Equity
Adjusted Net Operating Income, net of taxes/ Adjusted Average Total Equity
Profit Margin
Adjusted Net Operating Income/ Adjusted Financial Revenue
Efficiency & Productivity
Operating Expense/ Loan Portfolio
Adjusted Operating Expense/ Adjusted Average Gross Loan Portfolio
Cost per Borrower
Adjusted Operating Expense/ Adjusted Average Number of Active Borrowers
Borrowers per Loan Officer
Adjusted Number of Active Borrowers/ Number of Loan Officers
Borrowers per Staff Member
Adjusted Number of Active Borrowers/ Number of Personnel
Personnel Allocation Ratio
Number of Loan Officers/ Number of Personnel
Portfolio Quality
Portfolio at Risk> 30 Days