acknowledgements - san bernardino · pdf fileacknowledgements the county of san ... desert...
TRANSCRIPT


Acknowledgements
The County of San Bernardino Homeless Partnership wishes to thank all of the individuals and organizations that contributed to the preparation, implementation and success of the 2013 Point-In-Time Count and Subpopulation Survey. Such an endeavor would not be possible without the collaboration and efforts of many volunteers, community groups, faith- and community-based organizations, county departments, city representatives and staff, homeless service providers, law enforcement and elected officials. Your hard work, time and dedication to ending homelessness are greatly appreciated.
Special thanks to the over 400 community volunteers from all across San Bernardino County who canvassed
areas identified as “green count zones” the morning of January 24th
, to count the 2013 Point-In-Time-Count and Subpopulation Survey.
Special thanks to the following agencies and organizations that contributed staff time, resources, and office space for planning, training and development activities to help make the 2013 Point-In-Time Count and Subpopulation Survey a success:
Abiding Love Church Barstow Community Day School Blessing Center Central City Lutheran Mission CityLink Outreach Water of Life Community Church City of Adelanto City Offices City of Chino Community Services City of Chino Police Department City of Chino Hills City Offices City of Colton Lawrence Hutton Community Center City of Grand Terrace City Offices City of Highland City Offices City of Loma Linda City Offices
City of Ontario Housing Agency City of San Bernardino Office of the Mayor City of Upland Parks and Recreation County of San Bernardino Human Services
Department of Behavioral Health Transitional Assistance Department Workforce Development Department
Ecclesia Christian Fellowship Good Shepherd Lutheran Church Salvation Army – San Bernardino Sportsman’s Club TTT Community Recovery, Inc. Way World Outreach
Special thanks to all of the law enforcement agencies and officers throughout San Bernardino County for their
time, knowledge, and expertise:
Barstow Police Department Barstow Sheriff Station Big Bear Sheriff Station Central Sheriff Station Chino Hills Sheriff Station Chino Police Department City of Rialto Code Enforcement Colorado River Sheriff Station Colton Police Department Fontana Police Department Fontana Sheriff Station Hesperia Sheriff Station Highland Sheriff Station Montclair Police Department Morongo Basin Sheriff Station
Ontario Police Department Rancho Cucamonga Police Department Redlands Police Department San Bernardino Police Department Town of Apple Valley Sheriff Station Upland Police Department Victor Valley Sheriff Station Victorville Police Department Yucaipa Sheriff Station

Special thanks to the many community organizations – homeless service providers, faith-based organizations and other community groups - that offered their support and counsel during the count planning and implementation process:
2-1-1 San Bernardino County
Inland Empire United Way Arrowhead United Way
Central City Lutheran Mission Community Action Partnership
of San Bernardino County Desert Communities United Way
Desert Manna Ministries Ecclesia Christian Fellowship
Foothill Family Shelter High Desert Homeless Shelter
Inland Temporary Homes Mary’s Mercy Center
Mercy House New Hope Village
Pacific Lifeline Salvation Army – San Bernardino
The Blessing Center Victor Valley Family Resource
Family Assistance Program Way World Outreach
Good Shepard Lutheran Church Water of Life Community Church
St. Mary’s Regional Medical Center Angel House
TTT Community Recovery, Inc. VA Loma Linda
Special thanks to the following individuals who went above and beyond to provide valuable coordination,
guidance, deployment site support, reporting and training development:
Alice Smith Janis Rice Alma Hernandez Jeanette Hill
Angela Pasco Kent Paxton Anna Ulibarri Kristy L. Loufek
Carrie Rios Martha McPhee Christopher Rymer Mary Jo Thornton Connie Gastelum Michael Hofflinger
Dale Everhart Richard Moorehead Deanna Luttrell Ronald Goble Debbie Alcorn Ruth Lorentz Debra Kreske Sandra Molina
Donna McKnight Tina Cherry Glenda Jackson Vickie Lee
James Rosemeyer Wayne Hamilton Special thanks to the County of San Bernardino Information Services Department, Brent Rolf and staff, for
your hard work in creating and providing maps for the day of the count.

Special thanks to our research consultants, the Institute for Urban Initiatives, for their expertise and guidance through the entire Point-In-Time Count and Subpopulation Survey process, including methodology development and implementation, planning coordination and guidance, and production of the final report.
Joe Colletti, PhD, Executive Director Don Smith, Project Director
Sofia Herrera, PhD, Research Director Daneli Ureña, Research Assistant
Thelma Herrera, Graphic Designer

Table of Contents
Page
Executive Summary 1
Background Information 11
Methodology 13
One More Crucial Step – Oversight 20
Appendix A: Homeless Count and Subpopulation Instrument 22
Appendix B: Subpopulation Data for Unsheltered Population 23
1
I. Executive Summary
The 2013 San Bernardino County Homeless Count and Subpopulation Survey provides baseline
data that quantifies and documents the total number of homeless persons and the number of
homeless persons for several subpopulations for the entire County that includes 24 cities and
four unincorporated areas in which homeless persons were counted (see tables 1 - 3 below).
This information also provides an opportunity for each jurisdiction to establish annual
incremental “reduction” benchmarks that will serve as markers by which progress towards
ending homelessness can be measured over the next five years which is strongly encouraged by
the United States Department of Housing and Urban Development (HUD).
In order to achieve the annual benchmarks, each jurisdiction
also has an opportunity to adopt and implement the
recommendations in this report in order to end homelessness
within its boundaries. These recommendations are aligned
with the County of San Bernardino 10-Year Strategy to End
Homelessness. They are also aligned with several evidence-
based and best practices that have been promoted throughout
the country during the past decade. These practices have
helped achieve unprecedented decreases in the total number
of homeless persons—and in particular families, chronic
homeless persons, and veterans—across the country since
2005.
There are 2,321 adults and children who are homeless on a given day in San Bernardino County
as noted in Table 1 below. Of the 2,321 persons, 1,247—1,182 adults and 65 children—are
unsheltered and 1,074—640 adults and 434 children—were sheltered. Five hundred and
eighteen (518) persons—357 adults and 161 children—were living in shelters or received a
motel voucher, and 556 persons—283 adults and 273 children—were living in transitional
housing.
Table 1 also notes that more than three-fourths (78%) or 1,821 homeless adults and children
were counted within seven cities which include Fontana, Loma Linda, Ontario, Rancho
Cucamonga, San Bernardino, Upland, and Victorville. Also, these seven cities had nearly three-
fourths (74%) of the shelter population and nearly 100% (91%) of persons counted in
transitional housing.
Three initial steps are
needed in order to end
homelessness in each
jurisdiction: 1) accept
baseline numbers; 2)
establish annual
“reduction” benchmarks;
and 3) implement the
next steps in this report
to achieve reductions.

2
Table 1. Jurisdictions with Largest Number of Homeless Persons
Jurisdiction
Total Unsheltered & Sheltered
Unsheltered
Count
Sheltered
Count
Emergency Shelter/Vouchers
Transitional Housing
# % # % # % # %
County 2,321 100 1,247 100 518 100 556 100
San Bernardino 908 39 497 40 180 37 231 42
Victorville 292 12 93 7 145 24 54 10
Upland 158 7 75 6 3 1 80 14
Ontario 136 6 87 7 23 5 26 5
Loma Linda 119 5 7 1 0 0 112 20
Fontana 117 5 98 8 19 4 0 0
Rancho Cucamonga 91 4 76 6 15 3 0 0
Total: 1821 78 933 75 385 74 503 91
Table 2 provides the total number of homeless adults and children counted in all other cities
not included in Table 1 and four unincorporated communities (in which homeless persons were
counted) which constitute 500 or 22% of the total homeless population. Of the 500 adults and
children, 314 or 63% were unsheltered, 133 (27%) were living in emergency shelters or had
received a motel voucher, and 53 (10%) were living in transitional housing.
Table 2. Number of Homeless Persons in Other Jurisdictions
Jurisdiction
Total Count for Unsheltered & Sheltered
Unsheltered
Count
Sheltered
Count
Emergency Shelter/Vouchers
Transitional Housing
# % # % # % # %
County 2,321 100 1,247 100 518 100 556 100
29 Palms 5 0.2 5 0.4 0 0 0 0
Adelanto 9 0.4 0 0 0 0 9 2
Apple Valley 1 0 1 0 0 0 0 0
Barstow 61 3 19 1.5 31 6 11 2
Big Bear 8 0.3 0 0 8 2 0 0
Bloomington* 14 1 14 1 0 0 0 0
Chino 27 1 27 2 0 0 0 0
Chino Hills 0 0 0 0 0 0 0 0
Colton 73 3 58 5 15 3 0 0
3
Jurisdiction
Total Count for Unsheltered & Sheltered
Unsheltered
Count
Sheltered
Count
Emergency Shelter/Vouchers
Transitional Housing
# % # % # % # %
Grand Terrace 0 0 0 0 0 0 0 0
Hesperia 50 2 9 1 28 6 13 2
Highland 25 1 25 2 0 0 0 0
Joshua Tree* 70 3 26 2 25 5 19 3
Lenwood* 10 0.4 10 1 0 0 0 0
Lytle Creek* 3 0.1 3 0.2 0 0 0 0
Montclair 15 1 15 1 0 0 0 0
Needles 5 0.2 5 0.4 0 0 0 0
Redlands 62 3 47 4 14 2 1 0
Rialto 26 1 14 1 12 2 0 0
Yucaipa 12 0.5 12 1 0 0 0 0
Yucca Valley 24 1 24 2 0 0 0 0
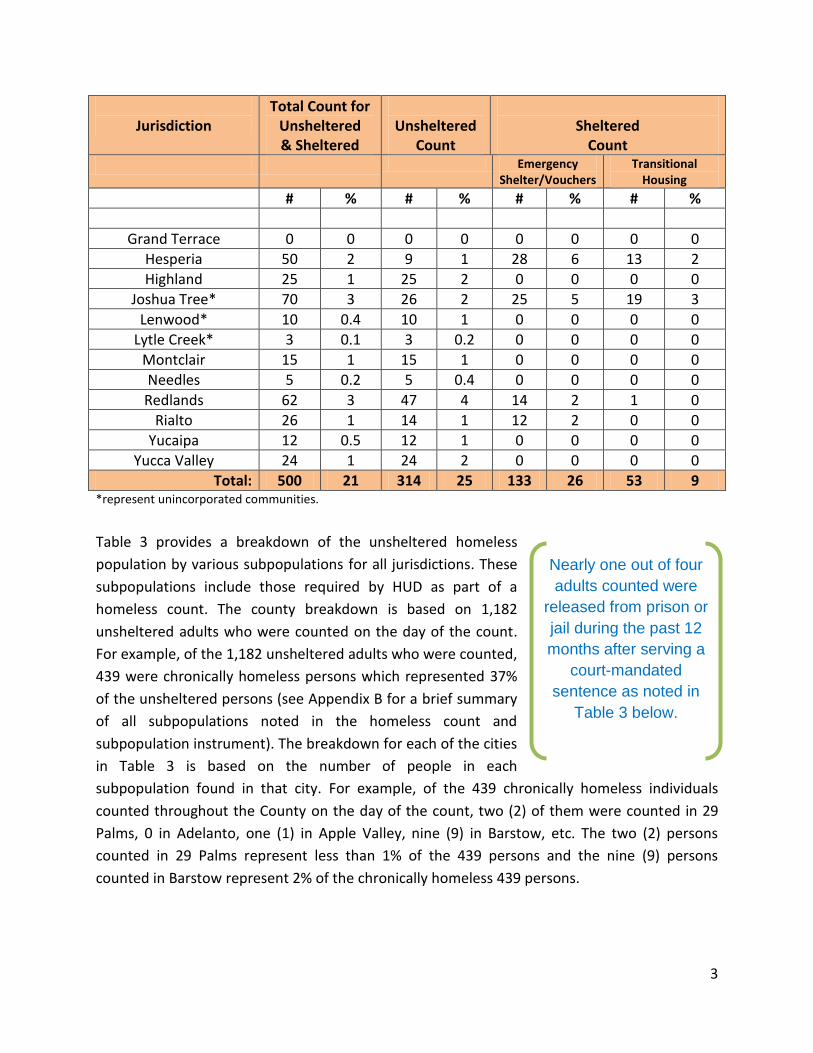
Total: 500 21 314 25 133 26 53 9 *represent unincorporated communities.
Table 3 provides a breakdown of the unsheltered homeless
population by various subpopulations for all jurisdictions. These
subpopulations include those required by HUD as part of a
homeless count. The county breakdown is based on 1,182
unsheltered adults who were counted on the day of the count.
For example, of the 1,182 unsheltered adults who were counted,
439 were chronically homeless persons which represented 37%
of the unsheltered persons (see Appendix B for a brief summary
of all subpopulations noted in the homeless count and
subpopulation instrument). The breakdown for each of the cities
in Table 3 is based on the number of people in each
subpopulation found in that city. For example, of the 439 chronically homeless individuals
counted throughout the County on the day of the count, two (2) of them were counted in 29
Palms, 0 in Adelanto, one (1) in Apple Valley, nine (9) in Barstow, etc. The two (2) persons
counted in 29 Palms represent less than 1% of the 439 persons and the nine (9) persons
counted in Barstow represent 2% of the chronically homeless 439 persons.
Nearly one out of four
adults counted were
released from prison or
jail during the past 12
months after serving a
court-mandated
sentence as noted in
Table 3 below.

4
Table 3. Unsheltered Homeless Subpopulations by All Jurisdictions
*Chronic Homeless Persons
Mentally
Ill
Persons w/HIV/
AIDS
Sub-
stance Abusers
U.S.
Veterans
Victims
of Domestic Violence
**Youth Under
18
Youth
18 thru 24
Released
from Prison
or Jail***
# % # % # % # % # % # % # % # % # %
County 439 37 258 22 15 1 281 24 135 11 205 17 17 1 79 7 255 22
29 Palms 2 1 4 2 0 0 0 0 0 0 2 1 0 0 0 0 0 0
Adelanto 0 0 0 0 0 0 0 0 0 0 0 0 0 0 0 0 0 0
Apple Valley 1 0 0 0 0 0 1 0.3 0 0 1 0.5 0 0 0 0 0 0
Barstow 9 2 3 1 1 6.7 3 1 2 1.5 4 2 0 0 0 0 5 2
Big Bear 0 0 0 0 0 0 0 0 0 0 0 0 0 0 0 0 0 0
Bloomington 3 1 3 1 0 0 3 1 2 1.5 2 1 0 0 1 1 3 1
Chino 5 1 1 0 0 0 2 1 1 1 2 1 0 0 2 2.5 1 0
Chino Hills 0 0 0 0 0 0 0 0 0 0 0 0 0 0 0 0 0 0
Colton 21 5 7 3 3 20 10 4 3 2 9 4 0 0 1 1 10 4
Fontana 32 7 19 7 2 13 11 4 12 9 26 13 1 6 11 14 20 8
Grand Terrace 0 0 0 0 0 0 0 0 0 0 0 0 0 0 0 0 0 0
Hesperia 3 1 0 0 0 0 4 1 2 1.5 2 1 0 0 0 0 2 1
Highland 8 2 4 2 1 6.7 4 1 4 3 3 1 0 0 0 0 5 2
Joshua Tree 5 1 6 2 0 0 4 1 3 2 6 3 0 0 2 2.5 4 2
Lenwood 2 0 6 2 0 0 2 1 0 0 2 1 0 0 0 0 2 1
Loma Linda 1 0 0 0 0 0 0 0 0 0 1 0.5 0 0 0 0 1 0
Lytle Creek 3 1 1 0 0 0 1 0.3 1 1 1 0.5 0 0 0 0 1 0
Montclair 6 1 6 2 1 6.7 8 3 3 2 1 0.5 0 0 0 0 3 1
Needles 1 0 0 0 0 0 1 0.3 0 0 0 0 0 0 3 4 0 0
Ontario 44 10 14 5 0 0 20 7 10 7 12 6 0 0 3 4 18 7
Rancho Cucamonga
19 4 7 3 0 0 13 5 4 3 4 2 1 6 14 18 11 4
Redlands 9 2 13 5 0 0 17 6 3 2 11 5 8 47 5 6 10 4
Rialto 8 2 4 2 0 0 6 2 1 1 1 0.5 1 6 0 0 3 1
San Bernardino 195 45 118 46 6 40 129 46 62 46 72 35 5 29 21 27 114 45
Upland 20 4 17 6.5 0 0 7 2 12 9 16 8 0 0 5 6 9 4
Victorville 30 7 17 6.5 0 0 24 9 9 7 20 10 1 6 4 5 29 11
Yucaipa 3 1 3 1 0 0 0 0 1 1 0 0 0 0 0 0 0 0
Yucca Valley 9 2 9 3 1 6.7 11 4 0 0 7 3 0 0 7 9 4 2
*HUD also requires a breakdown of chronically homeless families of which there were six counted.
**Youth under 18 includes only those unaccompanied by an adult(s).
*** Persons released from jails or prison during the past 12 months after serving a court-mandated sentence.
A. Next Steps: Implementing Recommendations to End Homelessness
This section outlines next steps that the County and each city should take to end homelessness
within its jurisdictions. These steps are aligned with the County of San Bernardino 10-Year
Strategy to End Homelessness and are also aligned with several evidence-based and best
practices that have helped achieve unprecedented decreases in the total number of homeless
persons, particularly among families, chronic homeless persons, and veterans, across the
country since 2005.
5
Next steps include the following six recommendations:
Recommendation 1: Adopt baseline numbers and establish annual “reduction”
benchmarks for each jurisdiction
The first step should include adopting the total number of homeless persons and the total
number of homeless persons within each subpopulation category as noted in Tables 1 through
3. These numbers should serve as baseline numbers for the County as a whole and for each of
the 24 cities and the four unincorporated areas in which homeless persons were found.
Benchmarks should be established that serve as annual incremental percentages that function
as markers by which progress towards ending homelessness can be measured.
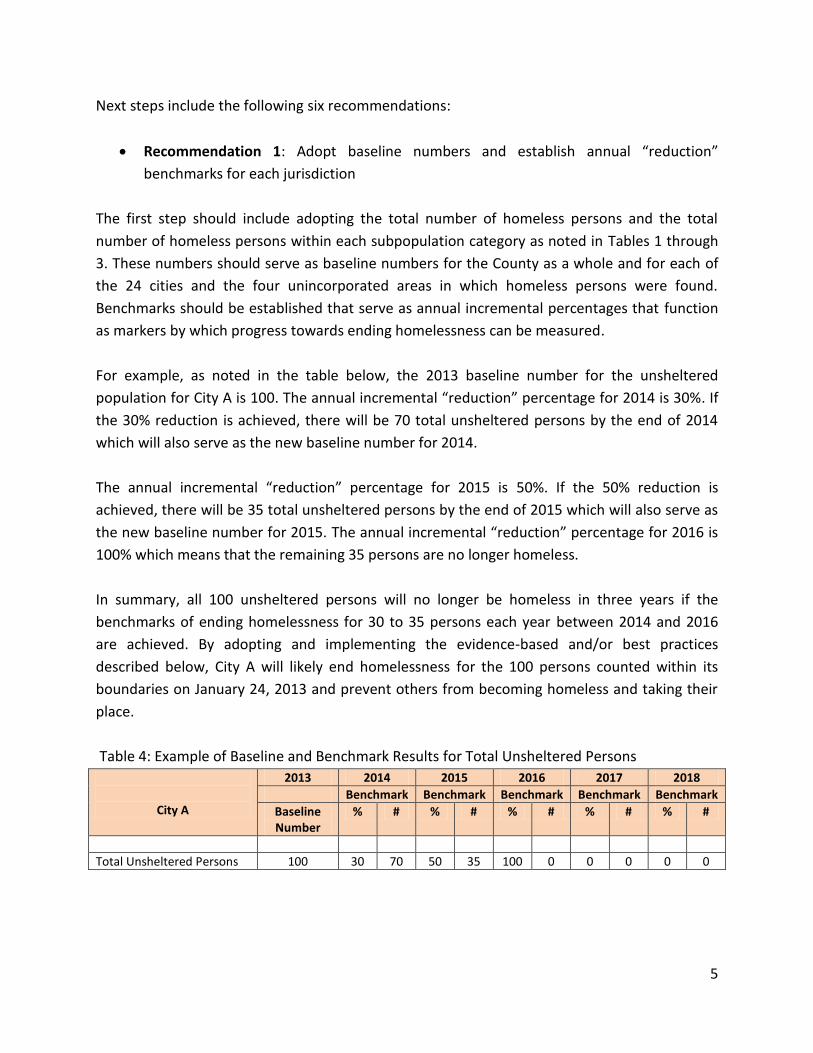
For example, as noted in the table below, the 2013 baseline number for the unsheltered
population for City A is 100. The annual incremental “reduction” percentage for 2014 is 30%. If
the 30% reduction is achieved, there will be 70 total unsheltered persons by the end of 2014
which will also serve as the new baseline number for 2014.
The annual incremental “reduction” percentage for 2015 is 50%. If the 50% reduction is
achieved, there will be 35 total unsheltered persons by the end of 2015 which will also serve as
the new baseline number for 2015. The annual incremental “reduction” percentage for 2016 is
100% which means that the remaining 35 persons are no longer homeless.
In summary, all 100 unsheltered persons will no longer be homeless in three years if the
benchmarks of ending homelessness for 30 to 35 persons each year between 2014 and 2016
are achieved. By adopting and implementing the evidence-based and/or best practices
described below, City A will likely end homelessness for the 100 persons counted within its
boundaries on January 24, 2013 and prevent others from becoming homeless and taking their
place.
Table 4: Example of Baseline and Benchmark Results for Total Unsheltered Persons
City A
2013 2014 2015 2016 2017 2018
Benchmark Benchmark Benchmark Benchmark Benchmark
Baseline Number
% # % # % # % # % #
Total Unsheltered Persons 100 30 70 50 35 100 0 0 0 0 0

6
Table 5 lists the baseline numbers for various subpopulations of unsheltered homeless persons
for City A. Annual incremental “reduction” percentages that serve as benchmarks are also
provided. If these benchmarks are achieved, there will be no homeless persons within three
years for each subpopulation category.
It is important to note that each subpopulation category is not mutually exclusive. A chronic
homeless person can also be a substance abuser, a veteran, and a person recently released
from jail. Thus, ending homelessness for this person will reduce the number of homeless
persons in four of the subpopulation categories below.
It is also important to note that several of the subpopulations consist of a small number of
persons and that homelessness for these persons can end in two years. For example, there are
10 homeless veterans noted below. Half or five of these veterans can exit homelessness during
the first year and the other half during the following year. The evidence-based and best
practices below can help City A achieve “no more homeless veterans” and prevent other
veterans from becoming homeless.
Ending homelessness for larger number of persons within the subpopulation categories below
can be achieved in three years. For example, as noted in the table below, the number of chronic
homeless persons in 2013 can be reduced by half (from 40 persons to 20) during 2014, by half
(20 persons to 10) during 2015, and by 100% (from 10 persons to 0 persons) during 2016.
Again, it is worth nothing that each subpopulation category is not mutually exclusive and that
ending homelessness for one person will reduce the number of homeless persons in one or
more subpopulation categories.
Table 5: Baseline and Benchmarks for Subpopulations
City A
2013 2014 2015 2016 2017 2018
Benchmark Benchmark Benchmark Benchmark Benchmark
Baseline Number
% # % # % # % # % #
Subpopulations:
Chronic Hmls Individuals 40 50 20 50 10 100 0 0 0 0 0
Mentally Ill 25 50 12 50 6 100 0 0 0 0 0
Persons w/HIV/AIDS 1 100 0 0 0 0 0 0 0 0 0
Substance Abusers 25 50 12 50 6 100 0 0 0 0 0
Veterans 10 50 5 100 0 0 0 0 0 0 0
Victims of Domestic Violence 20 50 10 100 0 0 0 0 0 0 0
Youth 18 – 24 10 50 5 100 0 0 0 0 0 0 0
Youth Under Age 18 1 100 0 0 0 0 0 0 0 0 0
Persons Released from Jail* 25 50 12 50 6 100 0 0 0 0 0
*% connotes reduction.
** Persons released from jails or prison during the past 12 months after serving a court-mandated sentence.

7
Recommendations 2 - 6
In order to achieve the annual benchmarks each jurisdiction should share in the
implementation of a county-wide Rapid Re-housing Engagement Team (ET) and Housing First
Engagement Team (ET) as described in the recommendations below. Sharing in the
implementation by public and private organizations may include: 1) revenue in the form of
grants, gifts, and donations; 2) in-kind services such as employment training, health care,
mental health care, and substance abuse treatment; or 3) in-kind donations such as meeting
space, office space, or service space.
In order to achieve the annual benchmarks, each jurisdiction should develop a zero tolerance
policy for children and their families living on the streets or in vehicles. A zero tolerance policy
for all subpopulations of homeless persons should also be adopted and implemented in the
near future.
Recommendation 2: Implement a Rapid Re-housing Approach by creating a Rapid Re-
housing Engagement Team (ET).
Rapid Re-housing has been recognized as an evidence-based and best practice by national
researchers and policymakers based on years of research and implementation. The
implementation of Rapid Re-housing has helped jurisdictions across the country significantly
reduce their homeless population. Rapid re-housing helps families and individuals who are not
chronically homeless obtain permanent housing immediately and to stabilize themselves as
soon as possible. Such households have not been living on the streets for years with physical
disabling conditions such as serious mental illness, substance abuse disorders, and/or chronic
physical illness. They have lived independently in permanent housing in the past and are in
need of temporary assistance for several months instead of years. During this time they are
able to become increasingly self-sufficient through public assistance and/or employment. They
may need long-term non-monetary assistance to prevent the loss of their housing such as free
or low cost clothing, food, health care, household supplies, and transportation.
Creating a Rapid Re-housing Engagement Team involves establishing a new team of full-time
dedicated outreach and engagement workers that would be augmented by existing workers
whose duties also include outreach and engagement.
Recommendation 3: Develop a zero tolerance policy for children living on the streets, in vehicles, and other places not meant for human habitation.

8
A Rapid Re-housing Engagement Team (ET), with the support of various public and private
partners, will put into action a zero tolerance policy for children living on the streets or a place
not meant for human habitation such as vehicles by implementing the Rapid Re-housing
Approach described in Recommendation 2. As noted on page 1, there were 65 children who
were found living on the streets on the day of the homeless count. These children were
members of 36 homeless families of which 20 or 55% were living on the streets or in vehicles in
the City of San Bernardino. Sixteen other families were living on the streets or in vehicles of
other cities—six (three each) in the cities of Rancho Cucamonga and Upland; two in Ontario;
and one each in eight other cities—Barstow, Colton, Fontana, Joshua Tree, Loma Linda,
Redlands, Victorville, and Yucaipa. A Housing First Approach, as outlined in Recommendation 6
below, will be put into action for chronic homeless families. There were six chronic homeless
families counted.1
Recommendation 4: Implement a Housing First Approach by Creating a Housing First
Engagement Team (ET)
Housing First has also been recognized as an evidence-based and best practice by national
researchers and policymakers based on years of research and implementation. The
implementation of a Housing First Approach has helped jurisdictions across the country
significantly reduce their homeless population. Implementation involves moving homeless
persons from the streets and directly into housing and providing wrap-around services to
ensure housing stability. This approach should be linked to the provision of permanent
supportive housing which provides subsidized housing and appropriate supportive services. This
is in contrast to a “housing readiness model” which emphasizes that a homeless individual or
family must address other issues such as substance abuse and mental illness through case
management prior to entering affordable permanent housing. Housing can be provided through
a project-based or scattered site model.
1 Chronically Homeless is defined as an individual who 1) is homeless and lives in a place not meant for human habitation, a safe haven, or in an emergency shelter; 2) has been homeless and living or residing in a place not meant for human habitation, a safe haven, or in an emergency shelter continuously for at least one year or on at least four separate occasions in the last 3 years; 3) can be diagnosed with one or more of the following conditions: substance use disorder, serious mental illness, developmental disability (as defined in section 102 of the Developmental Disabilities Assistance Bill of Rights Act of 2000 (42 U.S.C. 15002)), posttraumatic stress disorder, cognitive impairments resulting from brain injury, or chronic physical illness or disability; 4) has been residing in an institutional care facility, including a jail, substance abuse or mental health treatment facility, hospital, or other similar facility, for fewer than 90 days and met all of the criteria in paragraph (1) of this definition, before entering that facility; or 5) a family with an adult head of household (or if there is no adult in the family, a minor head of household) who meets all of the criteria in paragraph (1) of this definition, including a family whose composition has fluctuated while the head of household has been homeless.
9
Creating a Housing First Engagement Team involves establishing a new team of full-time
dedicated outreach and engagement workers that would be augmented by existing workers
whose duties also include housing first activities.
Recommendation 5: Reduce Chronic Homelessness annually by Creating a Housing First Engagement Team (ET)
A Housing First Engagement Team (ET) will put into action, with the support of various public and private partners, the Housing First Approach described above in order to help jurisdictions meet their annual benchmarks concerning the reduction of chronic homeless individuals and families. As noted in Table 3, there were 439 chronic homeless persons counted. ET will work with local community stakeholders to identify chronic homeless persons in need of the housing first approach. Special attention will be given to the most visible and hardest-to-reach individuals. Engagement with chronically homeless persons will occur once appropriate housing resources have been identified such as shelter plus care certificates for persons with physical and/or mental disabilities, HUD Veterans Affairs Supportive Housing (VASH) Vouchers for veterans, and permanent supportive housing units. This approach moves beyond traditional street “outreach” that focuses on going out onto the streets to find homeless persons in order to establish and build relationships with them in order to refer and/or transport them to social services.
Recommendation 6: Increase the Number of Permanent Supportive Housing Units. Each jurisdiction should consider increasing its number of permanent supportive housing units in order to meet the needs of those homeless persons with disabling conditions who were counted within their neighborhoods. These persons are noted by jurisdiction in Table 3 and include persons with mental illness, substance abuse, and physical disabilities. Jurisdictions with significant numbers of chronic homeless persons, veterans, and persons recently released from correctional institutions after serving a court-mandated sentence should also consider increasing their number of permanent supportive housing units. Increases in units should be based on evidence-based practices to ensure success. Permanent Supportive Housing provides long-term affordable rental housing and a broad range of on-site and/or off-site wrap-around supportive services. The goal is to increase independent living skills of residents who pay no more than 30% of their monthly income for rent so that they are able to maintain their housing. Those persons without permanent disabling conditions may ultimately become self-sufficient while living in affordable housing and may eventually pay 100% of their rent and may or may not need supportive services. Particular attention should be given to persons recently released from correctional institutions since realignment has resulted in thousands of prisoners being released or transferred to county jails. As noted in Table 3, 22% of male and female adults counted answered “yes” when

10
asked if they were released from a correctional institution such as a jail or prison during the past 12 months after serving a court-ordered sentence. When looking at the numbers by gender, one out of four men (25%) answered “yes” to being released from a correctional institution such as a jail or prison during the past 12 months after serving a court-ordered sentence. Permanent supportive housing for ex-offenders should be based on evidence-based practices
for homeless ex-offenders reentering communities that have resulted in better outcomes.
These practices include the provision of housing with appropriate wrap-around services such as
substance abuse counseling and treatment and life coping skills that help ex-offenders
successfully transition into local communities. These practices also include a clear path to
career development and/or employment and reunification with family members including
children.
Better outcomes include reductions in recidivism and recurrence of homelessness. The chances
of recidivism significantly lessen when offenders are reengaged with family members and in
particular with their children. The chances of recidivism also significantly lessen when offenders
develop marketable skills that lead to on-going employment. Employment also encourages
offenders to take the initial steps to reunite with family members. The chances of offenders
becoming homeless again also significantly lessen with on-going employment and efforts to
foster relationships with family members after reunification.
Other Recommendations
The recommendations described above are included in the San Bernardino County 10 Year Plan
to End Homelessness. The other recommendations in the plan should also be considered by
each jurisdiction to help reach its benchmarks.
The recommendation concerning homeless prevention, however, should be adopted by all jurisdictions since San Bernardino County has a sizable number of households that are at-risk of becoming homeless. Approximately 100,000 households were living below poverty level as reported in the 2011 American Community Survey by the U.S. Census Bureau. Despite the fact that many households live below poverty level, no more than 10% of them become homeless over the course of a year according to recent national research.2 However, this means that up 10,000 households living below poverty level may experience homelessness every year.
2 “Strategies for Preventing Homelessness,” U.S. Department of Housing and Urban Development/Office of
Policy Development and Research, May, 2005: p. xii.
11
The local 10-Year Strategy recommends that the short-term assistance delivery model as
outlined by HUD through the Homeless Prevention and Rapid Re-housing Program (HPRP) be
implemented by homeless service providers. This delivery model as outlined by HUD “targeted
households with the highest likelihood of becoming homeless, and programs should provide
just enough assistance to prevent or end an episode of homelessness - stretching resources as
far as possible.” Financial resources for this model should be for rental and utility assistance to
households that are most likely to become homeless if not for this assistance. In other words,
efforts should be made to ensure that these resources are provided to households that are
facing eviction and would become homeless without this help.
II. Background Information
HUD, as part of its requirements for local jurisdictions to continue to receive continuum of care
funding for homeless persons, asks local jurisdictional applicants to conduct a “one day point-
in-time” homeless count every other year during the last 10 days of January. The County of San
Bernardino is one of more than 400 jurisdictions that submit an annual application to HUD for
continuum of care funding. For the last three (3) years, several agencies in the County have
received more than $21 million dollars as applicants.
When was the count conducted?
The homeless count was conducted on the streets during the hours of 6 a.m. and 10 a.m. on
January 24, 2013. The count was also conducted on the same day in shelters and transitional
housing programs throughout the county.
Who was counted?
Per HUD’s instructions, a person was considered homeless, and thus counted, only when he/she fell within the HUD-based definition by residing in one of the places described below:
In places not meant for human habitation, such as cars, parks, sidewalks, and abandoned buildings;
In an emergency shelter; and
In transitional housing for homeless persons. Who was not counted? Per HUD’s instructions, a person was not considered homeless if the person resided in one of the following places noted below

12
Medical facilities, such as hospitals, psychiatric facilities, and nursing homes;
Jails, prisons or juvenile detention facilities;
Chemical dependency facilities, such as substance abuse treatment facilities and detox centers;
Foster care homes or foster care group homes.
Also, per HUD’s instructions, children identified by McKinney-Vento Homeless Coordinators at schools as homeless should not be counted. Children may be counted during the count if they live in an emergency shelter or transitional housing program, or are unsheltered.
Lastly, HUD does not consider the following persons to be homeless—persons who are “doubled up,” or persons who are “near homelessness”—but considers them to be at risk of becoming homeless. Thus, such persons were not included in the homeless count.
The County of San Bernardino, like many other counties, has a substantial number of households that are at risk of becoming homeless. The Census Bureau noted that 16 percent or nearly 100,000 households consisting of about 320,000 residents in San Bernardino County were living below poverty level as reported in the 2011 American Community Survey. Also, according to the U.S. Census Bureau there were approximately 123,000 households consisting of about 400,000 persons (nearly one of every five residents) in San Bernardino County who were members of a household whose annual income was less than $25,000 in 2011. There were approximately 65,000 households consisting of nearly 200,000 persons whose annual income was less than $15,000 a year. Many of these persons can become homeless because of social structural issues such as increases in rent, loss of job, and rising health care costs. In addition, personal experiences such as domestic violence, physical disabilities, mental illness, and substance abuse can cause members of a low income household or an entire household to become homeless. Often, one or more of these experiences factor into a household’s homeless experience.
Who carried out the count?
The homeless count and subpopulation survey was a joint effort between the San Bernardino County Homeless Partnership, the San Bernardino County Office of Homeless Services, and the Institute for Urban Initiatives who recruited over 400 community volunteers to implement the count and subpopulation survey. As noted in the Acknowledgements, there were nearly 30 agencies that contributed staff time and office space for training and deployment of counters and there were 24 law enforcement agencies that provided their time, knowledge, and expertise concerning locations of homeless persons. In addition, there were nearly another 30
Nearly 100,000 households consisting of
about 320,000 residents live below
poverty level in the County according to
the U.S. Census Bureau and are at risk
of homelessness.

13
agencies that helped with the planning process including the San Bernardino County Information Services Department which created maps to guide counters.
The San Bernardino County Homeless Partnership (SBCHP) was formed to provide a more focused approach to issues of homelessness within the County. Its primary purpose is to develop a countywide public and private partnership and to coordinate services and resources to end homelessness in San Bernardino County. The Partnership consists of community and faith-based organizations, educational institutions, non-profit organizations, private industry, and federal, state, and local governments. SBCHP was developed to promote a strong collaboration between agencies to direct the planning, development, and implementation of the County’s 10-year Strategy to end chronic homelessness. The Partnership provides leadership in creating a comprehensive countywide network of service delivery to the homeless and near homeless families and individuals through facilitating better communication, planning, coordination, and cooperation among all entities that provide services and/or resources for the relief of homelessness in San Bernardino County.
The San Bernardino County Office of Homeless Services (OHS) serves as a “clearing house” of
homeless issues for all County departments. Any homeless issue encountered by County staff
can be referred to this office for resolution. OHS staff plays a vital role in the San Bernardino
County Homeless Partnership as the administrative support unit to the organization. OHS
insures that the vision, mission and goals of the Partnership are carried into effect.
The Institute for Urban Initiatives consists of several community-based and faith-based institutes that respond to the economic, housing, and social needs of neighborhoods, cities, and counties from local community, regional, national, international, and faith-based perspectives and has completed over 40 assessments for local government and private organizations throughout Southern California that have focused on affordable housing, business development and education for micro-businesses, fair housing, homelessness (including homeless counts and surveys), migrant farming, and street vending. For more information visit www.urban-initiatives.org.
III. Methodology
Unsheltered Count and Subpopulation Survey
In order to complete the unsheltered count and subpopulation survey, the following activities
were conducted: 1) organizing the count and subpopulation survey; 2) coordinating the count
and subpopulation survey; and 3) implementing the count and subpopulation survey.
14
1. Organizing the Count and Subpopulation Survey
Organizing the count consisted of the following four activities: a) the county was divided into
organizational regions; b) the organizational regions were divided into planning communities; c)
the planning communities were divided into implementation areas; and d) the implementation
areas were divided into count zones.
a. County was Divided into Organizational Regions The County was divided into the following organizational regions:
West Valley which consisted of the area west of the City of San Bernardino including the cities of Chino, Chino Hills, Colton, Fontana, Montclair, Ontario, Rancho Cucamonga, Rialto, Upland and the surrounding unincorporated areas.
East Valley which consisted of the City of San Bernardino and all areas south and east including the cities of Grand Terrace, Highland, Loma Linda, Redlands, Twenty-nine Palms, Yucaipa, Yucca Valley and the surrounding unincorporated communities along with the San Bernardino Mountain communities.
High Desert which consisted of the area north of the San Bernardino Mountains including the cities of Adelanto, Apple Valley, Barstow, Hesperia, Needles, Victorville and the surrounding unincorporated communities.
b. Organizational Regions were Divided into Planning Communities
Each of the three Organizational Regions was divided into 20 planning communities of
incorporated cities and/or unincorporated jurisdictions in order to plan and implement the
activities below. The County consists of 24 incorporated cities and over three dozen
unincorporated communities. However, not all of these cities and counties were included in the
20 planning communities because they were determined by key persons as not having any
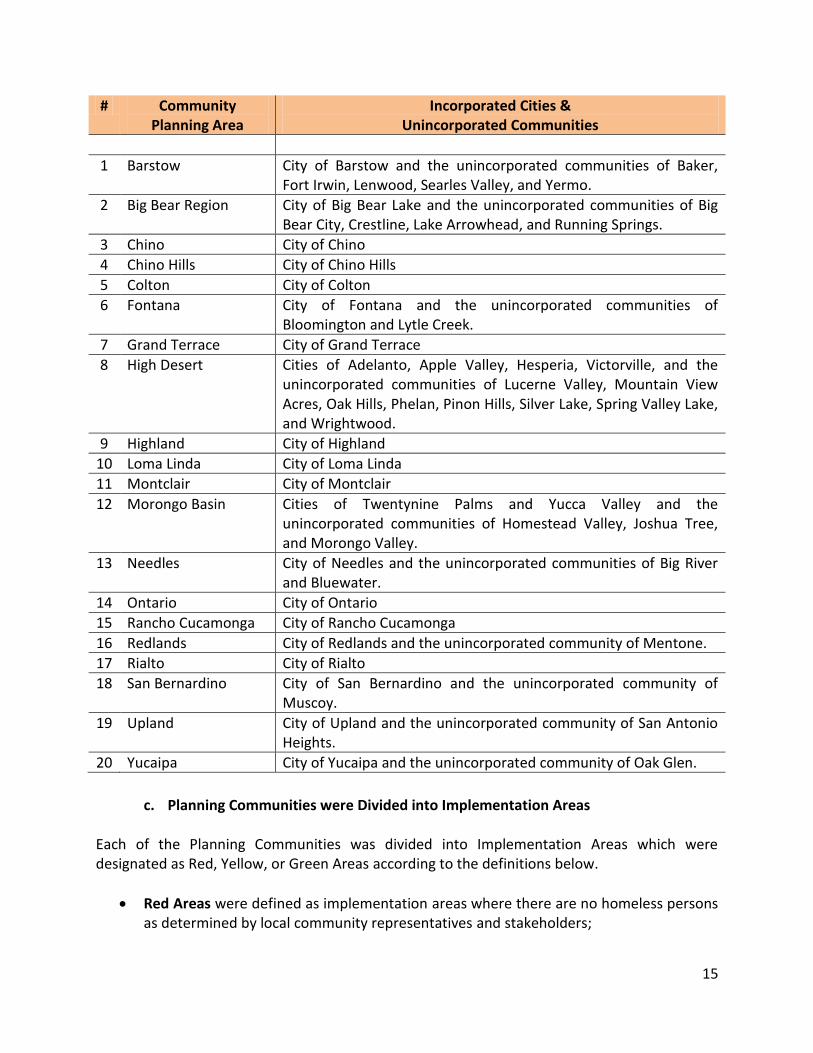
homeless persons who live, congregate, or receive services. The table below lists the
incorporated cities and unincorporated communities within each of the 20 planning
communities.
15
# Community Planning Area
Incorporated Cities & Unincorporated Communities
1 Barstow City of Barstow and the unincorporated communities of Baker, Fort Irwin, Lenwood, Searles Valley, and Yermo.
2 Big Bear Region City of Big Bear Lake and the unincorporated communities of Big Bear City, Crestline, Lake Arrowhead, and Running Springs.
3 Chino City of Chino
4 Chino Hills City of Chino Hills
5 Colton City of Colton
6 Fontana City of Fontana and the unincorporated communities of Bloomington and Lytle Creek.
7 Grand Terrace City of Grand Terrace
8 High Desert Cities of Adelanto, Apple Valley, Hesperia, Victorville, and the unincorporated communities of Lucerne Valley, Mountain View Acres, Oak Hills, Phelan, Pinon Hills, Silver Lake, Spring Valley Lake, and Wrightwood.
9 Highland City of Highland
10 Loma Linda City of Loma Linda
11 Montclair City of Montclair
12 Morongo Basin Cities of Twentynine Palms and Yucca Valley and the unincorporated communities of Homestead Valley, Joshua Tree, and Morongo Valley.
13 Needles City of Needles and the unincorporated communities of Big River and Bluewater.
14 Ontario City of Ontario
15 Rancho Cucamonga City of Rancho Cucamonga
16 Redlands City of Redlands and the unincorporated community of Mentone.
17 Rialto City of Rialto
18 San Bernardino City of San Bernardino and the unincorporated community of Muscoy.
19 Upland City of Upland and the unincorporated community of San Antonio Heights.
20 Yucaipa City of Yucaipa and the unincorporated community of Oak Glen.
c. Planning Communities were Divided into Implementation Areas Each of the Planning Communities was divided into Implementation Areas which were designated as Red, Yellow, or Green Areas according to the definitions below.
Red Areas were defined as implementation areas where there are no homeless persons as determined by local community representatives and stakeholders;

16
The Big Bear Region, which consisted of the City of Big Bear Lake and the unincorporated communities of Big Bear City, Crestline, Lake Arrowhead, and Running Springs, was identified by key persons in the region as a Red Area because of the freezing weather and accumulation of snow during January. In addition, most of the small rural communities spread throughout the desert and mountain regions of the vast county were identified by key persons as Red Areas.
Yellow Areas were defined as implementation areas where it is too difficult and/or unsafe for homeless counters to count and survey homeless persons by community representatives and stakeholders where only professional outreach workers might go. Immediately prior to or immediately after the count, local professional representatives involved in the homeless count such as law enforcement or street outreach workers verified if homeless persons lived in these areas and estimated the number of homeless persons who were included in the count;
The only yellow area that was identified was Lytle Creek because of difficult and unsafe circumstances.
Green Areas were defined as implementation areas where homeless persons can be found as determined by local community representatives.
All of the incorporated cities in the county, with the exception of Big Bear Lake, along with significant areas within their surrounding unincorporated territory, were identified by local key person teams as Green Areas.
d. Implementation Areas were Divided into Count Zones
Implementation Areas that were designated as Green Areas were divided into Count Zones.
Teams of Counters were deployed to designated count zones within each of the Green Areas.
Teams of Counters were not deployed to Yellow or Red Areas.
2. Coordinating the Count and Subpopulation Survey
Coordinating the count and subpopulation survey included implementing the following activities in each local Planning Community: 1) establishing a key person team; 2) distinguishing areas within the planning community where homeless people live; 3) identifying places where homeless people live within the identified areas; 4) identifying places where homeless people receive social services; 5) raising public awareness and community involvement; and Implementing the Count and Subpopulation Survey.

17
a. Establishing a Community Key Person Team A Community Key Person Team was established for each planning community and consisted of
representatives from public and private organizations who were knowledgeable about
homelessness and where homeless persons live. Such key persons included representation
from business, civic, educational, faith-based, law enforcement, local government,
neighborhood, and nonprofit organizations. Homeless and formerly homeless persons were
also encouraged to join.
b. Distinguishing Implementation Areas within the Planning Community
Each Community Key Person Team distinguished implementation areas within their planning community where homeless people could be found. Such areas included a quadrant or section of a city or unincorporated area or an entire neighborhood. Those sections of the planning community where homeless persons could be found were designated as Green Areas. Conversely, those sections where homeless persons are known not to live or spend time were designated Red Areas.
c. Identifying Verifiable Places where Homeless People Live/Congregate Each Community Key Person Team also identified specific locations where homeless people live and/or congregate within their designated Green Areas. Such places included abandoned buildings, commercial areas, parks, sidewalks, vacant lots and vehicles. Known encampments were also specifically identified within Green Areas. Other places included a whole neighborhood or a specific length of a street. Such information remains confidential.
d. Identifying Places where Homeless People Receive Social Services Each Community Key Person Team also identified non-residential locations where homeless people go to receive social services and other forms of assistance. Such programs included locations that distributed packaged food and/or clothing, serve meals, and provide shower or laundry services including those operated by faith-based organizations. Other program sites included those that were known to provide domestic violence, health care, mental health care, substance abuse, transportation, and veteran services for homeless persons.
e. Raising Public Awareness and Community Involvement The primary purpose of raising public awareness and community involvement was to recruit volunteers to help implement the count in each planning community. Volunteers were recruited both locally and countywide from a wide-range of sources including city and county employees, homeless service providers, other social service agencies, non-profit organizations, faith-based institutions, local businesses, civic organizations, educational institutions, currently and formerly homeless individuals and other interested community stakeholders.

18
Flyers and other materials were developed for distribution at community meetings and forums,
media outlets and various public facilities, service locations, churches, college campuses and
other public locations. A project website was established with general project information and
volunteer outreach materials. Volunteer registration was also promoted through the web site
during the months leading up to the day of the count (http://www.sanbernardinocounty
homelesscounts.com).
Community involvement included creating teams of volunteers to count homeless persons in
designated Green zones. Teams included persons who were involved in community service or
interested in community service. Teams also included persons who had considerable exposure
as well as little exposure to homelessness.
3. Implementing the Count and Subpopulation Survey
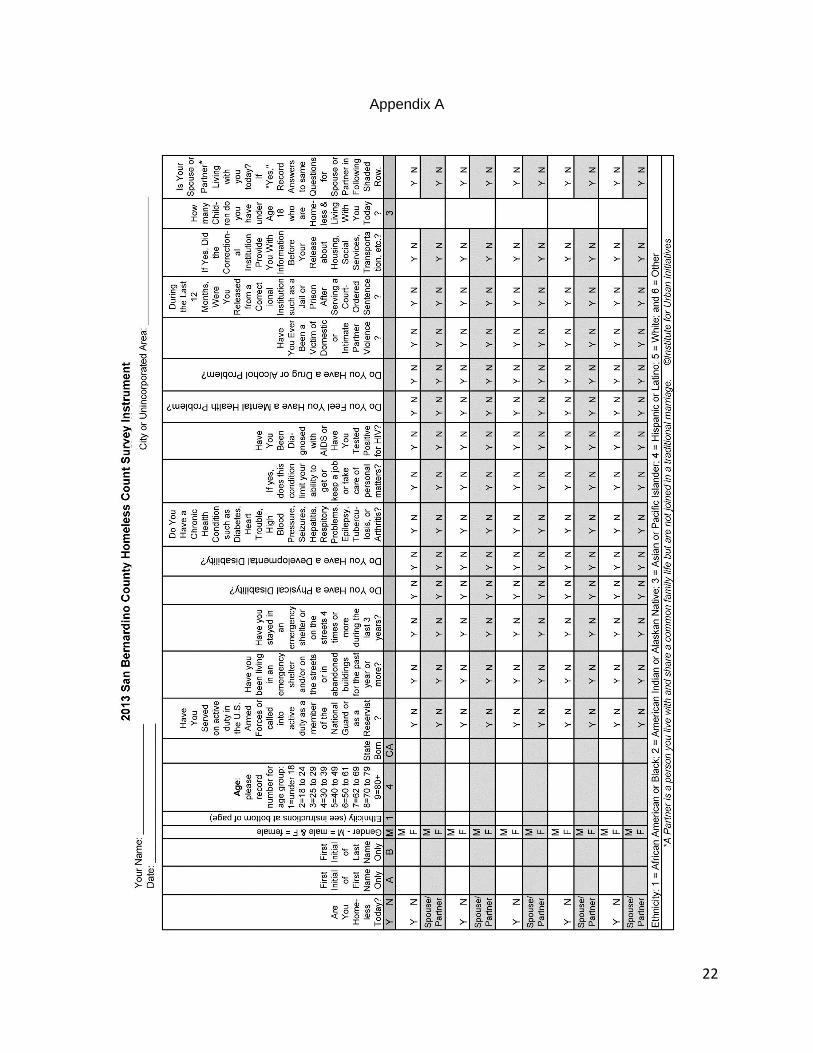
A homeless count and subpopulation survey instrument was used to gather data by counters.
The instrument focused on gathering answers that were used to create an identifier and to
determine the number of persons for each subpopulation required by HUD. All information
gathered through this instrument remains confidential. See Appendix A for a copy of the
instrument.
During the count, volunteers were required to collect the following information concerning
every homeless person counted: first initial of first name, first initial of last name, gender,
ethnicity3, age by code4, and state born. The information for each encounter was inputted into
a data base. The information was used to create an identifier for each person. For example, a
homeless person may have the following code of "WTMW6CA.” This means that this person's
first name began with "W", last name began with "T", he was male "M", he was White "5", in
the age range of 50-61, and born in California.
First Initial
Last Initial
Gender Ethnicity Age Code State Born
W T M 5 6 CA
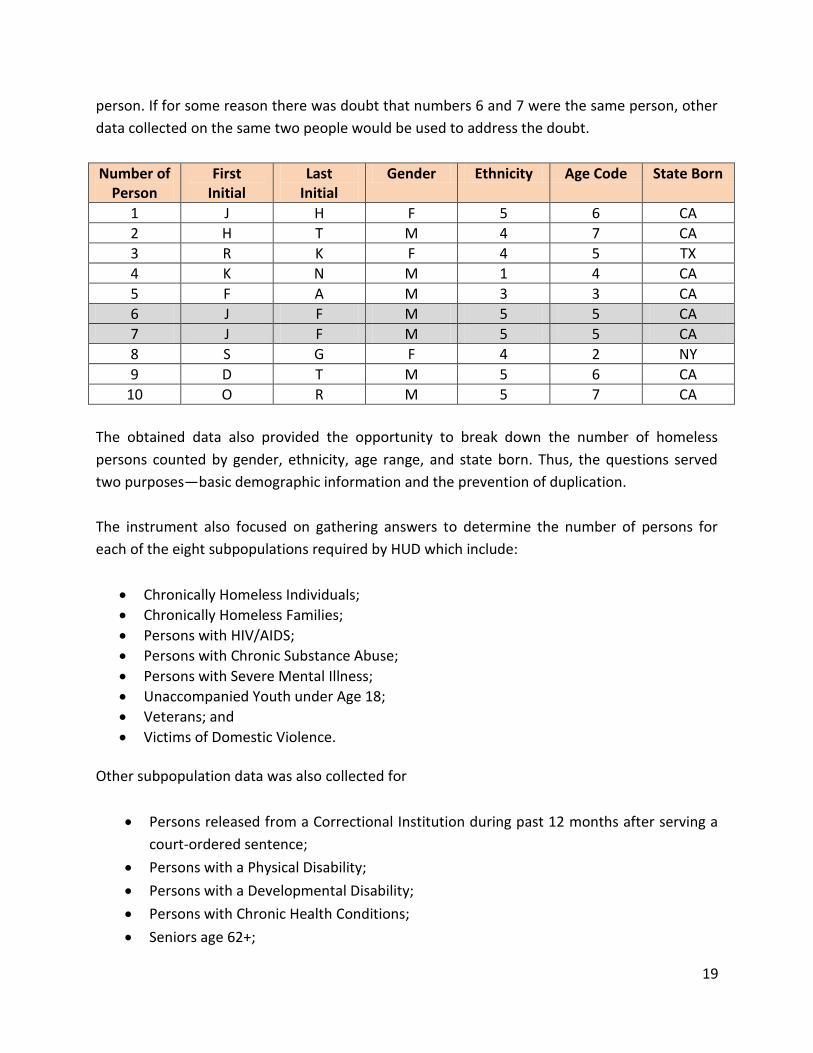
If the same identifier appeared more than once, it was assumed that this was the same person
and the person would only be counted once. An example to illustrate how this process worked
is noted in the table below. Numbers 6 and 7 (shaded in gray) would be considered the same
3 The code for ethnicity was 1=African American or Black; 2=American Indian or Alaskan
Native; 3=Asian or Pacific Islander; 4=Hispanic or Latino; 5=White; and 6=Other. 4 The code for age included: 1=under age 18; 2=18-24; 3=25-29; 4=30-39; 5=40-49;
6=50-61; 7=62-69; 8=70-79; and 9=80+.
19
person. If for some reason there was doubt that numbers 6 and 7 were the same person, other
data collected on the same two people would be used to address the doubt.
Number of Person
First Initial
Last Initial
Gender Ethnicity Age Code State Born
1 J H F 5 6 CA
2 H T M 4 7 CA
3 R K F 4 5 TX
4 K N M 1 4 CA
5 F A M 3 3 CA
6 J F M 5 5 CA
7 J F M 5 5 CA
8 S G F 4 2 NY
9 D T M 5 6 CA
10 O R M 5 7 CA
The obtained data also provided the opportunity to break down the number of homeless
persons counted by gender, ethnicity, age range, and state born. Thus, the questions served
two purposes—basic demographic information and the prevention of duplication.
The instrument also focused on gathering answers to determine the number of persons for
each of the eight subpopulations required by HUD which include:
Chronically Homeless Individuals;
Chronically Homeless Families;
Persons with HIV/AIDS;
Persons with Chronic Substance Abuse;
Persons with Severe Mental Illness;
Unaccompanied Youth under Age 18;
Veterans; and
Victims of Domestic Violence. Other subpopulation data was also collected for
Persons released from a Correctional Institution during past 12 months after serving a
court-ordered sentence;
Persons with a Physical Disability;
Persons with a Developmental Disability;
Persons with Chronic Health Conditions;
Seniors age 62+;
20
Youth Ages 18 to 24.
Sheltered Count and Subpopulation Survey
As required by HUD, the sheltered count included the number of persons and households
sleeping in emergency shelters (including seasonal shelters), transitional housing, and Safe
Haven programs (of which the County has none) that were listed on the Housing Inventory
Chart (HIC). In addition, any persons staying in hotels or motels as a result of receiving a
voucher from a social service agency were included in the sheltered count per HUD’s
instructions if the voucher program was listed on the HIC.
The HIC was submitted by the Office of Homeless Services (OHS) staff to HUD in April 2012.
Prior to the homeless count, the HIC was specifically left undated to include any new programs
or exclude any programs no longer operational by OHS staff and Key Person Task Force
members. A few changes were made to the HIC prior to the count.
HUD encourages the use of Homeless Management Information Services (HMIS) data to
generate sheltered counts and subpopulation data for programs with 100% of beds
participating in HMIS. Thus, HMIS was used to gather the total number of occupied beds and
the number of persons for each subpopulation. A “Data Collection Instrument” was used to
collect the total number of occupied beds and the number of persons for each subpopulation
for non-participating HMIS programs and for HMIS participating agencies that do not have their
HMIS data complete and correct. The same questions used to collect subpopulation data
through HMIS were used for the data collection instrument. Thus, sheltered count data for all
sheltered programs was gathered either through a data collection sheet or HMIS.
IV. One More Crucial Step – Oversight
The San Bernardino County Interagency Council on Homelessness should monitor the activities
on an on-going basis. Monitoring should involve:
1. Ensuring that each jurisdiction receives its baseline numbers which includes the total
number of persons counted within their boundaries and a breakdown by
subpopulations;
2. Making sure that each jurisdiction establishes annual incremental “reduction”
benchmarks that will serve as markers by which progress towards ending homelessness
can be measured over the next five years;

21
3. Making certain that the recommendations in this report are adopted and implemented
by the County and cities which include
Adopting and implementing a zero tolerance policy for the following persons living
on the streets or in vehicles—children and their families; unaccompanied children
under age 18; and seniors age 62+;
Creating a Rapid Re-housing and Housing First Engagement Team(s) to ensure that
jurisdictions can meet their annual benchmarks and implement zero tolerance
policies.
4. Evaluating the progress concerning benchmarks and Rapid Re-housing and Housing First
Engagement Team(s) in order to inform future decision-making for ending
homelessness.
22
Appendix A

23
Appendix B: Subpopulation Data for Unsheltered Population
As noted in this report, there were 1,182 unsheltered adults and 65 children for a total of 1,247
persons counted within the County. The following is a brief summary of the data collected from
the adults concerning subpopulations.
1. Gender
70% of adults (827) were men and 23% (272) were women (responses were not
recorded for 7% of adults);
2. # of Children
5% or 65 of the 1,247 persons counted were children accompanied by an adult(s);
3. # of Families
36 families were counted of which 20 were counted within the City of San
Bernardino;
4. Ethnicity
41% of adults (485) were White; 20% (236) were Hispanic or Latino; 16% (189) were African American or Black; 2% (24) were American Indian/Alaskan Native; 1% (12) were Asian/Pacific Islander; and 2% (24) stated Other (responses were not recorded for 18% of adults);
5. Age
1% or 12 of the persons counted were children under the age of 18 who were not
accompanied by an adult(s); 7% or 83 of the adults were youth between the ages of
18 and 24; and 6% or 71 of the adults were age 62 or older;
6. State Born
49% of adults (579) were born in the State of California;

24
7. Chronic Homeless Individuals
21% of single adults (242) were chronically homeless5;
8. Chronic Homeless Families
There were two (2) chronic homeless families;
9. Mentally Ill
21% of adults (248) had a mental health problem;
10. Persons Homeless 1 Year or More
46% of adults (544) had been living in an emergency shelter and/or on the streets or
in abandoned buildings for the past year or more;
11. Persons Homeless 4 Times or More in 3 Years
34% of adults (402) had stayed in an emergency shelter and/or on the streets at
least 4 times during the past 3 years;
12. Persons Released from Correctional Institutions
21% of adults (248) were released during the past 12 months from a correctional institution such as a prison or jail after serving a court-order sentence—25% of men and 18% of women;
5 According to HUD, the term `chronically homeless’ means, with respect to an individual or
family, that the individual or family—(i) is homeless and lives or resides in a place not
meant for human habitation, a safe haven, or in an emergency shelter; (ii) has been
homeless and living or residing in a place not meant for human habitation, a safe haven, or
in an emergency shelter continuously for at least 1 year or on at least 4 separate occasions
in the last 3 years; and (iii) has an adult head of household (or a minor head of household if
no adult is present in the household) with a diagnosable substance use disorder, serious
mental illness, developmental disability (as defined in section 102 of the Developmental
Disabilities Assistance and Bill of Rights Act of 2000 (42 U.S.C. 15002)), post-traumatic
stress disorder, cognitive impairments resulting from a brain injury, or chronic physical
illness or disability, including the co-occurrence of 2 or more of those conditions.

25
13. Persons with Chronic Health Conditions
29% of adults (343) had a chronic health condition such as diabetes, heart trouble, high blood pressure, seizures, hepatitis, respiratory problems, epilepsy, tuberculosis, or arthritis;
14. Persons with HIV/AIDS
1% of adults (12) had been diagnosed with AIDS or have been tested positive for
HIV;
15. Persons with Developmental Disabilities
12% of adults (142) had a developmental disability;
16. Persons with Physical Disabilities
26% of adults (307) had a physical disability;
17. Substance Abusers
24% of adults (284) had a drug and/or alcohol problem;
18. Veterans
11% of adults served on active duty in the U.S. Armed Forces or Called into Active
Duty as a Member of the National Guard or as a Reservist—15% of men and 2% of
women;
19. Victims of Domestic Violence
17% of adults (201) had been a victim of domestic or intimate partner violence—
37% of women and 12% of men.