acknowledgements - university of hawaii at hilo · web viewprogram user guide rebecca ostertag1...
TRANSCRIPT
Restoring Ecosystem Services Tool (REST) Program User Guide
Rebecca Ostertag1
Donald Rayome2
Susan Cordell2
Peter Vitousek3
Bryson Fung1
Pauleen Pante1
Reuben Tate1
Anthony Vizzone1
July 2016
1University of Hawaii at Hilo, Hilo, HI, USA2Institute of Pacific Islands Forestry, USDA Forest Service, Hilo, HI, USA
3Stanford University, Stanford, CA, USA

Acknowledgements
Data sources for species and functional traits are from available plant databases (please see full references). We are grateful for their permission.
Structure for this user guide originates from Appendix B of the SERDP Final Report "Characterizing and Quantifying Emissions and Transport of Fugitive Dust Emissions Due to Department of Defense Activities" (SERDP Project RC-1729-FR).
Dr. H. Keith Edwards provided coordination and technical assistance for student developers affiliated with this project via the CS 460 Software Engineering I and CS 461 Software Engineering II computer science courses at the University of Hawai‘i at Hilo.
Please contact the lead authors for more information:
1. Rebecca Ostertag: [email protected] 2. Susan Cordell: [email protected] 3. Donald Rayome: [email protected]
1

Table of Contents
AcknowledgementsTable of ContentsAcronyms1.0 Introduction
1.1 Background1.2 Importance of species selection in restoration1.3 The value of a functional traits restoration approach1.4 Importance of functional traits: what to consider
2.0 Liko Nā Pilina as an example of using functional traits3.0 Technical Overview
3.1 Future Directions for REST4.0 REST User Interface
4.1 Restoration Goals4.1.1 Fire Tolerance4.1.2 Drought Tolerance4.2.3 Successional Facilitation4.1.4 Carbon Storage
4.2 Functional Traits in REST4.2.1 Amax4.2.2 Alkaloids4.2.3 Altitude4.2.4 Annual seed production4.2.5 Anthocyanin concentration4.2.6 Bark mass4.2.7 Bark thickness4.2.8 Branch mass4.2.9 Branch N per dry mass4.2.10 Carbon-13 (C13) content4.2.11 Chlorophyll concentration4.2.12 Coarse woody debris C/N ratio4.2.13 Crown height4.2.14 Crown length4.2.15 Crown width4.2.16 DBH at maturity4.2.17 Dispersal period length4.2.18 Dispersal unit length4.2.19 Dispersal unit thickness4.2.20 Dispersal unit width4.2.21 Fern spore length4.2.22 Fern spore mass4.2.23 Fern spore volume4.2.24 Fern spore width4.2.25 Fine root C/N ratio4.2.26 Fine root dry mass per plant
2

4.2.27 Flavonoids4.2.28 Flowering period length4.2.29 Freeze exposure4.2.30 Fruit mass4.2.31 Germination time4.2.32 Heat tolerance4.2.33 Instantaneous water use efficiency4.2.34 Integrated water use efficiency4.2.35 Latex content4.2.36 Latitude4.2.37 Leaf and fine root turnover4.2.38 Leaf area4.2.39 Leaf area ratio4.2.40 Leaf C percentage4.2.41 Leaf C:N4.2.42 Leaf carbon content per area4.2.43 Leaf chlorophyll / leaf area4.2.44 Leaf density4.2.45 Leaf dry mass4.2.46 Leaf dry matter content (LDMC)4.2.47 Leaf epidermis cell area4.2.48 Leaf epidermis cell length4.2.49 Leaf epidermis volume / leaf volume4.2.50 Leaf hypodermis volume / leaf volume4.2.51 Leaf intercellular / leaf volume4.2.52 Leaf intercellular CO2 concentration4.2.53 Leaf lamina length4.2.54 Leaf length4.2.55 Leaf lifespan4.2.56 Leaf light absorption4.2.57 Leaf mesophyll cell area4.2.58 Leaf Mg content per dry mass4.2.59 Leaf N area4.2.60 Leaf N content / leaf area4.2.61 Leaf N content / dry leaf mass4.2.62 Leaf N percentage4.2.63 Leaf P percentage4.2.64 Leaf pH4.2.65 Leaf photosynthesis rate / leaf area4.2.66 Leaf thickness4.2.67 Leaf timing4.2.68 Leaf water content4.2.69 Leaf weight ratio (LWR)4.2.70 Leaf width4.2.71 Leaf / sapwood area ratio4.2.72 Litter C/N ratio
3

4.2.73 Litter decomposition rate4.2.74 Modulus of elasticity4.2.75 N fixation4.2.76 Nitrogen-15 (N15) content4.2.77 Petiole length4.2.78 Phenols4.2.79 Plant annual growth rate4.2.80 Plant height at maturity4.2.81 Plant lifespan (average longevity)4.2.82 Post-fire seed emergence4.2.83 Post-fire seed survival4.2.84 QE
4.2.85 Re-sprouting ability clipping4.2.86 Re-sprouting ability fire4.2.87 Relative growth rate4.2.88 Resin4.2.89 Root / shoot ratio4.2.90 Rooting depth4.2.91 Saponins4.2.92 Seed dispersal distance4.2.93 Seed length4.2.94 Seed longevity4.2.95 Seed mass4.2.96 Seed number4.2.97 Seed number per inflorescence4.2.98 Seed terminal velocity4.2.99 Seed thickness4.2.100 Seed bank density4.2.101 Specific leaf area4.2.102 Stem conduit diameter4.2.103 Stem cross-sectional area4.2.104 Stem diameter4.2.105 Stem length4.2.106 Stem respiration rate (stem volume)4.2.107 Stem respiration rate (surface area)4.2.108 Stem volume4.2.109 Stomata conductance per leaf area4.2.110 Stomata density4.2.111 Tannins4.2.112 Tensile strength of wood4.2.113 Terpenes 4.2.114 Time to maturity4.2.115 Time to reproduction4.2.116 Weed risk assessment score4.2.117 Wood density / specific gravity
5.0 References
4
Acronyms
Amax Maximal assimilationC CarbonDBH Diameter at breast heightGUI Graphical user interfaceLAR Leaf area ratioLDMC Leaf dry matter contentLMA Leaf mass per areaLWR Leaf weight ratioKMR Keaukaha Military ReserveN NitrogenPCA Principal Components AnalysisPCA # Principal Component Axis #P PhosphorusQE Quantum efficiencyREST Restoring Ecosystem Services ToolUHH University of Hawaii at HiloUSDAFS United States Department of Agriculture Forest Service
5
1.0 Introduction
The development of the Restoring Ecosystem Services Tool (REST) is a culmination of the SERDP project RC-2117, “Liko Nā Pilina: Developing Novel Ecosystems that Enhance Carbon Storage, Native Biodiversity, and Human Mobility in Lowland Hawaiian Forests”. The project develops and evaluates a set of what we call “hybrid ecosystems,” in which a mix of native and non-native species maintains valuable forest structure and ecosystem services. We have used community assembly rules and species-level information to design four experimental combinations of species. The Hawaiian name, Liko Nā Pilina, reflects the growing relationships that are developing in these new mixtures (Ostertag et al. 2015). We developed this approach because in our site invasion is so pervasive that often we cannot go back to all-native ecosystems on anything but the smallest scale, either economically or practically, and some non-native species may be playing important roles in the community in terms of providing ecosystem goods and services. The particular management goals of this experiment are to develop hybrid ecosystems that:
1. are resistant to invasion so that the hybrid ecosystems can maintain themselves with relatively little labor input;
2. are capable of sequestering substantial amounts of carbon; 3. sustain a broad range of native biological diversity; and4. remain open enough at ground level to allow human movement through them.
While the Liko Nā Pilina project has specific restoration goals, the general approach of designing ecosystems with a set of species chosen to embody certain properties and functions is much broader. The REST tool described here is designed to help users with species choice in restoration. The tool does not give specific answers, but rather is meant to guide users who approach a restoration problem with specific restoration objectives and species in mind. The tool requires that the user identify a set of candidate species. Data on those species’ functional traits are required; these data may be in the program if available from global databases (e.g., Jepson Flora Project 2006, Kattge et al. 2011, Paula & Pausas 2013, USDA NCRS 2016) or can be included by the user. The program provides a multivariate analysis of the species’ data, providing the user with a handy visual of the relationships of the species to each other. This visual − a diagram of species in trait space − can then help the user chose species based on the user’s needs. REST will not make any decisions, as those are left up to the user, but can be reset with different combinations of species to serve as an iterative tool that aids in decision making.
1.1 Background
At present, for any given parcel of land, developing a restoration strategy involves “best guesses.” Under situations where managers would like to practice an active form of restoration by planting or encouraging specific species (Holl and Aide 2011), it is often the case that there is limited information about species ecology, genetics, physiology, and evolutionary biology (Jones 2013). Choosing plant species for restoration can be a difficult task because it is not always clear which species are the most appropriate to achieve a particular restoration goal. A multivariate approach that allows users to identify a range of species likely to help them meet restoration objectives is one potential solution. Appropriate species chosen based on their life history
6

characteristics can then be combined in a simulated community to see how these species are related to each other in their characteristics. Because the metrics used are based on site-specific restoration objectives, this approach is generalizable, flexible, and transferable across ecosystems. This strategy for species selection is generalizable and flexible, allowing the user to choose species appropriate for desired functional outcomes, while acknowledging limiting factors such as economics (e.g., cost of seed/plants, labor, time), logistics (e.g., availability of species, project or budget timelines), predictability of climate, or disturbance regimes as well as the goals and expectations of stakeholders.
1.2 Importance of species selection in restoration
One major stumbling block in designing restoration plans is deciding on which species to use. The motivation for this approach to species choice comes from the desire to merge practical and ecological restoration techniques, as well as the recognition that species choice for restoration can be a difficult and value-laden process. There are practical concerns such as cost, availability of seeds, and ability to propagate that can partially dictate decisions. Yet in many cases, little is known about each species’ life history and how each will interact with other species when planted together, particularly if the planting might represent new combinations that are not seen in the field. Situations where species are thrust together that do not share an evolutionary history provide relevant examples. These new combinations could arise because of non-native species invasion, range shifts of species due to climate change, or new species distributions due to land use activities. Although “novel ecosystems” (Hobbs et al. 2006) are becoming widespread, there is a very limiting understanding in the ecological literature about the long-term implications of new species interactions and their effects on ecosystem functioning.
1.3 The value of a functional traits restoration approach
The characteristics (or functional trait values) of a species reflect its life history − the establishment, growth, reproduction, and survival of a species. These functional trait values relate to a species’ distribution in the wild, its competitive interactions with other species, and its use of biotic and abiotic resources (Reich et al. 2014). Furthermore, species also influence the environment via their functional traits (Reich et al. 2014); for example, the amount of nitrogen a species inputs to the soil via its leaf litterfall can be predicted from its leaf lifespan and its nutrient-use efficiency. Thus, functional traits reflect the compromises or tradeoffs a species faces at ecological and evolutionary time scales.
Because functional traits vary among species and environments in predictable ways, they can be linked to ecosystem properties – and thus be used in restoration to achieve specific objectives in ecosystem functioning (Funk et al. 2008). For example, the growth and recruitment of species with certain functional traits could be selected for by choosing species that facilitate plant and animal recruitment. If the objective is to build a community that will be less likely to burn, one could choose species with traits such as high leaf water content and low levels of volatile compounds.
While most studies attempting to link traits to ecosystem properties have been carried out in relatively simple systems, the field can be expanded to incorporate increasingly complex systems
7

with higher diversity of species and life forms. A functional trait approach should be general enough to work across all ecosystems. The REST program allows the user to design new simulated communities to make some assessments about which combinations of species may be best for specific restoration goals. While the REST program has some data incorporated into it, it allows for users to enter their own species list and trait data. Thus, it is adaptable to any scenario a user wishes to portray.
This strategy for species selection is generalizable and flexible, allowing the user to choose the species and the desired functional outcomes, while acknowledging limiting factors such as economics (e.g., cost of seed/plants, labor, time), logistics (e.g., availability of species, project or budget timelines), predictability of climate or disturbance regimes, as well as the goals and expectations of stakeholders. The choice of species for restoration objectives is not limited to the scores from their traits alone, but could also incorporate other aspects, such as maintaining a diverse and resilient community which fosters the desired environmental outcomes. REST can be used iteratively; for example, it can be reset and run again after removing species to continually refine choices.
1.4 Importance of functional traits: what to consider
Another difficult question is the choice of traits. In general terms, there are some key traits that the literature suggests are central to understanding a species’ life history. These are traits related to resource acquisition (foliar N), reproductive investment (seed mass), resource allocation patterns (specific leaf area, wood density/specific gravity, leaf life span) or dispersal (maximum plant height, seed mass) (Drenovsky and James 2010, Thomson et al. 2011, Douma et al. 2012, Sonnier et al. 2012, Fry et al. 2013). These six traits appear to be consistently applied in global analyses (Adler et al. 2014, van Bodegom et al. 2014, Kunstler et al. 2016). If you have no prior knowledge we would suggest that examining some or all of these six traits would be a good starting point.
In part, the restoration goals determine the traits that should be of interest to consider for a particular restoration project. For example, if the aim is to build an ecosystem that has low flammability so that it is tolerant of fires, traits such as bark thickness and leaf water content may be interest. When you chose a restoration goal in the REST program, it will populate with a list of suggested functional traits that might be linked to your restoration needs. In REST, we have compiled publicly available global databases that contain trait data for a variety of the world’s species. However, there are many species with limited trait data and many species not in the program. For this reason, REST allows the user to import data on species and traits as a .csv file.
Another important consideration is whether traits are continuous variables or categorical variables. Examples of categorical variables might be dispersal type (wind, water, animal, gravity) or leaf venation. REST focuses on continuous variables because it uses a statistical technique, principal components analysis (PCA) that requires quantitative data. However, categorical variables could be added by the user by coding each category with a number. For example, if you wanted to include dispersal type, a file could be inputted with the dispersal type coded so that wind = 1, water = 2, animal = 3, and gravity = 4. In that case, the user would need to import data as a .csv file. Some important categorical variables include carbon pathway,
8

growth habit, reproductive life history, shade tolerance, nitrogen-fixation capacity, and vegetative spread.
2.0 Liko Nā Pilina as an example of using functional traits
The Liko Nā Pilina project was used as an example to develop the underlying concepts and ideas that have gone into REST. It is a restoration experiment that is testing the long-term consequences of four different species mixtures in terms of increasing carbon storage, native biodiversity, and resisting invasive by undesired invasive species. Details on the functional trait approach used by the Liko Nā Pilina project can be found in Ostertag et al. (2015) and are briefly summarized here.
The Liko Nā Pilina experiment is in a lowland wet forest in Hilo, Hawai‘i. Research performed over the last decade in this ecosystem has shown that simply removing the highly invasive species (passive restoration) is not an effective restoration strategy. While removing the existing invasive species led to some increased native seedling regeneration, it had no effect on the growth of the native adult trees and led to a new invasive species composition (Cordell et al. 2009, Ostertag et al. 2009). The overall goal of the Liko Nā Pilina experiment was not to restore the site to an all native system, but to use functional trait theory to test how different mixtures of native and non-native but non-invasive species (i.e., hybrid ecosystems) differ in successional processes and ecosystem functioning. The trait-based method we used employs five steps:
Step 1. Articulate objectives and constraints
Because restoring this area to an all-native ecosystem is no longer economically feasible, we elected to create hybrid ecosystems. The long-term restoration objectives of the experiment are to increase carbon (C) storage, enhance native seedling regeneration, and provide invasion resistance.
Step 2. Select appropriate functional traits
We selected a set of traits related to successional facilitation and carbon storage (Table 1 from Ostertag et al. (2015). Two variables are categorical (stature and canopy architecture) and were given ordinal numbers as a code.
Step 3. Determine pool of species for trait sampling and restoration potential
We used 29 species as the species pool. From that list we aimed to use REST to condense to a smaller list. These species were chosen because they were known to persist in the lowland wet forest environment and were generally not considered invasive. Users must define their species pool based on contextually-unique objectives.
9

Table 1. List of functional traits measured in the candidate species for the Liko Nā Pilina experiment.
Functional Trait Biological Significance
Trait Range Source of Data
Leaf-to-petiole ratio Light acquisition, self-shading
2.81 - 200.00 Measured
Leaf thickness (mm) Resource acquisition, longevity, resource use
0.17 - 1.40 Measured
Leaf mass per area (g/m2) Photosynthesis, resource availability, longevity
8.24 - 469.22 Measured
Leaf N Percentage (%) Concentration of RuBisCO, photosynthesis, fast to slow strategies
0.55 - 2.25 Measured
Leaf C Percentage (%) Leaf construction, resource use
32.62 - 49.63 Measured
Leaf C:N Leaf longevity, fast to slow strategies
14.82 - 79.78 Measured
Leaf P (%) Leaf quality trace - 0.30 MeasuredWood density/Specific gravity (g/cm3)
Diameter growth rate, mortality rate, hydraulic capacity, carbon storage
0.16 - 1.51 Measured
Instantaneous water-use efficiency
Water use efficiency, resource use and acquisition
42.26 - 154.16 Calculated
Plant height at maturity (m)
Competitive vigor, plant fecundity, light acquisition
5-30 Bibliographic
Seed mass (g) Dispersal, longevity, survival
<0.01 - 2.50 Bibliographic
Leaf area (cm2) Photosynthetic capacity, resource allocation
2.8 - >1000 Measured
Leaf water content (%) Resource use and allocation, fast-slow strategies
2.59 - 85.9 Measured
Staturea Dispersal, longevity, carbon storage
1-3 Observation
Canopy architectureb Light interception, stability
1-3 Observation
avertical position in the forest (1 = understory, 2 = mid-story, 3 = overstory)bclustering of branches relative to the canopy (1 = bottom, 2 = middle, 3 = top)
10
Step 4. Collection and preparation of trait-data
We sampled plant traits across the full range of conditions in which Hawaiian lowland wet forest is found regionally in order to account for both site and environmental heterogeneity. In total, we sampled traits at 25 sites throughout east Hawai‘i Island in addition to using existing data from the literature. By far the most time- and effort-consuming steps in making species choices via trait use involve creating the potential species pool and collecting trait data. However, some shortcuts can be taken for managers that do not have the resources to collect original data. REST contains some global trait databases while other data can be sought out through the literature. There are also a variety of resources that provide background on data collection methods. The PrometheusWiki (http://prometheuswiki.publish.csiro.au/tiki-custom_home.php) provides protocols in ecological and environmental plant physiology and is updated by the research community. Another useful reference is the work of Cornelissen and colleagues (2003, http://cef-cfr.ca/uploads/Membres/CornelissenProtocol.pdf), which provides standards for functional trait measurements.
Step 5. Data analysis and final species choice
Data were uploaded into REST as a .csv file, with the main output is below. A total of 29 species and 15 traits were used in this example. The output below is a principal components analysis. Each species is a point in “trait space.” Points closer together are more similar. Points are evaluated for their closeness in two directions:
1. Horizontally along the x axis (Principal Component Axis 1; PCA 1)2. Vertically along the y axis (PCA 2)
For example, species 7 and species 10 are very similar to each other along PCA 1 but not along PCA 2. In the subsequent output, you can determine that PCA 1 is the most correlated with the traits Leaf C:N Area (0.388) and LMA (0.357). Thus species 7 and species 10 are very similar in those traits. Positive values indicate that a trait increases its value as that axis increases value, while negative values indicate an inverse relationship. For example, as you move to the right along PCA 1, Leaf N Percentage values decrease (-0.339), so that species 7 and 10 would have lower leaf N concentrations than species 1 or 13. When examining along PCA 2, it is noted that PCA 2 is positively correlated with Wood Density yet negatively with Leaf Area. Thus, species 7 and species 10 are quite different in those two traits, a factor of their growth habits − species 7 is a tree fern and species 10 is a slow-growing canopy tree.
11
12
Another important output to consider is the eigenvalues and variation explained by examining the data along these two dimensions. An eigenvalue reflects the amount of variance in the data in a given axis direction (Keogh and Quinn 2002). For using REST, understanding the percent of variation explained is sufficient. The output below shows that the first axis PCA 1 explains about 36% of the variation in the data. Adding the second axis PCA 2 explains another 17%, for a total of about 53% of the variation explained. It is unlikely that principal components analysis will ever explain all of the variation in two axes, particularly if there are many traits. In addition, many of the traits examined may be correlated with each other. However, this information can guide us to see how confident we feel about the species characterizations. In this example, we can feel like the graph shows us a reasonable idea of how the species are related to each other.
Based on the graph we made some decisions to eliminate some species:
Species 6 and species 7 are both tree ferns. As they are closer together on the PCA, we decided to include only one of them, with species 6 was more available from growers.
Species 4 is similar to species 28. However, species 4 presents propagation challenges, guiding selection toward species 28.
We used a similar logic with species 14 and species 19 − we eliminated species 19 because it does not regenerate on its own.
Species 15 was similar to species 13. On site, species 13 would be placed at the lowest elevation of its range, potentially affecting survivorship potential. Thus, we eliminated species 13 in favor of species 15.
Species 26 and species 29 were also similar. We eliminated species 29 as it is less common in the lowland wet forest environment than species 26.
We also decided to eliminate the canopy trees already existing on site (species 10, 12, and 22).
REST can then be re-run without these species to check species relationships or to make further decisions. Note that the graph looks different than the first run. REST is best used as an iterative tool to try different combinations of species. Limiting factors that practitioners should consider include economics (e.g., cost of seed/plants, labor or time), logistics (e.g., availability of species, project or budget timelines), resilience to climatic change or disturbance regimes, as well as the goals and expectations of stakeholders.
13

The process allows for an unbiased way to let the data dictate a first step, and then the practical concerns of practitioners can be layered onto the final species choices.
14

3.0 Technical Overview
REST was constructed using Microsoft’s Visual Studio 2015 Windows Forms platform. The main program is comprised of three parts: Graphical User Interface (GUI), Database, and Analysis. The GUI was created exclusively with tools found in the Windows Forms resources. The database itself is hosted on a private website implemented using PHPmyAdmin, updated periodically as new data becomes available. The analysis portion includes all algorithms and functions hidden from the user. Principal component analysis (PCA) output graphs are generated using the Accord.Net open source framework. At this time, REST is optimized for Windows-based operating systems only (other platforms may be available in the future).
3.1 Future Directions for REST
REST is an evolving program with many directions for future development. Our database contains several thousand entries ranging from rare endemics to more cosmopolitan species. More species, functional traits, and restoration goals are currently being drawn from regionally-exclusive species traits lists, a comprehensive literature review, new data generated by Liko Nā Pilina and other projects, and information provided by managers familiar with REST. In any additional support that we receive, effort will be put into expanding the data entered into REST. At present, the program and its supporting materials are available by contacting the lead authors, but plans are underway for full migration to Rebecca Ostertag's University of Hawaii faculty website (<http://hilo.hawaii.edu/uhh/faculty/ostertag/>).
15

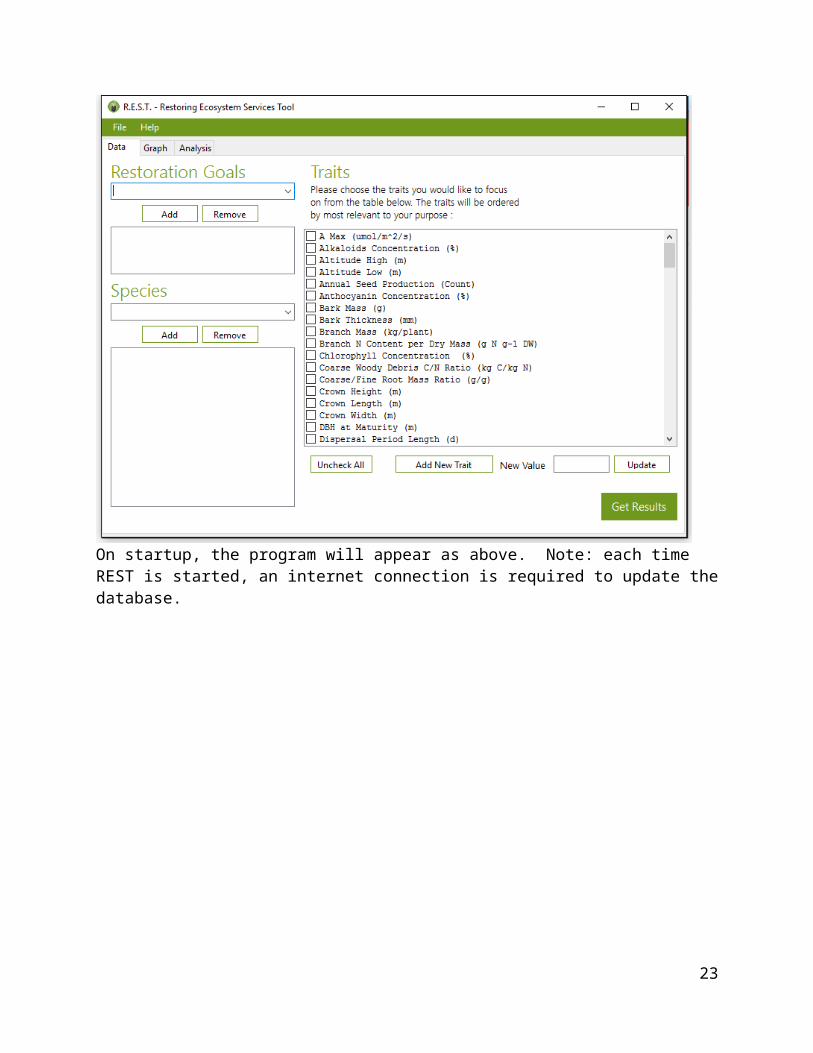
4.0 REST User Interface
When the user selects a restoration goal, a list of suggested functional traits populates in the Traits box. The user should select only the traits of interest and for which there are data. Users can tell if data are currently available by selecting a species. If trait data are available, a number will appear to the right of the trait. If there is no value, then there is no data stored within REST. Users can add data by inputting a number in the "New Value" box and clicking Update. Alternatively, users can add external .csv files with species names and associated trait data.
Installation
To install REST, double-click the newest version of “RESTInstaller” and follow the instructions found in the installation wizard. The program will then install itself as well as create a desktop shortcut to allow easy access.
Program on Startup
On startup, the program will appear as above. Note: each time REST is started, an internet connection is required to update the database.

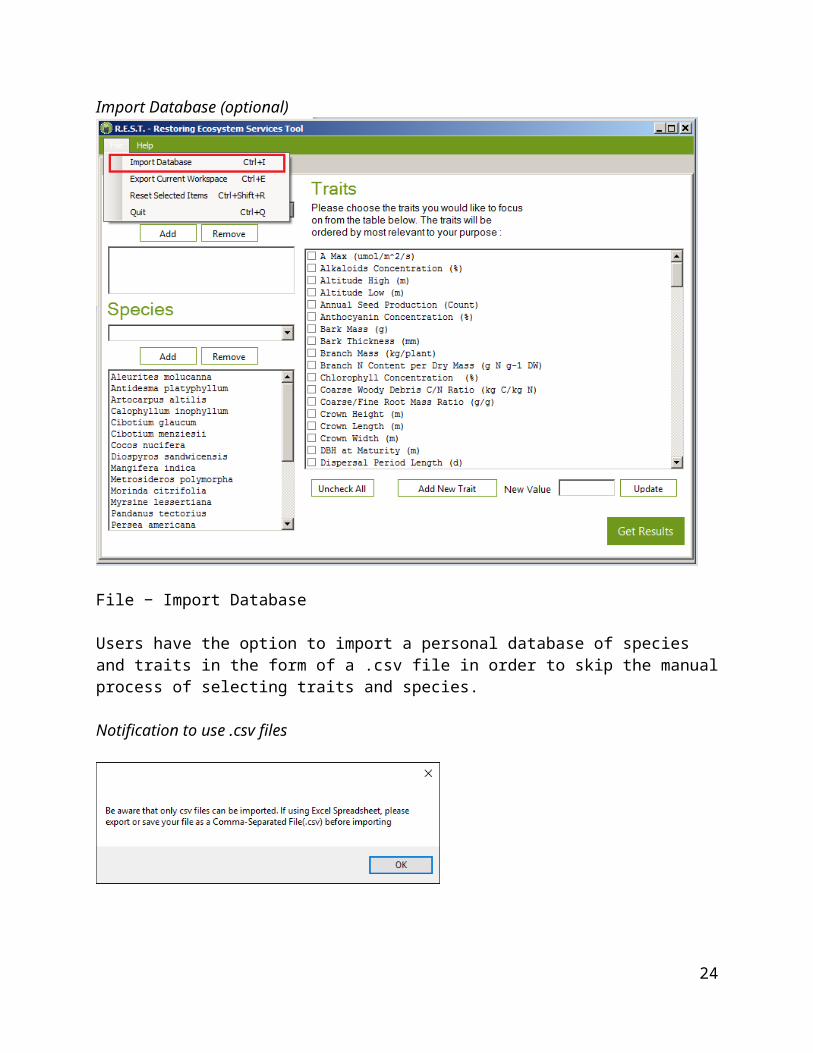
Import Database (optional)
File − Import Database
Users have the option to import a personal database of species and traits in the form of a .csv file in order to skip the manual process of selecting traits and species.
Notification to use .csv files
After selecting the “import database” option, the window above will appear. This window’s purpose is to warn the user that only .csv files will be accepted. Select .csv file and click “Open".
17

After acknowledging the previous warning, a new window will appear and you will be able to browse their personal files for any .csv files you wish to import. All .csv files can be imported, but if not formatted correctly, the program will notify you that an error has occurred and your .csv file will only be read partially.
Format of .csv file
The format should be species in the first column followed by traits. The units of each trait should be added to the trait name. Species and traits will appear in the program exactly as typed. (Note: if a species or trait is already in the database but spelled differently it will appear as a new trait or species.)
18
Export Workspace (optional)
File − Export Current Workspace
Users have the option to export a personal database of species and traits to access their results in the future. Similar to importing data, exported data takes the form of a .csv file. This same exported file can be used outside of REST as well as imported again for future use, increasing the versatility of result data.

Restoration Goals
Choose a restoration goal and click “Add”. This will display traits that only pertain to the chosen restoration goal(s).
20

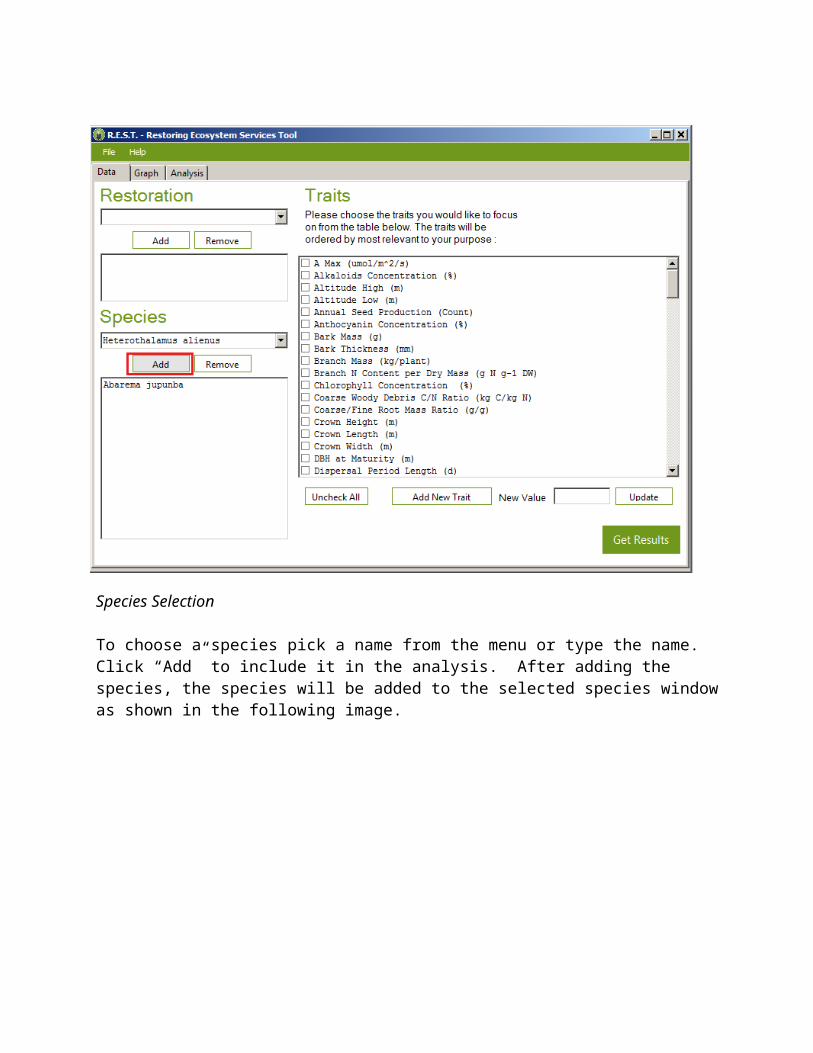
Species Selection
To choose a species pick a name from the menu or type the name. Click “Add” to include it in the analysis. After adding the species, the species will be added to the selected species window as shown in the following image.

Trait Selection
To choose a trait, click on the species and double click on the check box. If a species has data for a trait, a value will be visible to the right of the trait name. (Note: If there is no value, then there is no current data in the program for that species. REST will not complete a PCA unless all species have values for all selected traits.)
Edit Values
Click on a species to view its values. To edit a trait value click on the trait once, enter the value and click update. This will change the trait value of the currently selected species. (Note: the units should be consistent for that trait in the trait list.)
23
View Graph
When you are finished selecting your combination of traits and species, click the “Get Results” button. The graph tab will automatically open when the “Get Results” button is clicked and the results of a principal component analysis will be generated. Please note that REST will not complete a PCA if trait values are incomplete or do not align. A pop-up window will describe the changes necessary to complete the PCA.
For the PCA graph, the x-axis corresponds to values of the first principal component and the y-axis corresponds to values of the second principal component. Each of the points on the plot corresponds to a species, creating a visual representation of the relationship between two species; two species are similar if they are close to each other in the plot. To identify which point corresponds to which species, look at the number found next to the point and cross-reference that number to the legend located to the right of the graph. Numeric data associated with the PCA graph is also included, with each column corresponding to a principal component. Each principal component is a linear combination of other traits, with n representing the number of traits used in the analysis. The first n rows correspond to the coefficients of those traits in the linear combination. The last three rows displays the eigenvalues, the percentage of the variance captured, and associated cumulative percentage, respectively.

4.1 Restoration Goals
REST currently has four restoration goals built into the program:
1. Fire Tolerance2. Drought Tolerance3. Successional Facilitation4. Carbon Storage
4.1.1 Fire Tolerance
Fire is a threat to many ecosystems especially with greater human development. Alternatively, fire may be a natural part of other ecosystems. Traits related to flammability are included here.
4.1.2 Drought Tolerance
Drought and water use by plants are important concerns. Traits relating to water storage and water use are included in the list.
4.1.3 Successional Facilitation
One goal of restoration may be to help a system mature to another state where there is greater animal use and later successional plant species. Traits related to growth, reproduction, and dispersal are included here. For more information, please see Pugnaire & Valladares (1999).
4.1.4 Carbon Storage
One restoration goal may be to maximize carbon storage across the landscape. Traits that are associated with growth and nutrient cycling are included here.
4.2 Functional Traits in REST
The following includes a list of functional traits used in REST and their units along with brief definitions, useful information for measurement, connections to restoration goals, and references for additional information where appropriate.
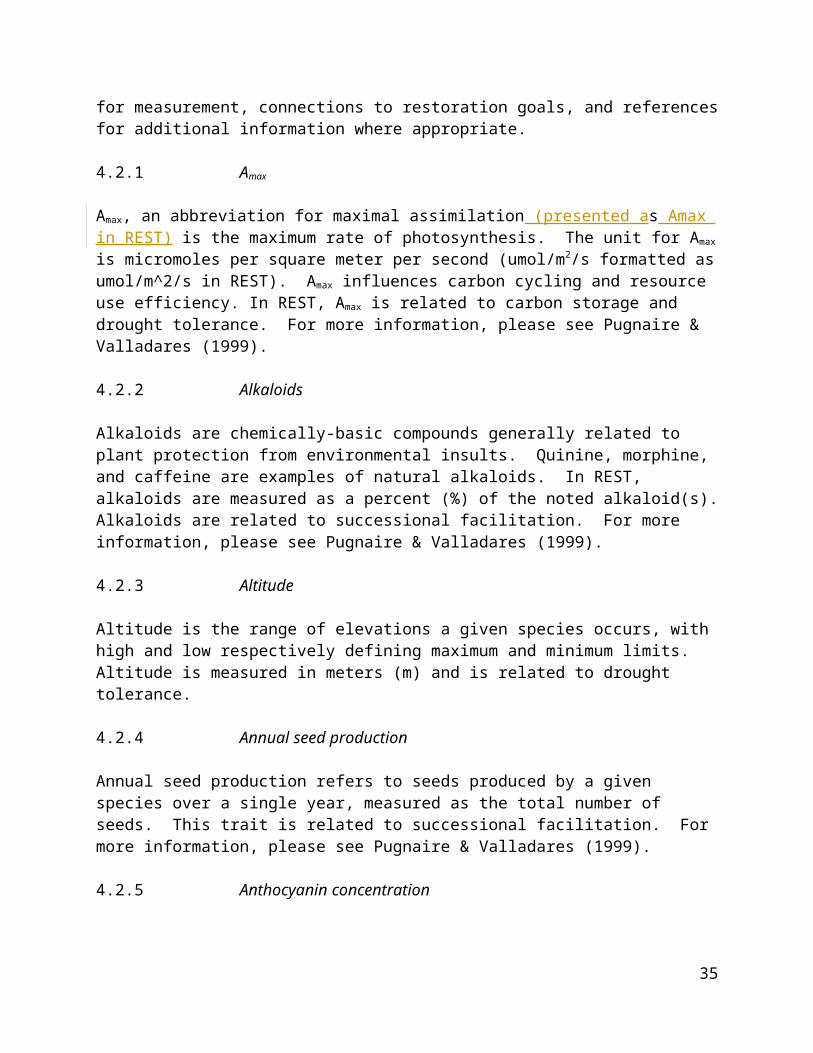
4.2.1 Amax
Amax, an abbreviation for maximal assimilation (presented as Amax in REST) is the maximum rate of photosynthesis. The unit for Amax is micromoles per square meter per second (umol/m2/s formatted as umol/m^2/s in REST). Amax influences carbon cycling and resource use efficiency. In REST, Amax is related to carbon storage and drought tolerance. For more information, please see Pugnaire & Valladares (1999).

4.2.2 Alkaloids
Alkaloids are chemically-basic compounds generally related to plant protection from environmental insults. Quinine, morphine, and caffeine are examples of natural alkaloids. In REST, alkaloids are measured as a percent (%) of the noted alkaloid(s). Alkaloids are related to successional facilitation. For more information, please see Pugnaire & Valladares (1999).
4.2.3 Altitude
Altitude is the range of elevations a given species occurs, with high and low respectively defining maximum and minimum limits. Altitude is measured in meters (m) and is related to drought tolerance.
4.2.4 Annual seed production
Annual seed production refers to seeds produced by a given species over a single year, measured as the total number of seeds. This trait is related to successional facilitation. For more information, please see Pugnaire & Valladares (1999).
4.2.5 Anthocyanin concentration
Anthocyanin concentration refers to the amount of anthocyanins, chemical plant pigments, in a given plant, expressed as percent (%). This trait is related to drought tolerance, fire tolerance, and successional facilitation.
4.2.6 Bark mass
Bark mass is measured in grams (g). This trait is related to carbon storage, drought tolerance, and fire tolerance.
4.2.7 Bark thickness
Bark thickness is measured in millimeters (mm). This trait is related to carbon storage, drought tolerance, and fire tolerance.
4.2.8 Branch mass
Branch mass is the total of all branches on a given plant, measured in kilograms per plant (kg/plant). This trait is connected with all restoration goals.
4.2.9 Branch N per dry mass
Branch N per dry mass refers to nitrogen content of dried branches, expressed as grams of nitrogen per grams of dry branch mass (formatted as g N g-1 DW in REST). This trait is connected with all restoration goals.
26

4.2.10 Chlorophyll concentration
Chlorophyll concentration is the percent (%) of a given plant that is chlorophyll. This trait is related to carbon uptake and utilization of light and all restoration goals. For more information, please see Pugnaire & Valladares (1999).
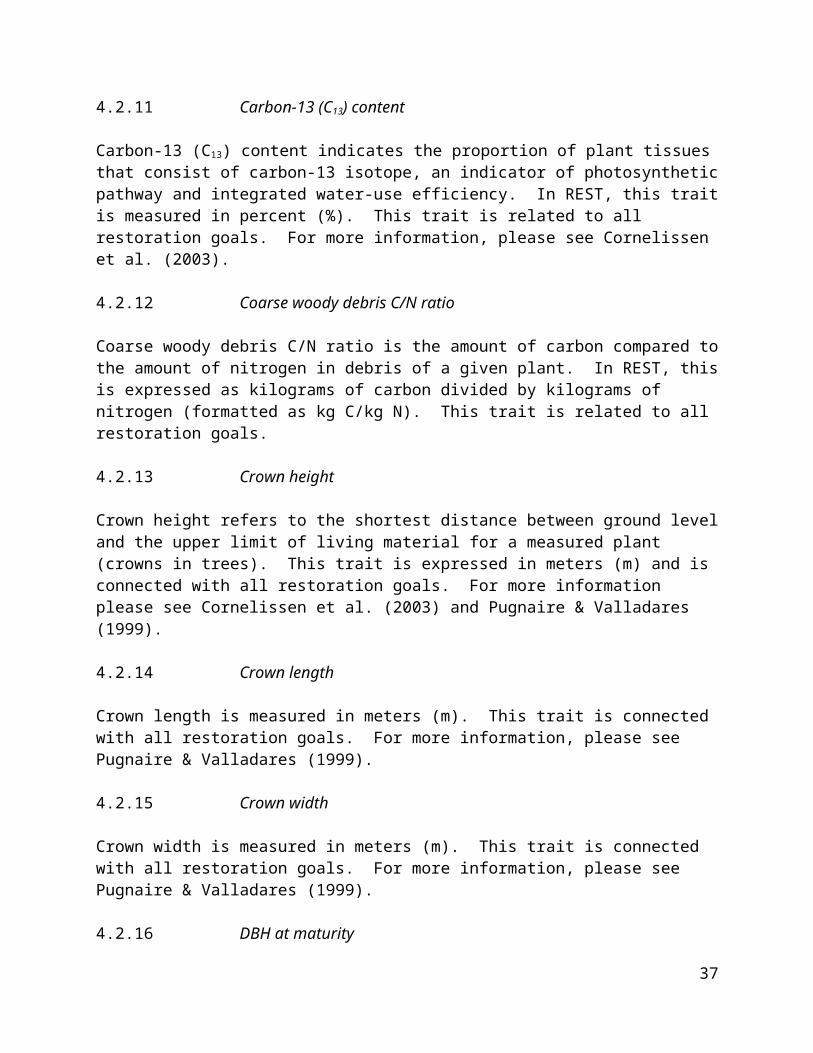
4.2.11 Carbon-13 (C13) content
Carbon-13 (C13) content indicates the proportion of plant tissues that consist of carbon-13 isotope, an indicator of photosynthetic pathway and integrated water-use efficiency. In REST, this trait is measured in percent (%). This trait is related to all restoration goals. For more information, please see Cornelissen et al. (2003).
4.2.12 Coarse woody debris C/N ratio
Coarse woody debris C/N ratio is the amount of carbon compared to the amount of nitrogen in debris of a given plant. In REST, this is expressed as kilograms of carbon divided by kilograms of nitrogen (formatted as kg C/kg N). This trait is related to all restoration goals.
4.2.13 Crown height
Crown height refers to the shortest distance between ground level and the upper limit of living material for a measured plant (crowns in trees). This trait is expressed in meters (m) and is connected with all restoration goals. For more information please see Cornelissen et al. (2003) and Pugnaire & Valladares (1999).
4.2.14 Crown length
Crown length is measured in meters (m). This trait is connected with all restoration goals. For more information, please see Pugnaire & Valladares (1999).
4.2.15 Crown width
Crown width is measured in meters (m). This trait is connected with all restoration goals. For more information, please see Pugnaire & Valladares (1999).
4.2.16 DBH at maturity
DBH at maturity refers to the diameter of a plant in meters (m) at breast height (typically 1.3 meters) when a plant is fully mature. This trait is related to carbon storage and drought tolerance. For more information, please see Pugnaire & Valladares (1999).
4.2.17 Dispersal period length
27

Dispersal period length refers to the number of days (d) a plant is dispersing seeds. This trait is connected with successional facilitation. For more information, please see Pugnaire & Valladares (1999).4.2.18 Dispersal unit length
Dispersal unit length is measured in millimeters (mm). This trait is connected with carbon storage and successional facilitation. For more information, please see Pugnaire & Valladares (1999).
4.2.19 Dispersal unit thickness
Dispersal unit thickness is measured in millimeters (mm). This trait is connected with carbon storage and successional facilitation. For more information, please see Pugnaire & Valladares (1999).
4.2.20 Dispersal unit width
Dispersal unit width is measured in millimeters (mm). This trait is connected with carbon storage and successional facilitation. For more information, please see Pugnaire & Valladares (1999).
4.2.21 Fern spore length
Fern spore length refers to the main units of fern reproduction. Fern spore length is expressed in micrometers (µm). This trait is connected with successional facilitation. For more information, please see Pugnaire & Valladares (1999).
4.2.22 Fern spore mass
Fern spore mass is expressed in milligrams (mg). This trait is connected with successional facilitation. For more information, please see Pugnaire & Valladares (1999).
4.2.23 Fern spore volume
Fern spore volume is expressed in micrometers (µm). This trait is connected with successional facilitation. For more information, please see Pugnaire & Valladares (1999).
4.2.24 Fern spore width
Fern spore width is expressed in micrometers (µm). This trait is connected with successional facilitation. For more information, please see Pugnaire & Valladares (1999).
4.2.25 Fine root C/N ratio
Fine root C/N ratio is the amount of carbon compared to the amount of nitrogen in the fine roots of a given plant. In REST, this is expressed as kilograms of carbon divided by kilograms of
28
nitrogen (formatted as kg C/kg N). This trait is connected with all restoration goals. For more information, please see Pugnaire & Valladares (1999).
4.2.26 Fine root dry mass per plant
Fine root dry mass per plant is the amount of roots in kilograms (kg/plant). This trait is connected with all restoration goals. For more information, please see Pugnaire & Valladares (1999).
4.2.27 Flavonoids
Flavonoids are chemical compounds associated with nitrogen fixation, pollinator attraction, and photosynthesis. In REST, flavonoids are measured as a percent (%) of the noted the measured flavonoid(s). This trait is related to all restoration goals. For more information, please see Pugnaire & Valladares (1999).
4.2.28 Flowering period length
Flowering period length is the number of days (d) a plant produced flowers. This trait is related to successional facilitation.
4.2.29 Freeze exposure
Freeze exposure refers to a plant's ability to withstand freezing conditions, defined as temperatures consistently below 32° Fahrenheit (0° Celsius) prior to plant death. In REST, freeze exposure is measured in hours (h) and is associated with the goals of carbon storage and successional facilitation. Please see Fitter & Hay (2002) for more information.
4.2.30 Fruit mass
Fruit mass is the amount of an individual fruit of a given plant species. This is measured in grams (g) and is related to successional facilitation.
4.2.31 Germination time
Germination time is the number of days (d) a plant reproductive unit (such as a seed or spore) takes to sprout. Germination is related to successional facilitation. Please see Fitter & Hay (2002) for more information.
4.2.32 Heat tolerance
Heat tolerance refers to a plant's ability to withstand temperature conditions above its generally-accepted upper limit. In REST, heat tolerance is measured in hours (h) and is associated with all restoration goals. Please see Fitter & Hay (2002) for more information.
4.2.33 Instantaneous water use efficiency
29

One measure of water use efficiency, instantaneous, regards the ability of a plant to utilize water while capturing carbon via photosynthesis. In REST, this trait is measured in millimols of carbon gained as a proportion mols water lost (mmol/mol). This trait is related to all restoration goals. For more information, please see Way et al. (2014).
4.2.34 Integrated water use efficiency
Integrated water use efficiency refers to the ratio of water used in plant metabolism to water lost by productivity. This is measured by the 13C (parts per thousand; 0/00) signature found in leaf tissue and is related to all restoration goals.
4.2.35 Latex content
Latex content regards the percent of latex production in a given plant. This trait is connected with drought tolerance, fire tolerance, and successional facilitation.
4.2.36 Latitude
Latitude regards the global range a plant can survive, with high and low defining respective limits for a given plant. This is measured in degrees (deg) and is related to drought tolerance.
4.2.37 Leaf and fine root turnover
Leaf and fine root turnover refers to the timing of shorter-lived tissue replacement in plants. Turnover is measured per year (yr-1) and is related to all restoration goals. For more information, please see Pugnaire & Valladares (1999).
4.2.38 Leaf area
Leaf area is measured in square centimeters (formatted as cm^2). This trait is related to carbon storage, drought tolerance, and successional facilitation. Please see Fitter & Hay (2002) and Pugnaire & Valladares (1999) for more information.
4.2.39 Leaf area ratio
Leaf area ratio (LAR) refers to the photosynthetic surface area of a plant as a proportion of total dry mass. In REST, LAR is measured in square centimeters per gram (formatted as cm^2 g^-1) and is related to all restoration goals. For more information, please see Allaby (2012), Fitter & Hay (2002), and Pugnaire & Valladares (1999).
4.2.40 Leaf C percentage
Leaf C percentage (%) refers to the carbon content of a leaf. This trait is related to carbon storage and fire tolerance. For more information, please see Pugnaire & Valladares (1999).
30

4.2.41 Leaf C:N
Leaf C:N is the ratio of carbon to nitrogen content within a leaf. This is expressed as kilograms carbon to kilograms nitrogen (kg/kg). This trait is related to carbon storage and fire tolerance. For more information, please see Pugnaire & Valladares (1999).
4.2.42 Leaf carbon content per area
Leaf carbon content per area refers to the carbon content of a leaf in kilograms spread over a square meter (formatted as kg C per m2 in REST). This trait is related to carbon storage, fire tolerance, and successional facilitation. For more information, please see Pugnaire & Valladares (1999).
4.2.43 Leaf chlorophyll / leaf area
Leaf chlorophyll / leaf area refers to the chlorophyll content in grams over a square meter of leaf (formatted as g Chl m-2 le). This trait is related to carbon storage, drought tolerance, and successional facilitation.
4.2.44 Leaf density
Leaf density refers to the leaf mass in milligrams within a cubic millimeter (formatted as mg/mm3 in REST). This trait is related to carbon storage, fire tolerance, and successional facilitation. Please see Fitter & Hay (2002) and Pugnaire & Valladares (1999) for more information.
4.2.45 Leaf dry mass
Leaf dry mass refers to the mass of a dried leaf in grams (g). This trait is related to all restoration goals. For more information, please see Pugnaire & Valladares (1999).
4.2.46 Leaf dry matter content (LDMC)
Leaf dry matter content (LDMC) refers to the total mass of dry matter in a leaf. This is expressed as grams of dry matter over grams of total leaf matter (formatted as g/g) and is related to all restoration goals. For more information, please see Pugnaire & Valladares (1999).
4.2.47 Leaf epidermis cell area
Leaf epidermis cell area refers to the area of leaf epidermis in square micrometers (µm^2 in REST). This trait is related to carbon storage, drought tolerance, and successional facilitation.
4.2.48 Leaf epidermis cell length
Leaf epidermis cell length refers to the length of leaf epidermis in square micrometers (µm^2 in REST). This trait is related to carbon storage, drought tolerance, and successional facilitation.
31

4.2.49 Leaf epidermis volume / leaf volume
Leaf epidermis volume / leaf volume is the proportion of leaf volume occupied by the leaf epidermis in cubic millimeters (mm3/mm3 in REST). This trait is related to carbon storage, drought tolerance, and successional facilitation.
4.2.50 Leaf hypodermis volume / leaf volume
Leaf hypodermis volume / leaf volume is the proportion of leaf volume occupied by the leaf hypodermis in cubic millimeters (mm3/mm3 in REST). This trait is related to carbon storage, drought tolerance, and successional facilitation.
4.2.51 Leaf intercellular / leaf volume
Leaf intercellular / leaf volume is the proportion of leaf volume occupied by the leaf intercellular space in cubic centimeters (cm3/cm3 in REST). This trait is related to carbon storage, drought tolerance, and successional facilitation.
4.2.52 Leaf intercellular CO2 concentration
Leaf intercellular CO2 concentration refers to the amount of carbon dioxide in a leaf. In REST, CO2 concentration is measured in parts per million (ppm). This trait is related to carbon storage, drought tolerance, and successional facilitation.
4.2.53 Leaf lamina length
Leaf lamina length is measured in centimeters (cm). This trait is related to carbon storage, drought tolerance, and successional facilitation.
4.2.54 Leaf length
Leaf length is measured in centimeters (cm). This trait is related to carbon storage, drought tolerance, and successional facilitation. Please see Fitter & Hay (2002) for more information.
4.2.55 Leaf lifespan
Leaf lifespan is measured in years (yr). This trait is related to carbon storage, drought tolerance, and successional facilitation.
4.2.56 Leaf light absorption
Leaf light absorption is measured in mols per mol (mol/mol). This trait is related to carbon storage, drought tolerance, and successional facilitation.
32

4.2.57 Leaf mesophyll cell area
Leaf mesophyll cell area refers to the area of leaf mesophyll in square micrometers (µm^2 in REST). This trait is related to carbon storage, drought tolerance, and successional facilitation.
4.2.58 Leaf Mg content per dry mass
Leaf Mg content per dry mass refers to the total amount of magnesium in grams within dry leaf matter (g g-1 DW in REST). This trait is related to carbon storage, drought tolerance, and successional facilitation.
4.2.59 Leaf N area
Leaf N area refers to the total amount of nitrogen contained within a given leaf area in grams per square meter (g/m2 in REST). This trait is related to all restoration goals. For more information, please see Pugnaire & Valladares (1999).
4.2.60 Leaf N content / dry leaf mass
Leaf N content / dry leaf mass refers to the nitrogen content of overall dry leaf mass in grams (g N g-1 DW in REST). This trait is related to carbon storage, fire tolerance, and successional facilitation.
4.1.61 Leaf N percentage
Leaf N percentage refers to the proportion of a leaf that is nitrogen (expressed at % in REST). This trait is related to carbon storage and fire tolerance. Please see Fitter & Hay (2002) for more information.
4.2.62 Leaf N/P ratio
Leaf N/P ratio refers to the proportion of nitrogen to phosphorus within plant leaves in grams (g/g). This trait is connected with all restoration goals.
4.2.63 Leaf P percentage
Leaf P percentage refers to the proportion of a leaf that is phosphorous (expressed as % in REST). This trait is related to carbon storage. Please see Fitter & Hay (2002) for more information.
4.2.64 Leaf pH
Leaf pH regards the acidity of a leaf, expressed as pH value in REST. This trait is related to all restoration goals. For more information, please see Fitter & Hay (2002) and Pugnaire & Valladares (1999).
33

4.2.65 Leaf photosynthesis rate / leaf area
Leaf photosynthesis rate / leaf area refers to the conversion of carbon dioxide to simple sugar over a given leaf area (expressed as umol/m^2*s in REST). This trait is related to all restoration goals. For more information, please see Pugnaire & Valladares (1999).
4.2.66 Leaf thickness
Leaf thickness is measured in millimeters (mm). This trait is related to carbon storage, drought tolerance, and fire tolerance. Please see Fitter & Hay (2002) and Pugnaire & Valladares (1999) for more information.
4.2.67 Leaf timing
Leaf timing refers to the number of days (d) prior to leaf emergence. This trait is related to carbon storage, drought tolerance, and successional facilitation.
4.2.68 Leaf water content
Leaf water content refers to the proportion of water within a leaf (expressed as % in REST). This trait is related to carbon storage, drought tolerance, and successional facilitation.
4.2.69 Leaf weight ratio (LWR)
Leaf weight ratio (LWR) refers to the ratio of leaf mass to plant mass expressed as grams over grams (g/g). LWR is related to all restoration goals. For more information, please see Fitter and Hay (2002).
4.2.70 Leaf width
Leaf width is measured in centimeters (cm). Leaf width is related to carbon storage, drought tolerance, and successional facilitation.
4.2.71 Leaf / sapwood area ratio
Leaf / sapwood area ratio refers to the proportion of leaves to sapwood in square millimeters (expressed as mm^2 mm^-2 in REST). This trait is related to carbon storage, drought tolerance, and fire tolerance.
4.2.72 Litter C/N ratio
Litter C/N ratio the amount of carbon compared to the amount of nitrogen in leaf litter of a given plant. In REST, this is expressed as kilograms of carbon divided by kilograms of nitrogen (kg C/kg N). This trait is related to all restoration goals.
34
4.2.73 Litter decomposition rate
Litter decomposition rate refers to the breakdown of dead leaves into less complex organic matter. In REST, this is expressed as percent of mass lost (mass loss %). This trait is related to carbon storage, fire tolerance, and successional facilitation. Please see Fitter & Hay (2002) and Pugnaire & Valladares (1999) for more information.
4.2.74 Modulus of elasticity
Modulus of elasticity refers to the 'push back' or resistance to deforming but not breaking when force is applied. The unit in REST is megapascals (MPa). This trait is related to carbon storage, drought tolerance, and fire tolerance. For more information, please see Pugnaire & Valladares (1999).
4.2.75 N fixation
N fixation regards the effect of nitrogen-fixing organisms in direct association with a given plant species. In REST, N fixation is expressed as percentage (%) and is related to all restoration goals. For more information, please see Pugnaire & Valladares (1999).
4.2.76 Nitrogen-15 (N15) content
Nitrogen-15 (N15) content indicates the proportion of plant tissues utilizing the nitrogen-15 isotope, an indicator of how plants utilize atmospheric nitrogen. In REST, this trait is measured in percent (%). This trait is related to all restoration goals. For more information, please see Kendall (2004).
4.2.77 Petiole length
Petiole length is measured in centimeters (cm). Petiole length is related to drought tolerance.
4.2.78 Phenols
Phenols refer to the percentage (%) of plant compounds containing a phenol group. These range from simple compounds synthesized in response to environmental insults to those more volatile. Capsaicin and serotonin are common examples, while certain phenols show associations with litterfall decomposition, resistance to fungal or other pests, and increased fire duration and intensity. In REST, phenols are associated with fire tolerance. For more information, please see Pugnaire & Valladares (1999).
4.2.79 Plant annual growth rate
Plant annual growth rate refers to how many millimeters (mm) a plant grows per year. This trait is related to all restoration goals. For more information, please see Pugnaire & Valladares (1999).
35

4.2.80 Plant height at maturity
Plant height at maturity refers to the height in meters (m) a plant attains when no longer considered to be in juvenile growth forms. This trait is related to drought tolerance and fire tolerance. For more information please see Cornelissen et al. (2003) and Pugnaire & Valladares (1999).
4.2.81 Plant lifespan (average longevity)
Plant lifespan (average longevity) refers to the time in years (yrs) a plant is expected to survive from germination to death. This can range from days for plant with relatively simple life histories to thousands of years for slow-growing species or those with clonal growth habits. This trait is related to carbon storage and successional facilitation. For more information, please see Pugnaire & Valladares (1999).
4.2.82 Post-fire seed emergence
Post-fire seed emergence refers to the percentage (%) of seeds that germinate after fire events. This trait is related to carbon storage, fire tolerance, and successional facilitation. For more information, please see Pugnaire & Valladares (1999).
4.2.83 Post-fire seed survival
Post-fire seed survival refers to the percentage (%) of seeds that remain viable following fire events. This trait is related to carbon storage, fire tolerance, and successional facilitation. For more information, please see Pugnaire & Valladares (1999).
4.2.84 QE
Quantum efficiency, or QE, refers to effectiveness of capturing energy available in solar radiation. In REST, plants utilizing photosynthesis are measured in micromoles per square meter per second (umol/m^2/s). QE is related to carbon storage and drought tolerance.
Quantum efficiency, or QE, refers to effectiveness of capturing energy available in solar radiation and is expressed as a percentage; %). In REST, QE is related to carbon storage and drought tolerance.
4.2.85 Re-sprouting ability clipping
Re-sprouting ability clipping refers to the percentage (%) of damaged growth areas (leaves, branches, and related) that rejuvenate following pruning, forager browsing, or other direct removal. This trait is related to carbon storage and successional facilitation.
4.2.86 Re-sprouting ability fire
36
Re-sprouting ability fire refers to the percentage (%) of damaged growth areas (leaves, branches, and related) that rejuvenate following extreme heat, desiccation, or other conditions associated with fire. This trait is related to carbon storage, fire tolerance, and successional facilitation.
4.2.87 Relative growth rate
Relative growth rate (RGR) refers to increases in both mass in grams and stature in centimeters of a given plant per day (g/day cm/day in REST). RGR tends to indicate growth investment and should be considered on a whole-plant basis. This trait is related to carbon storage, drought tolerance, and fire tolerance. Please see Fitter & Hay (2002) and Pugnaire & Valladares (1999) for more information.
4.2.88 Resin
Resin refers to the percentage (%) of certain phenolic compounds secreted by plants in response to environmental insults. These generally refer to compounds associated with pines and aromatics such as copal, frankincense, and myrrh, but not sap, latex, or other gum-like substances. Resin is related to fire tolerance and successional facilitation. For more information, please see Pugnaire & Valladares (1999).
4.2.89 Root / shoot ratio
Root / shoot ratio refers to the proportion of belowground to aboveground growth in plants (g/g). This trait is related to all restoration goals. Please see Fitter & Hay (2002) and Pugnaire & Valladares (1999) for more information.
4.2.90 Rooting depth
Rooting depth refers to the extent in meters (m) a given plant extends below ground level. This trait is related to all restoration goals. Please see Fitter & Hay (2002) for more information.
4.2.91 Saponins
Saponins refer to the percentage (%) of chemical compounds known for their ability to create foamy or frothy conditions when subjected to water. Often bitter, saponins can serve as pest deterrents due to decreased palatability. Saponins are related to fire tolerance and successional facilitation. For more information, please see Pugnaire & Valladares (1999).
4.2.92 Seed dispersal distance
Seed dispersal distance refers to the distance in meters (m) seeds can occur from a mature plant. This trait is related to successional facilitation. For more information, please see Pugnaire & Valladares (1999).
4.2.93 Seed length
37

Seed length refers to the length in centimeters (cm) of a seed. This trait is related to carbon storage, drought tolerance, and successional facilitation. For more information, please see Pugnaire & Valladares (1999).
4.2.94 Seed longevity
Seed longevity refers to the time in years (yrs) a seed remains viable. This trait is related to drought tolerance, fire tolerance, and successional facilitation. For more information, please see Pugnaire & Valladares (1999).
4.2.95 Seed mass
Seed mass is measured in grams (g) and is related to successional facilitation. For more information, please see Pugnaire & Valladares (1999).
4.2.96 Seed number
Seed number refers to the expected number of seeds produced per plant. This trait is related to successional facilitation. For more information, please see Pugnaire & Valladares (1999).
4.2.97 Seed number per inflorescence
Seed number per inflorescence refers to the number of seeds produced per flowering event (expressed as 1/infloresce in REST). This trait is related to successional facilitation. For more information, please see Pugnaire & Valladares (1999).
4.2.98 Seed terminal velocity
Seed terminal velocity refers to the maximum speed a seed attains while airborne after detaching from a plant. In REST, this expressed in meters per second (m/s) and is related to successional facilitation.
4.2.99 Seed thickness
Seed thickness is measured in centimeters (cm). Seed thickness is related to all restoration goals. For more information, please see Pugnaire & Valladares (1999).
4.2.100 Seed bank density
Seed bank density refers to the number of seeds present per square meter of seed bank (1/m^2). This trait is related to successional facilitation. For more information, please see Pugnaire & Valladares (1999).
4.2.101 Specific leaf area
38

Specific leaf area is the mass in grams of a given square millimeter of leaf area (expressed as mm^2 g^-1 in REST). This trait is related to carbon storage, drought tolerance, and successional facilitation. For more information, please see Pugnaire & Valladares (1999).
4.2.102 Stem conduit diameter
Stem conduit diameter refers to the size in micrometers of fluid-conducting stem portions (expressed as µm in REST). This trait is related to drought tolerance. For more information, please see Pugnaire & Valladares (1999).
4.2.103 Stem cross-sectional area
Stem cross-sectional area refers to the area in square micrometers of fluid-conducting stem portions (expressed as µm^2 in REST). This trait is related to drought tolerance. For more information, please see Pugnaire and Valladares (1999).
4.2.104 Stem diameter
Stem diameter is measured in millimeters (mm). Stem diameter is related to all restoration goals. For more information, please see Pugnaire & Valladares (1999).
4.2.105 Stem length
Stem length is measured in millimeters (mm) and is related to all restoration goals. For more information, please see Pugnaire & Valladares (1999).
4.2.106 Stem respiration rate (stem volume)
Stem respiration rate (stem volume) refers to the exchange of plant gases via stem tissues over a given volume (expressed as µmol m-3s-1 in REST). This trait is related to carbon storage and drought tolerance. For more information, please see Pugnaire & Valladares (1999).
4.2.107 Stem respiration rate (surface area)
Stem respiration rate (surface area) refers to the exchange of plant gases via stem tissues over a given area (expressed as µmol m-2s-1 in REST). This trait is related to carbon storage and drought tolerance. For more information, please see Pugnaire & Valladares (1999).
4.2.108 Stem volume
Stem volume is measured in cubic millimeters (mm^3 in REST). This trait is related to carbon storage, drought tolerance, and fire tolerance. For more information, please see Pugnaire & Valladares (1999).
4.2.109 Stomata conductance per leaf area
39
Stomata conductance per leaf area refers to the amount of carbon dioxide conducted per square meter of leaf are per second (mol CO2/m^2s in REST). This trait is related to carbon storage, drought tolerance, and successional facilitation. For more information, please see Pugnaire & Valladares (1999).
4.2.110 Stomata density
Stomata density refers to the number of stoma per square millimeter (stom./mm2 in REST). This trait is related to carbon storage, drought tolerance, and successional facilitation. For more information, please see Pugnaire & Valladares (1999).
4.2.111 Tannins
Tannins refer to the percentage (%) of protein-binding compounds produced by plants as a response to predation, fire intensity, or other environmental insults. Tannins are related to fire tolerance and successional facilitation. For more information, please see Pugnaire & Valladares (1999).
4.2.112 Tensile strength of wood
Tensile strength of wood is the amount of force in megapascals (MPa) that can be applied to wood prior to breaking. This trait is associated with carbon storage.
4.2.113 Terpenes
Terpenes refer to the percentage (%) of compounds serving a variety of protective, regulatory, and other functions in most organisms. Terpenes are often associated with resins and can be found in plants such as conifers, citrus, and carrots. In REST, terpenes are connected with fire tolerance. For more information, please see Pugnaire & Valladares (1999).
4.2.114 Time to maturity
Time to maturity refers to the time in months (mo) required for a germinated seed to no longer be considered juvenile. This trait is related to successional facilitation.
4.2.115 Time to reproduction
Time to reproduction refers to the time in months (mo) for a germinated seed to be capable of producing viable reproductive structures including flowers, seeds, and related. This trait is related to successional facilitation.
4.2.116 Weed risk assessment score
Hawaii Weed Risk Assessment Score refers to the likelihood of invasion or 'taking over' of a given plant species as outlined by the Hawaii Weed Risk Assessment Guide and other
40

observational guides regarding plant-ecosystem interactions. This trait is related to drought tolerance and successional facilitation. For more information, please see Daehler (2009).
4.2.117 Wood density / specific gravity
Wood density / specific gravity refers to the amount of wood present within a cubic meter as measured in grams per cubic meter (g/m^3 in REST). This trait is related to carbon storage.
41

5.0 References
Adler P et al. (2014). Functional traits explain variation in plant life history strategies. Proceedings of the National Academy of Sciences 111, 740−745.
Allaby M (2012). A Dictionary of Plant Sciences, Third edition. Oxford University Press, Oxford, UK.
Cochrane M (ed) (2009). Tropical Fire Ecology. Climate Change, Land Use, and Ecosystem Dynamics. Springer-Praxis, Chichester, UK.
Cordell S, Ostertag R, Rowe B, Sweinhart L, Vasquez-Radonic L, Michaud J, Cole TC, Schulten JR (2009). Evaluating barriers to native seedling establishment in an invaded Hawaiian lowland wet forest. Biological Conservation 142, 2997–3004.
Cornelissen JHC, Lavorel S, Garnier E, Díaz S, Buchmann N, Gurvich DE, Reich PB, ter Steege H, Morgan HD, van der Heijden MGA, Pausas JG, Poorter H (2003). A handbook of protocols for standardized and easy measurement of plant functional traits worldwide. Australian Journal of Botany 51, 335−380.
CSIRO (2013). Prometheus Wiki. Protocols in ecological & environmental plant physiology. Available from: <http://prometheuswiki.publish.csiro.au/tiki-custom_home.php>. Last accessed 12 Nov 2015.
Daehler C (2009). Weed Risk Assessments for Hawaii and Pacific Islands. Available from: <http://www.botany.hawaii.edu/faculty/daehler/wra/default2.htm>. Last accessed: 25 Feb 2016.
Devlin RM (1975). Plant Physiology, Third edition. Litton Educational Publishing c/o D. Van Nostrand Company, New York, NY.
Douma JC, Aerts R., Witte JPM, Bekker RM, Kunzmann D, Metselaar K, van Bodegom PM (2012). A combination of functionally different plant traits provides a means to quantitatively predict a broad range of species assemblages in NW Europe. Ecography 35, 364−373.
Drenovsky RE, James, JJ (2010). Designing invasion-resistant plant communities: the role of plant functional traits. Rangelands 32, 32−37.
Fahn A (1982). Plant Anatomy, 3rd edition. Pergamon Press, Elmsford, NY.Fitter AH, Hay RKM (2002). Environmental Physiology of Plants, Third edition. Academic
Press, San Diego, CA. Fry EL, Power SA, & Manning, P. (2013) Trait-based classification and manipulation of plant
functional groups for biodiversity–ecosystem function experiments. Journal of Vegetation Science, 25, 248−261.
Funk JL, Cleland EE, Suding KN, Zavaleta ES (2008). Restoration through reassembly: plant traits and invasion resistance. Trends in Ecology and Evolution 12, 695−703.
Hobbs RJ et al. (2006). Novel ecosystems: theoretical and management aspects of the new ecological world order. Global Ecology and Biogeography 15, 1–7.
Holl KD, Aide TM (2011). When and where to actively restore ecosystems? Forest Ecology and Management 261, 1588−1563.
Jepson Flora Project (2006). Ecological Flora of California. Available from: <http://ucjeps. berkeley.edu/efc/dbase.html>. Last accessed: 11 Jul 2016.
Jones TA (2013). Ecologically appropriate plant materials for restoration applications. BioScience 63, 211−219.
42

Kattge et al. (2011). TRY – a global database of plant traits. Global Change Biology 17, 2905−2935.
Kendall C (2004). "Resources on Isotopes: Periodic Table--Nitrogen." USGS Isotopes Tracers Project. Available from: <http://wwwrcamnl.wr.usgs.gov/isoig/period/n_iig.html>. Last accessed 21 Mar 2016.
Kunstler G et al. (2016). Plant functional traits have globally consistent effects on competition. Nature 529, 204–207.
Ostertag R, Cordell S, Michaud J, Cole TC, Schulten JR, Publico KM, Enoka JH (2009). Ecosystem and restoration consequences of invasive woody species removal in Hawaiian lowland wet forest. Ecosystems 12, 503−515.
Ostertag R, Warman L, Cordell S, Vitousek PM (2015). Using plant functional traits to restore Hawaiian rainforest. Journal of Applied Ecology 52, 805−809.
Paula S, Pausas JG (2013). BROT: a plant trait database for Mediterranean Basin species. Version 2013.06. Available From: <http://www.uv.es/jgpausas/brot.htm>. Last accessed: 11 Jul 2016.
Pugnaire FI, Valladares F (eds) (1999). Handbook of Functional Ecology. Marcel Dekker, New York, NY.
Reich PB (2014) The world-wide ‘fast–slow’ plant economics spectrum: a traits manifesto. Journal of Ecology 102, 275−301.
Sonnier G, Navas M-L, Fayolle A, Shipley B (2012). Quantifying trait selection driving community assembly: a test in herbaceous plant communities under contrasted land use regimes. Oikos 121, 1103−1111.
Thomson FJ, Moles AT, Auld TD, Kingsford RT (2011). Seed dispersal distance is more strongly correlated with plant height than with seed mass. Journal of Ecology 99, 1299−1307.
USDA NRCS (2016). The PLANTS Database. National Plant Data Team, Greensboro, NC, USA. Available from: <http://plants.usda.gov>. Last accessed: 11 Jul 2016.
van Bodegom PM, Douma JC, Verheijen LM (2014). A fully traits-based approach to modeling global vegetation distribution. Proceedings of the National Academy of Sciences 111, 13733–13738.
Way DA, Katul GG, Manzoni S, Vico G (2014). Increasing water use efficiency along the C3 to C4 evolutionary pathway: a stomatal optimization perspective. Journal of Experimental Botany, DOI: <10.1093/jxb/eru205>.
43