acknowledgements - datawand.info · web viewoverall, the model estimated smoking prevalence...
TRANSCRIPT

Final Version Date of last update: 29 th October 2010
Baseline Assessment of Urology Related Cancer
South West London Cancer Network
Dyfed Thomas, Public Health Project Manager, NHS Wandsworth/SWLCNAmanda Cranston, Consultant in Public Health, NHS WandsworthJulia Ozdilli, Service Improvement Lead, SWLCN
1
National Cancer Action Team

Final Version Date of last update: 29 th October 2010
ContentsAcknowledgements............................................................................................................................4
Executive Summary............................................................................................................................5
1.0 Introduction............................................................................................................................10
2.0 Organs of Urology.................................................................................................................11
3.0 Risk Factors...........................................................................................................................12
3.1 Age......................................................................................................................................12
3.2 Smoking..............................................................................................................................13
3.3 Multiple Deprivation..........................................................................................................15
3.4 Ethnicity..............................................................................................................................17
3.5 Fruit and vegetable consumption....................................................................................18
3.6 Obesity...............................................................................................................................19
3.7 Other risk factors...............................................................................................................20
4.0 Urological Cancer Incidence................................................................................................21
4.1 Under 75 bladder cancer incidence by PCT 2004-06..................................................21
4.2 All age bladder cancer incidence by PCT 2004-06......................................................21
4.3 All age bladder cancer incidence by PCT 1993-95 to 2004-06 (3-year rolling average).........................................................................................................................................22
4.4 Under 75 prostate cancer incidence by PCT 2004-06.................................................22
4.5 All age prostate cancer incidence by PCT 2004-06.....................................................23
4.6 All age prostate cancer incidence by PCT 1993-95 to 2004-06 (3-year rolling average).........................................................................................................................................23
4.7 All age testicular cancer incidence average by Local Authority 2003-07..................24
4.8 All age kidney cancer incidence by PCT 2004-06........................................................25
4.9 All age penile cancer incidence by Cancer Network 2003-07.....................................25
4.10 All age all person ureter cancer incidence by Cancer Network 2003-07...................25
4.11 All age all person urology cancer incidence by PCT and Cancer Network 2002-0625
5.0 Urological Cancer Prevalence 2006...................................................................................27
5.1 One-year prevalence by Cancer Network......................................................................27
6.0 Prostate Cancer Staging 2003-07......................................................................................29
6.1 PCT staging.......................................................................................................................29
6.2 SWLCN staging.................................................................................................................30
7.0 Survival from Urological Cancers........................................................................................31
7.1 Bladder cancer one-year relative survival by PCT and Cancer Network 2002-07...31
2
Final Version Date of last update: 29 th October 2010
7.2 Bladder cancer five-year relative survival by Cancer Network 1998-02....................32
7.3 Prostate cancer one-year relative survival by PCT and Cancer Network 2002-07. .33
7.4 Prostate cancer five-year relative survival by PCT and Cancer Network 1998-02. .35
7.5 Kidney cancer one-year relative survival by PCT 1998-02.........................................36
7.6 Kidney cancer five-year relative survival by PCT 1998-02..........................................36
7.7 Urology cancer one-year relative survival by PCT and Cancer Network 2002-07...36
7.8 Urology cancer five-year relative survival by PCT and Cancer Network 1998-02. . .37
8.0 Urological Cancer Mortality..................................................................................................39
8.1 Under 75 bladder cancer mortality by PCT 2006-08....................................................39
8.2 All age bladder cancer mortality by PCT 2006-08........................................................39
8.3 All persons all ages bladder cancer mortality by PCT 1993-95 to 2006-08 (3-year rolling average)..............................................................................................................................39
8.4 Under 75 prostate cancer mortality by PCT 2006-08...................................................40
8.5 All age prostate cancer mortality by PCT 2006-08.......................................................40
8.6 All age prostate cancer mortality by PCT 1993-95 to 2006-08 (3-year rolling average).........................................................................................................................................41
8.7 All age kidney cancer mortality by PCT 2004-06..........................................................41
8.8 All age testicular and penile cancer mortality 2004-08................................................42
8.9 All age all person ureter cancer mortality 2004-08.......................................................42
8.10 All age all person urological cancer mortality by PCT 2003-07..................................42
9.0 Emergency Admissions........................................................................................................43
9.1 All cancer emergency admissions by GP Practice 2008-09.......................................43
9.1.1 Croydon......................................................................................................................43
9.1.2 Kingston......................................................................................................................43
9.1.3 Richmond & Twickenham........................................................................................44
9.1.4 Sutton & Merton.........................................................................................................44
9.1.5 Wandsworth...............................................................................................................45
10.0 Cancer Referrals...................................................................................................................46
10.1 Urgent two week wait (2WW) referrals for suspected cancer 2009 by GP Practice46
10.1.1 Croydon......................................................................................................................46
10.1.2 Kingston......................................................................................................................46
10.1.3 Richmond & Twickenham........................................................................................47
10.1.4 Sutton & Merton.........................................................................................................48
10.1.5 Wandsworth...............................................................................................................48
3

Final Version Date of last update: 29 th October 2010
10.2 Proportion of urological cancer cases diagnosed through non-urgent referral by PCT and Cancer Network 2010..................................................................................................49
11.0 Primary Care Audit 2010......................................................................................................50
11.1 Avoidable delays (all cancers).........................................................................................51
11.2 Prostate cancer summary................................................................................................51
12.0 Cancer Awareness Measure (CAM) Survey in South West London 2010....................52
13.0 Conclusion.............................................................................................................................54
13.1 GP practice summaries....................................................................................................54
13.2 PCT summaries.................................................................................................................55
13.3 South West London Cancer Network specific...............................................................60
13.4 Recommendations............................................................................................................61
References........................................................................................................................................62
Appendix 1: South West London GLA Projected population by ethnicity, 2010.......................67
Acknowledgements
NHS Wandsworth and The South West London Cancer Network acknowledges the contribution the following people and organisations in the provision of information for this document: Martin Brealey,
4
Final Version Date of last update: 29 th October 2010
SWL Breast Screening Unit; Helena Cooper, Primary Care Support Service; Karen Grey, Public Health NHS Wandsworth; Dee Lychnos, Public Health NHS Wandsworth; Assad Pasha, Public Health NHS Wandsworth; and the Thames Cancer Registry.
Executive Summary
Late diagnosis is a major factor contributing to poor survival rates in this country, and while survival rates in South West London are good in comparison to other networks in England, when benchmarked against counterparts in Europe it is clear that there is much more to be done. Last year the SWL cancer network successfully bid for funding for a range of initiatives to support local preventative work within the National Awareness and Earlier Diagnosis Initiative (NAEDI) to increase awareness and promote earlier diagnosis in communities and primary care. One of these initiatives that was funded was the development of this Baseline Assessment. The key findings are set out below. On pages 7 and 8 two matrices (
and Figure 2) outline the figures for each PCT and the overall SWLCN figures.
Croydon
The male under 75 bladder cancer incidence is significantly higher than the national average at 24.63 per 100,000 population, while female incidence is low and comparable to the national average. The borough shows the lowest reduction in all age all persons bladder cancer incidence in SWL, only reducing by 4.1% from 1993-95 to 2004-06. All age all person bladder mortality has increase by 11% from 1993-95 to 2006-08, however the numbers are small rising from 17 to 20 cases. Croydon has an under 75 prostate cancer incidence that is significantly higher than the national average at 102.12, while the all age incidence rate has nearly doubled between 1993-95 and 2004-06. Croydon also has the highest prostate cancer mortality rate in SWL as well as the lowest reduction in the mortality rate between 1993-95 and 2006-08, 6.8%. Testicular cancer incidence is at a rate of 6.2 per 100,000. For kidney cancer incidence and mortality the borough has the lowest male rates in SWL at 10.3 and 3.8 respectively. The female incidence rate is the highest at 6.1 per 100,000. The overall urological cancer incidence is at 85.6 per 100,000 population, while the mortality rate is the highest in SWL at 19.8 per 100,000. Croydon has the highest prostate cancer one-year survival rate in SWL at 94.9%. It also has the highest male kidney cancer survival for males as well as the highest in SWL for urological cancers overall at 94.4%. The one-year prostate cancer survival rate is higher than the EUROCARE-4 study based “Average” benchmark as well as being comparable to the “Good Practice” benchmark. The male bladder cancer one-year survival rate was 74.7% and well below the EUROCARE-4 findings for Norway, Finland and Sweden. Female bladder cancer one-year survival is higher at 77.9% and comparable to the rate in Norway. The average 2WW crude referral rate for suspected cancer in Croydon for 2009 was 1092.41 per 100,000 population. Croydon records 21.9% of urological cancer cases coming through non-urgent referrals, a rate just above the national average at 19.0%.
Kingston
The female under 75 bladder cancer incidence is the lowest in SWL at 4.79 per 100,000 population while the male rate is similar to the national average at 19.51. Kingston shows the highest reduction (42.1%) in all age all person bladder cancer incidence between 1993-95 and 2004-06, however it has a high (compared to other SWL PCTs) all age all person mortality for 2006-08 at 4.75 per 100,000. Despite this the mortality rate has decrease by a quarter since 1993-95. Under 75 prostate cancer incidence is low at 76.6 while the all age rate has dropped by a third between 1993-95 and 2004-06. Kingston had the lowest (in SWL) all age prostate cancer mortality at 19.1 per 100,000 as well as the highest reduction in the mortality rate between 1993-95 and 2006-08 at 37.4%. Kingston has a
5
Final Version Date of last update: 29 th October 2010
testicular cancer incidence rate (2003-07) which is significantly lower than the national average at 3.7 per 100,000. All age male and female all age kidney cancer incidence is at 12.1 and 5.7 per 100,000 respectively, while male mortality is the highest in SWL at 6.5 per 100,000. Overall the all age all person urological cancer incidence is at 83.7 per 100,000 and the mortality rate at 19.3 per 100,000. Prostate cancer one-year survival was at 94.2% and comparable to the EUROCARE-4 study based “Average” and “Good Practice” benchmarks. Male bladder cancer survival was the highest in SWL at 84.2% but still below the rates of the Scandinavian countries. Overall the all person one-year survival rate for all urological cancers was 94.3%. The PCT urgent 2WW cancer referral rate was 1234.63 per 100,000 population. Kingston has the least proportion of urological cancer cases diagnosed through non-urgent referrals in SWL at 21.3%.
Richmond & Twickenham
The male under 75 bladder cancer incidence is high compared to other PCTs in SWL at 23.69. Female incidence is low at 5.82 per 100,000. There has been a 37.4% decrease in the all age all person bladder cancer incidence between 1993-95 and 2004-06 and mortality has decreased by a quarter between 1993-95 and 2006-08. However mortality for 2006-08 is the highest in SWL at 4.88 per 100,000. The under 75 prostate cancer incidence is low at 66.6 per 100,000 and the increase in incidence between 1993-95 and 2004-06 is the lowest in SWL at 16.3%. All age prostate cancer mortality is one of the highest in SWL but has decreased by 29.0% between 1993-95 and 2006-08. Richmond & Twickenham records the highest testicular cancer incidence rate in SWL at 8.66. Kidney cancer incidence is low at 10.9 for males and the number of cases is too low for females to generate a rate and is suppressed. Both male and female kidney cancer mortality rates are suppressed. Overall Richmond & Twickenham has a low all urological cancer incidence in SWL at 77.7 per 100,000 while the mortality rate is at 18.7. Richmond & Twickenham has the lowest prostate cancer one-year survival rate at 88.2% well below the EUROCARE-4 study rates recorded for the Scandinavian countries. The urgent 2WW crude cancer referral rate in Richmond & Twickenham for 2009 was 1156.66 per 100,000 population. The PCT records the highest proportion of diagnosed urological cancer cases originating from non-urgent referrals in SWL at 31.5%, nearly 10% higher than Wandsworth the closest other PCT in SWL.
Sutton & Merton
The male under 75 bladder cancer incidence is the lowest in SWL at 17.27 per 100,000, while female incidence is at 5.12. The all age all person incidence rate for bladder cancer has decreased by two fifths between 1993-95 and 2004-06, while mortality has decrease by 18% between 1993-95 and 2006-08. All age all person bladder cancer mortality is the lowest in SWL at 3.88 per 100,000. Under 75 prostate cancer incidence is significantly lower than the national average in Sutton & Merton at 61.0 per 100,000 while all age incidence has decreased by 20% since 1993-95. The prostate cancer mortality rate is one of the lowest in SWL at 22.0 and the rate has decreased by 31.8% from 1993-95 to 2006-08. Testicular cancer in Sutton is at 5.2 and at 6.0 in Merton, similar to other boroughs (except Kingston) in SWL. All age male kidney cancer is the lowest in SWL at 10.3 per 100,000 while the female rate is low at 4.5. Male kidney cancer mortality is recorded as 6.0 per 100,000. Overall the urological cancer incidence rate for all ages and persons is the lowest in SWL at 70.6 per 100,000 as is the mortality rate at 17.0 per 100,000. The one-year survival rate was high at 94.8%, and was higher than the EUROCARE-4 study based “Average” benchmark as well as being comparable to the “Good Practice” benchmark. Contrastingly Sutton & Merton has the lowest male bladder and kidney cancer one-year survival rates in SWL at 71.6% and 70.8% respectively. The male bladder one-year survival rate is considerably below the comparison countries of Scandinavia which record a range of 85 to 89%. Overall the PCT has a high urological cancer one-year survival rate at 94.1%. The 2WW crude cancer referral rate in Sutton & Merton for 2009 was 1313.64 per 100,000 population. Sutton & Merton record 22.4% of diagnosed urological cancer cases coming from non-urgent referrals.
6

Final Version Date of last update: 29 th October 2010
Wandsworth
The female under 75 bladder cancer incidence is the highest in SWL at 8.27 per 100,000 while the male rate is low at 18.67. Between 1993-95 and 2004-06 the all age and person incidence rate has decreased by 20.8% while mortality has decreased the most out of all the SWL PCTs at 29.4%. The most recent (2004-06) mortality rate is 4.43 per 100,000 for all age and persons. Under 75 prostate cancer incidence is significantly higher than the national average at 92.6 per 100,000. Incidence has decrease by more than half (54.7%) between 1993-95 and 2004-06 and mortality by 19.1% between 1993-95 and 2006-08. The latest prostate cancer mortality rate is 22.6 per 100,000. Testicular cancer incidence is high relative to other PCTs in SWL at 7.0 per 100,000. The male kidney cancer incidence is the highest in SWL at 14.4 per 100,000 while female incidence is the lowest at 4.0 per 100,000. Male mortality for all ages is at 5.4 per 100,000. Overall Wandsworth has the highest all age all person urological cancer incidence in SWL at 88.9 per 100,000 while the mortality rate is also high at 19.7. Prostate cancer one-year survival is one of the lowest in SWL at 93.5% but is still comparable to the EUROCARE-4 study based benchmarks. Male bladder cancer one-year survival is one of the highest in SWL at 81.1% but still below the comparison countries of Scandinavia. The female rate is 63.4% (based on small numbers) and well below the Scandinavian rates. One-year male kidney cancer in Wandsworth is the highest in SWL at 82.3%. Overall the urological cancer one-year survival rate is low, compared to other PCTs in SWL, at 91.8%. The PCT urgent 2WW referral rate for suspected cancer was 1267.93 per 100,000 population. Wandsworth records 22.7% of diagnosed urological cancer cases resulting from non-urgent referrals.
South West London Cancer Network
Overall the SWLCN performs averagely compared to all other networks in London with many indicators similar to the national average. The SWLCN is ranked in the middle of all of London’s cancer networks for prostate, male kidney and female bladder cancer prevalence. The SWLCN area has high (in relation to London CNs) testicular cancer prevalence at 5.3 per 100,000 population as well as a high prevalence of male bladder cancer prevalence at 13.7 per 100,000. Prevalence of female kidney cancer is also high in SWL at 3.9 per 100,000. The SWLCN has a one-year prostate cancer survival rate which is higher than the Eurocare-4 study based ‘Good Practice’ benchmark at 93.9%. It also has one of the highest male (77.0%) and female (65.1%) bladder cancer one-year survival rates in London. There is a large difference between male and female rates though. They are both considerably lower than the rates recorded for the Scandinavian countries for one-year bladder cancer survival. Overall the urological cancer one-year survival rate is high at 93.6%. The SWLCN records the highest proportion of diagnosed cases originating from non-urgent referrals in London at 23.4%. Overall for SWL the urgent 2WW referral rate (excluding suspected testicular cancer) is 1.28 per 1,000 population.
7

Final Version Date of last update: 29 th October 2010
Figure 1: PCT Matrix of key urological cancer figures for South West London.
Croydon Kingston Richmond & Twickenham Sutton & Merton Wandsworth 65+ Population as % of PCT population (2010) 12.9% 12.0% 12.1% 12%
(Merton)13.5%
(Sutton) 8.2%
65+ Population increase (2010-2030) 3.6% 3.0% 1.5% 3.1%
(Merton)3.9%
(Sutton) 0.4%
Male 15-44 Population as % of PCT population (2010)
43.6% 47.1% 45.6% 46.5% 45.0% 59.2%
15-44 Population decrease (2010-2030) 3.7% 4.1% 1.8% 5.2% 4.9% 5.7%
Smoking prevalence (Adults) (2003-05) 21.0 - 25.7% 18.7-24.9% 16.1 - 23.0% 18.7 - 23.3%
(Merton)22.1 - 29.1%
(Sutton) 21.0 - 27.7% Lowest Highest
% of small areas (LSOA) classed as highest deprivation (2007)
33% 5% 4% 15% 29% Lowest Highest Lowest
Estimated fruit & vegetable consumption 2003-05)
27.8% 33.4% 37.1% 30.4% 31.1%Significantly higher than
national average
Estimated obesity prevalence (2003-05) 19.3% 17.3% 14.3% 18.3% 14.2%
Significantly lower than
national average
Male Under 75 bladder Incidence (2004-06) 24.63 19.51 23.69 17.27 18.67 Lowest
Significantly higher
national average
Female Under 75 bladder Incidence (2004-06).
5.35 4.79 5.82 5.12 8.27 Lowest Highest
Decrease all age persons bladder cancer incidence (1993-95-200406).
4.1% 42.1% 37.4% 40.0% 20.8% Highest Lowest
Under 75 prostate Incidence (2004-06). 102.12 76.6 66.6 61.0 92.6
Significantly lower
national average
Significantly higher
national average
Increase all age prostate cancer incidence (1993-95-2004-06).
95.1% 32.2% 16.3% 19.7% 54.7% Lowest Highest
All age testicular cancer incidence (2003-07). 6.2 3.7 8.66 6.0
(Merton)5.2
(Sutton) 7.0Significantly lower than
national average
Highest
All age male kidney cancer incidence (2004-06)
10.3 12.1 10.9 10.3 14.4 Lowest Highest
All age female kidney cancer incidence (2004-06)
6.1 5.7 Suppressed – less than 5 cases 4.5 4.0 Lowest Highest
All age all person urological cancer incidence (1996-2006)
85.6 83.7 77.7 70.6 88.9 Lowest Highest
Prostate cancer staging (2003-07)
Stage 1: 32.7% Stage 4: 7.6%
NK: 58.6%
Stage 1: 29.5% Stage 4: 15.6%
NK: 51.9%
Stage 1: 38.0% Stage 4: 12.4%
NK: 48.0%
Stage 1: 29.9% Stage 4: 11.9%
NK: 55.7%
Stage 1: 45.8% Stage 4: 11.3%
NK: 42.1%
Prostate cancer one-year survival (2002-07) 94.9% 94.2% 88.2% 94.8% 93.5% Highest Lowest
8

Final Version Date of last update: 29 th October 2010
Male bladder cancer one-year survival (2002-07)
74.7% 84.2% No data 71.6% 81.1% Highest Lowest
Female bladder cancer one-year survival (2002-07)
77.9 No data No data No data 63.4%
Male kidney cancer one-year survival (1998-02) 71.9% No data 72.2% 70.8% 82.3% Highest Lowest
All person urological cancer one-year survival (1998-02)
94.4% 94.3% 89.8% 94.1% 91.8% Highest Lowest
All age person bladder cancer mortality (2006-08)
4.55 4.75 4.88 3.88 4.43 Lowest Highest
Decrease all age persons bladder cancer mortality (1993-95-200608)
-11.4% 25.2% 27.9% 18.0% 29.4% Highest decrease Increase
All age prostate cancer mortality (2006-08) 27.0 19.1 25.0 22.0 22.6 Lowest Highest
Decrease all age prostate cancer mortality (1993-95-2006-08)
6.8% 37.4% 29.0% 31.8% 19.1% Highest Lowest
All age male kidney cancer mortality (2004-06)
3.8 6.5 Suppressed – less than 5 cases 6.0 5.4 Lowest Highest
All age person urological cancer mortality (2007) 19.8 19.3 18.7 17.0 19.7 Lowest Highest
Average all cancer emergency admission crude rate per 100,000 (2008-09)
610.41 506.50 536.97 634.87 443.07
2WW cancer referral rate per 100,000 (2009) 1092.41 1234.63 1156.66 1313.64 1267.93
% of cases diagnosed through non-urgent referrals (2010)
21.9% 21.3% 31.5% 22.4% 22.7% Highest Lowest
Figure 2: Matrix of key urological cancer figures for South West London Cancer Network.
SWLCN NELCN NLCN (N)WLCN SELCNProstate cancer prevalence per 100,000 (2006)
91.1 84.3 97.0 71.9 94.0 Lowest Highest
Testicular cancer prevalence (2006)
5.3 3.1 6.0 3.0 4.2 Lowest Highest
Male kidney cancer prevalence per 100,000 (2006)
8.7 7.5 8.2 7.6 10.0 Lowest Highest
Female kidney cancer prevalence per 100,000 (2006)
3.9 4.3 3.3 2.4 2.6 Lowest Highest
Male bladder cancer prevalence per 100,000 (2006)
13.7 13.0 14.0 13.3 11.5 Lowest Highest
Female bladder cancer prevalence per 100,000 (2006)
4.0 4.5 3.3 4.5 3.4 Lowest Highest
Prostate cancer staging (2003-07)
Stage 1: 37.3% Stage 4: 10.8%
NK: 50.1%
Prostate cancer one-year survival (2002-07)
93.9% 92.1% 95.1% 91.1% 90.9%Significantly higher than
‘Good Practice’ level
9

Final Version Date of last update: 29 th October 2010
Male bladder cancer one-year survival (2002-07) 77.0% 73.2 77.8 74.4 74.5 Highest Lowest
Female bladder cancer one-year survival (2002-07)
65.1% 60.8 70.7 62.4 52.4Highest Lowest
Urological cancer one-year survival (Persons) (2002-07)
93.6% 91.9% 94.2% 90.6% 89.9Highest Lowest
% of cases diagnosed through non-urgent referrals (2010)
23.4% 19.5% 23.0% - 22.0%Lowest Highest
1.0 Introduction
Since the Cancer Plan was published in 2000 more people are surviving cancer and the incidence of cancer is increasing as more people live longer. Late diagnosis is a major factor contributing to poor survival rates in this country, and while survival rates in South West London are good in comparison to other networks in England, when benchmarked against counterparts in Europe it is clear that there is much more to be done. Contemporary lifestyles predispose people to cancer and the Cancer Reform Strategy (CRS) (2007) highlighted that with over half of all cancers being potentially preventable services must now begin to think ‘upstream’ and focus on prevention.
The National Awareness and Earlier Diagnosis Initiative (NAEDI) is a collaboration between the National Cancer Action Team and Cancer Research UK and is a key programme emerging from the CRS. Its aim is to make public and healthcare professionals more aware of the signs and symptoms of cancer and encourage those who may have symptoms to seek advice earlier. This workstream offers a good fit with the policy direction of QIPP, NHS Next Stage Review: High Quality for All and World Class Commissioning.
Last year the SWL cancer network successfully bid for funding for a range of initiatives to support local preventative work within NAEDI to increase awareness and promote earlier diagnosis in communities and primary care. These bids included this Baseline Assessment and the Primary Care Audit and Cancer Awareness Measure highlighted within this document.
In order to aid each local early detection initiative a baseline assessment has been undertaken. In collaboration the National Cancer Intelligence Network (NCIN) and the National Cancer Action Team (NCAT) have produced a guide termed: Local Awareness and Early Diagnosis Baseline Assessments: A Guide for Cancer Networks and Primary Care Trusts. This baseline assessment follows these guidelines as a framework (National Cancer Intelligence Network 2009a).
This document provides a summary of currently available information regarding the epidemiology of urological cancer. Comparisons are made with national data and international data where possible.
10

Final Version Date of last update: 29 th October 2010
2.0 Organs of Urology
The urologic organs of the body that can be affected by a malignant neoplasm in both males and females are:
Kidney (plus adrenal glands) (C64-C65) Bladder (C67) Ureters (C66) Urethra (680)
and solely in males:
Prostate (C61) Penis (60) Testicular (C62) (emedicine 2010)
11

Final Version Date of last update: 29 th October 2010
3.0 Risk Factors
3.1 Age
The risk of developing most cancers increases with age. Nearly three-quarters of kidney cancers in the UK occur in those aged 60 and over (Cancer Research UK 2010). Prostate cancer incidence is also associated with age (Gann 2002), with a very low risk in those aged below 50 (Sakr et al. 1996). Another strong risk factor is family history of prostate cancer, a study by Bratt (2002) estimated that 5-10% of all prostate cancer cases and 30-40% of early-onset cases (men diagnosed <55 years) are caused by inherited susceptibility genes.
Figure 3: Projected increase in the proportion (Percent of total population) of 65+ population in South West London, 2010-2030.
2010 2015 2020 2025 20306.0%
8.0%
10.0%
12.0%
14.0%
16.0%
18.0% CroydonKingstonRichmondMertonSuttonWandsworthSWLCN
Per-
cent
age
of
tota
l po
pu-
latio
n
Source: Greater London Authority, Population Projections 2009 Round, London Plan, Borough SYA.
Figure 3 shows that there is a steady projected increase in the 65 and older population across each borough in SWL except Wandsworth which has a predominantly younger population. However Wandsworth still experiences the highest cancer mortality in SWL. The highest proportion of total population that is 65 and over is found in Sutton, accounting for 13.5% of the projected population in 2010. The lowest proportion is in Wandsworth at 8.2% of the population. The highest increase, from
12

Final Version Date of last update: 29 th October 2010
2010, to 2030, in the 65 and over population is projected to occur in Sutton with an increase of 3.9% followed by Croydon (3.6%) and Kingston (3.0%). By 2030 it is projected that nearly one in five (18.8%) women in Sutton will be 65 or older. Overall, males that are 65 and over account for 10.3% of the projected male population in SWL in 2010, while women account for 12.9%. These proportions are projected to increase to 11.2% and 13.5% respectively by 2020 and to 12.8% and 15.2% by 2030.
Testicular cancer occurs mostly in the young male population with nearly half of cases occurring in men under the age 35 years and 90% under the age of 55. It is the most common cancer among men aged 15-44 years (Office of National Statistics 2010). Figure 4 shows the projected proportion of the 15-44 male population in SWL from 2010 to 2030. The boroughs of Croydon, Kingston, Richmond, Merton and Sutton have consistently similar proportions ranging between 40% and 47%, showing a decrease in the first 10 years followed by a levelling off of the population group between 2020 and 2030. The borough of Wandsworth shows a markedly higher proportion of males in this group at nearly 60% of the total male population in 2010 followed by a linear decrease to 53% in 2030.
Figure 4: Projected increase in the proportion (Percent of total population) of 15-44 male population in South West London, 2010-2030.
2010 2015 2020 2025 203010.0%
20.0%
30.0%
40.0%
50.0%
60.0%
70.0%
Croydon Kingston
Richmond Merton
Sutton Wandsworth
SWLCN
Per-
cent
age
of
tota
l m
ale
popu
-la
tion
Source: Greater London Authority, Population Projections 2009 Round, London Plan, Borough SYA.
3.2 Smoking
The greatest risk factor for developing bladder cancer is smoking. It has been estimated that two-thirds of male cases and one-third of female cases are due to smoking (Brennan et al. 2000, Brennan et al 2001). Tobacco smoking is also an important risk factor for kidney cancer with some studies estimating that 24-32% of cases in men and 9-16% of cases in women are due to smoking (Setiawan et al. 2007, McLaughlin 1995). It is believed that the incidence of prostate cancer is not linked to smoking (Rohrmann et al. 2007, Adami et al. 1996). While incidence of testicular cancer is rising worldwide no definitive modifiable risk factors have been found. It has been proposed that maternal smoking is a risk factor but research findings have been mixed, some concluding that exposure to cigarette smoking in utero increases the risk of testicular cancer (Pettersson et al. 2004, Kaijser et al 2003) while other have found no link (McGlynn et al. 2006, Coupland et al. 2004). For upper tract cancers of which the ureters are part of, smoking is the strongest risk factor (Kaplon et al. 2009).
13

Final Version Date of last update: 29 th October 2010
Results from the Health Survey for England (The Information Centre 2006) showed more variation in smoking rates for BME communities compared with the population as a whole. Following age-standardisation, Bangladeshi and Irish men were more likely to smoke than the general male population, while Indian men were found to be less likely to smoke than the general male population. The picture is very different for women as after age-standardisation none of the female BME groups were more likely to smoke than the general female population. Black African, South Asian and Chinese women were found to be less likely to smoke than the general female population. These results were however based on self-reported smoking behaviour which is likely to underestimate smoking prevalence.
Table 1: Model based estimates (with 95 CIs) of smoking in adults in South West London compared with England, 2003-2005.Local Authority Model Prevalence (%) Lower 95% CI Upper 95% CICroydon 23.2 21.0 25.7Kingston 21.7 18.7 24.9Merton 20.9 18.7 23.3Richmond 19.3 16.1 23.0Sutton 25.4 22.1 29.1Wandsworth 24.2 21.0 27.7Source: The Information Centre 2010.
Overall, the model estimated smoking prevalence across the 6 boroughs of SWL are similar (Table 1 & Figure 5) ranging from 19.3% (95%CI 16.1% – 23.0%) in Richmond and Twickenham to 25.4% (95%CI 22.1% – 29.1%) in Sutton. These rates are also comparable with the London and national averages. These estimates are model based i.e. they are based on population characteristics extracted from census data for example and are not based on a survey sample. They do not take into consideration local variation, for example the effects of local campaigns. Due to this it is not strictly appropriate to compare between areas and these data should not be used to monitor performance (The Information Centre 2008). Also consideration of the 95% confidence intervals is needed when assessing the data.
Figure 5: Model based estimates of smoking in adults in South West London compared with England, 2003-2005.
Richmond upon Thames
Merton Kingston upon Thames
Croydon Wandsworth Sutton London England
0.0
5.0
10.0
15.0
20.0
25.0
30.0
Esti
m-at
ed
per-
cent
age
of
adul
t po
pu-
lati
on
Source: The Information Centre 2010.
14

Final Version Date of last update: 29 th October 2010
Although SW London has followed the national trend with a reduction in the prevalence of smoking this masks significant health inequalities with smoking rates highest in the most deprived populations. In some super output areas in Croydon, Wandsworth and Sutton the prevalence reaches 41% (Map 1 overleaf).
Map 1: Estimates of smoking prevalence in adults (16+) in the SWL sector, 2003-05.
Source: HSfE 2006; map by SWL PH Intelligence from Staying Healthy Strategy for South West London 2010-2016
3.3 Multiple Deprivation
A number of studies have found that mortality from a number of different cancers is higher in low socioeconomic groups. Bladder cancer mortality has been shown to vary with socioeconomic status (Faggiano et al. 1994, Matos et al. 1994) while incidence of bladder and kidney cancer has also been shown to be higher in low socioeconomic groups (Eriksen et al. 2008). The National Cancer Intelligence Network (NCIN) found for both male and female (2000-04) that the age standardised incidence of bladder cancer increased with deprivation (Figure 6), and that there was a significant difference between the most and least deprived groups (National Cancer Intelligence Network 2008). The study also revealed that the increase in relation to deprivation was greater for men compared to women, and that this difference was significant.
Figure 6: Bladder cancer incidence by index of multiple deprivation 2000-2004.
15

Final Version Date of last update: 29 th October 2010
Least Deprived 2 3 4 Most Deprived
0
5
10
15
20
25
Male Female
A g e s t a n d a r d i s e d i n c i d e n c e r a t e p e r 1 0 0 , 0 0 0
p o p u l a ti o n
Source: National Cancer Intelligence Network, 2008.
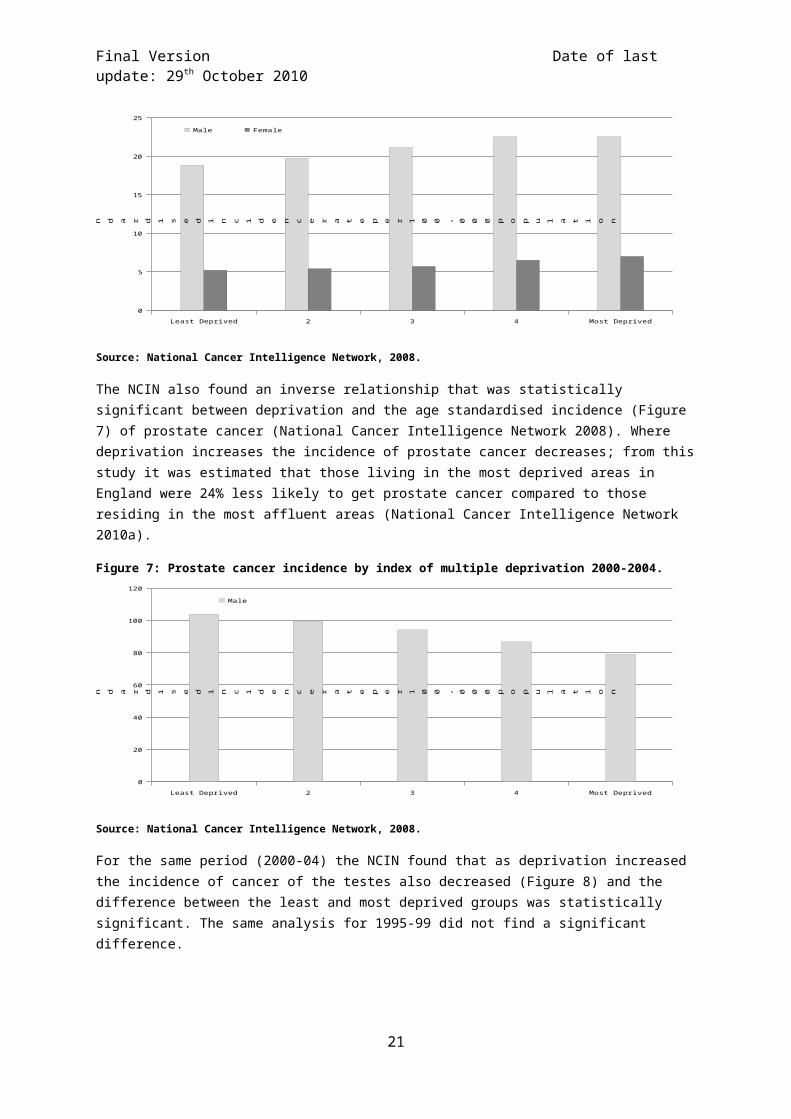
The NCIN also found an inverse relationship that was statistically significant between deprivation and the age standardised incidence (Figure 7) of prostate cancer (National Cancer Intelligence Network 2008). Where deprivation increases the incidence of prostate cancer decreases; from this study it was estimated that those living in the most deprived areas in England were 24% less likely to get prostate cancer compared to those residing in the most affluent areas (National Cancer Intelligence Network 2010a).
Figure 7: Prostate cancer incidence by index of multiple deprivation 2000-2004.
Least Deprived 2 3 4 Most Deprived
0
20
40
60
80
100
120
Male
A g e s t a n d a r d i s e d i n c i d e n c e r a t e p e r 1 0 0 , 0 0 0
p o p u l a ti o n
Source: National Cancer Intelligence Network, 2008.
For the same period (2000-04) the NCIN found that as deprivation increased the incidence of cancer of the testes also decreased (Figure 8) and the difference between the least and most deprived groups was statistically significant. The same analysis for 1995-99 did not find a significant difference.
16

Final Version Date of last update: 29 th October 2010
Figure 8: Cancer of the testes incidence by index of multiple deprivation 2000-2004.
Least Deprived 2 3 4 Most Deprived
0
1
2
3
4
5
6
7
8Male
A g e s t a n d a r d i s e d i n c i d e n c e r a t e p e r 1 0 0 , 0 0 0 p o p u l a t i o n
Source: National Cancer Intelligence Network, 2008.
In SWL the main areas of high deprivation are in Wandsworth (Battersea, Roehampton, Tooting), Sutton and Merton (Morden, Carlshalton) and Croydon (Croydon centre and surrounding area and New Addington).
Map 2: Index of multiple deprivation, South West London, 2007 (SWL Scale).
Source: Department of Local Government and communities, 2007.
17

Final Version Date of last update: 29 th October 2010
3.4 Ethnicity
Ethnicity has an effect on the health and well being of individuals, to a lesser or greater extent depending on the type of cancer. As part of the Cancer Reform Strategy the National Cancer Inequalities Initiative (NCEI) was launched with the aim to reduce inequalities in cancer incidence and survival for several different groups where inequality exists; one such grouping is Black and Minority Ethnic (BME) populations. Historically though the recording of ethnicity for routinely collected cancer data has been incomplete and of poor quality (Department of Health 2007). As a result, previously work on cancer and ethnicity has been limited in the UK, with mortality studies using place of birth information (Grulich et al. 1992, Swerdlow et al. 1995, Wild et al. 2006) while incidence work has only been carried out on the south Asian ethnic population (Winter et al. 1999, dos Santos Silva et al. 2003, Farooq and Coleman 2005).
However as part of the National Cancer Inequalities Initiative, the National Cancer Intelligence Network (NCIN) and Cancer Research UK produced analysis on incidence and survival by major ethnic group for the period 2002-2006, in 2009 (National Cancer Intelligence Network 2009b). It found Asian and Chinese ethnicities were at a significantly lower risk of getting prostate cancer compared with White ethnicity for the 65 and older as well as all ages. For Black ethnicity the risk was significantly higher compared to White ethnicity. The study found that those of Black ethnicity had a risk higher than White ethnicity of between 21% and 161%, while another study found 2-3 times higher risk for Black men (Wild et al. 2006). Asian men had a between 38% and 70% lower risk (National Cancer Intelligence Network 2010b) of acquiring prostate cancer. For kidney and bladder cancer incidence, both males and females of Asian and Black ethnicities had a significantly lower risk compared to White ethnicity. In addition, another UK study found that the incidence of cancer of the testis was significantly lower in Pakistani, Bangladeshi, Other Asian, Black Caribbean, Black African, Other Black and Chinese men (Jack et al. 2007) compared to White Caucasian.
Figure 9: Projected (2010) resident ethnic composition of SWL PCTs, for Males and Females of all ages.
Croydon Kingston Richmond Wandsworth Sutton & Merton0%
10%
20%
30%
40%
50%
60%
70%
80%
90%
100%
Other
Asian
Chinese
Black Other
Black African
Black CaribbeanWhite
Per-
cent
age
of
tota
l po
p-ul
a-tio
n
Source: Greater London Authority Ethnic Group Projections 2008 Round, London Plan, Borough.
18

Final Version Date of last update: 29 th October 2010
Croydon has the largest non-white resident ethnicity at 40.9% of the total population of the PCT followed by Sutton and Merton with 23.3% (Figure 9). Richmond has the lowest at 11.7%. The largest resident BME group across all PCTs is Asian, which comprises of Pakistani, Indian, Bangladeshi and other Asian. Croydon has the largest Black population accounting for 21.2% or one in five of the PCT population. For exact figures see Appendix 1.
3.5 Fruit and vegetable consumption
In line with World Health Organization (WHO) recommendations, current government advice stipulates that adults and children aged over five years should consume at least five 80g portions of fruit and vegetables a day. Males and females in Britain however consume on average less than three portions of fruit and vegetables a day and just 14% consume the recommended amount (Office of National Statistics 2002).
Studies have shown that fruit and vegetable consumption provides some protection against cancer of the kidneys (Lee et al 2009, Key et al. 2004, Tavani et al. 1997). Whether the consumption of fruit and vegetables decreases the risk of bladder cancer remains unclear. Inconsistent evidence has been published, the European Prospective Investigation into Cancer and Nutrition (EPIC) study found no effect on bladder cancer risk through consumption of fruit and vegetables (Buchner et al. 2009). Other studies not to find an association include Larsson et al. (2008), Holick et al. (2005) and Michaud et al. (2002), while Nagano et al. (2001), Mills et al. (1991) and Zeegers et al. (2001) have. Some studies specifically state that the consumption of cruciferous vegetables have a protective factor (Silberstein & Parsons 2010, Tang et al. 2008). Numerous studies that looked at prostate cancer stated that there was no association between high fruit and vegetable consumption and prostate cancer (Takachi et al. 2010, Kirsh et al. 2007, Gonzalez 2006, Key et al. 2004).
Variation in fruit and vegetable consumption has also been linked to deprivation (Cummins et al. 2009) due to a variety of reasons including but not limited, to cost, choice, access and quality. The model based estimates in Figure 10 follow this pattern whereby Richmond and Twickenham has the highest estimated intake at 37.1% (95%CI 33.7% - 40.6%) of adults in the PCT and Croydon the lowest at 27.8% (95%CI 25.7% - 30.1%). The PCTs of Sutton and Merton (30.4% - 95%CI 28.4% - 32.5%), Kingston (33.4% - 95%CI 30.3% - 36.7%) and Wandsworth (31.1% - 95%CI 27.7% - 34.6%) have similar estimated consumption rates. These estimates are model based i.e. they are based on population characteristics extracted from census data for example and are not based on a survey sample. They do not take into consideration local variation, for example the effects of local campaigns. Due to this it is not strictly appropriate to compare between areas and these data should not be used to monitor performance (The Information Centre 2008). Also consideration of the 95% confidence intervals is needed when assessing the data.
Figure 10: Model based estimates of fruit and vegetable consumption in adults in South West London, 2003-2005 (Percentage)
19

Final Version Date of last update: 29 th October 2010
Croydon Sutton and Merton Wandsworth Kingston Richmond and Twickenham
London England
.0
5.0
10.0
15.0
20.0
25.0
30.0
35.0
40.0
27.830.4 31.1
33.4
37.1
29.7
26.3
Estim
-at
ed
per-
cent
age
of
adul
t po
pu-
latio
n
Source: The Information Centre.
3.6 Obesity
Obesity is believed to be a risk factor for kidney cancer (Gupta et al. 2008, Key et al. 2002). The Million Women Study found that a higher BMI was associated to a higher incidence and mortality of numerous cancers, amongst them being kidney cancer (Reeves et al. 2007). Whether prostate cancer is linked to obesity remains unclear. Some reviews and studies have found a slight increase in bodyweight associated with increased risk of prostate cancer (Renehan et al. 2008, Freedland & Aronson 2004, Rodriguez et al. 2001) while other studies have found a reduced risk in men with a high BMI (Wright et al. 2007, Calle et al. 2003).
Figure 11: Model based estimates of obesity in Adults in South West London, 2003-2005.
Wandsworth Richmond and Twickenham
Kingston Sutton and Merton Croydon London England
.0
5.0
10.0
15.0
20.0
25.0
Es-
tim-
ated
p
er-ce
nta
ge o
f ad
ult
p
op
u-la
tio
n
Source: The Information Centre 2010.
Model based estimates were not available by gender; therefore total population estimates are presented (Figure 11). Overall, the model estimated obesity prevalence across the 6 boroughs of SWL are similar (Figure 11) ranging from 14.2% (95%CI 12.5% - 16.0%) in Wandsworth to 19.3% (95%CI 17.6% - 21.1%) in Croydon. These rates are also comparable with the London and national averages. These estimates are model based i.e. they are based on population characteristics extracted from census data for example and are not based on a survey sample. They do not take into consideration local variation, for example the effects of local campaigns. Due to this it is not strictly appropriate to compare between areas and these data should not be used to monitor performance (The Information Centre 2008). Also consideration of the 95% confidence intervals is needed when
20
Final Version Date of last update: 29 th October 2010
assessing the data. Furthermore, if we wish to look at gender differences it is not possible with this data; gender specific model estimates were not available. Data in Figure 11 should only be used as a guide due to this (plus nature of how estimates generated) however, survey based estimates from the Health Survey for England 2008 show that nationally male and female obesity levels are similar, 24% and 25% respectively.
3.7 Other risk factors
Bladder cancer has been linked to industrial process for a number of years; being formally established in the 1950s. Since then polycyclic aromatic hydrocarbons (PAH), resultant of combustible processes, have been identified as carcinogenic. A meta-analysis in 2003 estimated that European men working in an industrial setting (e.g. salt mining, metal working, machinists, transport equipment operators, paints, plastics and industrial chemicals) could attribute 5%-10% of bladder cancer cases to their occupation (Kogevinas M et al. 2003). Hypertension is a possible risk factor for kidney cancer (Moyad 2001) also.
4.0 Urological Cancer Incidence
This section presents information on incidence for a range of cancers that are grouped under urology. Data is presented by individual cancer site or as grouped under the term urology. For some rare cancers such as testicular cancer incidence data is not available.
4.1 Under 75 bladder cancer incidence by PCT 2004-06
Figure 12 shows the under 75 age standardised bladder cancer incidence in SWL for 2004-06. For males, incidence is highest in Croydon at 16.06 per 100,000 (95%CI 12.29 – 19.83) and is significantly higher than the London (11.27 95%CI 10.56 – 11.97) and England (11.64 95%CI 11.40 – 11.88) averages. All other PCTs have similar incidence rates for males (11.98-12.62) with wide confidence intervals. Female incidence is lower than male incidence, with the highest in Wandsworth
21

Final Version Date of last update: 29 th October 2010
at 5.49 per 100,000 (95%CI 2.79 – 8.19). Again wide confidence intervals show that there may not be much variation between PCTs in SWL for bladder cancer incidence. The lowest female incidence rate is recorded for Sutton & Merton at 2.61 per 100,000 (95%CI 1.23 – 3.99).
Figure 12: Directly age standardised (DSR) under 75 years bladder cancer incidence, 2004-06.
Sutton & Merton Richmond & Twickenham
Kingston Wandsworth Teach-ing
Croydon London SHA ENGLAND
0.0
2.0
4.0
6.0
8.0
10.0
12.0
14.0
16.0
18.0
20.0Males Females Persons
Dir
ectl
y St
and
ard
ised
In
cid
ence
Rat
e p
er
10
0,0
00
po
pu
lati
on
Source: Clinical and Health Outcomes Knowledge Base, National Centre for Health Outcomes Development (NCHOD).
4.2 All age bladder cancer incidence by PCT 2004-06
The all age directly standardised bladder cancer incidence follows a similar pattern to the under 75 incidence (Figure 13). Again Croydon at 24.63 per 100,000 (95%CI 20.28 – 28.98) has a male
Figure 13: Directly age standardised (DSR) all ages bladder cancer incidence, 2004-06.
Sutton & Merton Wandsworth Teach-ing
Kingston Richmond & Twick-enham
Croydon London SHA ENGLAND
0.0
5.0
10.0
15.0
20.0
25.0
30.0Males Females Persons
Dir
ectl
y S
tan
dard
ised
In
cid
en
ce R
ate
per
10
0,0
00
p
op
ula
tio
n
Source: Clinical and Health Outcomes Knowledge Base, National Centre for Health Outcomes Development (NCHOD).
incidence rate that is significantly higher than the London and national averages. Richmond & Twickenham (23.69 95%CI 17.94 – 29.43) has a higher rate than Kingston (19.51 95%CI 13.64 – 25.37) and Wandsworth (18.67 95%CI 13.78 – 23.56) for male all age incidence. However the confidence intervals are wide meaning that there may not be much variation between PCTs. Similar to female under 75 incidence of bladder cancer, all ages female incidence is highest in Wandsworth at 8.27 per 100,000 population (95%CI 5.33 – 11.20). All other PCTs have similar rates at 5 per 100,000 population.
22
Final Version Date of last update: 29 th October 2010
4.3 All age bladder cancer incidence by PCT 1993-95 to 2004-06 (3-year rolling average)
Figure 14 shows age standardised bladder cancer incidence of all person for all ages. Male and female figures are combined due to a small number of incidence producing unstable rates and erratic trends. From the graph it can be seen that incidence of bladder cancer has declined rapidly from 1993-95 to 1999-01 followed by a levelling off or slight increase in rates. In addition to the SWL PCTs the London average also follows this trend. Croydon PCT shows the lowest reduction in incidence between 1993-95 and 2004-06, decreasing only 0.59 per 100,000. The incidence rate in Croydon has been increasing since 1999-01 from a low of 11.11 per 100,000 to currently at 13.90. The incidence rate in Richmond & Twickenham has followed a varied trend decreasing sharply from 20.91 per 100,000 in 199395 to a low of 8.53 in 2000-02 before increasing to 13.09 in 2004-06, still a 37% decrease from the 1993-95 rate. Only Sutton & Merton have not experienced a rise in incidence of bladder cancer in the most recent years, resulting in the lowest incidence rate in SWL at 10.55 per 100,000 population.
Figure 14: All persons all ages directly age standardised (DSR) bladder cancer incidence, 1993-2006, 3-year rolling average.
1993-95 1994-96 1995-97 1996-98 1997-99 1998-00 1999-01 2000-02 2001-03 2002-04 2003-05 2004-06
8.00
10.00
12.00
14.00
16.00
18.00
20.00
22.00
Croydon Kingston
Wandsworth Teaching Richmond & Twickenham
Sutton & Merton London SHA
ENGLAND
Dire
ctly
St
anda
rdis
ed
Inci
denc
e
Rate
per
10
0,00
0
popu
latio
n
Source: Clinical and Health Outcomes Knowledge Base, National Centre for Health Outcomes Development (NCHOD).
4.4 Under 75 prostate cancer incidence by PCT 2004-06
The rates of prostate cancer in Croydon (102.12 per 100,000 95%CI 92.56 – 111.68) and Wandsworth (92.55 95%CI 80.64 – 104.46) PCTs are both significantly higher than the London (69.24 95%CI 67.47 – 71.00) and England (70.56 95%CI 69.97 – 71.15) averages (Figure 15). The incidence rate in Croydon is also significantly higher than Sutton & Merton, Richmond & Twickenham and Kingston. The incidence rate in Sutton & Merton is significantly lower than the national rate at 60.99 per 100,000 population (95%CI 53.86 – 68.12).
Figure 15: Directly age standardised (DSR) under 75 years prostate cancer incidence, 2004-06.
23

Final Version Date of last update: 29 th October 2010
Sutton & Merton Richmond & Twickenham
Kingston Wandsworth Teach-ing
Croydon London SHA ENGLAND
0.0
20.0
40.0
60.0
80.0
100.0
120.0
Dir
ectl
y S
tan
dar
dis
ed
In
cid
en
ce R
ate
per
10
0,0
00
p
op
ula
tio
n
Source: Clinical and Health Outcomes Knowledge Base, National Centre for Health Outcomes Development (NCHOD).
4.5 All age prostate cancer incidence by PCT 2004-06
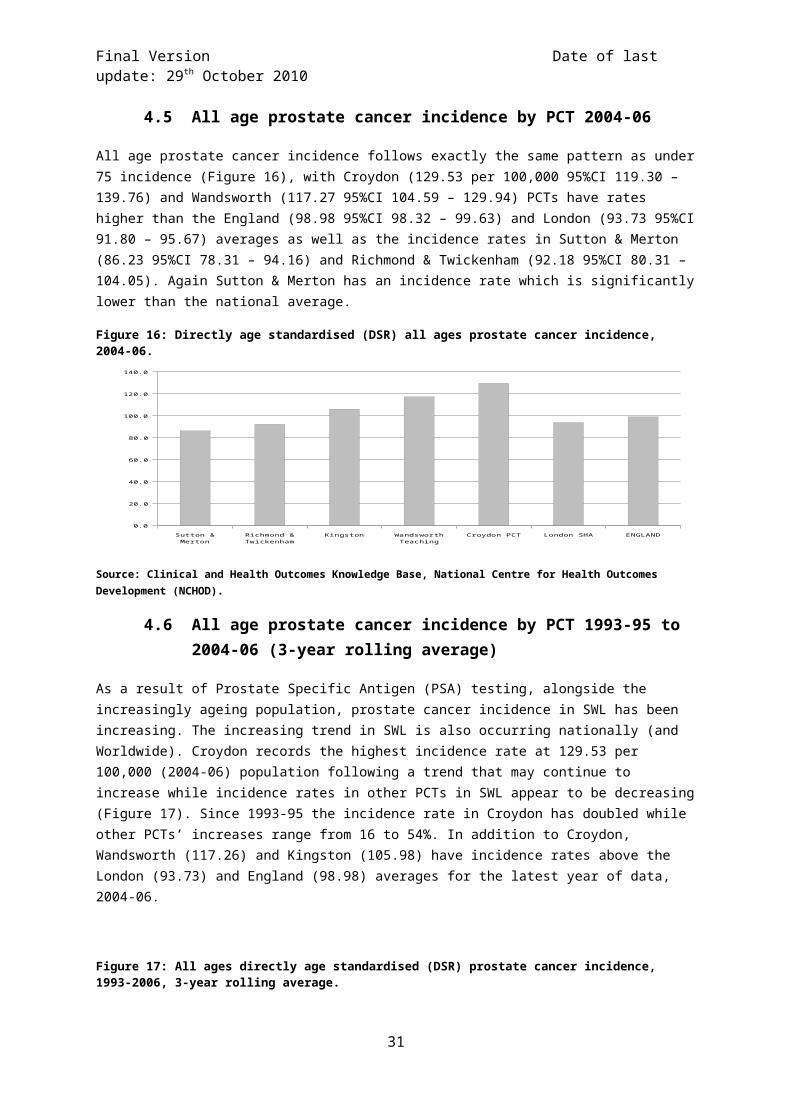
All age prostate cancer incidence follows exactly the same pattern as under 75 incidence (Figure 16), with Croydon (129.53 per 100,000 95%CI 119.30 – 139.76) and Wandsworth (117.27 95%CI 104.59 – 129.94) PCTs have rates higher than the England (98.98 95%CI 98.32 – 99.63) and London (93.73 95%CI 91.80 – 95.67) averages as well as the incidence rates in Sutton & Merton (86.23 95%CI 78.31 – 94.16) and Richmond & Twickenham (92.18 95%CI 80.31 – 104.05). Again Sutton & Merton has an incidence rate which is significantly lower than the national average.
Figure 16: Directly age standardised (DSR) all ages prostate cancer incidence, 2004-06.
Sutton & Merton Richmond & Twick-enham
Kingston Wandsworth Teach-ing
Croydon PCT London SHA ENGLAND
0.0
20.0
40.0
60.0
80.0
100.0
120.0
140.0
Dir
ectl
y S
tan
dard
ised
Incid
en
ce R
ate
per
10
0,0
00
p
op
ula
tio
n
Source: Clinical and Health Outcomes Knowledge Base, National Centre for Health Outcomes Development (NCHOD).
4.6 All age prostate cancer incidence by PCT 1993-95 to 2004-06 (3-year rolling average)
As a result of Prostate Specific Antigen (PSA) testing, alongside the increasingly ageing population, prostate cancer incidence in SWL has been increasing. The increasing trend in SWL is also occurring nationally (and Worldwide). Croydon records the highest incidence rate at 129.53 per 100,000 (2004-06) population following a trend that may continue to increase while incidence rates in other PCTs in SWL appear to be decreasing (Figure 17). Since 1993-95 the incidence rate in Croydon has doubled while other PCTs’ increases range from 16 to 54%. In addition to Croydon, Wandsworth (117.26) and Kingston (105.98) have incidence rates above the London (93.73) and England (98.98) averages for the latest year of data, 2004-06.
24

Final Version Date of last update: 29 th October 2010
Figure 17: All ages directly age standardised (DSR) prostate cancer incidence, 1993-2006, 3-year rolling average.
1993-95 1994-96 1995-97 1996-98 1997-99 1998-00 1999-01 2000-02 2001-03 2002-04 2003-05 2004-06
65.00
75.00
85.00
95.00
105.00
115.00
125.00
135.00
145.00Croydon KingstonWandsworth Teaching Richmond & TwickenhamSutton & Merton London SHAENGLAND
Dire
ctly
St
anda
rdis
ed
Inci
denc
e
Rate
per
10
0,00
0
popu
latio
n
Source: Clinical and Health Outcomes Knowledge Base, National Centre for Health Outcomes Development (NCHOD).
4.7 All age testicular cancer incidence average by Local Authority 2003-07
Incidence of testicular cancer (Figure 18) is highest in Richmond at 8.66 per 100,000 population (95%CI 5.93 – 11.39) with the lowest recorded in Kingston at 3.68 per 100,000 (95%CI 1.91 – 5.45) The rate in Richmond is significantly higher than in Kingston. Despite this, the confidence intervals do overlap across SWL denoting it is possible there is not a large difference between boroughs.
Figure 18: Directly age standardised (DSR) all ages testicular cancer incidence, 2003-07.
Kingston upon Thames
Sutton Merton Croydon Wandsworth Richmond upon Thames
England
0.0
1.0
2.0
3.0
4.0
5.0
6.0
7.0
8.0
9.0
10.0
Dir
ectl
y St
and
ard
ised
In
cid
ence
Rat
e p
er
10
0,0
00
po
pu
lati
on
Source: UK Cancer Information Service portal, NCIN.
25

Final Version Date of last update: 29 th October 2010
4.8 All age kidney cancer incidence by PCT 2004-06
Wandsworth records the highest incidence of male kidney cancer at 14.4 per 100,000 population, while female incidence is highest in Croydon at 6.1 per 100,000 (Figure 19). Caution must be applied when interpreting this data since these rates are based on very small numbers of incidence. For example the number of cases in Sutton & Merton for males was 18 and the smallest, less than 5 cases in Richmond & Twickenham PCT. Confidence intervals were not available.
Figure 19: Directly age standardised (DSR) all ages kidney cancer incidence, 2004-06.
Sutton & Merton Croydon Richmond & Twickenham Kingston Wandsworth England
0.0
2.0
4.0
6.0
8.0
10.0
12.0
14.0
16.0
Dir
ectl
y St
and
ard-
ised
In-ci
den
ce
Rat
e p
er
10
0,0
00
p
op
ula-
tio
n
Source: Urological Cancer Profiles, SWPHO & NCIN 2010.
4.9 All age penile cancer incidence by Cancer Network 2003-07
The incidence of penile cancer is rare. Of the 5-year (2003-07) period of data available from the UK Cancer Information Service the numbers were too small to produce a rate for each PCT in SWL. During the period of 2003-07 there were 58 incidence of penile cancer in the SWLCN sector. This translates to an age standardised rate of 1.55 per 100,000 population (95% CI 0.82 – 1.97). The majority of cases occurred in the 60 years and older population (National Cancer Intelligence Network 2010).
4.10 All age all person ureter cancer incidence by Cancer Network 2003-07
The incidence of cancer of the ureter is also rare. Between 2003 and 2007 there were 43 new cases of ureters cancer in the SWLCN area. This is an age standardised rate of 0.48 per 100,000 population (95% CI 0.33 – 0.63).
4.11 All age all person urology cancer incidence by PCT and Cancer Network 2002-06
Four of five the PCTs that make up the SWLCN show urology incidence above the national average of 74.1 per 100,000 population (Figure 20). Wandsworth has the highest incidence rate at 88.9 per 100,000 while Sutton & Merton the lowest at 70.6. Reflecting the high incidence in the PCTs the SWLCN records the highest incidence rate across London at 79.2 per 100,000. Confidence intervals were not available.
26
Final Version Date of last update: 29 th October 2010
The data presented here is an average over five years (2002-2006). Urological cancer incidence, extracted from the Cancer Commissioning Toolkit, is not gender specific and grouped to both sexes. As a result, on first glance it may appear that the rate is lower than expected. This is because. for the person Age Standardised Rate the female population is included in the denominator without corresponding events in the numerator for certain organs (e.g. prostate) in this category.
Figure 20: All ages directly age standardised (DSR) urology cancer incidence, 1996-2006 average (PCT & CN).
Sutton & Merton
Richmond & Twickenham
Kingston Croydon Wandsworth (N)WLCN NELCN SELCN NLCN SWLCN Sussex
0.0
10.0
20.0
30.0
40.0
50.0
60.0
70.0
80.0
90.0
Dir
ectl
y St
and
ard-
ised
In-ci
den
ce
Rat
e p
er
10
0,0
00
p
op
ula-
tio
n
National Average 74.1 per 100,000
Source: NHS Cancer Commissioning Toolkit 2010.
27

Final Version Date of last update: 29 th October 2010
5.0 Urological Cancer Prevalence 2006
Cancer prevalence refers to the number of people who have previously received a diagnosis of cancer and who are still alive at a given time point. Some of these patients will have been cured and others will not. Therefore prevalence reflects both the incidence of cancer and its associated survival pattern. Data is presented as individual cancer rather than a group measure under urology.
5.1 One-year prevalence by Cancer Network
In 2006 the SWLCN had an age standardised prevalence rate of prostate cancer (91.1) comparable to other cancer networks in the capital (Table 2). Given the wide confidence intervals of the cancer network data it cannot be ruled out that there is no difference between cancer networks or the national average.
Table 2: Age standardised prostate cancer prevalence, 2006.Cancer Network No. of patients Crude Prevalence ASP* 95% Lower CI 95% Upper CISWLCN 665 86.7 91.1 84.1 98.1WLCN 598 65.1 71.9 66.1 77.8NLCN 675 90.0 97.0 89.6 104.4NELCN 549 71.7 84.3 77.1 91.4SELCN 622 81.7 94.0 86.5 101.4England 26,634 106.9 87.4 86.4 88.5*Age standardised prevalenceSource: National Cancer Intelligence Network (2010d).
Table 3 shows that the SWLCN has the second highest testicular one-year age standardised prevalence in London at 5.3 per 100,000 population. Again the confidence intervals are wide meaning the true value could range widely.
Table 3: Age standardised testicular cancer prevalence, 2006.Cancer Network No. of patients Crude Prevalence ASP* 95% Lower CI 95% Upper CISWLCN 47 6.1 5.3 3.8 6.9WLCN 33 3.6 3.0 1.9 4.0NLCN 51 6.8 6.0 4.3 7.7NELCN 27 3.5 3.1 1.9 4.3SELCN 37 4.9 4.2 2.8 5.7England 1,631 6.5 6.5 6.1 6.8*Age standardised prevalenceSource: National Cancer Intelligence Network (2010d).
The SWLCN has the second highest male one-year age standardised prevalence for cancer of the kidney (+ unspecified urinary organs) in London. Confidence intervals are wide showing that the true value could range widely.
Table 4: Male age standardised cancer of the kidney and unspecified urinary organs prevalence, 2006.Cancer Network No. of patients Crude Prevalence ASP* 95% Lower CI 95% Upper CISWLCN 67 8.7 8.7 6.6 10.8WLCN 62 6.8 7.6 5.7 9.5NLCN 57 7.6 8.2 6.1 10.4NELCN 50 6.5 7.5 5.4 9.6SELCN 69 9.1 10.0 7.6 12.5England 2,595 10.4 9.0 8.7 9.4*Age standardised prevalence
28
Final Version Date of last update: 29 th October 2010
Source: National Cancer Intelligence Network (2010d).
Female one-year kidney prevalence in SWLCN is also the second highest in London behind NELCN (Table 5).
Table 5: Female age standardised cancer of the kidney and unspecified urinary organs prevalence, 2006.Cancer Network No. of patients Crude Prevalence ASP* 95% Lower CI 95% Upper CISWLCN 37 4.6 3.9 2.5 5.2WLCN 21 2.3 2.4 1.3 3.4NLCN 28 3.6 3.3 2.0 4.5NELCN 32 4.1 4.3 2.7 5.8SELCN 23 3.0 2.6 1.5 3.8England 1,541 6.0 4.7 4.5 5.0*Age standardised prevalenceSource: National Cancer Intelligence Network (2010d).
The SWLCN has the highest male bladder cancer prevalence in London but is lower than the England average. Confidence intervals are wide.
Table 6: Male age standardised bladder cancer prevalence, 2006.Cancer Network No. of patients Crude Prevalence ASP* 95% Lower CI 95% Upper CISWLCN 109 14.2 13.7 11.1 16.4WLCN 115 12.5 13.3 10.9 15.8NLCN 100 13.3 14.0 11.2 16.8NELCN 87 11.4 13.0 10.2 15.7SELCN 81 10.6 11.5 8.9 14.0England 4,485 18.0 14.3 13.9 14.8*Age standardised prevalenceSource: National Cancer Intelligence Network (2010d).
Similarly to males the SWLCN also has the highest female bladder cancer prevalence in London, it is also lower than the England average. The confidence intervals are wide.
Table 7: Female age standardised bladder cancer prevalence, 2006.Cancer Network No. of patients Crude Prevalence ASP* 95% Lower CI 95% Upper CISWLCN 43 5.4 4.0 2.7 5.3WLCN 50 5.4 4.5 3.2 5.8NLCN 33 4.2 3.3 2.1 4.6NELCN 38 4.9 4.5 3.0 6.0SELCN 34 4.4 3.4 2.2 4.7England 1,532 5.9 3.8 3.6 4.0*Age standardised prevalenceSource: National Cancer Intelligence Network (2010d).
29

Final Version Date of last update: 29 th October 2010
6.0 Prostate Cancer Staging 2003-07
Only prostate cancer staging data was available for analysis.
The staging data presented reveals that the availability of information on staging, for a cancer at registration is not always present for analysis. Note that this point refers to the availability of information to the Thames Cancer Registry (TCR) for analysis and differs from stating that staging of tumours is not occurring and that medical notes are insufficient. Specifically where the proportion of cases staged by the TCR is low (e.g. SWLCN at 55%), it will be due to the low ascertainment of information used to construct the TCR stage. This is due to the information not being available at the time of registration. It is possible that further information may be added at a later date. This may come from the initial hospital visited or another hospital subsequently visited, for example, in the process of treatment. The sources of information for the TCR are:
Medical notes Pathology Electronic data sent by trust (only occurs at some trusts)
Ultimately if the information (listed above) is not available or it is not immediately apparent in the medical notes, then constructing a TCR stage at diagnosis is not possible. Given the extent of paper medical notes possible for each patient, the TCR cannot invest inordinate amounts of time examining every piece of medical notes for each patient. It must be emphasised that the lack of staging data (as reflected in the SWLCN 2007 proportion – 55%) is due to processes in the ascertainment of the data. It does not mean that the patients did not have their disease staged by their clinician(s) (Thames Cancer Registry 2010a).
The Thames Cancer Registry staging system is as follows:
Table 8: Thames Cancer Registry four level staging system.Stage Description
1 Local (tumour confined to organ of origin).2 Direct extension (tumour has extended into surrounding tissues and
organs).3 Nodal involvement (local nodes are involved).4 Metastases (distant metastases are present).
Source: Thames Cancer Registry (2009).
6.1 PCT staging
A large proportion of tumours have not been staged (NK) by the TCR, the lowest proportion being Wandsworth 42.1% (Figure 21). Of the tumours staged the largest proportions have been diagnosed at stage 1 with Wandsworth the highest with 45.8% of cases at stage 1. In terms of late diagnosis, stage 4, Kingston records the highest proportion at 15.6%, with SWL PCTs ranging from 7.6% in Croydon to 12.4% in Richmond & Twickenham. Unfortunately due to the TCR being unable to stage a large proportion of tumours it is not possible to draw any conclusion from this data with Croydon, Kingston and Sutton & Merton having over 50% of cases recorded as ‘Not Known’.
30
Final Version Date of last update: 29 th October 2010
Figure 21: Percentage of prostate cancer incidence by stage (NK = Not Known) 2003-07 (PCT).
1 2 3 4 NK
0.0%
10.0%
20.0%
30.0%
40.0%
50.0%
60.0%
70.0%
Croydon Kingston Richmond and Twickenham Sutton and Merton Wandsworth
Source: Thames Cancer Network.
6.2 SWLCN staging
As a cancer network, half of its prostate cancer cases were not staged by the TCR (Figure 22). The spread of not staged cancers are evenly spread across the five PCTs. Of those cancers staged, 37.3% are staged at stage 1 for the SWLCN while overall for London it is 44.7% and over half for the TCR region as a whole. One in ten prostate cancers was diagnosed at late stage 4 for the SWLCN as well as London and the TCR region.
Figure 22: Percentage of prostate cancer incidence by stage (NK = Not Known) 2003-07 (Cancer Network).
31

Final Version Date of last update: 29 th October 2010
1 2 3 4 NK
0.00%
10.00%
20.00%
30.00%
40.00%
50.00%
60.00%
SWLCN London SHA South East England
Source: Thames Cancer Network.
7.0 Survival from Urological Cancers
The Cancer Reform Strategy (Department of Health 2007) emphasizes the importance of diagnosing cancer early by screening, raising public awareness of signs and symptoms of cancer and minimising delays in investigation and referral. The overarching goal of NAEDI is to promote earlier diagnosis of cancer and thereby improve survival rates and reduce cancer mortality. Individual cancer survival data is provided by the Thames Cancer Registry, which was obtained from the NCIS, while the grouped urology data was obtained through the NHS Cancer Commissioning Toolkit.
7.1 Bladder cancer one-year relative survival by PCT and Cancer Network 2002-07
Broken down by PCT, Kingston (84.2%) and Wandsworth (81.1%) have the highest estimated one-year male survival rates (Table 9) in SWL as well as being higher than the national average at 78.0%. Confidence intervals were not available, however there was no significant difference between the national average and each PCT. No data was available for male survival in Richmond & Twickenham for Bladder cancer.
Table 9: One-year estimated relative survival rates for bladder cancer by PCT.Primary Care Trust Male (%) Female (%)Croydon 74.7 77.9Kingston 84.2 No dataRichmond & Twickenham No data No dataSutton & Merton 71.6 No dataWandsworth 81.1 63.4England 78.0 63.1Source: Urological Cancer Profiles, SWPHO & NCIN 2010
32

Final Version Date of last update: 29 th October 2010
Female one-year estimated survival rates for bladder cancer shows Croydon to have the highest survival rate at 77.9%, no data was available from 3 PCTs, Kingston, Richmond & Twickenham and Sutton & Merton. Wandsworth PCT has a one-year survival rate similar to the national average at 63.1%.
Benchmarks to compare against are not available for bladder cancer; however the Thames Cancer Registry follows NCIN advice and compares against similar countries to the UK in the absence of a benchmark. Finland, Norway and Sweden were selected as these countries have similar cancer registration features and access to death certification data as the United Kingdom (Thames Cancer Registry 2010b). All cancer networks compare poorly against the countries of Norway, Finland and Sweden. In fact it seems that the male bladder cancer one-year survival has decreased for England. The column identified as ‘UK England’ is taken from the Eurocare study which looked at data from 1995 to 1999. The column marked ‘England’ is taken from the NCIS and is included in the TCR 2007 annual report and is calculated from data between 2002 and 2007. Although caution must be employed as these figures have been estimated from two different sources and time periods, it does allow comparison with European countries.
The cancer networks of SWL and North London have the highest estimated male survival rates in London at 77.0% (95%CI 73.7 – 80.4) and 77.8% (95%CI 74.2 – 81.5) respectively (Figure 23). However the confidence intervals overlap with other network estimates showing that it is possible that one-year male bladder cancer is similar across London. The survival rate in SWL is also comparable to the national average at 76.8% (95%CI 76.2 – 77.3 – 2002-07 period).
Figure 23: Male one-year (2002-07) estimated relative survival rates for bladder cancer by cancer network with comparable countries from the Eurocare 4 study.
Sussex C
N
Kent &
Medw
ay CN
North
East Lo
ndon CN
Surr
ey, West
Suss
ex & H
ampsh
ire C
N
North W
est Lo
ndon C
N
South E
ast Lo
ndon CN
South
West
Lond
on CN
North
London C
N
Centr
al South
Coast
CN
London S
HA
South E
ast C
oast S
HA
England
UK Eng
land
Finla
nd
Norway
Sweden
0.0
10.0
20.0
30.0
40.0
50.0
60.0
70.0
80.0
90.0
100.0
Pe
rce
nt
ag e
Eurocare 4 Study
Source: Cancer in South East England 2007 Report, Thames Cancer Registry, 2010.
Female one-year survival estimates are substantially below males, in SWL the female survival rate is estimated to be between 2.6% and 21.3% lower than males (Figure 24). Similar differences are seen across the TCR region as well as nationally. Overall the same pattern can be seen for female bladder cancer as for males with SWL (65.1% 95%CI 59.1 – 71.1) and North London (70.7% 95%CI 64.1 – 77.2) having the highest survival rates in the capitol. Also the national survival rate appears to have similarly decreased for females between the Eurocare-4 study and the estimates created by the NCIN and produced in the 2007 TCR report.
33

Final Version Date of last update: 29 th October 2010
Figure 24: Female one-year (2002-07) estimated relative survival rates for bladder cancer by cancer network with comparable countries from the Eurocare 4 study.
Sussex C
N
South Ea
st Lo
ndon CN
Kent &
Medw
ay CN
North Ea
st Lo
ndon CN
North W
est Lo
ndon C
N
Surrey, W
est Suss
ex & H
amps
hir...
South
West
Lond
on CN
Centra
l South
Coast
CN
North L
ondon CN
London SHA
South Ea
st C
oast SHA
England
UK Eng
land
Finla
nd
Norway
Sweden
0.0
10.0
20.0
30.0
40.0
50.0
60.0
70.0
80.0
90.0
Pe
rce
nt
ag e
Eurocare 4 Study
Source: Cancer in South East England 2007 Report, Thames Cancer Registry, 2010.
7.2 Bladder cancer five-year relative survival by Cancer Network 1998-02
Five-year bladder cancer survival rates have been estimated from patients diagnosed between 1998 and 2002 with the last year of follow-up being 2006. The SWLCN male 5-year bladder cancer relative survival is ranked in the middle of London cancer networks with a survival rate of 59.0% (Figure 25). It is not significantly different from the national average of 63.0%.
Figure 25: Male five-year (1998-2002) estimated relative survival rates for bladder cancer by cancer network.
Kent & Medway Sussex SELCN NELCN SWLCN NLCN (N)WLCN Surrey, West Sussex &
Hamphire
Central South Coast
0
10
20
30
40
50
60
70
Per
cen
tag
e
National Average 63.0%
Source: Urological Cancer Profiles, SWPHO & NCIN 2010.
The SWLCN female 5-year bladder cancer relative survival is the highest in London at 52.4%, however no confidence intervals were available (Figure 26). This rate is similar to the national average.
Figure 26: Female five-year (1998-2002) estimated relative survival rates for bladder cancer by cancer network.
34

Final Version Date of last update: 29 th October 2010
Kent & Medway Sussex NELCN SELCN NLCN (N)WLCN SWLCN Surrey, West Sussex &
Hamphire
Central South Coast
0
10
20
30
40
50
60
Per
cen
tag
e
National Average 52.3%
Source: Urological Cancer Profiles, SWPHO & NCIN 2010.
7.3 Prostate cancer one-year relative survival by PCT and Cancer Network 2002-07
The Cancer Reform Strategy (Department of Health 2007) acknowledges the lack of data concerning the staging of cancers and suggests that one-year cancer survival rates are a good proxy for late presentation of cases. The survival analysis was based on a cohort of cancer patients aged between 0 and 99 years, diagnosed between 2002 and 2006, and follow-up was to the end of 2007. The cohort approach was used to estimate the relative survival. The NCIN have developed benchmarks of good performance on cancer one-year survival rates for all persons. They are based on data from the EUROCARE-4 study where “Average” is based on the average one-year survival rate for those diagnosed between 1995 and 1999. “Good practice” is based on the average achieved across a whole country by the best performing countries (Department of Health 2009). These benchmarks are highlighted in the figures of this section.
Broken down by PCT, Croydon (94.9% 95%CI 92.9 – 96.8) and Kingston (94.2% 95%CI 90.9 – 97.6) have the highest one-year survival rates (Figure 27). The estimated survival rate for Richmond & Twickenham (88.2% 95%CI 84.4 – 91.9) is significantly below all the other SWL PCTs as well as the benchmarks by a relatively large margin. The other PCTs in SWL perform around the “Average” and “Good Practice” Eurocare benchmarks. Given the small number of deaths within PCTs the confidence intervals are wide meaning that it possible for the true value of Kingston and Sutton & Merton to be below the “Average” benchmarks or above the “Good Practice” benchmark.
Figure 27: One-year (2002-07) estimated relative survival rates for prostate cancer by PCT with NCIN developed benchmark from the Eurocare 4 study.
35

Final Version Date of last update: 29 th October 2010
Richmond & Twickenham Wandsworth Kingston Sutton & Merton Croydon
84
86
88
90
92
94
96
98
Ag e sta
nd-
ar-
dis
ed
re-
lat-
ive
one
yea
r sur
viv
al
rat
e (%)
Average
Good practice
Source: NCIN/APHO/UKACR from Cancer e-Atlas 2010.
Figure 28 shows that the SWLCN performance on prostate cancer one-year survival is estimated to be above the Eurocare “Average” benchmark but below the “Good Practice” benchmark. For the period of study (between 2002 and 2007) it is estimated that 93.9% (95%CI 92.8 – 94.9) of males diagnosed with prostate cancer were still alive a year later in the SWLCN area. The SWLCN is second to only the NLCN as the highest survival rate in London. However the confidence intervals overlap meaning that the true value of survival in SWLCN may be similar to some networks in the region as well as the national average. However the SWLCN survival rate is significantly higher than the regional average and the rates of Sussex, the SELCN, Kent & Medway and the NWLCN.
Figure 28: One-year (2002-07) estimated relative survival rates for prostate cancer by cancer network with Eurocare 4 study benchmarks.
36

Final Version Date of last update: 29 th October 2010
Sussex CN South East London CN
Kent & Medway CN
North West London CN
North East London CN
Surrey, West Sussex & Hampshire
CN
South West London CN
Central South Coast
CN
North London CN
London SHA South East Coast SHA
England
86.0
88.0
90.0
92.0
94.0
96.0
98.0
Pe rce
nt ag e
Average
Good practice
Source: Cancer in South East England 2007 Report, Thames Cancer Registry, 2010.
7.4 Prostate cancer five-year relative survival by PCT and Cancer Network 1998-02
Five-year prostate cancer survival rates have been estimated from patients diagnosed between 1998 and 2002 with the last year of follow-up being 2006. Sutton & Merton PCT has the highest 5-year relative survival rate at 84.1%, and is significantly higher than the national average (Figure 29). Five-year survival is lowest at Richmond & Twickenham following the same pattern as for one-year survival. Confidence intervals were not available; however significant differences were noted when present.
Figure 29: Five-year (1998-2002) estimated relative survival rates for prostate cancer by PCT.
Richmond & Twickenham Croydon Kingston Wandsworth Sutton & Merton England
70
72
74
76
78
80
82
84
86
Ag e
sta
nd- ar-
dis ed
re
-la
t-iv
e
on
e
ye
ar su
rv
iv al
rat
e
(%)
Source: NCIN/APHO/UKACR from Cancer e-Atlas 2010.
The SWLCN 5-year prostate cancer relative survival is significantly higher than the national average (79.0%) at 81.5%. After NLCN it is the highest 5-year survival rate in London (Figure 30). Confidence intervals were not available; however significant differences were noted when present.
37
Final Version Date of last update: 29 th October 2010
Figure 30: Five-year (1998-2002) estimated relative survival rates for prostate cancer by cancer network.
Kent & Medway
SELCN NELCN Sussex (N)WLCN Surrey, West Sussex &
Hamphire
SWLCN NLCN Central South Coast
England
61
66
71
76
81
86
Per
cen
tag
e
Source: Urological Cancer Profiles, SWPHO & NCIN 2010.
7.5 Kidney cancer one-year relative survival by PCT 1998-02
Wandsworth PCT has the highest one-year survival rate in SWL, nearly 16% higher than the national average (Table 10). All PCTs in SWL have higher survivals rates than the England average, except for Kingston where no data was available. There was no data available for Women.
Table 10: Male one-year (1998-02) estimated relative survival rates for kidney cancer by PCT.Primary Care Trust Survival Rate (%)Croydon 71.9Kingston No dataRichmond & Twickenham 72.2Sutton & Merton 70.8Wandsworth 82.3England 66.6Source: Urological Cancer Profiles, SWPHO & NCIN 2010
7.6 Kidney cancer five-year relative survival by PCT 1998-02
Male five-year survival rates are considerably better than females in SWL, as much as nearly 16% in Croydon. Contrastingly, national five-year survival rates are similar. Sutton & Merton record the highest 5-year relative survival rates at 59.1% for males and 47.1% for females (Table 11). Richmond & Twickenham record the lowest for males at 36.7% and Croydon the lowest for females at 33.3%. Confidence intervals were not available.
Table 11: Male and female five-year (1998-02) estimated relative survival rates for kidney cancer by PCT.Primary Care Trust Survival Rate (%) Survival Rate (%)Croydon 49.0 33.3Kingston 41.7 37.1Richmond & Twickenham 36.7 No dataSutton & Merton 59.1 47.1Wandsworth 53.8 46.4England 47.9 47.7Source: Urological Cancer Profiles, SWPHO & NCIN 2010
7.7 Urology cancer one-year relative survival by PCT and Cancer Network 2002-07
The all person one-year relative urology cancer survival rates in the SWL PCTs are similar to the national average at 94.1% (Figure 31). The highest survival rate is in Croydon at 94.4% and the
38

Final Version Date of last update: 29 th October 2010
lowest in Richmond & Twickenham at 89.8%. There were no confidence intervals available. The one-year cohort relative survival estimates for persons have been extracted from the Cancer Information Service (CIS) database by rolling 3 year cohorts (1990-1992, 1991-1993 ... 2003-2005).
Figure 31: All persons one-year estimated relative survival rates for urological cancers by SWL PCT.
Richmond & Twickenham Wandsworth Sutton & Merton Kingston Croydon
0
10
20
30
40
50
60
70
80
90
100
Ag e sta
nd-
ar-
dis
ed
re-
lat-
ive
one
yea
r sur
viv
al
rat
e (%)
National Average 94.1%
Source: NHS Cancer Commissioning Toolkit 2010.
Reflecting the survival rates at the PCT level the SWLCN has an overall survival rate for urologic cancers similar to the national average at 93.6% (Figure 32).
Figure 32: All persons one-year estimated relative survival rates for urological cancers by SWL PCT.
Sussex SELCN (N)WLCN Kent & Medway NELCN Surrey, West Sussex &
Hamphire
SWLCN NLCN Central South Coast
0
10
20
30
40
50
60
70
80
90
100
Ag e sta
nd-
ar-
dis
ed
re-
lat-
ive
one
yea
r sur
viv
al
rat
e (%)
National Average 94.1%
Source: NHS Cancer Commissioning Toolkit 2010.
7.8 Urology cancer five-year relative survival by PCT and Cancer Network 1998-02
Four out of five PCTs in SWL have 5-year relative survival rates higher than the national average, which is 79.4%. The highest survival rate is in Sutton & Merton at 86.4% and the lowest in Richmond & Twickenham at 72.4% (Figure 33).
39

Final Version Date of last update: 29 th October 2010
Figure 33: All persons five-year estimated relative survival rates for urological cancers by SWL PCT.
Richmond & Twickenham Croydon Wandsworth Kingston Sutton & Merton
65
70
75
80
85
90
A ge
st an
da rd is ed
re la ti
v e
on e
ye ar
su rv iv al
ra te
(% )
National Average 79.4%
Source: NHS Cancer Commissioning Toolkit 2010.
Again similarly to the one-year relative survival rate and reflecting the high rates in most SWL PCTs the 5-year survival rate in SWLCN is above the national average at 82.6% (Figure 34). Along with North London it is the highest rate in London.
Figure 34: All persons five-year estimated relative survival rates for urological cancers by SWL PCT.
Kent & Medway SELCN NELCN (N)WLCN Surrey, West Sussex &
Hamphire
Sussex SWLCN NLCN Central South Coast
65
70
75
80
85
90
A g e s t a n d a r d i s e d r e l a t i v e o n e y e a r s u r v i v a l r a t e ( % )
A g e s t a n d a r d i s e d r e l a ti v e o n e y e a r s u r v i v a l r a t e ( % )
National Average 79.4%
Source: NHS Cancer Commissioning Toolkit 2010.
Providing comparisons and a benchmark to aim for is valid. The difference in survival rates between the UK and European rates may not only be due to later presentation in the UK but also additional factors such as data quality, tumour-related factors, host factors and healthcare-related factors (Thomson and Forman 2009, Brewster 2010). However comment and research does state that poor survival in the UK compared to other European countries is associated with more advanced stage at presentation (Imperatori et al. 2006, Richards 2009, Brewster 2010, Crawford 2010).
40

Final Version Date of last update: 29 th October 2010
8.0 Urological Cancer Mortality
8.1 Under 75 bladder cancer mortality by PCT 2006-08
The number of under 75 bladder cancer mortality is small therefore male and female figures are combined here (Table 12). Variation between PCTs cannot be determined since the confidence intervals are large due to the small number of people dying from bladder cancer.
Table 12: Persons directly age standardised (DSR) under 75 years bladder cancer mortality, 2006-08.PCT Number DSR 95% Confidence Intervals
Lower UpperCroydon 24 2.58 1.54 3.61Kingston 8 1.96 0.60 3.31Richmond & Twickenham
10 2.04 0.77 3.3
Sutton & Merton 14 1.38 0.65 2.11Wandsworth 15 2.73 1.34 4.11London 382 2.06 1.85 2.27England 3,982 2.37 2.30 2.45Source: Clinical and Health Outcomes Knowledge Base, National Centre for Health Outcomes Development (NCHOD).
8.2 All age bladder cancer mortality by PCT 2006-08
NHS Richmond & Twickenham records the highest male bladder cancer mortality in SWL at 9.58 per 100,000 population (95%CI 6.06 – 13.10) (Figure 35). Female mortality is highest in Wandsworth at 2.85 per 100,000 (95%CI 1.29 – 4.41). Caution must be adhered to in interpreting these mortality data as the numbers are small as evidenced by the wide confidence intervals.
Figure 35: Directly age standardised (DSR) under 75 years bladder cancer mortality, 2006-08.
Wandsworth Teach-ing
Sutton & Merton Croydon Kingston Richmond & Twick-enham
London SHA ENGLAND
0.0
2.0
4.0
6.0
8.0
10.0
12.0Males Females Persons
Dir
ectl
y S
tan
dard
ised
In
cid
en
ce R
ate
per
10
0,0
00
p
op
ula
tio
n
Source: Clinical and Health Outcomes Knowledge Base, National Centre for Health Outcomes Development (NCHOD).
8.3 All persons all ages bladder cancer mortality by PCT 1993-95 to 2006-08 (3-year rolling average)
Due to small numbers of deaths, male and female figures have been combined (Figure 36). Despite this the trend over time still appears erratic particularly in Richmond & Twickenham. However the predominant overall trend is that bladder cancer mortality for all persons of all ages has gradually decreased over time. The largest decrease is recorded for Wandsworth, 29.4%, followed by Richmond & Twickenham at 27.9%. Croydon reveals an increase of 11.4% but only 0.46 per 100,000 in the rate. The range of mortality for 2006-08 is from 3.88 per 100,000 in Sutton & Merton to 4.87 in Richmond & Twickenham.
41
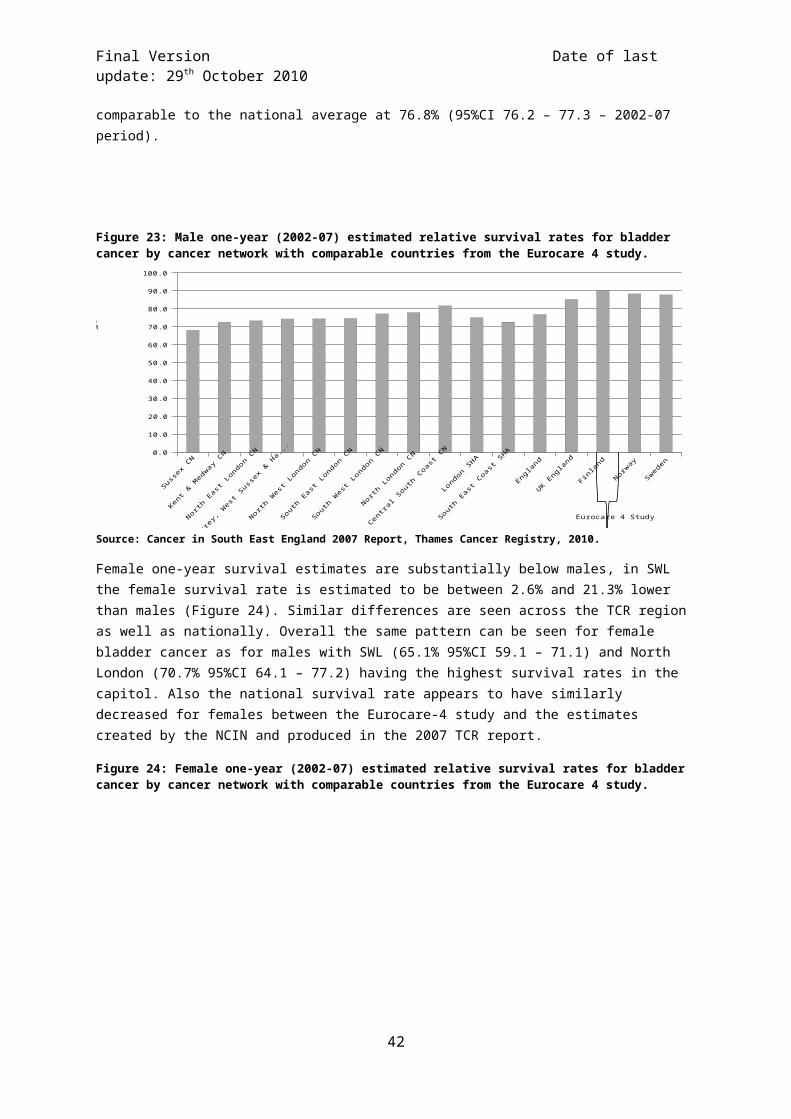
Final Version Date of last update: 29 th October 2010
Figure 36: All persons directly age standardised (DSR) under 75 years bladder cancer mortality, 1995-2008 3-year rolling average.
1993-95 1994-96 1995-97 1996-98 1997-99 1998-00 1999-01 2000-02 2001-03 2002-04 2003-05 2004-06 2005-07 2006-08
3.00
4.00
5.00
6.00
7.00
8.00
9.00Croydon Kingston
Wandsworth Teaching Richmond & Twickenham
Sutton & Merton London SHA
ENGLAND
Dire
ctly
St
anda
rdis
ed
Inci
denc
e
Rate
per
10
0,00
0
popu
latio
n
Source: Clinical and Health Outcomes Knowledge Base, National Centre for Health Outcomes Development (NCHOD).
8.4 Under 75 prostate cancer mortality by PCT 2006-08
Croydon records the highest premature mortality from prostate cancer in SWL at 11.07 per 100,000 population (95%CI 7.93 – 14.20) with Kingston the lowest at 5.83 per 100,000 (95%CI 2.38 – 9.29). Given the low number of deaths, 11 in Kingston over 3 years, the confidence intervals are wide (Figure 37).
Figure 37: Directly age standardised (DSR) under 75 years prostate cancer mortality, 2006-08.
Kingston Sutton & Merton Richmond & Twick-enham
Wandsworth Teach-ing
Croydon London SHA ENGLAND
0.0
2.0
4.0
6.0
8.0
10.0
12.0
Dir
ectl
y St
and
ard
-is
ed In
cid
ence
Rat
e p
er
10
0,0
00
po
pu
lati
on
Source: Clinical and Health Outcomes Knowledge Base, National Centre for Health Outcomes Development (NCHOD).
8.5 All age prostate cancer mortality by PCT 2006-08
The highest mortality is recorded for Croydon at 27.00 per 100,000 population (95%CI 22.64 – 31.36) and the lowest in Kingston 19.14 per 100,000 (95%CI 13.82 – 22.45). Premature death from prostate cancer is occurring to a greater degree in Croydon and Wandsworth compared to the other PCTs in SWL, since under 75 mortality accounts for more of the total mortality (rates in Figure 37 and Figure 38) from prostate cancer in these two PCTs.
42

Final Version Date of last update: 29 th October 2010
Figure 38: Directly age standardised (DSR) all age prostate cancer mortality, 2006-08.
Kingston Sutton & Merton Wandsworth Teach-ing
Richmond & Twick-enham
Croydon London SHA ENGLAND
0.0
5.0
10.0
15.0
20.0
25.0
30.0
Dir
ectl
y St
and
ard
ised
In
cid
ence
Rat
e p
er
10
0,0
00
po
pu
lati
on
Source: Clinical and Health Outcomes Knowledge Base, National Centre for Health Outcomes Development (NCHOD).
8.6 All age prostate cancer mortality by PCT 1993-95 to 2006-08 (3-year rolling average)
The overall trend for prostate cancer in SWL has been a reduction in the mortality rate (Figure 39). The largest reduction is seen in Kingston where the mortality rate (3-year rolling) has dropped by 37.4% to 19.14 per 100,000. The lowest reduction is recorded for Croydon at 6.8% from 1993-95 to 2006-08.
Figure 39: All persons directly age standardised (DSR) under 75 years prostate cancer mortality, 1993-2008 3-year rolling average.
1993-95 1994-96 1995-97 1996-98 1997-99 1998-00 1999-01 2000-02 2001-03 2002-04 2003-05 2004-06 2005-07 2006-08
15.00
20.00
25.00
30.00
35.00
40.00Croydon KingstonWandsworth Teaching Richmond & TwickenhamSutton & Merton London SHAENGLAND
Dire
ctly
St
and
ardi
sed
Inci
denc
e
Rate
per
10
0,00
0
popu
latio
n
Source: Clinical and Health Outcomes Knowledge Base, National Centre for Health Outcomes Development (NCHOD).
8.7 All age kidney cancer mortality by PCT 2004-06
Table 13 shows all age mortality for kidney cancer in SWL’s PCTs. The mortality rate is low and in some cases too low (less than five cases) to generate a rate, therefore the data is suppressed. Croydon has a low rate for males compared to other PCTs, however these figures will be based on a small number of cases (i.e. 6 deaths in Croydon). Note that mortality data for kidney cancer is for a different 3-year period to bladder (sections 8.1 & 8.2) and prostate cancer (8.4 & 8.5).
43

Final Version Date of last update: 29 th October 2010
Table 13: Directly age standardised (DSR) all age kidney cancer mortality, 2004-06.
Primary Care Trust DSR per 100,000Male Female
Croydon 3.8 2.5Kingston 6.5 SuppressedRichmond & Twickenham Suppressed SuppressedSutton & Merton 6.0 2.5Wandsworth 5.4 SuppressedEngland 5.9 2.7Source: Urological Cancer Profiles, SWPHO & NCIN 2010.
8.8 All age testicular and penile cancer mortality 2004-08
Mortality from testicular and penile cancer is rare. For the 5-year time period (2003-07) that data was available the number of deaths were too small to generate rates for individual PCTs and cancer networks. For this period there were 286 deaths from testicular cancer in England at an age standardised rate of 0.22 per 100,000 population (95% CI 0.19 – 0.24). There were 480 from penile cancer in England at a rate of 0.28 per 100,000 population (95% CI 0.25 – 0.30).
8.9 All age all person ureter cancer mortality 2004-08
Similarly for mortality from cancer of the ureter the number of deaths was too small to generate rates for PCTs and cancer networks. Between 2004 and 2008 there were 498 deaths nationally. This is an age standardised rate of 0.13 per 100,000 per 100,000 population (95% CI 0.12 – 0.14).
8.10 All age all person urological cancer mortality by PCT 2003-07
Urological cancer mortality in SWL is below the national average, which was at a rate of 20.0 per 100,000 population for 2002-07 (Figure 40). The highest rate is recorded for Croydon at 19.8 per 100,000 while Sutton & Merton records the lowest at 17.0. On a sector level the SWLCN has similar mortality rates to the other cancer networks in London except (N)WLCN.
Figure 40: Directly age standardised (DSR) all age urologic cancer mortality, 2007.
Sutton & Merton
Richmond & Twickenham
Kingston Wandsworth Croydon (N)WLCN NLCN SWLCN SELCN NELCN
15.0
16.0
17.0
18.0
19.0
20.0
21.0
Dir
ectl
y St
and
ard
-is
ed In-
cid
ence
R
ate
per
1
00
,00
0
po
pu
la-ti
on
National Average 20.0 per 100,000
Source: NHS Cancer Commissioning Toolkit 2010.
Urological cancer mortality, extracted from the Cancer Commissioning Toolkit, is not gender specific and grouped to both sexes. As with incidence as a result, on first glance it may appear that the rate is lower than expected. This is because the person Age Standardised Rate has had female population added to the denominator without a corresponding increase in events in the numerator (e.g. prostate) in this category.
44

Final Version Date of last update: 29 th October 2010
9.0 Emergency Admissions
9.1 All cancer emergency admissions by GP Practice 2008-09
Data in this section include all emergency admissions with an invasive cancer code (ICD-10 C00-C97, excluding C44) present in any diagnostic field and were originally extracted from the national HES database. Data by cancer site was not available. The figures are crude rates expressed per 100,000 persons of emergency in-patient or day-case admissions. As these are crude rates it is not suitable to compare between PCTs. Emergency admissions may occur at any stage of the cancer pathway and will include persons diagnosed with cancer in prior years. This indicator may be expected to be higher in practices with an unusually high fraction of persons of 65+ years of age, due to the higher incidence of cancer at these ages. This must be considered when/if GP practices with high rates are investigated. Where the number of referrals for a GP practice was less than 5, no rate has been released nor has the GP practice been identified.
9.1.1 Croydon
Figure 41 shows the variation in emergency admissions by GP practice across Croydon PCT. The highest admission rate is 1349.21 per 100,000 population (95%CI 1004.49 – 1774.00) at practice H83029 and is significantly higher than the PCT average (610.41 95%CI 585.49 – 636.12). Six other GP practices record admission rates significantly higher than the PCT average. They are practices H83619, H83031, H83033, H83019, H83050 and H83015.
Figure 41: Croydon all cancer emergency admissions crude rate per 100,000 population.
H8
30
41
H8
30
51
H8
36
08
H8
36
25
H8
30
25
H8
36
20
H8
36
34
H8
30
43
H8
30
09
H8
30
23
H8
30
37
H8
30
30
H8
30
44
H8
30
05
H8
36
26
H8
30
53
H8
30
20
H8
36
22
H8
30
11
H8
36
27
H8
30
17
H8
30
52
H8
30
07
H8
36
35
H8
36
11
H8
30
18
H8
30
39
H8
30
40
H8
36
09
H8
30
42
H8
36
23
H8
30
24
H8
30
21
H8
36
24
H8
30
10
H8
30
02
H8
30
34
H8
30
04
H8
30
13
H8
30
06
H8
36
16
H8
30
49
H8
30
46
H8
30
14
H8
30
16
H8
30
27
H8
30
12
H8
30
35
H8
30
01
H8
30
22
H8
30
28
H8
30
15
H8
30
48
H8
30
50
H8
30
08
H8
30
19
H8
30
33
H8
36
14
H8
30
31
H8
36
19
H8
30
290.00
200.00
400.00
600.00
800.00
1000.00
1200.00
1400.00
1600.00PCT Average
England Average
Ca
n-
ce
r
Em
e
rge
n
cy
Ad-
mis-
sio
ns
pe
r
100
,
000
po
p-
ula-
tio
n
Source: Practice Profiles, NHS Cancer Commissioning Toolkit.
The lowest admission rate is 146.88 per 100,000 population (95%CI 53.63 – 319.70) at practice H83041. This rate is also significantly lower than the PCT average. A further three GP practices record cancer admission rates significantly below the PCT average; they are H83051, H83625 and H83025. One GP practice records less than five admissions over 2008-09.
9.1.2 Kingston
Five GP practices, H84015, H84049, H84607, H84053 and H84033 record an all cancer emergency admission rate that is significantly higher than the PCT average which is calculated at 506.50 per 100,000 population (95%CI 472.50 – 542.27). The highest rate is 1359.91 per 100,000 (95%CI 1090.65 – 1675.48) at practice H84015 (Figure 42).
45

Final Version Date of last update: 29 th October 2010
The lowest admission rate is 200.32 per 100,000 population (95%CI 64.56 – 467.48) at practice Y02379. This rate is also significantly lower than the PCT average. A further three GP practices record cancer admission rates significantly below the PCT average; they are H84020, H84025 and H84619. One GP practice records less than five admissions in 2008-09.
Figure 42: Kingston all cancer emergency admissions crude rate per 100,000 population.
Y0
23
79
H8
40
20
H8
40
25
H8
40
51
H8
46
19
H8
40
54
H8
40
16
H8
40
30
H8
46
29
H8
46
18
H8
50
55
H8
40
27
H8
40
34
H8
46
37
H8
40
58
H8
40
08
H8
46
35
H8
40
50
H8
40
62
H8
40
33
H8
40
53
H8
46
07
H8
40
49
H8
40
15
0.00
200.00
400.00
600.00
800.00
1000.00
1200.00
1400.00
1600.00
1800.00PCT Average
England Average
Can-
cer
Em
er
gency
Ad-
mis-
sio
ns
per
100,0
00
popu
-
lation
Source: Practice Profiles, NHS Cancer Commissioning Toolkit.
9.1.3 Richmond & Twickenham
Richmond & Twickenham has an average cancer admission rate of 536.97 per 100,000 population (95%CI 505.10 – 570.33) (Figure 43). Four GP practices record admission rates significantly higher than the PCT average. These practices include; H84060, H84018, H84031 and H84032. The highest admissions rate was 1272.17 per 100,000 population (95%CI 993.53 – 1604.70) at practice H84060.
Figure 43: Richmond & Twickenham all cancer emergency admissions crude rate per 100,000 population.
H8
46
25
H8
46
15
H8
40
05
H8
40
41
Y0
12
06
H8
46
30
H8
40
14
H8
46
08
H8
40
17
H8
46
33
H8
46
23
H8
40
12
H8
46
32
H8
40
43
H8
40
23
H8
40
44
H8
40
02
H8
40
07
H8
40
36
H8
40
55
H8
40
39
H8
40
40
H8
40
06
H8
40
48
H8
40
59
H8
40
32
H8
40
31
H8
40
18
H8
40
600.00
200.00
400.00
600.00
800.00
1000.00
1200.00
1400.00
1600.00PCT Average
England Average
Ca
n
cer
Em
e
rgen
cy
Ad
mis-
sio
n
s per
100
,
000
pop
ula-
tion
Source: Practice Profiles, NHS Cancer Commissioning Toolkit.
The lowest admission rate was 246.36 per 100,000 population (95%CI 127.15 – 430.36) at practice H84625. This rate was significantly lower than the PCT average. Two other GP practices also record an admission rate significantly below the PCT average; they are H84005 and Y01206. Two GP practices recorded less than five admissions.
9.1.4 Sutton & Merton
Figure 44 shows the variation in cancer emergency admissions by GP practice across Sutton & Merton PCT. The highest admission rate was 1858.19 per 100,000 population (95%CI 1314.79 – 2550.60) at practice H85108 and is significantly higher than the PCT average (634.87 95%CI 609.88
46

Final Version Date of last update: 29 th October 2010
– 660.63). A further seven GP practices record admission rates significantly higher than the PCT average. They are practices H85110, H85683, H85032, H85653, H85038, H85030, and H85037.
Figure 44: Sutton & Merton all cancer emergency admissions crude rate per 100,000 population.
H8
51
12
H8
50
22
H8
56
49
H8
56
34
H8
50
27
H8
50
28
H8
56
86
H8
50
92
H8
56
62
H8
50
90
H8
50
78
H8
56
74
H8
50
26
H8
50
70
H8
50
95
H8
50
34
H8
50
86
H8
50
29
H8
50
72
H8
50
21
H8
51
05
H8
50
18
H8
56
93
H8
50
24
H8
50
33
H8
50
35
H8
56
18
H8
51
16
H8
51
15
H8
50
63
H8
50
23
H8
56
65
H8
51
03
H8
51
01
H8
50
53
H8
50
54
H8
50
25
H8
50
20
H8
50
31
H8
50
76
H8
50
19
H8
50
64
H8
50
16
H8
50
37
H8
50
30
H8
51
13
H8
50
38
H8
56
53
H8
50
32
H8
56
83
H8
51
10
H8
51
080.00
500.00
1000.00
1500.00
2000.00
2500.00PCT Average
England Average
Ca
n-
ce
r
Em
e
rge
n
cy
Ad-
mis-
sion
s
pe
r
10
0,
00
0
po
p-
ula-
tio
n
Source: Practice Profiles, NHS Cancer Commissioning Toolkit.
The lowest admission rate is 88.42 per 100,000 population (95%CI 28.49 – 206.34) at practice H85112. This rate is also significantly lower than the PCT average. Six other GP practices record cancer admission rates significantly below the PCT average; they are, H85022, H85649, H85634, H85027, H85028 and H85686. One GP practice records less than 5 emergency admissions in 2008-09.
9.1.5 Wandsworth
Wandsworth has an average cancer admission rate of 443.07 per 100,000 population (95%CI 420.53 – 466.51). Six GP practices record admission rates significantly higher than the PCT average (Figure 45). These practices include; H85006, H85643, H85005, H85067, H85008 and H85045. The highest admissions rate was 840.49 per 100,000 population (95%CI 615.29 – 1121.13) at practice H85006.
Figure 45: Wandsworth all cancer emergency admissions crude rate per 100,000 population.
Y0
11
32
H8
50
12
H8
51
07
H8
50
49
H8
56
80
H8
50
48
H8
50
57
H8
50
87
H8
50
77
H8
51
14
H8
56
82
H8
50
01
H8
56
88
H8
50
66
H8
56
59
H8
50
04
H8
50
88
H8
50
09
H8
51
00
H8
50
41
H8
56
64
H8
50
61
H8
50
39
H8
50
69
H8
50
65
H8
51
11
H8
50
56
H8
50
11
H8
50
02
H8
50
47
H8
50
03
H8
56
95
H8
50
52
H8
50
07
H8
50
75
H8
50
82
H8
50
45
H8
50
08
H8
56
37
H8
50
67
H8
50
05
H8
56
43
H8
50
060.00
200.00
400.00
600.00
800.00
1000.00
1200.00
PCT Average
England Average
Ca
n-
cer
Em
er-
ge
ncy
Ad-
mis-
sio
ns
pe
r
100
,00
0 p
op-
ula
tion
Source: Practice Profiles, NHS Cancer Commissioning Toolkit.
Two GP practice recorded no emergency admissions for 2008-09. The lowest rate was 171.56 per 100,000 population (95%CI 98.00 – 278.63) at practice Y01132. This rate was significantly below the PCT average. Four other practices, H85012, H85049, H85680 and H85048 also recorded an emergency admission rate below the PCT average.
47
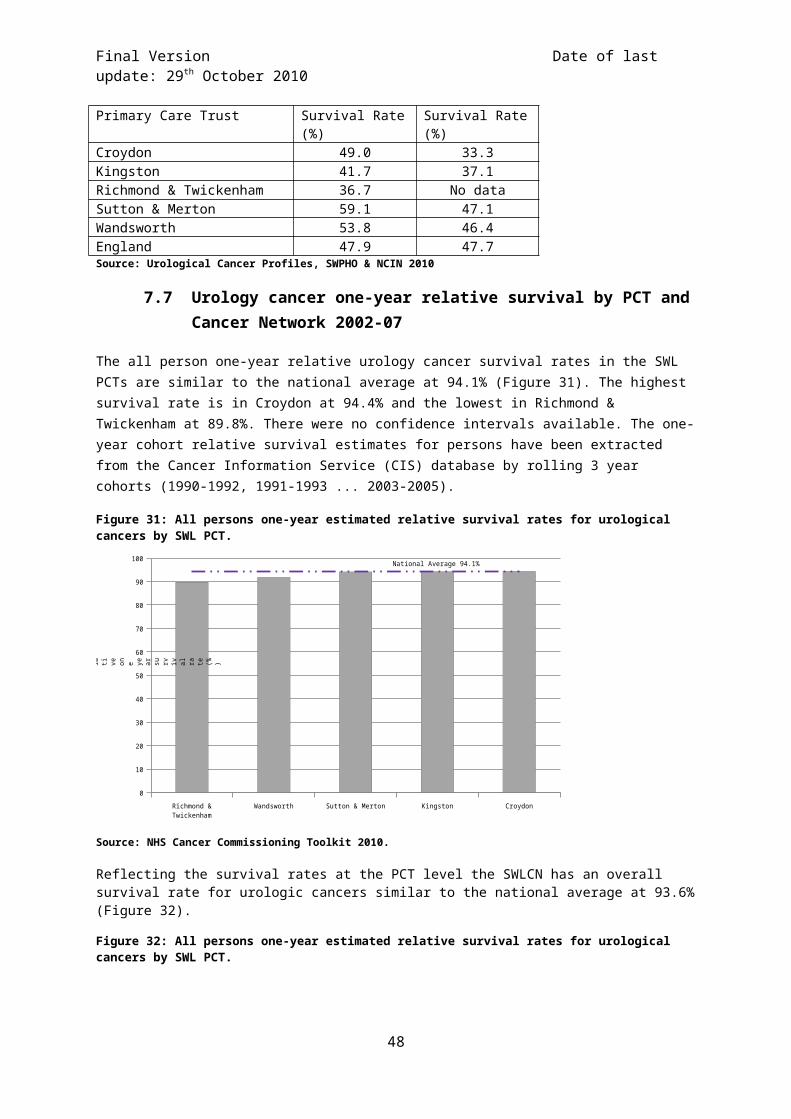
Final Version Date of last update: 29 th October 2010
10.0 Cancer Referrals
10.1 Urgent two week wait (2WW) referrals for suspected cancer 2009 by GP Practice
Urological cancer specific referral data was not available therefore all cancer referral rates have been included as a substitute. Patient level Cancer Waiting Times data (including patient identifiers) was sourced from the Department of Health Cancer Waiting Times Database by the Trent Cancer Registry. Each patient was traced to a GP Practice using the Open Exeter Batch Tracing Service Two Week Wait Referrals were identified for patients with a date first seen on the CWT database in 2009. All records with a ‘Referral Priority Type’ of 3 (Two Week Wait) were counted, excluding patients referred for non-cancer breast symptoms. The data included the number of Two Week Wait referrals with a suspicion of cancer, whether or not cancer was subsequently diagnosed. This indicator may be expected to be higher in practices with an unusually high proportion of persons of 65+ years of age, due to the higher incidence of cancer at these ages. In many cases the number of referrals will be small resulting in large confidence intervals. Where the number of referrals for a GP practice was less than 5, no rate has been released nor has the GP practice been identified.
10.1.1 Croydon
The average 2WW crude referral rate for suspected cancer in Croydon for 2009 was 1092.41 per 100,000 population (95%CI 1058.99 – 1126.63) (Figure 46). Thirteen GP practices record a referral rate that is significantly higher than the PCT average. They are: H83035, H83048, H83009, H83013, H83016, H83014, H83052, H83015, H83004, H83029, H83018, H83001 and H83024. The highest referral rate is 2990.30 per 100,000 population (95%CI 2459.89 – 3601.14) at practice H83035.
Figure 46: Croydon urgent 2WW referrals for suspected cancer, crude rate per 100,000 population.
H8
30
30
H8
36
23
H8
36
25
H8
30
23
H8
36
34
H8
36
22
H8
30
19
H8
30
42
H8
30
21
H8
36
08
H8
30
51
H8
36
26
H8
36
11
H8
30
10
H8
36
35
H8
30
40
H8
30
27
H8
36
27
H8
30
43
H8
30
11
H8
36
19
H8
30
02
H8
30
07
H8
36
09
H8
30
05
H8
30
46
H8
30
20
H8
30
28
H8
30
53
H8
36
20
H8
30
34
H8
30
12
H8
30
33
H8
30
17
H8
30
50
H8
30
31
H8
36
16
H8
30
25
H8
30
44
H8
30
41
H8
36
24
H8
30
06
H8
30
39
H8
30
08
H8
30
49
H8
30
37
H8
30
01
H8
30
22
H8
36
14
H8
30
18
H8
36
31
H8
30
29
H8
30
24
H8
30
04
H8
30
16
H8
30
52
H8
30
14
H8
30
15
H8
30
13
H8
30
09
H8
30
48
H8
30
350.00
500.00
1000.00
1500.00
2000.00
2500.00
3000.00
3500.00 PCT Average
England Average
C a n c e r
E m e r g e n c y
A d m is si o n s
p e r
1 0 0 , 0 0 0
p o p u l a ti o n
Source: Practice Profiles, NHS Cancer Commissioning Toolkit.
Twenty-four GP practices record an all cancer crude urgent 2WW referral rate that is significantly lower than the PCT average. The five lowest practices are: H83030, H83623, H83625, H83023 and H83634. The lowest referral rate was 296.34 per 100,000 population (95%CI 147.73 – 530.26) at practice H83030.
10.1.2 Kingston
Four GP practices in Kingston record a suspected cancer referral rate that was significantly higher than the PCT average. These four GP practices were: H84008, H84637, H84025 and H84034. The PCT average rate was 1234.63 per 100,000 population (95%CI 1181.25 – 1289.80) (Figure 47). GP practice H84008 records a much higher referral rate compared to all other GPs in Kingston at 3807.11 per 100,000 population (95%CI 3291.45 – 4380.62).
48

Final Version Date of last update: 29 th October 2010
Figure 47: Kingston urgent 2WW referrals for suspected cancer, crude rate per 100,000 population.
H8
H8
H8
H8
H8
H8
H8
H8
H8
H8
H8
H8
H8
H8
H8
Y0H8
H8
H8
H8
H8
H8
H8
H8
0.00
500.00
1000.00
1500.00
2000.00
2500.00
3000.00
3500.00
4000.00
4500.00
PCT Average
England Average
Can
ce
r
Em
er-
ge
n
cy
Ad
mis
sio
n
s pe
r
10
0
,00
0
po
p
ula-
tion
Source: Practice Profiles, NHS Cancer Commissioning Toolkit.
The lowest referral rate was 426.48 per 100,000 population (95%CI 263.90 – 651.96) at practice H84629. Seven GP practices in Kingston record an urgent cancer referral rate significantly below the PCT average; they were H84629, H84054, H84033, H84619, H84607, H84020 and H84635. One GP practice records less than 5 cancer referrals for the whole of 2009.
10.1.3 Richmond & Twickenham
The average 2WW crude cancer referral rate in Richmond & Twickenham for 2009 was 1156.66 per 100,000 population (95%CI 1109.66 – 1205.15) (Figure 48). Seven GP practices, H84623, H84060, H84006, H84031, H84007, H84615, and H84012, record a referral rate that was significantly higher than the PCT average. The highest referral rate was 2246.73 per 100,000 population (95%CI 1916.97 – 2616.93) at practice H84623.
Figure 48: Richmond & Twickenham urgent 2WW referrals for suspected cancer, crude rate per 100,000 population.
H840
41
H84632
H846
08
H84625
H846
30
H84005
H84
036
H84014
H84039
H84055
H84023
H84017
H840
02
H840
48
H84044
H846
39
H84032
H84043
H84018
H84
040
H84059
Y0120
6
H84012
H84633
H84057
H846
15
H840
07
H84031
H840
06
H84060
H846230.00
500.00
1000.00
1500.00
2000.00
2500.00PCT Average
England Average
C an
ce r E m er
ge
nc y
A d mi
ssi
on s pe r 10
0,
00 0
po
pu
la-
tio n
Source: Practice Profiles, NHS Cancer Commissioning Toolkit.
The lowest referral rate was 163.13 per 100,000 population (95%CI 59.57 – 355.08) at practice H84041, a rate significantly below the PCT average. Eleven other GP practices record urgent suspected cancer referral rates significantly below the PCT average. The practice codes were: H84632, H84608, H84625, H84630, H84005, H84036, H84014, H84039, H84055, H84023 and H84017.
49
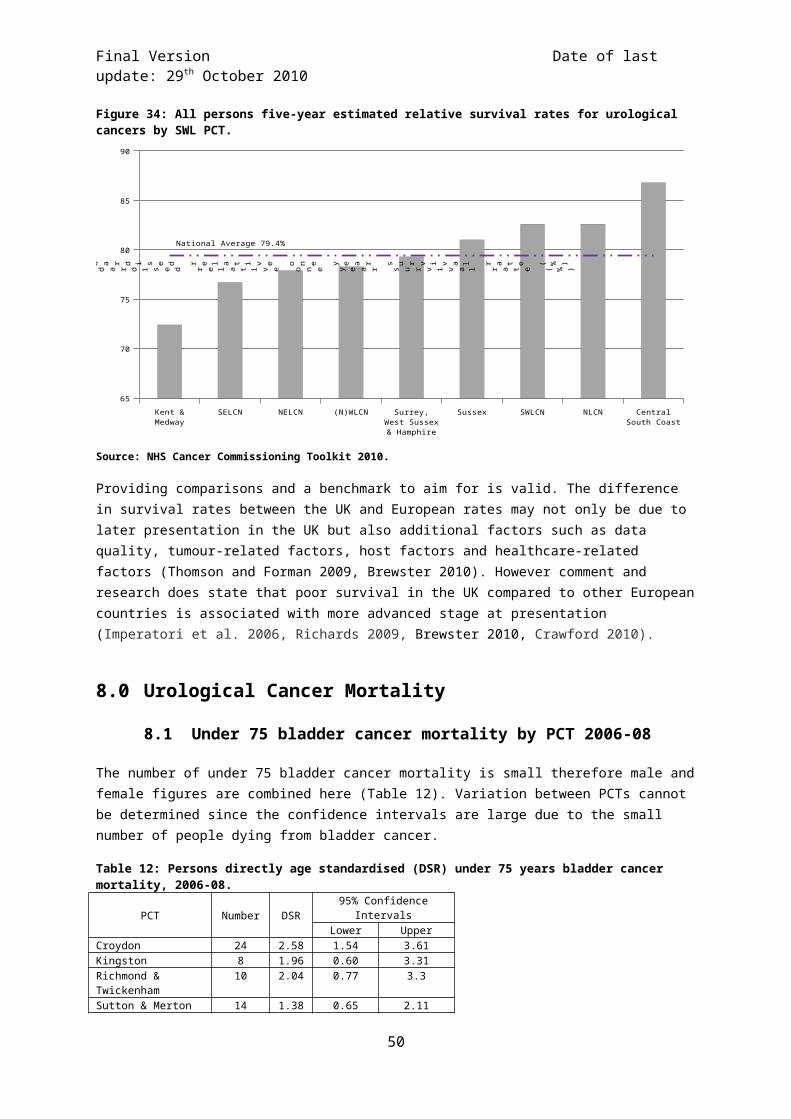
Final Version Date of last update: 29 th October 2010
10.1.4 Sutton & Merton
The average 2WW crude cancer referral rate in Sutton & Merton for 2009 was 1313.64 per 100,000 population (95%CI 1277.57 – 1350.46) (Figure 49). Fifteen GP practices record a referral rate that was significantly higher than the PCT average. The five highest GP practices were H85019, H85035, H85076, H85030 and H85033. The highest referral rate is 2453.05 per 100,000 population (95%CI 2046.48 – 2916.71) at practice H85019.
Figure 49: Sutton & Merton urgent 2WW referrals for suspected cancer, crude rate per 100,000 population.
H8
56
18
H8
50
53
H8
56
65
H8
50
70
H8
56
56
H8
56
62
H8
50
90
H8
50
92
H8
50
34
H8
50
27
H8
50
28
H8
50
95
H8
51
15
H8
50
86
H8
51
08
H8
51
13
H8
56
49
H8
50
31
H8
50
20
H8
51
10
H8
50
64
H8
50
26
H8
50
78
H8
51
03
H8
50
72
H8
56
86
H8
50
21
H8
50
37
H8
51
16
H8
56
93
H8
50
32
H8
51
01
H8
56
74
H8
50
54
H8
50
16
H8
51
12
H8
50
29
H8
56
53
H8
50
63
H8
50
18
H8
50
22
H8
50
38
H8
51
05
H8
56
83
H8
50
24
H8
50
25
H8
56
34
H8
50
23
H8
50
33
H8
50
30
H8
50
76
H8
50
35
H8
50
190.00
500.00
1000.00
1500.00
2000.00
2500.00
3000.00 PCT Average
England Average
Can-
cer
Em
er
gency
Ad-
mis-
sio
ns
per
100,0
00
pop
u-
lation
Source: Practice Profiles, NHS Cancer Commissioning Toolkit.
The lowest cancer referral rate was 294.12 per 100,000 population (95%CI 107.40 – 640.19) at practice H85618 and was significantly lower than the PCT average. In total seventeen GP practices recorded urgent cancer referral rates significantly below the PCT average. The five lowest GP practices were H85618, H85053, H85665, H85070 and H85656.
10.1.5 Wandsworth
Thirteen GP practices in Wandsworth record a suspected cancer referral rate that was significantly higher than the PCT average. These practices are H85052, H85006, H85048, H85100, H85082, H85003, H85005, H85114, H85011, H85111, H85069, H85087 and H85045. The PCT average was 1267.93 per 100,000 population (95%CI 1229.93 – 1307.17) (Figure 50). The highest suspected urgent cancer referral rate was 2788.03 per 100,000 population (95%CI 2339.12 – 3297.96) at practice H85052.
Figure 50: Wandsworth urgent 2WW referrals for suspected cancer, crude rate per 100,000 population.
H8
50
88
H8
51
07
H8
56
50
H8
50
08
H8
50
56
H8
56
80
H8
50
04
H8
56
43
H8
56
95
H8
56
59
H8
56
82
H8
50
77
H8
50
61
Y0
11
32
H8
50
02
H8
56
37
H8
50
65
H8
50
09
H8
50
12
H8
50
41
H8
50
01
H8
50
07
H8
50
39
H8
50
49
H8
50
67
H8
50
47
H8
50
66
H8
50
57
H8
50
45
H8
50
87
H8
50
69
H8
51
11
H8
50
11
H8
51
14
H8
56
64
H8
50
05
H8
50
03
H8
50
82
H8
51
00
H8
50
48
H8
50
06
H8
50
520.00
500.00
1000.00
1500.00
2000.00
2500.00
3000.00PCT Average
England Average
Can
ce
r
Em
e
rgen
cy
Ad
mis-
sion
s per
10
0,
00
0
pop
ula-
tio
n
50
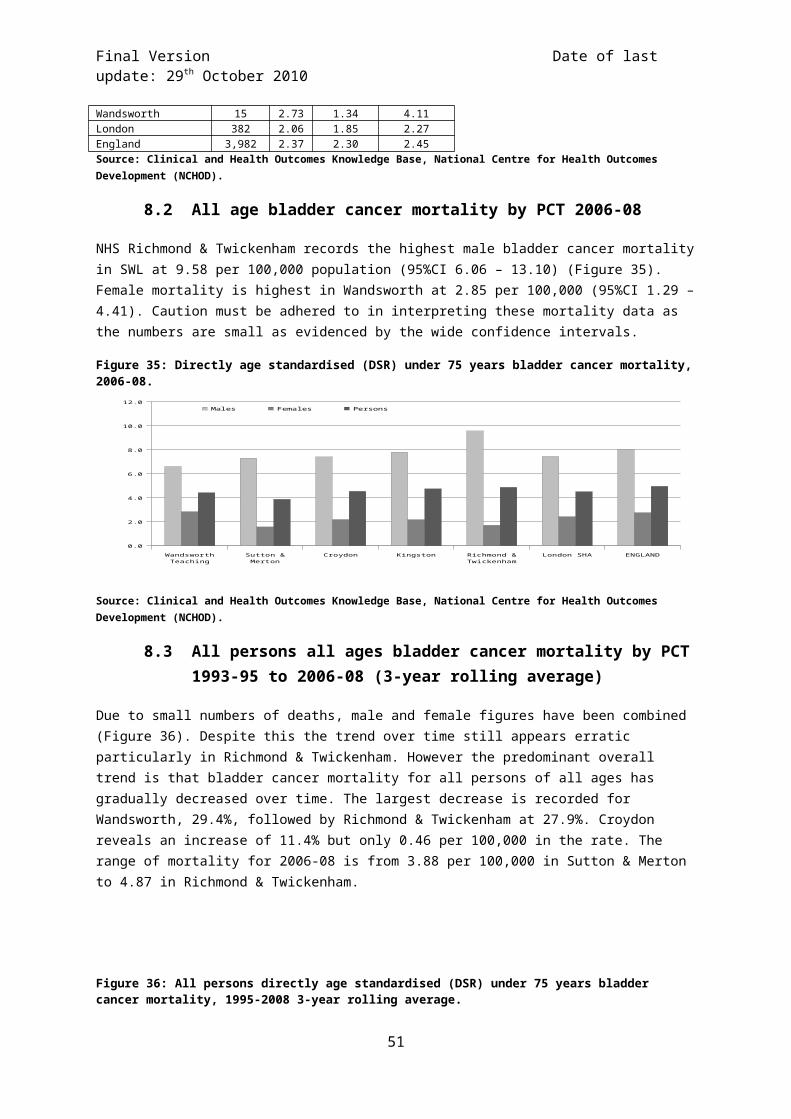
Final Version Date of last update: 29 th October 2010
Source: Practice Profiles, NHS Cancer Commissioning Toolkit.
One GP practice did not record a cancer referral for 2009, while a further two GP practices recorded less than five referrals in the year. The lowest generated referral rate was 279.20 per 100,000 population (95%CI 144.10 – 487.74) at practice H85088. Along with another sixteen practices the referral rates recorded were significantly below the PCT average. The five lowest GP practices were H85088, H85107, H85650, H85008 and H85056.
10.2 Proportion of urological cancer cases diagnosed through non-urgent referral by PCT and Cancer Network 2010
In general, the earlier a cancer is diagnosed, the greater the prospect of a cure. Evidence suggests that later diagnosis of cancer has been a major factor in the poorer survival rates in the UK compared with some other countries in Europe. One of the priorities of the Cancer Reform Strategy for England is to diagnose more cancers early. The proportion of cases of cancer diagnosed through the two week wait programme (2WW) in an indicator of GPs' recognition of the signs and symptoms of cancer and appropriateness of the referral. There is wide variation across the country in the percentage of cases diagnosed through non urgent referral routes. If relatively high numbers of patients are diagnosed through non urgent referrals, this would merit investigation by the PCT (Cancer Commissioning Toolkit 2010).
Figure 51: Percentage of total urological cancer cases diagnosed through non-urgent referral, 2010.
Kingston Croydon Sutton & Merton
Wandsworth Richmond & Twickenham
NELCN SELCN NLCN SWLCN (N)WLCN
0
5
10
15
20
25
30
35
Per
cent
age
of d
iagn
osed
ca
ses
from
no
n-ur
gent
re
ferr
als
National Average 19.0%
Source: National Cancer Waiting Times database (CWT-db).
Richmond & Twickenham by a substantial difference records the highest proportion of diagnosed urological cancer cases by non-urgent referral at 31.5% (Figure 51). This is nearly ten percent higher than the next PCT, Wandsworth, in SWL at 22.7%. All other SWL PCTs record similar proportions with Kingston the lowest at 21.3%. The SWLCN records the highest proportion in London at 23.4%. There was no data available for the (N)WLCN.
51

Final Version Date of last update: 29 th October 2010
11.0 Primary Care Audit 2010
The Cancer Reform Strategy 2007 proposed undertaking a national audit in primary care of newly-diagnosed cancers, to inform decisions about how best to support primary care professionals and ensure the earliest diagnosis. During the period April-June 2010 the SWLCN undertook such an audit. A person’s cancer pathway begins when they recognise and then act on signs and symptoms. A person who has a type of cancer with easily recognisable symptoms will present sooner. For example, breast cancer signs are more recognisable than those of colon cancer. Sometimes, despite recognising symptoms, people are reluctant to present to primary care. The audit covered 39 practices across South West London. Eighty-eight cases of prostate cancer were found, accounting for 13% of all cancer incidence found in the audit. Nearly two-thirds (63% - 57 cases) of these cases were diagnosed at organ, 13 cases (14%) with ‘local spread’, 16 cases (16%) with ‘distant metastases’ (32%) and 5 cases (5%) not known. Due to small numbers the findings presented here are a mixture of prostate cancer specific figures as well as data aggregated for all cancers.
Of all the cancer patients found in the audit 46% (299 cases) were 2 week referrals, which is similar to the average (45%) recorded across England for 2009-10. Fourteen percent (89) were emergency cases and 15% (101) were classed as routine. The number of emergency cases appears excessive (compared to other to networks); this may be due to occurrences of patients that did not visit the GP but were admitted to hospital via A&E being recorded as emergency cases. The correct definition in relation to GPs is only those patients that visit the GP and are immediately (same day) referred to the acute trust. Consultation with participating GPs and the lead GP for the SWLCN audit confirmed this ambiguity had arisen (SWLCN 2010).
Twelve percent (81) were not referred by the practice. Overall 146 cases (22%) were identified as cases where an avoidable delay had occurred.
The median time for patients noticing and reporting symptoms of prostate cancer were 18 days, while the median time between reporting symptoms to a GP referral to secondary care was 12 days with the median time from referral to first visit to secondary care being 15 days. Comparisons with other cancers are shown in Figure 52.
Figure 52: Median times from patients noticing and reporting symptoms to first being seen in secondary care.
Breast
Lung
Colorectal
Prostate
0 5 10 15 20 25 30 35 40 45 50
9
15
16
18
0
5
1
12
13
10
12
15
Time from noticing symptoms to reporting symptoms
Time from reporting symptoms to GP referral to secondary care
Time from GP referral to first seen in secondary care
Ca
nc
er t
yp
e
Source: SWLCN Primary Care Audit 2010.
52

Final Version Date of last update: 29 th October 2010
11.1 Avoidable delays (all cancers)
GP’s identified 146 cases of avoidable delays as assessed by auditing GP. Of these:
31% (45 cases) due to patient delaying first presentation, investigation or hospital referral. 11% (16 cases) could have been referred sooner using 2 week rule. 23% (34 cases) delayed in referral to secondary care, often due to the GP not initially thinking
of cancer as a possible diagnosis. 9% (14 cases) delayed due to communication problems between primary and secondary
care. 18% (27 cases) delayed after referral to secondary care. 7% (10 cases) delayed due to other causes.
11.2 Prostate cancer summary
Thirty-two out of 55 patients (58%) presented with urinary symptoms, 14 patients (25%) were diagnosed following referral for a raised PSA found on routine or screening blood tests. Other less common symptoms included erectile dysfunction, back pain and haematuria.
Thirty-three of the patients (60%) were referred through the 2 week wait rule. Fifteen cases (27%) were referred routinely and four cases (7%) were admitted as emergencies (mostly patients in acute retention).
One particularly complex prostate cancer case where a patient’s PSA was being monitored by the practice resulted in 3 negative TRUS biopsies and a resulting prostatitis. When PSA continued to rise the patient was referred to another trust for a 4th biopsy which showed cancer. The total pathway length was 1997 days (5 and a half years).
53

Final Version Date of last update: 29 th October 2010
12.0 Cancer Awareness Measure (CAM) Survey in South West London 2010
Information presented in this section from Ipsos MORI is to be treated as confidential and is subject to copyright. Please see the end of this section in regard of copyright.
This section summarises the findings from research conducted by Ipsos MORI Social Research Institute (2010) and commissioned by the SWLCN on cancer awareness amongst the residents of South West London undertaken between May and September 2010. A total of 5,009 resident people were interviewed across South West London. The majority of South West London residents report having been affected by cancer in some way, either personally or through friends or family having the disease. One in ten residents (12%) has personally had cancer themselves. Specific groups of residents – particularly women, white residents, those aged 45-54 and those from social grades AB – are particularly more likely to have been affected by cancer. Over half of residents reported having a close family member having had cancer.
Residents mention a range of possible warning signs and symptoms of cancer, the most commonly mentioned of which is an unusual lump or swelling (59%). A change in bowel/bladder habits was only recognised by one in eight when unprompted rising to 86% when prompted. Broken down by Borough, Richmond records that a fifth of respondents consider a change in bowel/bladder habits a warning sign of cancer, a significantly higher proportion compared to the sector average. Conversely Wandsworth reports a proportion of 9%, significantly lower than the sector average (Table 14).
Table 14: Summary of CAM responses (%).
Warning Signs of Cancer SWLCroydo
n Kingston Merton RichmondSutto
n Wandsworth
Unprompted
Unusual lump or swelling 59 60 64 65 67 61 52
A change in bowel/bladder habits 12 10 15 10 19 12 9
Bleeding 24 22 25 27 29 23 23
Persistent unexplained pain 20 20 22 21 27 13 20
Unexplained weight-loss 18 20 17 15 22 17 15Loss of appetite 8 7 8 7 11 7 8
Prompted
Unusual lump or swelling 94 96 94 90 97 96 91
A change in bowel/bladder habits 86 86 85 85 87 90 86
Bleeding 83 81 83 81 87 85 81
Persistent unexplained pain 79 79 79 80 81 79 76Unexplained weight-loss 83 85 81 80 84 85 80
If you had an unexplained pain, how long would you wait until making an appointment
1-3 days 24 29 22 29 22 16 24
4-6 days 16 15 19 18 15 17 17
1 week 24 24 23 25 24 28 21
2 weeks 18 15 17 14 21 21 20 1 month 9 7 11 7 10 10 9
What things do you think affect a person's chance of getting cancer - Agree
Smoking 90 90 93 89 92 93 88
Eating red or processed meat 5 4 6 11 7 1 4
Drinking alcohol 41 41 42 49 38 36 39
<5 portions of fruit & veg a day 39 37 37 41 45 34 39 Not doing enough exercise 38 33 39 41 39 38 41
54

Final Version Date of last update: 29 th October 2010
However, the depth of residents’ awareness appears to be quite shallow, with only a relatively small proportion able to identify more than five signs of symptoms of cancer (13%). While prompted awareness of symptoms is significantly higher than unprompted, South West London residents appear to have lower levels of awareness than residents elsewhere in the country.
South West London residents clearly believe that lifestyle makes the greatest contribution to developing cancer in the UK, with around half (53%) ranking it as the most important factor. This is followed by genetic inheritance (29%), while South West London residents rank environmental factors, ageing and chance as having lower levels of influence on occurrences of cancer in the UK. This follows a similar pattern to that for residents across the country.
When asked about the actual causes of cancer, the factors highlighted by South West London residents are largely consistent with the priority ranking. They are dominated by avoidable lifestyle factors, especially smoking at 90% agreement. Forty-one percent stated drinking alcohol as a contributory factor for cancer. Few residents do not know or did not mention any factors that affect a person’s chance of getting cancer (five per cent combined).
In almost identical results to residents across the country as a whole, South West London residents clearly believe that breast cancer is the most common form of cancer among women, with over four in five residents believing this to be true (82%). Few residents highlight other cancers, with breast cancer ten times more likely to be mentioned than the next most popular choice. In reality the three most common forms of cancer among women in South West London are breast, colorectal (bowel) and lung cancer.
The results for common cancers among men are slightly more varied, with just under half (48%) thinking that prostate cancer is the most common form, while a quarter of residents (23%) believe that lung cancer is the most common, while one in ten residents (12%) think it is testicular cancer. Only four per cent of residents say they do not know. The three most common forms of cancer among men are prostate, lung and colorectal (bowel) cancer.
55
Legal notice© 2010 Ipsos MORI – all rights reserved.
The contents of this report constitute the sole and exclusive property of Ipsos MORI.
Ipsos MORI retains all right, title and interest, including without limitation copyright, in or to any Ipsos MORI trademarks, technologies, methodologies, products, analyses, software and know-how included or arising out of this report or used in connection with the preparation of this report. No license under any copyright is hereby granted or implied.
The contents of this report are of a commercially sensitive and confidential nature and intended solely for the review and consideration of the person or entity to which it is addressed. No other use is permitted and the addressee undertakes not to disclose all or part of this report to any third party (including but not limited, where applicable, pursuant to the Freedom of Information Act 2000) without the prior written consent of the Company Secretary of Ipsos MORI.

Final Version Date of last update: 29 th October 2010
13.0 Conclusion
Where there is a statistically significant difference between PCTs or cancer networks it is stated in the text below. Where a rate is quoted to be higher or lower than another area or national average but the word significant is not used then no significant difference is present and it is possible (at the 95% confidence level) there is no difference between the two compared figures.
13.1 GP practice summaries
All cancer emergency admissions and urgent two week wait referral data is presented by GP practice in this baseline assessment.
Croydon
Seven GP practices recorded all cancer emergency admission rates significantly higher than the PCT average; they were H83029, H83619, H83031, H83033, H83019, H83050 and H83015. Four GP practices recorded emergency admission rates significantly lower than the PCT average; they were H83041, H83051, H83625 and H83025. Thirteen GP practices record a referral rate that is significantly higher than the PCT average. They five highest are: H83035, H83048, H83009, H83013 and H83016. The highest referral rate is 2990.30 per 100,000 population at practice H83035. Twenty-four GP practices record an all cancer crude urgent 2WW referral rate that is significantly lower than the PCT average. The five lowest practices are: H83030, H83623, H83625, H83023 and H83634. The lowest referral rate was 296.34 per 100,000 population (95%CI 147.73 – 530.26) at practice H83030.
Kingston
Five GP practices recorded all cancer emergency admission rates significantly higher than the PCT average; they were H84015, H84049, H84607, H84053, and H84033. Four GP practices recorded rates significantly lower than the PCT average; they were Y02379, H84020, H84025, and H84619. Four GP practices in Kingston record a suspected cancer referral rate that is significantly higher than the PCT average. These four GP practices were: H84008, H84637, H84025 and H84034. GP practice H84008 records a much higher referral rate compared to all other GPs in Kingston at 3807.11 per 100,000 population. The lowest all cancer urgent referral rate was 426.48 per 100,000 population at practice H84629. Seven GP practices in Kingston record an urgent cancer referral rate significantly below the PCT average; they are H84629, H84054, H84033, H84619, H84607, H84020 and H84635.
Richmond & Twickenham
Four GP practices recorded all cancer emergency admission rates significantly higher than the PCT average; they were H84060, H84018, H84031 and H84032. Three GP practices recorded rates significantly lower than the PCT average; they were H84625, H84005 and Y01206. Seven GP practices, H84623, H84060, H84006, H84031, H84007, H84615, and H84012, record a referral rate that is significantly higher than the PCT average. The highest referral rate is 2246.73 per 100,000 population at practice H84623. The lowest referral rate was 163.13 per 100,000 population at practice H84041, a rate significantly below the PCT average. Eleven other GP practices record urgent suspected cancer referral rates significantly below the PCT average. The five lowest practices were: H84632, H84608, H84625, H84630 and H84005.
Sutton & Merton
Eight GP practices recorded all cancer emergency admission rates significantly higher than the PCT average; they were H 85108, H85110, H85683, H85032, H85653, H85038, H85030, and H85037. Seven GP practices also recorded rates significantly lower than the PCT average; they were H85112, H85022, H85649, H85634, H85027, H85028 and H85686. Fifteen GP practices record a referral rate
56

Final Version Date of last update: 29 th October 2010
that is significantly higher than the PCT average. The five highest GP practices are H85019, H85035, H85076, H85030 and H85033. The highest referral rate is 2453.05 per 100,000 population (95%CI 2046.48 – 2916.71) at practice H85019. The lowest cancer referral rate was 294.12 per 100,000 population at practice H85618 and was significantly lower than the PCT average. In total seventeen GP practices recorded urgent cancer referral rates significantly below the PCT average. The five lowest GP practices were H85618, H85053, H85665, H85070 and H85656.
Wandsworth
Six GP practices recorded all cancer emergency admission rates significantly higher than the PCT average; they were H85006, H85643, H85005, H85067, H85008 and H85045. Five GP practices recorded admission rates significantly lower than the PCT average; they were Y01132, H85012, H85049, H85048 and H85087. Thirteen GP practices in Wandsworth record a suspected cancer referral rate that is significantly higher than the PCT average. These highest five rates are at practices H85052, H85006, H85048, H85100 and H85082. The PCT average is 1267.93 per 100,000 population. The highest suspected urgent cancer referral rate was 2788.03 per 100,000 population at practice H85052. The lowest generated referral rate was 279.20 per 100,000 population) at practice H85088. Along with another sixteen practices the referral rates recorded were significantly below the PCT average. The five lowest GP practices were H85088, H85107, H85650, H85008 and H85056.
13.2 PCT summaries
Figure 53 and Figure 54 list all the figures/rates described in the PCT and cancer network summaries below.
Croydon
There are more areas of high deprivation in Croydon compared to other PCTs in SWL. This is possibly reflected in the higher estimated smoking prevalence for the PCT. One in every eighth person is projected to be 65 years or older, while just over two fifths of the male population is aged between 15 and 44 years old. Estimated fruit and vegetable consumption is no different to the national average while obesity levels are estimated to be significantly lower than the national average.
Male under 75 bladder cancer incidence is significantly higher than the national average at 24.63 per 100,000 population, while female incidence is low and comparable to the national average. The borough shows the lowest reduction in all age all persons bladder cancer incidence in SWL, only reducing by 4.1% from 1993-95 to 2004-06. All age all person bladder mortality has increase by 11% from 1993-95 to 2006-08, however the numbers are small, rising from 17 to 20 cases. Croydon has an under 75 prostate cancer incidence that is significantly higher than national average at 102.12, while the all age incidence rate has nearly doubled between 1993-95 and 200406. Croydon also has the highest prostate cancer mortality rate in SWL as well as the lowest reduction in the mortality rate between 1993-95 and 2006-08, 6.8%. Testicular cancer incidence is at a rate of 6.2 per 100,000. For kidney cancer incidence and mortality the borough has the lowest male rates in SWL at 10.3 and 3.8 respectively. The female incidence rate is the highest at 6.1 (no significance determined for either). The overall urological cancer incidence is 85.6 per 100,000 population, while the mortality rate is the highest in SWL at 19.8 per 100,000. A third of prostate cancers were diagnosed at stage 1 while over half were not known at the time of data collection, however Croydon has the highest prostate cancer one-year survival rate in SWL at 94.9%. It also has the highest male kidney cancer survival for males as well as the highest in SWL for urological cancers overall at 94.4%. Croydon has a one-year prostate cancer survival rate higher than the EUROCARE-4 study based “Average” benchmark as well as being comparable to the “Good Practice” benchmark. The male bladder cancer one-year survival rate was 74.7% and well below the EUROCARE-4 findings for Norway, Finland and Sweden. Female bladder cancer one-year survival is higher at 77.9% and comparable to the rate in Norway. The crude rate for all cancer emergency admissions was 610.41 per 100,000 population. The average
57

Final Version Date of last update: 29 th October 2010
2WW crude referral rate for suspected cancer in Croydon for 2009 was 1092.41 per 100,000 population. Croydon records 21.9% of urological cancer cases coming through non-urgent referrals, a rate just above the national average at 19.0%.
Kingston
Examination of the matrix below (Figure 53) shows that Kingston appears as the best performing PCT in the sector or in line with the national average for most indicators. One in every eighth person is projected to be 65 years or older, and nearly half of the male population is aged between 15 and 44 years old. There is little deprivation in the Kingston area and has possibly the lowest smoking rates in SWL. This PCT is characterised by healthier living with high estimates for exercise and fruit and vegetable consumption.
Female under 75 bladder cancer incidence is the lowest in SWL at 4.79 per 100,000 population while the male is similar to the national average at 19.51. Kingston shows the highest reduction (42.1%) in all age all person bladder cancer incidence between 1993-95 and 2004-06, however it has a high (compared to other SWL PCTs) all age all person mortality for 2006-08 at 4.75 per 100,000. Despite this the mortality rate has decrease by a quarter since 1993-95. Under 75 prostate cancer incidence is low at 76.6 per 100,000 while the all age rate has dropped by a third between 1993-95 and 2004-06. Kingston had the lowest (in SWL) all age prostate cancer mortality at 19.1 per 100,000 as well as the highest reduction in the mortality rate between 1993-95 and 2006-08 at 37.4%. Kingston has a testicular cancer incidence rate (2003-07) which is significantly lower than the national average at 3.7 per 100,000. All age male and female kidney cancer incidence is at 12.1 and 5.7 per 100,000 respectively, while male mortality is the highest in SWL at 6.5 per 100,000. Overall the all age all person urological cancer incidence is 83.7 per 100,000 and the mortality rate is 19.3 per 100,000. Thirty percent of prostate cancers were diagnosed at stage 1 and 15% were diagnosed at stage 4 while just over half were classed as not known. Prostate cancer one-year survival was at 94.2% and comparable to the EUROCARE-4 study based “Good Practice” benchmarks. Male bladder cancer one-year survival was the highest in SWL at 84.2% but still below the rates in the Scandinavian countries. There was no survival data available for females. Overall the all person one-year survival rate for all urological cancers was 94.3%. The crude rate for all cancer emergency admissions was 506.50 per 100,000 population. The PCT urgent 2WW cancer referral rate was 1234.63 per 100,000 population. Kingston has the least proportion of urological cancer cases diagnosed through non-urgent referrals in SWL at 21.3%.
Richmond & Twickenham
This PCT is the healthiest in SWL in health related behaviour. One in every eighth person is projected to be 65 years or older, and 45% of the male population is aged between 15 and 44 years old. The borough is characterised by healthier living with high estimates for exercise and fruit and vegetable consumption while having the lowest smoking prevalence estimates and experiencing the lowest deprivation.
Male under 75 bladder cancer incidence is high compared to other PCTs in SWL at 23.69. Female incidence is low at 5.82 per 100,000. There has been a 37.4% decrease in all age all person bladder cancer incidence between 1993-95 and 2004-06 and mortality has decreased by a quarter between 1993-95 and 2006-08. However mortality for 2006-08 is the highest in SWL at 4.88 per 100,000. The under 75 prostate cancer incidence is low at 66.6 per 100,000 and the increase in incidence between 1993-95 and 2004-06 is the lowest in SWL at 16.3%. The all age prostate cancer mortality is one of the highest in SWL but has decreased by 29.0% between 1993-95 and 2006-08. Richmond & Twickenham records the highest testicular cancer incidence rate in SWL at 8.66. Kidney cancer incidence is low at 10.9 for males while the number of cases is too low for females to generate a rate and is suppressed. Both male and female mortality rates are suppressed. Overall Richmond & Twickenham has a low all urological cancer incidence in SWL at 77.7 per 100,000 while the mortality
58

Final Version Date of last update: 29 th October 2010
rate is 18.7. Just under two fifths of prostate cancer cases were diagnosed at stage 1 while one in every eight was at stage 4. Just under half were recorded as not known. Richmond & Twickenham has the lowest prostate cancer one-year survival rate at 88.2% well below the EUROCARE-4 study rates recorded for the Scandinavian countries. The crude rate for all cancer emergency admissions was 536.97 per 100,000 population. The urgent 2WW crude cancer referral rate in Richmond & Twickenham for 2009 was 1156.66 per 100,000 population. The PCT records the highest proportion of diagnosed urological cancer cases originating from non-urgent referrals in SWL at 31.5%, nearly 10% higher than Wandsworth, the closest other PCT in SWL.
Sutton & Merton
Sutton & Merton reveals lifestyle prevalence estimates (smoking, exercise, diet) that rank in the middle across the SWL PCTs. There is some deprivation present with 15% of small areas (LSOA) classed amongst the highest deprivation in the sector. Around one in every eighth person is projected to be 65 years or older, and around 45% of the male population is aged between 15 and 44 years old. This latter population is projected to decrease by 5% as a proportion of total population.
Male under 75 bladder cancer incidence is the lowest in SWL at 17.27 per 100,000, while female incidence is at 5.12. The all age all person incidence rate for bladder cancer has decreased by two fifths between 1993-95 and 2004-06, while mortality has decrease by 18% between 1993-95 and 2006-08. All age all person bladder cancer mortality is the lowest in SWL at 3.88 per 100,000. Under 75 prostate cancer incidence is significantly lower than the national average in Sutton & Merton at 61.0 per 100,000 while all age incidence has decreased by 20% since 1993-95. Prostate cancer mortality rate is one of the lowest in SWL at 22.0 and the rate has decreased by 31.8% from 1993-95 to 2006-08. Testicular cancer in Sutton is at 5.2 and at 6.0 in Merton, similar to other boroughs (except Kingston) in SWL. All age male kidney cancer is the lowest in SWL at 10.3 per 100,000 while the female rate is low at 4.5. Male kidney cancer mortality is recorded as 6.0 per 100,000. Overall the urological cancer incidence rate for all ages and persons is the lowest in SWL at 70.6 per 100,000 as is the mortality rate at 17.0 per 100,000. Fifty-five percent of prostate cancer cases were classed as not known, while 30% were staged at stage 1. One in every eight tumour was diagnosed at stage 4. Despite this the one-year survival rate is high at 94.8%, and is higher than the EUROCARE-4 study based “Average” benchmark as well as being comparable to the “Good Practice” benchmark. Contrastingly Sutton & Merton has the lowest male bladder and kidney cancer one-year survival rates in SWL at 71.6% and 70.8% respectively. The male bladder one-year survival rate is considerable below the comparison countries of Scandinavia which record a range of 85 to 89%. Overall the PCT has a high urological cancer one-year survival rate at 94.1%. The crude rate for all cancer emergency admissions was 634.87 per 100,000 population. The 2WW crude cancer referral rate in Sutton & Merton for 2009 was 1313.64 per 100,000 population. Sutton & Merton record 22.4% of diagnosed urological cancer cases coming from non-urgent referrals.
Wandsworth
Wandsworth has the highest estimated smoking prevalence in SWL reflecting the level of deprivation and young population in the borough. Twenty-nine percent of small areas (LSOA) in the borough are classed as highly deprived. Exercise and fruit and vegetable consumption is relatively high. Obesity levels are estimated to be the lowest in SWL and significantly lower than the national average. It has the one of the youngest populations in London with only 8.2% of the projected population aged 65 and over, while nearly 60% of the male population is aged between 15 and 44 years old.
Female under 75 bladder cancer incidence is the highest in SWL at 8.27 per 100,000 while the male rate is low at 18.67. Between 1993-95 and 2004-06 the all age and person incidence rate decreased by 20.8% while mortality decreased the most out of the SWL PCTs at 29.4%. The most recent (2004-06) mortality rate is 4.43 per 100,000 for all age and persons. Under 75 prostate cancer incidence is significantly higher than the national average at 92.6 per 100,000. Incidence has decreased by more
59

Final Version Date of last update: 29 th October 2010
than half (54.7%) between 1993-95 and 2004-06 and mortality by 19.1% between 1993-95 and 2006-08. The latest prostate cancer mortality rate is 22.6 per 100,000. Testicular cancer incidence is high relative to other PCTs in SWL at 7.0 per 100,000. The male kidney cancer incidence is the highest in SWL at 14.4 per 100,000 while female incidence is the lowest at 4.0. Male mortality for all ages is at 5.4 per 100,000. Overall Wandsworth has the highest all age all person urological cancer incidence in SWL at 88.9 per 100,000 while the mortality rate is also high at 19.7. Wandsworth has the least proportion (in SWL) of prostate cancer tumours classed as stage not known at diagnosis at 42.1%. Forty-five percent of prostate cancers were diagnosed at stage 1 and 11.3% percent at stage 4. Prostate cancer one-year survival is one of the lowest in SWL at 93.5% but is still comparable to the EUROCARE-4 study based benchmarks of 92.7% and 96.0%. Male bladder cancer one-year survival is one of the highest in SWL at 81.1% but still below the comparison countries of Scandinavia. The female rate is 63.4% (based on small numbers) and well below the Scandinavian rates. One-year male kidney cancer in Wandsworth is the highest in SWL at 82.3%. Overall the all urological cancer one-year survival rate is low, compared to other PCTs in SWL, at 91.8%. The crude rate for all cancer emergency admissions was 443.07 per 100,000 population. The PCT urgent 2WW referral rate for suspected cancer was 1267.93 per 100,000 population. Wandsworth records 22.7% of diagnosed urological cancer cases resulting from non-urgent referrals.
60

Final Version Date of last update: 29 th October 2010
Figure 53: PCT Matrix of key urological cancer figures for South West London.
Croydon Kingston Richmond & Twickenham Sutton & Merton Wandsworth 65+ Population as % of PCT population (2010) 12.9% 12.0% 12.1% 12%
(Merton)13.5%
(Sutton) 8.2%
65+ Population increase (2010-2030) 3.6% 3.0% 1.5% 3.1%
(Merton)3.9%
(Sutton) 0.4%
Male 15-44 Population as % of PCT population (2010)
43.6% 47.1% 45.6% 46.5% 45.0% 59.2%
15-44 Population decrease (2010-2030) 3.7% 4.1% 1.8% 5.2% 4.9% 5.7%
Smoking prevalence (Adults) (2003-05) 21.0 - 25.7% 18.7-24.9% 16.1 - 23.0% 18.7 - 23.3%
(Merton)22.1 - 29.1%
(Sutton) 21.0 - 27.7% Lowest Highest
% of small areas (LSOA) classed as highest deprivation (2007)
33% 5% 4% 15% 29% Lowest Highest Lowest
Estimated fruit & vegetable consumption 2003-05)
27.8% 33.4% 37.1% 30.4% 31.1%Significantly higher than
national average
Estimated obesity prevalence (2003-05) 19.3% 17.3% 14.3% 18.3% 14.2%
Significantly lower than
national average
Male Under 75 bladder Incidence (2004-06) 24.63 19.51 23.69 17.27 18.67 Lowest
Significantly higher
national average
Female Under 75 bladder Incidence (2004-06).
5.35 4.79 5.82 5.12 8.27 Lowest Highest
Decrease all age persons bladder cancer incidence (1993-95-200406).
4.1% 42.1% 37.4% 40.0% 20.8% Highest Lowest
Under 75 prostate Incidence (2004-06). 102.12 76.6 66.6 61.0 92.6
Significantly lower
national average
Significantly higher
national average
Increase all age prostate cancer incidence (1993-95-2004-06).
95.1% 32.2% 16.3% 19.7% 54.7% Lowest Highest
All age testicular cancer incidence (2003-07). 6.2 3.7 8.66 6.0
(Merton)5.2
(Sutton) 7.0Significantly lower than
national average
Highest
All age male kidney cancer incidence (2004-06)
10.3 12.1 10.9 10.3 14.4 Lowest Highest
All age female kidney cancer incidence (2004-06)
6.1 5.7 Suppressed – less than 5 cases 4.5 4.0 Lowest Highest
All age all person urological cancer incidence (1996-2006)
85.6 83.7 77.7 70.6 88.9 Lowest Highest
Prostate cancer staging (2003-07)
Stage 1: 32.7% Stage 4: 7.6%
NK: 58.6%
Stage 1: 29.5% Stage 4: 15.6%
NK: 51.9%
Stage 1: 38.0% Stage 4: 12.4%
NK: 48.0%
Stage 1: 29.9% Stage 4: 11.9%
NK: 55.7%
Stage 1: 45.8% Stage 4: 11.3%
NK: 42.1%
Prostate cancer one-year survival (2002-07) 94.9% 94.2% 88.2% 94.8% 93.5% Highest Lowest
Male bladder cancer one-year survival (2002-07)
74.7% 84.2% No data 71.6% 81.1% Highest Lowest
Female bladder cancer one-year survival (2002-07)
77.9 No data No data No data 63.4%
Male kidney cancer one-year survival (1998-02) 71.9% No data 72.2% 70.8% 82.3% Highest Lowest
61

Final Version Date of last update: 29 th October 2010
All person urological cancer one-year survival (1998-02)
94.4% 94.3% 89.8% 94.1% 91.8% Highest Lowest
All age person bladder cancer mortality (2006-08)
4.55 4.75 4.88 3.88 4.43 Lowest Highest
Decrease all age persons bladder cancer mortality (1993-95-200608)
-11.4% 25.2% 27.9% 18.0% 29.4% Highest decrease Increase
All age prostate cancer mortality (2006-08) 27.0 19.1 25.0 22.0 22.6 Lowest Highest
Decrease all age prostate cancer mortality (1993-95-2006-08)
6.8% 37.4% 29.0% 31.8% 19.1% Highest Lowest
All age male kidney cancer mortality (2004-06)
3.8 6.5 Suppressed – less than 5 cases 6.0 5.4 Lowest Highest
All age person urological cancer mortality (2007) 19.8 19.3 18.7 17.0 19.7 Lowest Highest
Average all cancer emergency admission crude rate per 100,000 (2008-09)
610.41 506.50 536.97 634.87 443.07
2WW cancer referral rate per 100,000 (2009) 1092.41 1234.63 1156.66 1313.64 1267.93
% of cases diagnosed through non-urgent referrals (2010)
21.9% 21.3% 31.5% 22.4% 22.7% Highest Lowest
13.3 South West London Cancer Network specific
Overall the SWLCN performs averagely compared to all other networks in London with many indicators similar to the national average (Figure 54). The SWLCN is ranked in the middle of all of London’s cancer networks for prostate, male kidney and female bladder cancer prevalence. The SWLCN area has high (in relation to London CNs) testicular cancer prevalence at 5.3 per 100,000 population as well as a high prevalence of male bladder cancer prevalence at 13.7 per 100,000. Prevalence of female kidney cancer is also high in SWL at 3.9 per 100,000. Half of prostate cancer cases were not able to be staged by the TCR. Thirty-seven percent were staged at stage 1 while 10.8% were diagnosed at stage 4. The SWLCN has a one-year prostate cancer survival rate which is higher than the Eurocare-4 study based ‘Good Practice’ benchmark at 93.9%. It also has one of the highest male (77.0%) and female (65.1%) bladder cancer one-year survival rates in London. There is a large difference between male and female rates though. They are both considerably lower than the rates recorded for the Scandinavian countries for one-year bladder cancer survival which range from 88 to 90% for males and from 78 to 84% for females. Overall the urological cancer one-year survival rate is high at 93.6%. The SWLCN records the highest proportion of diagnosed cases originating from non-urgent referrals in London at 23.4%. Overall for SWL the urgent 2WW referral rate (excluding suspected testicular cancer) is 1.28 per 1,000 population.
62

Final Version Date of last update: 29 th October 2010
Figure 54: Matrix of key urological cancer figures for South West London Cancer Network.
SWLCN NELCN NLCN (N)WLCN SELCNProstate cancer prevalence per 100,000 (2006)
91.1 84.3 97.0 71.9 94.0 Lowest Highest
Testicular cancer prevalence (2006)
5.3 3.1 6.0 3.0 4.2 Lowest Highest
Male kidney cancer prevalence per 100,000 (2006)
8.7 7.5 8.2 7.6 10.0 Lowest Highest
Female kidney cancer prevalence per 100,000 (2006)
3.9 4.3 3.3 2.4 2.6 Lowest Highest
Male bladder cancer prevalence per 100,000 (2006)
13.7 13.0 14.0 13.3 11.5 Lowest Highest
Female bladder cancer prevalence per 100,000 (2006)
4.0 4.5 3.3 4.5 3.4 Lowest Highest
Prostate cancer staging (2003-07)
Stage 1: 37.3% Stage 4: 10.8%
NK: 50.1%
Prostate cancer one-year survival (2002-07)
93.9% 92.1% 95.1% 91.1% 90.9%Significantly higher than
‘Good Practice’ level
Male bladder cancer one-year survival (2002-07) 77.0% 73.2 77.8 74.4 74.5 Highest Lowest
Female bladder cancer one-year survival (2002-07)
65.1% 60.8 70.7 62.4 52.4 Highest Lowest
Urological cancer one-year survival (Persons) (2002-07)
93.6% 91.9% 94.2% 90.6% 89.9 Highest Lowest
% of cases diagnosed through non-urgent referrals (2010)
23.4% 19.5% 23.0% - 22.0% Lowest Highest
13.4 Recommendations
Investigate the reasons for significantly higher male bladder cancer incidence compared to the national average in Croydon.
Investigate the reasons for significantly higher incidence compared to the national average of prostate cancer in Croydon and Wandsworth (Incidence rate in Sutton & Merton is significantly lower than the national average).
Investigate the reasons for significantly higher testicular cancer incidence compared to the national average in Richmond & Twickenham (Incidence rate in Kingston is significantly lower than the national average).
Work to improve one-year survival rates across the sector for prostate cancer and male and female bladder cancer.
Review the proportion of diagnosed urological cancer cases referred through a non-urgent route in Croydon, Sutton & Merton and Wandsworth PCTs.
63

Final Version Date of last update: 29 th October 2010
Implement the recommendations of the Primary Care Audit of Cancer.
Implement social marketing strategy resultant from the results of the CAM survey.
References
Adami HO, Bergström R, Engholm G et al. (1996). A prospective study of smoking and risk of prostate cancer. Int J Cancer. 1996 Sep 17;67(6):764-8.Bratt O (2002). Hereditary prostate cancer: clinical aspects. J Urol. 2002 Sep;168(3):906-13.
Brennan P, Bogillot O, Cordier S et al. (2000). Cigarette smoking and bladder cancer in men: a pooled analysis of 11 case-control studies. Int J Cancer. 2000 Apr 15;86(2):289-94.
Brennan P, Bogillot O, Greiser E et al. (2001). The contribution of cigarette smoking to bladder cancer in women (pooled European data). Cancer Causes Control. 2001 Jun;12(5):411-7.
Brewster DH (2010). Survival is multifactorial. BMJ 2010; 341:c5133
Buchner FL, Bueno-de-Mesquita HB, Ros MM et al. (2009). Consumption of vegetables and fruit and the risk of bladder cancer in the European Prospective Investigation into Cancer and Nutrition. International Journal of Cancer, Dec 2009, vol./is. 125/11(2643-51), 0020-7136;1097-0215 (2009 Dec 1).
Calle EE, Rodriguez C, Walker-Thurmond K et al. (2003). Overweight, obesity, and mortality from cancer in a prospectively studied cohort of U.S. adults. N Engl J Med. 2003 Apr 24;348(17):1625-38.
Cancer Research UK (2010). Kidney cancer risk factors. http://info.cancerresearchuk.org/cancerstats/types/kidney/riskfactors/index.htm. Accessed 03/08/10.
Case RA, Pearson JT (1954). Tumours of the urinary bladder in workmen engaged in the manufacture and use of certain dyestuff intermediates in the British chemical industry. II. Further consideration of the role of aniline and of the manufacture of auramine and magenta (fuchsine) as possible causative agents. Br J Ind Med. 1954 Jul;11(3):213-6.
Chen Z, Robison L, Giller R et al.(2005). Risk of childhood germ cell tumors in association with parental smoking and drinking. Cancer. 2005 Mar 1;103(5):1064-71.
Coupland CA, Forman D, Chilvers CE et al. (2004). Maternal risk factors for testicular cancer: a population-based case-control study (UK). Cancer Causes Control. 2004 Apr;15(3):277-83.
Crawford SM (2010). UK cancer survival statistics reflect clinical realities in the NHS. BMJ 2010; 341:c5134.
Cummins S, Smith DM, Taylor M et al. (2009). Variations in fresh fruit and vegetable quality by store type, urban-rural setting and neighbourhood deprivation in Scotland. Public health nutrition, November 2009, vol./is. 12/11(2044-50), 1475-2727.
Department of Health (2007). Cancer reform strategy. London: Department of Health.
Department of Health (2009). Cancer Reform Strategy – Achieving local implementation second annual report. London: Department of Health.
dos Santos Silva I, Mangtani P, De Stavola BL et al. (2003). Survival from breast cancer among South Asian and non-South Asian women resident in South East England. Br J Cancer. 89:508-12.
64

Final Version Date of last update: 29 th October 2010
Emedicine (2010). Urology articles, accessed 6th August 2010, http://emedicine.medscape.com/urology.
Kaplon DM, Jarrard DF, Papadopoulos JN (2009). Urothelial Tumors of the Renal Pelvis and Ureters. Emedicine article accessed 6th August 2010, http://emedicine.medscape.com/article/452449-overview.
Eriksen KT, Petersen A, Poulsen AH et al. (2008). Social inequality and incidence of and survival from cancers of the kidney and urinary bladder in a population-based study in Denmark, 1994-2003. European Journal of Cancer, Sep 2008, vol./is. 44/14(2030-42), 0959-8049;1879-0852 (2008 Sep).
Faggiano F, Zanetti R. Costa G et al. (1994). Le differenze sociali nell'incidenza dei tumori a Torino negli anni180. In: Costa, G. & Faggiano, F., eds, L'equita nella salute in Italia. Milano, Italy, Franco Angeli.
Freedland SJ, Aronson WJ (2004). Examining the relationship between obesity and prostate cancer. Reviews in Urology, 2004, vol./is. 6/2(73-81), 1523-6161;1523-6161 (2004).
Gann H (2002). Risk factors for prostate cancer. Reviews in Urology, 2002, vol./is. 4 Suppl 5/(S3-S10), 1523-6161;1523-6161 (2002).
Gupta K,Miller JD,Li JZ,Russell MW et al. (2008). Epidemiologic and socioeconomic burden of metastatic renal cell carcinoma (mRCC): a literature review. Cancer Treatment Reviews, May 2008, vol./is. 34/3(193-205), 0305-7372;0305-7372 (2008 May).
Grulich AE, Swerdlow AJ, Head J et al. (1992). Cancer mortality in African and Caribbean migrants to England and Wales. Br J Cancer. 66:905-11.
Farooq S, Coleman MP (2005). Breast cancer survival in South Asian women in England and Wales. J Epidemiol Community Health. 59:402-6.
Gonzalez CA (2006). The European Prospective Investigation into Cancer and Nutrition (EPIC). Public Health Nutrition, Feb 2006, vol./is. 9/1A(124-6), 1368-9800;1368-9800 (2006 Feb).
Health Survey for England (2006)
Holick CN, De Vivo I, Feskanich D et al. (2005). Intake of fruits and vegetables, carotenoids, folate, and vitamins A, C, E and risk of bladder cancer among women (United States). Cancer Causes Control 2005;16:1135–45.
Holick CN, Giovannucci EL, Stampfer MJ et al. (2007). Prospective study of body mass index, height, physical activity and incidence of bladder cancer in US men and women. International Journal of Cancer, Jan 2007, vol./is. 120/1(140-6), 0020-7136;0020-7136 (2007 Jan 1).
Imperatori A, Harrison RN, Leitch DN et al. (2006). Lung cancer in Teesside (UK) and Varese (Italy): a comparison of management and survival. Thorax 2006;61:232-239 doi:10.1136/thx.2005.040477.
Jack RH, Davies EA, Møller H (2007). Testis and prostate cancer incidence in ethnic groups in South East England. Int J Androl. 2007 Aug;30(4):215-20; discussion 220-1.
Key TJ, Allen N, Appleby P et al. (2004). Fruits and vegetables and prostate cancer: no association among 1104 cases in a prospective study of 130544 men in the European Prospective Investigation into Cancer and Nutrition (EPIC). International Journal of Cancer, Mar 2004, vol./is. 109/1(119-24), 0020-7136;0020-7136 (2004 Mar).
Key TJ, Allen NE, Spencer EA et al. (2002). The effect of diet on risk of cancer. Lancet, Sep 2002, vol./is. 360/9336(861-8), 0140-6736;0140-6736 (2002 Sep 14).
Key TJ, Schatzkin A, Willett WC et al. (2004). Diet, nutrition and the prevention of cancer. Public Health Nutrition, Feb 2004, vol./is. 7/1A(187-200), 1368-9800;1368-9800 (2004 Feb).
Kaijser M, Akre O, Cnattingius S et al. (2003). Maternal lung cancer and testicular cancer risk in the offspring. Cancer Epidemiology, Biomarkers & Prevention, Jul 2003, vol./is. 12/7(643-6), 1055-
65

Final Version Date of last update: 29 th October 2010
9965;1055-9965 (2003 Jul).
Kirsh VA, Peters U, Mayne ST et al. (2007). Prospective study of fruit and vegetable intake and risk of prostate cancer. Journal of the National Cancer Institute, Aug 2007, vol./is. 99/15(1200-9), 0027-8874;1460-2105 (2007 Aug 1).
Kogevinas M, 't Mannetje A, Cordier S et al. (2003). Occupation and bladder cancer among men in Western Europe. Cancer Causes Control. 2003 Dec;14(10):907-14.
Larsson SC, Andersson SO, Johansson JE et al. (2008). Fruit and vegetable consumption and risk of bladder cancer: a prospective cohort study. Cancer Epidemiology, Biomarkers & Prevention, Sep 2008, vol./is. 17/9(2519-22), 1055-9965;1055-9965 (2008 Sep).
Lee JE, Männistö S, Spiegelman D et al. (2009). Intakes of fruit, vegetables, and carotenoids and renal cell cancer risk: a pooled analysis of 13 prospective studies. Cancer Epidemiol Biomarkers Prev. 2009 Jun;18(6):1730-9.
Matos EL, Loria DI Vilensky M et al. (1994) Cancer mortality and poverty in Argentina: a geographical correlation study. Cancer Epidemiol. Biomarkers Prev., 3, 213-218.
McGlynn KA, Zhang Y, Sakoda LC et al. (2006). Maternal smoking and testicular germ cell tumors. Cancer Epidemiology, Biomarkers & Prevention, Oct 2006, vol./is. 15/10(1820-4), 1055-9965;1055-9965 (2006 Oct).
McLaughlin JK, Lindblad P, Mellemgaard A et al. (1995). International renal-cell cancer study. I. Tobacco use. Int J Cancer. 1995 Jan 17;60(2):194-8.
Michaud DS, Pietinen P, Taylor PR et al. (2002). Intakes of fruits and vegetables, carotenoids and vitamins A, E, C in relation to the risk of bladder cancer in the ATBC cohort study. Br J Cancer 2002;87:960–5.
Mills PK, Beeson WL, Phillips RL et al. (1991). Bladder cancer in a low risk population: results from the Adventist Health Study. Am J Epidemiol 1991;133:230–9.
Moyad MA (2001). Review of potential risk factors for kidney (renal cell) cancer. Seminars in Urologic Oncology, Nov 2001, vol./is. 19/4(280-93), 1081-0943;1081-0943 (2001 Nov).
Nagano J, Kono S, Preston DL, et al. (2000). Bladder-cancer incidence in relation to vegetable and fruit consumption: a prospective study of atomic-bomb survivors. Int J Cancer 2000;86:132–8.
NHS Cancer Commissioning Toolkit (2010). Accessed 09/06/10, https://www.cancertoolkit.co.uk.
National Cancer Intelligence Network. GOING FURTHER ON CANCER WAITS (GFOCWs) A GUIDE, (VERSION 6.7).
National Cancer Intelligence Network (2008). Cancer Incidence by Deprivation England, 1995-2004. National Cancer Intelligence Network.
National Cancer Intelligence Network (2009a). Local Awareness and Early Diagnosis Baseline Assessments: A Guide for Cancer Networks and Primary Care Trusts. National Cancer Intelligence Network, National Cancer Action team.
National Cancer Intelligence Network (2009b). Cancer Incidence and Survival By Major Ethnic Group,England, 2002 – 2006. In collaboration with: Cancer Research UK Cancer Survival Group, London School of Hygiene & Tropical Medicine.
National Cancer Intelligence Network (2010a). Cancer equality measures by PCT – Prostate Cancer, Equalities portal. Accessed 4th August 2010, http://library.ncin.org.uk/equalities/atlases_1_0/prostate/atlas.html?indicator=i0&select=5LG
66

Final Version Date of last update: 29 th October 2010
National Cancer Intelligence Network (2010b). Cancer equality measures by PCT – Ethnicity data, Equalities portal. Accessed 11th June 2010, http://library.ncin.org.uk/equalities/100319atlases/Ethnicity/atlas.html?select=5LG&indicator=i0.
National Cancer Intelligence Network (2010c). UK Cancer Information Service (UKCIS) portal, accessed 3rd September 2010.
National Cancer Intelligence Network (2010d). One, Five and Ten Year Cancer Prevalence by Cancer Network, UK, 2006. London: National Cancer Intelligence Network.
Office of National Statistics (2002). The National Diet & Nutrition Survey: adults aged 19 to 64 years. Types and quantities of foods consumed, Volume 1. London: Her Majesty’s Stationary Office.
Office of National Statistics (2010). Cancer registration statistics 2007. Access 4th June 2010, http://www.statistics.gov.uk/StatBase/Product.asp?vlnk=7720&Pos=5&ColRank=1&Rank=160.
Pettersson A, Kaijser M, Richiardi L (2004). Women smoking and testicular cancer: one epidemic causing another? International Journal of Cancer, May 2004, vol./is. 109/6(941-4), 0020-7136;0020-7136 (2004 May 10).
Reeves GK, Pirie K, Beral V et al. (2007). Cancer incidence and mortality in relation to body mass index in the Million Women Study: cohort study. BMJ, Dec 2007, vol./is. 335/7630(1134), 0959-535X;1468-5833 (2007 Dec 1).
Renehan AG, Tyson M, Egger M et al. (2008). Body-mass index and incidence of cancer: a systematic review and meta-analysis of prospective observational studies. Lancet. 2008 Feb 16;371(9612):569-78.
Richards MA (2009). The size of the prize for earlier diagnosis of cancer in England. British Journal of Cancer (2009) 101, S125 – S129.
Rodriguez C, Patel AV, Calle EE et al. (2001). Body mass index, height, and prostate cancer mortality in two large cohorts of adult men in the United States. Cancer Epidemiol Biomarkers Prev. 2001 Apr;10(4):345-53.
Rohrmann S, Genkinger JM, Burke A et al. (2007). Smoking and risk of fatal prostate cancer in a prospective U.S. study. Urology. 2007 Apr;69(4):721-5.
Royal Marsden NHS Foundation Trust (2010). Email correspondence, dated 13/07/10, with David Marwick, Royal Marsden NHS Found Trust.
Sakr WA, Grignon DJ, Haas GP et al. (1996). Age and racial distribution of prostatic intraepithelial neoplasia. Eur Urol. 1996;30(2):138-44.
Setiawan VW, Stram DO, Nomura AM et al. (2007). Risk factors for renal cell cancer: the multiethnic cohort. Am J Epidemiol. 2007 Oct 15;166(8):932-40. Epub 2007 Jul 26.
Silberstein JL, Parsons JK (2010). Evidence-based principles of bladder cancer and diet. Urology, Feb 2010, vol./is. 75/2(340-6), 0090-4295;1527-9995 (2010 Feb).
Swerdlow AJ, Marmot MG, Grulich AE et al. (1995). Cancer mortality in Indian and British ethnic immigrants from the Indian subcontinent to England and Wales. Br J Cancer. 72:1312-9.
SWLCN (2010). South West London Cancer Network Report of National Primary Care Cancer Audit. Written by Dr. Assad Pasha and Amanda Cranston.
Tang L, Zirpoli GR, Guru K et al. (2008). Consumption of raw cruciferous vegetables is inversely associated with bladder cancer risk. Cancer Epidemiology, Biomarkers & Prevention, Apr 2008, vol./is. 17/4(938-44), 1055-9965;1055-9965 (2008 Apr).
67

Final Version Date of last update: 29 th October 2010
Takachi R, Inoue M, Sawada N et al. (2010). Fruits and vegetables in relation to prostate cancer in Japanese men: the Japan Public Health Center-Based Prospective Study. Nutrition & Cancer, 2010, vol./is. 62/1(30-9), 0163-5581;1532-7914 (2010).
Tavani A and La Vecchia C (1997). Epidemiology of renal-cell carcinoma. Journal of Nephrology, Mar 1997, vol./is. 10/2(93-106), 1121-8428;1121-8428 (1997 Mar-Apr).
Thames Cancer Registry (2009a). Data extract provided by the Thames Cancer Registry, December 2009.
Thames Cancer Registry (2010a). Email conversation with Vivian Mak, Information Team Leader, Thames Cancer Registry, dated 7th January 2010.
Thames Cancer Registry (2010b). Cancer in South East England 2007. Cancer incidence, prevalence, survival and treatment for residents of South East England. London: Thames Cancer Registry.
The Information Centre (2006). Health survey for England 2006 – Volume 1 - Cardiovascular disease and risk factors in adults. Leeds: The NHS Information Centre for health and social care.
The Information Centre (2008). Healthy Lifestyle Behaviours: Model Based Estimates for Primary Care Organisations in England, 2003-2005: User Guide. Accessed 15th June 2010, http://www.ic.nhs.uk/webfiles/Popgeog/PCO%20User%20Guide.pdf.
Thomson CS and Forman D (2009). Discussion Paper. Cancer survival in England and the influence of early diagnosis: what can we learn from recent EUROCARE results? British Journal of Cancer (2009) 101, S102 – S109
Zeegers MP, Goldbohm RA, van den Brandt PA (2001). Consumption of vegetables and fruits and urothelial cancer incidence: a prospective study. Cancer Epidemiol Biomarkers Prev 2001;10:1121–8.
Wild SH, Fischbacher CM, Brock A et al. (2006). Mortality from all cancers and lung, colorectal, breast and prostate cancer by country of birth in England and Wales, 2001-2003. Br J Cancer. 94:1079-85.
Winter H, Cheng KK, Cummins C et al. (1999). Cancer incidence in the south Asian population of England (1990-92). Br J Cancer. 79:645-54.
Wright ME, Chang SC, Schatzkin A et al. (2007). Prospective study of adiposity and weight change in relation to prostate cancer incidence and mortality. Cancer. 2007 Feb 15;109(4):675-84.
68

Final Version Date of last update: 29 th October 2010
Appendix 1: South West London GLA Projected population by ethnicity, 2010.
Croydon KingstonRichmond Sutton & Merton Wandsworth
Persons
All Ethnicities 341,201 154,405 185,634 382,766 293,877White 201,514 119,818 163,737 293,535 229,791Black Caribbean 34,954 1,101 660 11,156 11,139Black African 23,372 2,224 1,105 11,765 10,267Black Other 14,072 1,353 2,076 7,639 7,268Chinese 1,862 3,074 1,278 4,367 2,637Asian 56,188 17,204 10,897 42,071 20,073Other 9,239 9,632 5,881 12,232 10,231
Male
All Ethnicities 166,745 76,109 90,708 187,394 143,260White 99,906 59,546 80,182 144,540 113,206Black Caribbean 15,195 537 257 4,934 4,771Black African 11,280 1,101 499 5,528 4,710Black Other 6,789 698 1,095 3,577 3,511Chinese 825 1,484 514 2,126 1,258Asian 28,538 8,188 5,454 21,021 11,214Other 4,211 4,555 2,706 5,668 4,591
Female
All Ethnicities 174,456 78,296 94,926 195,372 150,618White 101,608 60,272 83,555 148,995 116,585Black Caribbean 19,760 564 403 6,222 6,368Black African 12,092 1,123 606 6,236 5,557Black Other 7,283 655 981 4,062 3,757Chinese 1,037 1,591 764 2,241 1,563Asian 27,649 9,016 5,443 21,050 10,869Other 5,028 5,077 3,175 6,565 5,919
Source: Greater London Authority Ethnic Group Projections 2008 Round, London Plan, Borough.
69