acoustic analysis of small arms fire dtic · acoustic analysis of small arms fire by dtic scott...
TRANSCRIPT

U;ýACERL Technical Report EC-94/06January 1994
Barriers and Structures foi Weapon Noise MitigationUS Army Corpsof EnginerHsconEtruction Enginoering________ Laboratories A D-A 278 306Ill~llili
Acoustic Analysis of Small Arms Fire
by DTICScott Peterson rI v E L E CT EPaul Schomer IC.
APR 2 219941This report presents the results of a study of the ispectral content of small arms fire at varying dis- Ftances. These data can be used in the design ofnoise mitigating structures for small arms ranges.The one-third octave spectra of both the bowwave and muzzle blast, for distances rangingfrom 162 to 577 m from the source are present-ed. The data are then used to develop a modelthat predicts the relative levels of the two compo-nents over much larger distances. This leads tothe finding that, along the line where the bowwave is maximum, the bow wave predominatesover the muzzle blast by a few dB for distancesas large as 10 km. In other directions, themuzzle blast predominates.
94-12167
DTIC QuU'i& 0 >, 3
Approved for public release; distribution is unlimited.
94 4 197

The contents of this report are not to be used for advertising, publication,or promotional purposes. Citation of trade names does not constitute anofficial endorsement or approval of the use of such commercial products.The findings of this report are not to be construed as an officialDepartment of the Army position, unless so designated by other authorizeddocuments.
DESTROY THIS REPORT WHEN IT IS NO LONGER NEEDED
DO NOT RETURN IT TO THE ORIGINATOR

USER EVALUATION OF REPORT
REFERENCE: USACERL Technical Report EC-94/06, Acoustic Analysis of Small Arms Fire
Please take a few minutes to answer the questions below, tear out this sheet, and return it to USACERL.As user of this report, your customer comments will provide USACERL with information essential forimproving future reports.
1. Does this report satisfy a need? (Comment on purpose, related project, or other area of interest forwhich report will be used.)
2. How, specifically, is the report being used? (Information source, design data or procedure,management procedure, source of ideas, etc.)
3. Has the information in this report led to any quantitative savings as far as manhours/contract dollarssaved, operating costs avoided, efficiencies achieved, etc.? If so, please elaborate.
4. What is your evaluation of this report in the following areas?
a. Presentation:
b. Completeness:
c. Easy to Understand:
d. Easy to Implement:
e. Adequate Reference Material:
f. Relates to Area of Interest:
g. Did the report meet your expectations?
h. Does the report raise unanswered questions?
i. General Comments. (Indicate what you think should be changed to make this report and future

reports of this type more responsive to your needs, more usable, improve readability, etc.)
5. If you would like to be contacted by the personnel who prepared this report to raise specific questions
or discuss the topic, please fill in the following information.
Name:
Telephone Number:
Organization Address:
6. Please mail the completed form to:
Department of the ArmyCONSTRUCTION ENGINEERING RESEARCH LABORATORIESATTN: CECER-IMTP.O. Box 9005Champaign, IL 61826-9005

REPORT DOCUMENTATION PAGE 1 AIOMB No. 0740188
Pubi rionng lurden for tis collection of information is estimated to average I hour per response, incluinng the time for reinvieang instructions. earchng exslting dat souMes.gateuing and maintainlng the data needed, end completing and reviewing the collection of information, Send comments regard•g this urden esmante or any other aspect of ftecoMection of Information, including suggestions for reduang this burden, to Washington Headquarters Servoce. Directorate for informaion Operations and Reports. 1215 JoeffsonDaom Highway. Suite 1204. Arlington, VA 22202-4302, and to the Office of Management and Budget. Paperwork Reduction Project (0704-0188). WashVngton. DC 20503.
1. AGENCY USE ONLY (Leave Blank) 2. REPORT DATE 3. REPORT TYPE AND DATES COVEREDJanuary 1994 Final
4. TITLE AND SUBTITLE 5. FUNDING NUMBERS
Acoustic Analysis of Small Arms Fire 4A162720A896NN-TUI
8. AUTHOR(S)Scott Peterson and Paul Schomer
7. PERFORMING ORGANIZATION NAME(S) AND ADDRESS(ES) 8. PERFORMING ORGANIZATIONU.S. Army Construction Engineering Research Laboratories (USACERL) REPORT NUMBER
P.O. Box 9005 TR EC-94/06Champaign, IL 61826-9005
9. SPONSORING/MONITORING AGENCY NAME(S) AND ADDRESS(ES) 10. SPONSORINGIMONITORING
Office of Assistant Chief of Engineers (OACE) AGENCY REPORT NUMBER
ATFN: ENVR-ERm IE685 The PentagonWashington, D.C. 20310-2600
11. SUPPLEMENTARY NOTES
Copies are available from the National Technical Information Service, 5285 Port Royal Road, Springfield, VA22161.
12a. DISTRIBUTIONIAVAILABILITY STATEMENT 12b. DISTRIBUTION CODE
Approved for public release; distribution is unlimited.
13. ABSTRACT (Maximum 200 words)
This report presents the results of a study of the spectral content of small arms fire at varying distances. Thesedata can be used in the design of noise mitigating structures for small arms ranges. The one-third octave spectraof both the bow wave and muzzle blast, for distances ranging from 162 to 577 mn from the source are presented.The data are then used to develop a model that predicts the relative levels of the two components over muchlarger distances. This leads to the finding that, along the line where the bow wave is maximum, the bow wavepredominates over the muzzle blast by a few dB for distances as large as 10 kin. In other directions, the muzzleblast predominates.
14. SUBJECT TERMS 15. NUMBER OF PAGES
acoustics 34noise assessment procedures 16. PRICE CODEsmall arms fire
17. SECURITY CLASSIFICATION 18. SECURITY CLASSIFICATION 19. SECURITY CLASSIFICATION 20. LIMITATION OF ABSTRACTOF REPORT OF THIS PAGE OF ABSTRACT
Unclassified Unclassified Unclassified SAR
NSN 7540-01-280-5500 Standard Form 298 (Rev. 2-89)Prescribed byANS• lSO 239-182W-102

FOREWORD
This research was carried out for the Office of the Assistant Chief of Engineers (OACE), underProject 4AI62720A896, "Base Facility Environmental Quality," Work Unit No. NN-TUI, "Barriers andStructures for Weapon Noise Mitigation." The technical monitor was LTC J. Graven, ENVR-E.
The work was done by the Acoustics Team (ECA) Environmental Compliance, Modeling, andSystems Division (EC), Environmental Sustainment Laboratory (EL), U.S. Army Construction EngineeringResearch Laboratories (USACERL). Dr. P.D. Schomer is team leader CECER-ECA, John T. Bandy isActing Chief, CECER-EC, and Dr. William D. Goran is Chief CECER-EL. The USACERL technicaleditor was Gloria J. Wienke, Information Management Office.
LTC David J. Rehbein is Commander of USACERL and Dr. L.R. Shaffer is Director.
2

CONTENTSPage
SF298 IFOREWORD 2LIST OF FIGURES 4
INTRODUCTION ................................................... 5BackgroundObjectiveApproachMode of Technology Transfer
2 PROBLEM DESCRIPTION ............................................ 6
3 DATA COLLECTION ................................................ 8Test SiteData Measurement
4 DATA ANALYSIS .................................................. 12Data ReductionFrequency AnalysisComparative Analysis
5 SUM MARY ....................................................... 17
REFERENCES 17
APPENDIX A: Plots of One-Third Octave Spectra of Bow Wave 18APPENDIX B: Plots of One-Third Octave Spectra of Muzzle Blast 25
DISTRIBUTION
Accesion ForNTIS CRA&IDTIC L rUnarlno•;,;ced
JUStifi-.atcn
By...............
Oist; ib tion /
Avaidb:;ity "oie,
Avi ai jio
Dist SI Ical,
3

FIGURES
Number Page
I Geometry of Bow Wave 7
2 Conical Spreading Pattern of Bow Wave 7
3 Relationship of Muzzle Blast and Bow Wave Propagation Patterns 9
4 Overall Test Site Layout 10
5 Microphone Station Setup i1
6 Sample Bow Wave From 25-m Station 13
7 Sample Muzzle Blast From 25-m Station 13
8 Muzzle Blast and Bow Wave ASEL vs. Distance Along Observation Path 14
9 Distances of Propagation for Muzzle Blast and Bow Wave 15
10 Model vs. Experimental Data (Muzzle Blast and Bow Wave) 16
Al Bow Wave Energy Spectrum 25 m From the Line of Fire 18
A2 Bow Wave Energy Spectrum 50 m From the Line of Fire 19
A3 Bow Wave Energy Spectrum 75 m From the Line of Fire 20
A4 Bow Wave Energy Spectrum 100 m From the Line of Fire 21
A5 Bow Wave Energy Spectrum 150 m From the Line of Fire 22
A6 Bow Wave Energy Spectrum 300 m From the Line of Fire 23
A7 Bow Wave Energy Spectrum 500 m From the Line of Fire 24
BI Muzzle Blast Energy Spectrum 162 m From the Muzzle 25
B2 Muzzle Blast Energy Spectrum 176 m From the Muzzle 26
B3 Muzzle Blast Energy Spectrum 193 m From the Muzzle 27
B4 Muzzle Blast Energy Spectrum 211 m From the Muzzle 28
B5 Muzzle Blast Energy Spectrum 251 m From the Muzzle 29
B6 Muzzle Blast Energy Spectrum 386 m From the Muzzle 30
B7 Muzzle Blast Energy Spectrum 577 m From the Muzzle 31
4

ACOUSTICS ANALYSIS OF SMALL ARMS FIRE
1 INTRODUCTION
Background
Small arms can be an environmental noise problem for people living and working either both on-or off-base in the vicinity of a firing range. This is especially true when the small arms complex isassociated with a reserve or guard component or is not associated with a larger range complex where largeweapons are fired. In the absence of large weapons, the small arms become the predominant noise source,the range complex is smaller, and communities are situated closer to the range. In Germany this isfrequently the case. Small arms firing is associated with a local Kaserne (German military station) andNational Guard weekend and local training sites where no large weapons are fired and the distance to on-or off-post housing can be very small, sometimes less than 100 meters (in).
The noise generated at a small-arms range has two components: the muzzle blast and the sonicboom, bow wave noise generated by the flight of the bullet. The bow wave only propagates forward ofthe line-of-fire and within the mach angle defined by the bullet's speed. Because the bow wave has beenreported as a major noise source in Germany, military designers need accurate small arms soundgenerating data when designing noise mitigating structures for small arms ranges.
Objective
The purpose of this research was to document measurements and analysis of the muzzle blast andbow wave sound generated by small arms (M16) fire and to estimate where in the vicinity of a firingrange either sound will predominate.
Approach
Researchers gathered experimental data for the M16 rifle at a flat, open test range at AberdeenProving Ground, MD. The data were an".!yzed to obtain one-third octave sound spectra for the twocomponents of a shot (muzzle blast and the bullet shock wave), the overall sound exposure level (SEL),and the SEL for each component of a gun shot. The data were taken at eight stations to allow for theanalysis of the decay rate with distance. The results for each component were compared to determine thedominant factors in small arms fire. The results were modeled to account for geometric spreading, airabsorption, and source directivity and were then extrapolated to determine the expected results fordistances longer than those tested.
Mode of Technology Transfer
The U.S. Army Environmental Hygiene Agency (USAEHA) has the operational mission to assistArmy installations with noise assessment and mitigation. USAEHA will use the data in this report inassessing small arms noise around military installations. These data will also be used to develop noisemitigating structures as required, primarily in Germany. Headquarters, U.S. Army Europe and SeventhArmy will supply these data to the European Division, which will provide them as "Government FurnishedMaterials" for a contract to design a noise mitigating structure for a small arms range; however, nospecific range upgrades or modifications are currently planned. In the continental United States, USAEHAwill supply these data if noise mitigating structures are recommended at a small arms range.
5

2 PROBLEM DESCRIPTION
When small arms are fired, the sound created has two major components: the muzzle blast and thebow shock or bow wave. The muzzle blast is caused by the powder charge exploding in the gun chamberand can be modeled as an explosion of some equivalent weight of TNT with some directivity specific tothe weapon being fired. Therefore, except for the nonuniform directivity pattern, which will be discussedlater, the muzzle blast can be modeled by a simple point source located at the point of fire. This leadsto the conclusion that the muzzle blast should propagate in a spherical pattern. Sound exposure level(SEL) is used to measure this pattern and is defined by:
SL=log. 2dt [Eq I I2dSEL=l101og1 ) [F,2i2Pt, to
where:po = 20 pPa.to = I second,the integral is performed over the entire event.
Considering that the energy decays in proportion to the surface area of a sphere, it can be shown that theSEL decays, purely due to geometric spreading, as R 2, where R is the distance from the point of fire tothe point of interest. This is equivalent to -6 decibel (dB) per doubling of distance.
The bow wave portion of the shot noise is caused by the bullet traveling faster than the speed ofsound. As long as the bullet's mach number exceeds 1, a bow wave will be continually produced alongthe bullet's trajectory. The amplitude of this bow wave depends on the geometry and caliber of the bullet,while the direction of propagation relative to the trajectory is determined by the speed of the projectile.As shown in Figure 1, a supersonic bullet causes a bow wave with a mach angle alpha (oa). The bowwave propagates perpendicular to the mach angle, creating a conical spreading pattern (Figure 2). It hasbeen shown that the SEL of the bow wave portion of the gunshot depends on the surface area of thisconical shape (Thompson). The SEL decays nonlinearly in the near field, where the pressure is very large.This nonlinear model (Pierce 1989) suggests that the SEL decays in direct proportion to h-3'4, where h isthe horizontal distance from the bullet trajectory to the point of interest. The distaince the bow wave hastraveled perpendicular to the mach angle is related to h by
r=hcos (a) [Eq 21
Consequently, r is directly proportional to h and the SEL decays in the near field in direct proportion tor3'4. This can be stated as -4.5 dB per doubling of distance r. In the far field, and for smaller peakpressures, the SEL decay can be modeled by a linear model that depends solely on the geometrical spread-ing effects of the conical surface. When this is the case, the SEL decays in proportion to r", which isequivalent to -3 dB per doubling of distance.
"6

Y
Bow Wave
Direction ofBow Wave Propagation
Figure 1. Geometry of Bow Wave.
Y
Point of Interest
Bow Wave Propagation
Figure 2. Conical Spreading Pattern of Bow Wave.
7

3 DATA COLLECTION
Test Site
These tests were performed at an open, flat test field in an isolated area of Aberdeen ProvingGround. The site was centered in a large, grassy field.
Gun handlers stood on top of a pickup truck and fired M16 rifles into a sand target 300 m downrange. Both muffled and unmuffled guns were used. The mufflers were cylindrical and were screwedonto the barrel of the gun. Testing was performed over a 2-day period. The first day began with testingin the afternoon. All of the testing on day I was done with muffled guns. On day 2, bare muzzle gunswere used for half of the tests and muffled guns for the other half.
In theory, a muzzled shot should contain only the bow wave portion of the sound, which wouldallow comparison of a gunshot's total sound generation to a bow wave with no further data manipulation.In practice, the data needed further analysis. Each round of testing began with several test shots to verifyequipment setup. After several test shots, the remaining shots were fired in groups of 10 with 3 to 5seconds between each round. The 10-shot groups alternated between muffled and unmuffled. Calibrationtones were recorded at the beginning of each testing session using 92 dB acoustic calibrators.
The test equipment and site was designed to record data in which the muzzle blast and bow waveare distinguishable from each other. The general relationship between the two different wave propagationpatterns (Figure 3) shows that the muzzle blast, as discussed earlier, propagates uniformly in a sphericalpattern. Therefore, assuming uniform source directivity and equivalent paths of propagation from thesource to each microphone, no special arrangement of the microphones is needed to properly monitor thedecay of the muzzle blast. However, the bow wave is propagating linearly, as discussed previously.Therefore, to accurately monitor the decay of the bow wave, the microphones need to be arranged alongthe path of propagation of any given segment of the bow wave. That is, they must be located so that theportion of the bow wave that crosses the first microphone travels directly across all other microphones.In this test, this condition corresponds to locating the microphones on a ray intersecting the line of fireat an angle of (90-a).
To accomplish this arrangement, the testing range was designed with eight microphone stationslocated on a ray in the expected direction of bow wave propagation, with the origin of the ray 150 mdown range from the point of fire, midway between the firing point and the target (Figure 4). Themicrophones were located at 25, 50, 75, 100, 150, 300, 500, and 750 m from the line of fire and thus theorigin of the bow wave, and are 162, 176, 193, 211, 251, 386, 577, and 822 m from the point of fire,respectively. The geometry of the test setup demonstrates that the muzzle blast must travel farther thanits associated bow wave to reach each microphone station. Since the portion of the bow wave to bemonitored is that which is created 150 m down range from the point of fire, and the bullet speed issupersonic, there will be a delay between the arrival of the bow wave and the muzzle blast. This delaydecreases as the stations get further away, and the difference in path length from the source to microphonedecreases. This delay allows differentiation between the muzzle blast and bow wave.
Data Measurement
The data collection stations for this test were designed to monitor and record measurements duringthe test as well as record the entire test for any additional analysis required later. Each microphonestation, shown in Figure 5, included a B&K 4921 microphone with external 12-volt battery, a USACERLModel 380 Noise Monitoring System, a modified Sony pulse code modulator with a Panasonic VHS videorecorder, and an NEC Starlet computer. The Model 380 Noise Monitors measured A- and C-weightedsound exposure levels while the flat-weighted signal was recorded on the tape for later analysis. The first
8

Line of Fire
ofFire
Muzzle Blast
Figure 3. Relationship of Muzzle Blast and Bow Wave Propagation Patterns.
five stations were connected by cable to the instrument van parked near the firing station. The data fromthese stations were monitored, recorded, and printed with instruments in the van. The outer four stationswere manned stations. These stations were manually triggered, with the instruments set to pretrigger by2 seconds. This allowed the people manning the stations to listen for a shot and then press the triggerbutton. After triggering, the monitors then calculated the necessary information from the data from theprevious 2 seconds. The people recorded the levels from the monitors on data sheets for each shot. TheVHS recorders were located at the microphone site and were running continuously throughout the test.The video channel was used with a pulse code modulator to record the output of the microphone whilethe audio channels were used for tet narration.
9

750 m
MicrophoneStations
500 m
300m
15 m
Soft Impact Target o0 m
"• - o • •-25m
OZ Point of Fire
Figure 4. Overall Test Site Layout.
10

S~Model 380-" • Noise
Monitoring NEC Printer
Microphone System Starlet
12V Battery Spony VCR
Figure 5. Microphone Station Setup.
11

4 DATA ANALYSIS
Data Reduction
The tests were designed to:
I. Identify and quantify the two acoustic components of a gun shot, and
2. Study how the different components decay over distance and affect the overall SEL.
The data recorded digitally on VHS tape was first played back through a DATA6000 waveformanalyzer and a sample was taken. The data was sampled at 50 microseconds with a total of 8192 points,leading to a sample of approximately 400 milliseconds. A sample bow wave and a sample muzzle blastfrom the 25-m station are shown in Figures 6 and 7, respectively. Figure 7 includes trailing oscillationsfor the bow wave passage. These appear as a "high frequency" wave added to the muzzle blast.
Each shot was analyzed in three ways. First, to isolate the muzzle blast, a time window containingthe bow wave was set to zero and the muzzle blast remained unchanged. Then, an FFT (with nowindowing) was performed using a DATA6000 computing oscilloscope. This analysis produced a narrowband graph of energy versus frequency. For each shot, the data developed by the FFT contained 4096spectral lines. This type of analysis results in a resolution of 2.44 hertz (Hz) per line and a range from2.44 Hz to 10 kHz. (These frequency data were saved as an ASCII file for further analysis.) Second, theoriginal waveform was recalled from memory, and a similar procedure was performed to eliminate themuzzle blast portion, leaving only the bow wave. Third, FFT data were calculated for the entire shot, withboth components present.
For each of the three analyses, the narrow band energy data in the ASCII file was summed intoapproximate one-third octave bands. Frequencies below 20 Hz had few data points per band and werediscarded because of lack of resolution. The energy in the one-third octave bands was used to calculatethe flat- and A-weighted SEL. Fifteen to 20 shots were analyzed and the energy in each band wasaveraged to obtain an average energy at each station. This average was then used to compute the averagebroad-band SEL of each component. The data recorded from the 750-m station was below the noise floorof the instruments and could not be extracted and analyzed further. Future data analysis will deal onlywith the first seven stations. The spectral plots of the bow wave and muzzle blast, for all stations, areshown in Appendixes A and B, respectively.
Frequency Analysis
The one-third octave analysis of the gun shots showed that the bow wave is centered around the 4kHz band. The muzzle blast contains much lower frequency energy, with the flat weighted data centeredaround 200 Hz and the A-weighted data centered around 250 Hz. Because of the large difference in themain components of spectral energy between the bow wave and the muzzle blast, A-weighting the signalhas a very large effect. An A-weighting filter attenuates the muzzle blast fundamental frequency by about13 dB while it increases the bow wave by about 1 dB. Thus the A-weighting significantly affectscomparison of the bow wave and muzzle blast. Both flat and A-weighted data are presented asappropriate; however, only A-weighted data are used for comparison.
Comparative Analysis
The different components must to be compared to determine rates of decay and relative sound levelover distance. Figure 8 shows the levels of the bow wave and muzzle blast acrco' distance. It is
12

1.5
1
0.5
S0
-0.5
0 200 400 600 800 1000 1200 1400 1600 1800 2000 2200 2400100 300 500 700 900 1100 1300 1500 1700 1900 2100 2300 2500
Time (microseconds)
Figure 6. Sample Bow Wave From 25-m Station.
1.5
0AM
0.5
-0.5-
0 1 2 3 4 5 6 7 8 9 10 11 12 13 14 15 16 17 18 19 20Time (milliseconds)
Figure 7. Sample Muzzle Blast From 25-m Station.
13

important to note that the distance along which the levels are displayed is the distance from the line offire to the microphone station. This is the true distance the bow wave has traveled. This is not, however,the distance the muzzle blast has traveled. Figure 9 shows that the muzzle blast must travel distance Xat an angle 1 from the line of fire while the bow wave must only travel distance Y from its source. Dueto this geometry, the decay rate of the muzzle blast, along the line of observation, is not the true decayrate. The effect of the nonuniform source directivity also becomes increasingly important as the anglefrom the source increases. A model has been developed which includes the dominant factors affectingthe levels of the two components as they decay.
The major factors to be considered in modeling these decaying components are: geometric spreading,air absorption, and, for the muzzle blast, source directivity. The air absorptions coefficients, for a standardday with temperature of 15 °C and 70 percent relative humidity, were taken into account for each one-third octave band. The muzzle blast was assumed to be decaying at -6 dB per doubling of distance andthe bow wave at -3 dB per doubling of distance, purely due to geometric spreading.* When modeling the
100
95
S90
85 -
S80 -
o75 -
70 -
0on 65 -
60 -
5510 100 1000
Distance Along Observation Path (m)
. Bow Wave . Muzzle Blast
Figure 8. Muzzle Blast and Bow Wave ASEL vs. Distance Along Observation Path.
At some distance from the line of fire, the bow wave must also decay at 6 dB per doubling of distance. Since, in this case,the line of fire is 300 m, decay must be more like 6 d3 per doubling of distance at 3000 m, 10 times the length of the lineof fire. So Figure 10 is overly conservative. In the case of a 300-m firing range, one would expect the muzzle blast topredominate past about 3 to 5 km. However, were the line of fire I km long, then the muzzle blast could not predominateuntil about 10 km.
14

X is the distance of MuzzleY is the distance of Blast propagation
Bow Wave Propagation
y x
Soft Impact Target
Point of Fire
Figure 9. Distances of Propagation for Muzzle Blast and Bow Wave.
15

muzzle blast, it is important to account for the nonuniform source directivity pattern. Pater (1985) definesthe directivity pattern by:
DD.(-1 + cos P cos o) [Eq 312
where:1 = azimuthal angle from the direction of fire
= gun elevation angleD= 14.3 (for M16).
This equation indicates that the directivity can have a maximum effect of -14.3 dB. Since gunelevation angle was approximately zero, the directivity factor depends on only the azimuthal angle fromthe direction of fire. The model was fitted to this set of data using the 50-m station as a base point. Thatis, the 50-m spectral data exactly fits the model. The theoretical spectra were then calculated accordingto the model for distances both smaller and larger than 50 m. The spectral data was then summed to givetheoretical ASEL versus distance. The levels determined by the model and the actual data are showntogether in Figure 10; the model fits the data well. The level of the model is consistently low by about2 to 3 dB for both components. It seems probable that this is a result of the 50-m data point being lowin comparison with other stations. If the model were to consider a different data point as the base, or wereraised to be a "best fit" curve, it would approximate the data very well. This indicates that the modelaccurately reflects the important factors affecting the propagation of both components.
ASEL vs. Distance
<0
1 9 0 0
000
Q) A> 8 070A AAA4 A~
~70 A 0 00A 0
S00
muzzle blast data A650--* bow wave data 0& muzzle blast model 0 0
o bow wave model A o"030ooCO
10 i5 10 100 1000 10000
Distance Along Bow Wave Path (m)
Figure 10. Model vs. Experimental Data (Muzzle Blast and Bow Wave).
16

5 SUMMARY
This research showed the spectral data gathered from the small arms fire and identified the bowwave and muzzle blast as the important components. The decay rates of the different components, asobserved along the microphone array, were also shown. Considering the geometry of the test setup, thebow wave is the dominant component at all test locations. Along lines that interest the line of fire atangles greater or lesser than the one specifically tested in this research, the bow wave will not be at amaximum. Therefore, along these lines the muzzle blast predominates a distances less than 10,000 m.For example, directly in front of the gun the muzzle blast has a directivity factor of 0 dB and it willpredominate within a few hundred meters. The muzzle blast will always predominate in areas along linesthat interest the line of fire at angles greater than 90 minus the mach angle (ac). But the bow wave mustbe considered if communities are within 10,000 m (10 kin) of the firing range and lie along lines thatinterest the line of fire at an angle less than 90-a.
REFERENCES
Thompson, Andrew A., The Acoustic Environment Predicted from the Firing of a 175mm Gun. BRL Memorandum Report No.1910 (U.S. Army Ballistic Research Laboratory, Aberdeen Proving Ground, MD).
Paler, L.L., Gun Blast Far Field Peak Overpressure Contours, NSWC TR 79-442 (Combat Systems Department, Naval SurfaceWeapons Center, 1981).
Pierce, Allan D., Acoustics An Introduction to its Phys'•Cl Principles and Applications (Acoustical Society of America,Woodbury. New York. 1989).
17

APPENDIX A: Plots of One-Third Octave Spectra of Bow Wave
100
SEL: Flat = 93.0 dBso - A-weight = 93.6 dB
~60,-1
A"40
0
20
20
0 63 250 1000 4000125 500 2000 8000 overall
1/3 Octave Bands
M Flat H A-Weighted
Figure Al. Bow Wave Energy Spectrum 25 m From the Line of Fire.
The measurement site was 162 m from the muzzle, forming an angle of 8 degrees with the line offire. As shown in Figure 9, the measurement site was along a line eminating from the center of the lineof fire and perpendicular to the mach angle. The distance along this line, from the line of fire was 25 m.Data below the 63 Hz one-third octave band were deleted due to wind noise.
18

100
SEL: Flat = 80.4 dBso - A-weight = 81.0 dB
*60
U040
0
63 125 250 500 1000 2000 8000 overall
1/3 Octave Bands
U Flat H A-Weighted
Figure A2. Bow Wave Energy Spectrum 50 m From the Line of Fire.
The measurement site was 176 m from the muzzle, forming an angle of 15 degrees with the lineof fire. As shown in Figure 9, the measurement site was along a line eminating from the center of theline of fire and perpendicular to the mach angle. The distance along this line, from the line of fire was50 m. Data below the 63 Hz one-third octave band were deleted due to wind noise.
19

100
SEL: Flat = 78.9 dB80 - A-weight = 79.7 dB
~60
0
9
"a40
0
20 063 125 250 500 2000 4000 8000 overall
1/3 Octave Bands
U Flat H A-Weighted
Figure A3. Bow Wave Energy Spectrum 75 m From the Line of Fire.
The measurement site was 193 m from the muzzle, forming an angle of 21 degrees with the lineof fire. As shown in Figure 9, the measurement site was along a line eminating from the center of theline of fire and perpendicular to the mach angle. The distance along this line, from the line of fire was75 m. Data below the 63 Hz one-third octave band were deleted due to wind noise.
20

100
SEL: Flat = 78.8 dB80 -A-weight = 79.6 dB
60
"-40
20
63 125 250 500 1000 2000 8000 overall
1/3 Octave Bands
U Flat U A-Weighted
Figure A4. Bow Wave Energy Spectrum 100 m From the Line of Fire.
The measurement site was 211 m from the muzzle, forming an angle of 26 degrees with the lineof fire. As shown in Figure 9, the measurement site was along a line eminating from the center of theline of fire and perpendicular to the mach angle. The distance along this line, from the line of fire was100 m. Data below the 63 Hz one-third octave band were deleted due to wind noise.
21

100
SEL: Flat = 75.3 dB80 -A-weight = 75.9 dB
.60
0
"•40
0to
20
01
63 125 500 2000 8000 overall
1/3 Octave Bands
U Flat H A-Weighted
Figure AS. Bow Wave Energy Spectrum 150 m From the Line of Fire.
The measurement site was 251 m from the muzzle, forming an angle of 33 degrees with the lineof fire. As shown in Figure 9, the measurement site was along a line eminating from the center of theline of fire and perpendicular to the mach angle. The distance along this line, from the line of fire was150 m. Data below the 63 Hz one-third octave band were deleted due to wind noise.
22

100
SEL: Flat = 72.9 dB80 - A-weight = 73.9 dB
~60
0
"a 40o0
20
63 250 1000 4000125 500 2000 8000 overall
1/3 Octave Bands
U Flat H A-Weighted
Figure A6. Bow Wave Energy Spectrum 300 m From the Line of Fire.
The measurement site was 386 m from the muzzle, forming an angle of 45 degrees with the lineof fire. As shown in Figure 9, the measurement site was along a line eminating from the center of theline of fire and perpendicular to the mach angle. The distance along this line, from the line of fire was300 m. Data below the 63 Hz one-third octave band were deleted due to wind noise.
23

100
SEL: Flat = 59.2 dB80 -A-weight = 59.7 dB
~60
"40
20
20
63 125 250 500 1000 4000 8000
1/3 Octave Bands
U Flat U A-Weighted
Figure A7. Bow Wave Energy Spectrum 500 m From the Line of Fire.
The measurement site was 577 m from the muzzle, forming an angle of 53 degrees with the lineof fire. As shown in Figure 9, the measurement site was along a line eminating from the center of theline of fire and perpendicular to the mach angle. The distance along this line, from the line of fire was500 m. Data below the 63 Hz one-third octave band were deleted due to wind noise.
24

APPENDIX B: Plots of One-Third Octave Spectra of Muzzle Blast
100
SEL: Flat = 81.2 dB80 - A-weight = 77.5 dB
~60
0
"40
0
32 63 125 250 1000 2000 8000 overall
1/3 Octave Bands
M Flat U A-Weighted
Figure BI. Muzzle Blast Energy Spectrum 162 m From the Muzzle.
The measurement site was 162 m from the muzzle, forming an angle of 8 degrees with the line offire. Data below the 32 Hz one-third octave band were deleted due to wind noise.
25

100
SEL: Flat = 77.8 dB
80 - A-weight = 72.7 dB
-160U
"•40
0
20
32 63 125 20 500 100 2000 400 8000 overall32 63 1 25 0 004000
1/3 Octave Bands
Flat H A-Weighted
Figure B2. Muzzle Blast Energy Spectrum 176 m From the Muzzle.
The measurement site was 176 m from the muzzle, forming an angle of 15 degrees with the line
of fire. Data below the 32 Hz one-third octave band were deleted due to wind noise.
26

100
SEL: Flat = 78.3 dB80 - A-weight = 72.8 dB
60-
40
0
Cn"1 40 -0ri€l
20
32 125 250 500 2000 8000 overall1325 000 40001/3 Octave Bands
U Flat H A-Weighted
Figure B3. Muzzle Blast Energy Spectrum 193 m From the Muzzle.
The measurement site was 193 m from the muzzle, forming an angle of 21 degrees with the lineof fire. Data below the 32 Hz one-third octave band were deleted due to wind noise.
27
100
SEL: Flat = 75.5 dB80 A-weight - 69.7 dB
75u60
"a40
20
063 250 1000 4000125 500 2000 8000 overall
1/3 Octave Bands
EaFlat U A-Weighted
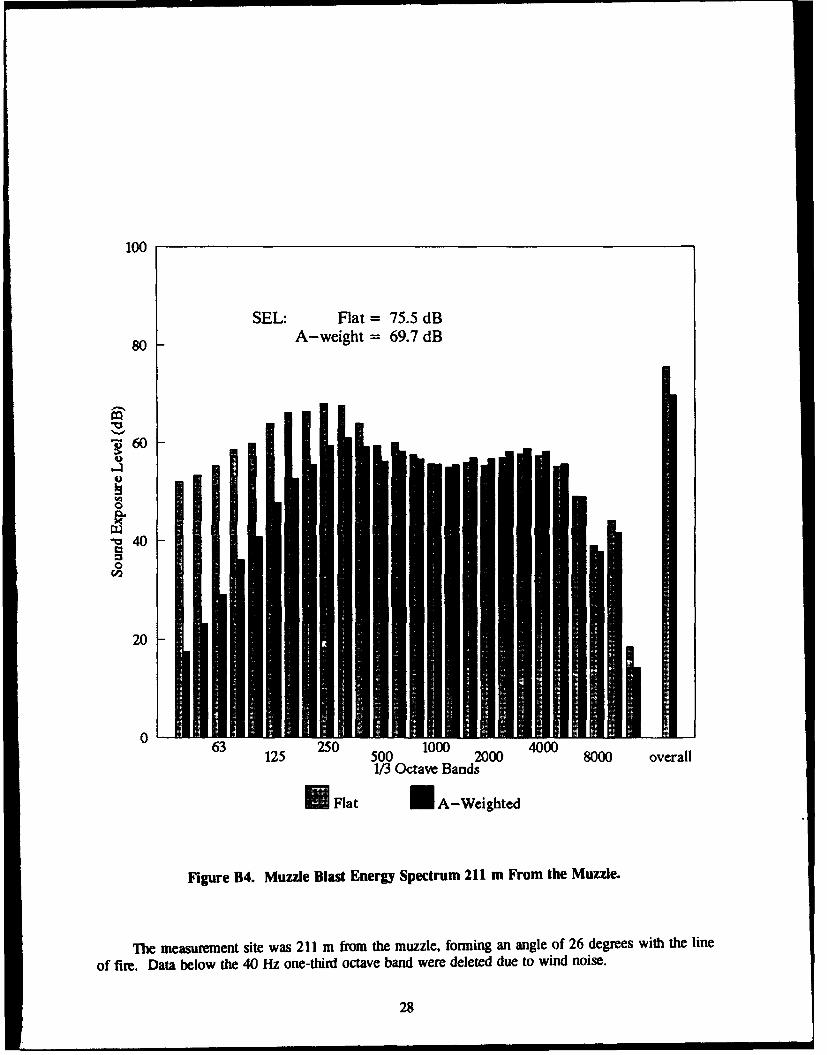
Figure B4. Muzzle Blast Energy Spectrum 211 m From the Muzzle.
The measurement site was 211 m from the muzzle, forming an angle of 26 degrees with the line
of fire. Data below the 40 Hz one-third octave band were deleted due to wind noise.
28

100
SEL: Flat = 76.4 dB80 - A-weight = 70.2 dB
~60
0
"-40
0
20
32 63 125 500 2000 8000 overall63201000 4000
1/3 Octave Bands
M Flat UaA-Weighted
Figure B5. Muzzle Blast Energy Spectrum 251 m From the Muzzle.
The measurement site was 251 m from the muzzle, forming an angle of 33 degrees with the lineof fire. Data below the 32 Hz one-third octave band were deleted due to wind noise.
29

100
SEL: Flat = 65.7 dB80 - A-weight = 64.9 dB
-60-
" 40
0rA
20
0 125 500 100 2000 4000 8000 overall63 25010040
1/3 Octave Bands
U Flat U A-Weighted
Figure B6. Muzzle Blast Energy Spectrum 386 m From the Muzzle.
The measurement site was 386 m from the muzzle, forming an angle of 45 degrees with the lineof fire. Data below the 50 Hz one-third octave band were deleted due to wind noise.
30

100
SEL: Flat = 61.3 dB80 -A-weight = 59.7 dB
~60
0
"-o40 -
20 -20
63 125 250 500 1000 2000 8000 overall63 25 10004000
1/3 Octave Bands
U Flat H A-Weighted
Figure B7. Muzzle Blast Energy Spectrum 577 m From the Muzzle.
The measurement site was 577 m from the muzzle, forming an angle of 53 degrees with the lineof fire. Data below the 50 Hz one-third octave band were deleted due to wind noise.
31

Distribution
Chief of Engineers USAWES 39180ATTN: CEHEC-IM-LP (2) ATfN: WESSEN-B
ATFN: CEHEC-IM-LH (2) ATTN: Soils & Pavements Lab
ATTN: CERD-L ATTN: C/Structures
ATTN: CEMP-CEATTN: CEMP-EA Wright-Patterson AFB, OH 45433
ATTN: CEMP-EI (2) ATTN: AAMRIJBBATTN: CEMP-ZA ATTN: AAMRL/BBEATTN: CEMP-ZM (2)ATTN: ENVR-E Ft. Monmouth 07703
ATTN: AMSEL-EW-MD
HQ USAF/LEEEU 20332WASH DC 20410
AMC 22333 ATTN: Housing & Urban Dev (2)
ATTN: AMCEN-ANat'l Institute of Standards & Tech 20899
Naval Air Systems Command 20360 ATTN: Force & Acoustics Group
ATTN: LibraryDepartment of Transportation
Little Rock AFB 72099 ATTN: Library 20590ATTN: 314/DEEE
Naval Undersea Center, Code 401 92132Aberdeen PG, MD 21010
ATTN: Safety Office Range Safety Div Bureau of National Affairs 20037ATTN: US Army Ballistic Res Lab (2)ATTN: ARNG Operating Activity Ctr Building Research Board 20418ATFN: Human Engineer Lab
Transportation Research Board 20418Edgewood Arsenal, MD 21010
ATTN: HSHB-MO-B Federal Aviation Administration 20591
Fort Belvoir, VA 22060 Defense Technical Info. CenterATTN: NACEC-FB ATTN: DTIC-FAB (2)ATTN: CECC-R
46NAVFAC 22332 +37
ATTN: Code 2003 04/92
Naval Surface Weapons Center 22448ATTN: N-43
Ft. McPherson, GA 30330ATTN: AFEN-FEB
US Army Aeromedical Res Lab 36362ATTN: SGRD-UAS-AS
This publication was reproduced on recycled paper. # U.S. GOVERNMENT PRINTING OFFICE: 1994-3510-S/00006