acquisition and reprogramming of patient fibroblasts · web viewrna extraction was performed...
TRANSCRIPT
Supplementary Information
Astrocyte pathology in a human neural stem cell model of frontotemporal
dementia caused by mutant TAU protein
Anna-Lena Hallmann, Marcos J. Araúzo-Bravo, Lampros Mavrommatis, Marc Ehrlich, Albrecht
Rӧpke, Johannes Brockhaus, Markus Missler, Jared Sterneckert, Hans R. Schöler, Tanja Kuhlmann,
Holm Zaehres, Gunnar Hargus
1
Supplementary Methods
Derivation and culturing of human neural progenitor cells
Fibroblasts from an individual carrying the N279K mutation in MAPT, here referred to as
FTD patient, were obtained from the Coriell Institute for Medical Research, which had
received informed consent from the donor. Fibroblasts had been reprogrammed into iPS cells
using the lentiviral SF-OSKM-tomato expression vector as previously described1. All
procedures were approved and were carried out in accordance with approved guidelines (MPI
53.02.01-M-1.26/10; Bezirksregierung Düsseldorf). Neural progenitor cells (NPCs) were
differentiated from FTD iPS cells using a well-established differentiation protocol1-3. NPCs
were cultured in expansion medium consisting in equal parts of DMEM-F12 (Invitrogen) and
neurobasal medium (Invitrogen) with 1:200 N2 supplement (Invitrogen), 1:100 B27
supplement lacking vitamin A (Invitrogen), 1% penicillin/streptomycin/glutamine, 3 µM
CHIR99021 (Axon Medchem), 0.5 µM SAG (Cayman Chemical) and 150 µM ascorbic acid
(AA; Sigma). Cells were grown on matrigel-coated (Matrigel, growth factor reduced, high
concentration; BD Bioscience) 12-well plates (Nunc) and split once a week at ratios of 1:15 to
1:20 by treatment with accutase (Sigma).
Karyotype analysis of FTD NPCs and gene-corrected control NPCs
Karyotype analysis of isogenic control NPCs was performed as previously described1. Briefly,
confluent cultures of NPCs were incubated with 0.3 mg/ml colcimid (KaryoMAC; Invitrogen)
for 3 h, washed with PBS and digested to single cells by treatment with trypsin-EDTA in
DMEM. Singularized cells were centrifuged and subsequently resuspended in KCl solution
(75 mM). Following incubation for 7 min at room temperature, cells were spun down and
resuspended in ice-cold fixation solution (3:1 methanol/acetic acid) and left shaking. Fixed
cells were centrifuged once more and taken up in fresh fixative and incubated for another 20
2
min at 4°C. Different dilutions of cells were dropped onto glass slides (Menzel Gläser,
Thermo Scientific) for analysis. Chromosomes were GTG-banded by standard procedures and
metaphase spreads were analyzed using a Zeiss AxioScop and the Cytovision software
(Applied Imaging Corporation).
Immunocytochemistry
For immunocytochemical staining, cells were fixed in 4% PFA in PBS for 20 min at RT.
Fixed cells were permeabilized by three washing steps with 0.2% Triton X-100 (Sigma) in
PBS before blocking, which was performed by incubating the cells with 10% normal goat
serum (NGS) in PBS for 1 h at RT. Primary Antibodies (GFAP: Dako, Z0334, rabbit, 1:4000;
Synaptophysin: Dako, M0776, mouse, 1:500; GFP: Abcam, ab6556, rabbit, 1:2000; MAP2:
Santa Cruz, SC-20172, rabbit, 1:1000; βIII-Tubulin: Covance, MMS-435P, mouse, 1:750;
AT8: Thermo Scientific, MN1020, mouse, 1:150; Nestin: R&D Systems, MAB1259, mouse,
1:300; SOX1: R&D Systems, AF3369, goat, 1: 150; cleaved CASPASE-3 (Asp175): Cell
Signaling, #9661, rabbit, 1:200; TH: Pel-Freez, P40101-150, rabbit, 1:500, GABA-RB:
Sigma, SAB4501062, rabbit, 1:100) were applied overnight at 4 °C in blocking solution.
Following three washing steps with PBS, cells were incubated with Alexa Fluor conjugated
secondary antibodies diluted in blocking solution for 1 h at RT. Secondary antibody
incubation was followed by three washing steps with PBS with the second washing step
containing a DAPI staining for nuclei. Cells on glass coverslips were mounted in Shandon
Immu-Mount medium (Fisher Scientific) and visualized on a Zeiss LSM700 confocal
microscope. For Phalloidin staining, permeabilized cells were incubated with Alexa Fluor®
488 Phalloidin (Thermo Fisher Scientific, A12379) for 30 min at RT. Follwing three washing
steps, cells were mounted in Roti®-Mount FluorCare DAPI (Roth).
3
Quantitative Real-time PCR
The RNeasy mini kit (Qiagen) was used for the isolation of total RNA from cell lysates. RNA
extraction was performed according to the manufacturer´s protocol, including an on-column
DNA digestion (RNase free DNase Set; Qiagen). cDNA was generated by reverse
transcription of isolated RNAs using the High Capacity cDNA reverse Transcription Kit
(Applied Biosystems). 0.375- 4 ng cDNA were subsequently used for qRT-PCR reactions
performed on a StepOne Plus real time cycler (Applied Biosystems) with the Power SYBR
Green PCR master mix (Applied Biosystems). Specificity of the primers used for qRT-PCR
reactions was determined beforehand, by agarose gel electrophoresis. qRT-PCRs were run as
follows: 2 min at 50°C, 10 min at 95°C, 40 cycles of 15 sec at 95°C and 1 min at 55-60°C.
Expression levels were calculated applying the 2-∆∆ct method and normalizing to GAPDH and
the biological reference sample. Sequences of primers used in this study are listed in Table
S1.
Whole genome expression analysis and microarray data processing
For whole genome expression analyses, RNA was isolated from cell lysates using the RNeasy
kit with on-column DNA digestion. 300 ng of total RNA was used as input for cRNA
synthesis with the linear amplification protocol (Ambion) comprising the synthesis of T7-
linked double stranded cDNA and in vitro transcription for 12 h incorporating biotin-labeled
nucleotides. Following purification, labeled cRNA samples were hybridized onto HumanHT-
12 v4 expression Beadchips (Illumina) for 18 h following the manufacturer´s protocol. The
beadchips were washed as recommended and subsequently stained with streptavidin-Cy3 (GE
Healthcare) and scanned using the iScan reader (Illumina) and the associated software. All
samples were hybridized as biological replicates.
Data were processed by mapping bead intensities to the corresponding gene information using
BeadStudio 3.2 (Illumina) and background correction was achieved by applying the
4
Affymetrix Robust Multiarray Analysis (RMA) background correction model4. Variance
stabilization was performed using log2 scaling. Gene expression normalization was calculated
using the quantile method implemented in the lumi package of R-Bioconductor. In-house
developed functions in MATLAB were utilized for data post-processing and the generation of
graphical representations. Hierarchical clustering analysis of genes and samples was
performed with the one minus the sample correlation metric and the Unweighted Pair-Group
Method using Average (UPGMA) linkage method as previously described5.
Western blot
For protein analyses, cells were lysed on ice with RIPA-buffer containing protease inhibitors
(Roche) and cell lysates were incubated for 5 min at 95°C. Protein concentrations were
determined using the Pierce BCA Protein Assay Kit (ThermoFisher) and equal amounts of
protein per sample were mixed with 6x Laemmli buffer, incubated for 5 min at 95°C and
applied on 4-12% polyacrylamide (NuPAGE, Invitrogen) gels. Following electrophoretical
separation, proteins were transferred onto a PVDF membrane. Blocking was performed for 1
h at RT using either 5% milk powder or 5% BSA in TBST. Incubation with primary
antibodies (GFAP: Dako, Z0334, rabbit, 1:1000; BIP: Cell Signaling, #3177, rabbit, 1:1000;
p-PERK: Santa Cruz, sc-32577, rabbit, 1:1000; TAU5: Invitrogen, AHB0042, mouse, 1:1000;
ANXA2: Cell Signaling, #8235, rabbit, 1:1000; Ubiquitin: Dako, Z0458, rabbit, 1: 2000;
GAPDH: Sigma, G9545, rabbit, 1:200000; β-ACTIN: Sigma, A5441, mouse, 1:200000) was
carried out overnight at 4°C. After washing the membrane three times with TBST, HRP-
conjugated secondary antibodies were applied for 1 h at RT. After washing the membrane
again three times with TBST, chemiluminescent HRP substrate solution was applied to the
membrane. Proteins were detected using the ChemiDocTM XRS+ System (BioRad) and
expression levels were quantified by densitometric analysis with the Image LabTM software
(BioRad). For detection of TAU and p-PERK, protein samples were precipitated prior to
5

immunoblotting. In short, volumes of protein samples corresponding to 80 µg of protein were
mixed with nine times the sample volume of cold (-20°C) acetone (Roth) and incubated
overnight at -20°C. The next day, samples were centrifuged (20 min/ 21000 rcf/ 4°C), the
supernatant was decanted and pellets were left to dry for approximately 1 h at RT. The dried
pellet was subsequently resuspended in water and 6x Laemmli buffer was added.
Immunoprecipitation
To investigate a potential interaction of TAU and ANXA2, total protein was extracted from
FTD-1 and Ctrl-1 astrocytes using Triton X-lysis buffer (10 mM Tris-HCl, pH 7.6, 150 mM
NaCl, 2 mM MgCl2, 2 mM EDTA, 0.1% Triton X-100, 10% Glycerol, 1 mM PMSF, 1
tablet cOmplete, Mini, protease inhibitor (Roche), 1 tablet PhosSTOP, phophatase inhibitor
(Roche), in 10 ml H2O). Immunoprecipitation was conducted using the Immunoprecipitation
Kit - Dynabeads® Protein G (Invitrogen) according to the manufacturer´s recommendations.
50 µl Dynabeads were incubated with 5 µg TAU-5 antibody in 200 µl Ab Binding & Washing
Buffer for 1 h at 4°C. Dynabeads were subsequently washed once with Ab Binding &
Washing Buffer, before being incubated with 250 µg of protein extract overnight at 4°C.
Unbound protein was subsequently transferred into a clean reaction tube for latter analyses
and Dynabeads were washed three times with Washing Buffer. During a fourth washing step,
Dynabeads were transferred into a clean reaction tube before 15 µl Elution Buffer were
added. Following incubation for 20 min at 4°C, the eluate was removed from the Dynabeads
and subsequently mixed with 4x loading buffer and boiled for 5 min at 95°C. Samples were
immediately loaded onto gels for SDS-PAGE and later-on analyzed by western blot. All
incubation steps involving Dynabeads were performed on a roller.
6
Quantification of the cell and nuclear sizes of astrocytes
The ImageJ software was used to measure the sizes of astrocytes and their nuclei. To this end,
astrocytes were stained for GFAP and nuclei were counterstained with DAPI. Images of
immunofluorescent staining were taken using the Zeiss LSM700 confocal microscope.
Outlines of GFAP+ cells and of their nuclei were manually encircled and sizes of the encircled
areas were determined with the ImageJ software and the scale bar incorporated in the
immunofluorescence images.
Determination of the 4R-TAU isoforms expressed in astrocytes
To determine which 4R-TAU isoforms were expressed in cultured astrocytes, cDNA from
FTD-1 astrocytes was amplified using a forward primer specific for exon 1 of the MAPT gene
(5´CGAAGTGATGGAAGATCACG´3) and a reverse primer specific for exon 10 of the
MAPT gene (5´CACACTTGGACTGGACGTTG´3). The size of the PCR product
corresponding to the 4R/0N isoform, which lacks both, exon 2 and exon 3, was calculated to
be 676 bp, the size of the PCR product corresponding to the 4R/1N isoform, which contains
exon 2 but lacks exon 3, was calculated to be 764 bp and the size of the PCR product
corresponding to the 4R/2N isoform, which contains both, exon 2 and exon 3, was calculated
to be 851 bp.
Rotenone stress assay
To examine the effect of rotenone (Sigma) on the viability of FTD and Ctrl astrocytes,
astrocytes were plated at a density of 8 x 10³ cells per well into 96-well plates. After 12 days
in maturation medium, 0.5 μM and 1 μM rotenone in N2 medium consisting of DMEM-F12
with 1:100 N2 supplement and 1% penicillin/streptomycin/glutamine were added to the cells
for 48 h. Viability was assessed by measuring LDH leakage in the cell culture supernatant
using the Cytotoxicity Detection Kit Plus (Roche). Absorbance was recorded at 490 nm and
7
was expressed as the percentage of absorbance in Ctrl cells after subtraction of background
absorbance. In addition, astrocytes were plated in matrigel-coated 48-well plates and exposed
to 1 μM rotenone in N2 medium for 24 h. Subsequently, cells were fixed and stained for
cleaved CASPASE-3 and the number of cleaved CASPASE-3 positive astrocytes was
determined using Image J and the cell counter plugin.
Neuronal differentiation
NPCs were differentiated into neurons by incubation with N2B27 medium supplemented with
1 µM SAG (Cayman Chemical), 2 ng/ml BDNF (Peprotech), 2 ng/ml GDNF (Peprotech) and
100 µM AA for 6 days and afterwards with N2B27 medium supplemented with 2 ng/ml
BDNF, 2 ng/ml GDNF, 0.5 ng/ml TGF-β3 (Peprotech), 100 µM dbcAMP (Sigma) and 100
µM AA. Additionally, 5 ng/ml Activin A (Peprotech) were added to the medium at days 7
through 9. After 9 days of neuronal differentiation, cells were detached, singularized by
treatment with accutase and replated at densities of 2.2 x 10⁵ neurons in 12-well plates and 1.5
x 105 neurons in 24-well plates containing glass coverslips. After 25 days of differentiation,
cells were fixed in 4% PFA for immunocytochemical analyses or lysed in RLT buffer
(Qiagen) for RNA preparation.
Neuron and astrocyte co-cultures and FACS
Co-culture experiments were conducted to assess a potential impact of N279K MAPT
astrocytes on neurons. Ctrl-1 NPCs were labeled with GFP by lentiviral transduction with the
LVTHM vector6 as previously described3. Labeled Ctrl-1 NPCs were subsequently
differentiated into neurons applying the protocol described above. After 10 days of neuronal
differentiation, cells were detached and singularized by treatment with acctuase. Neurons
were added to FTD-1 , FTD-2 or Ctrl-2 astrocyte cultures at densities of 3.5 x 10⁶ neurons in a
10 cm dish and 1 x 10⁵ neurons per well in 24-well plates containing glass coverslips.
8
Astrocytes had been plated 3 days before at day 31 of astrocyte differentiation at densities of
5 x 10⁵ cells in matrigel-coated 10 cm dishes and 1.5 x 10⁴ cells per well in matrigel-coated
24-well plates. Neurons were co-cultured with astrocytes in neuronal differentiation medium
for 21 days. After that, cells were either fixed in 4% PFA or cells were detached and
singularized by treatment with trypsin. Following washing with PBS, singularized cells were
filtered through a 70 µm nylon mesh and sorted for GFP+ cells using a FACSAria cell sorter
(BD Biosciences) to separate neurons from astrocytes. GFP+ neurons were collected in
neuronal differentiation medium, before being pelletized and lysed in RLT-buffer. For whole
genome expression analysis, total RNA was extracted using the RNeasy micro kit (Qiagen)
and biotinylated cRNAs were generated using the TargetAmp 2-Round Biotin-aRNA
Amplification Kit 3.0 (Epicenter). For qRT-PCR analysis, cRNA was reverse transcribed into
cDNA using the High Capacity cDNA reverse Transcription Kit (Applied Biosystems) and 12
h of reverse transcription. cDNA was then used for qRT-PCR analysis.
Quantification of neurons, neurite density, synaptogenesis and vulnerability to rotenone-
induced stress
To assess the influence of astrocytes on the vulnerability of neurons to rotenone-induced
stress, co-cultured cells were incubated with neuronal differentiation medium lacking
supplements but containing 400 nM rotenone (Sigma) for 48 h. Cells were subsequently fixed
and stained for βIII-Tubulin and cleaved CASPASE-3. The number of neurons per visual field
and the number of cleaved CASPASE-3-positive neurons was determined using Image J and
the cell counter plugin. Additionally, the effect of astrocyte-conditioned medium on the
vulnerability of neurons to rotenone-induced stress was determined. Astrocyte-conditioned
medium was harvested from FTD-2 and Ctrl-2 astrocytes cultures after 2 days of
conditioning. Neurons at day 12 of differentiation were cultured with either FTD-2 or Ctrl-2
conditioned media for 14 days during which the medium was refreshed every other day and
9
neurons were subsequently stressed with 400 nM rotenone. Neurons were stained for βIII-
Tubulin and cleaved CASPASE-3 and images were analyzed using Image J and the cell
counter plugin.
Neurite density of neurons after co-culture with astrocytes was determined by staining of
fixed cultures with an anti-GFP antibody. Images were taken with a Zeiss LSM700 confocal
microscope and image analysis was performed using the ImageJ software and the color pixel
plugin. The percentage of GFP positive signals over all signals was determined for 10 images
per co-culture setup and per biological replicate. For quantification of synaptophysin
expression in neurons after co-culture with astrocytes, fixed neurons were co-stained with
anti-GFP and anti-Synaptophysin antibodies and Z-stack images were taken using a Zeiss
LSM700 confocal microscope. Using the colocalization software from ZEN (Carl Zeiss
Microimaging, LLC.), colocalization coefficients were determined to quantify the percentage
of GFP-positive signals that were also positive for synaptophysin. A minimum of 3 single
plane confocal images of a Z-stack were analyzed and the mean of the colocalization
coefficients was calculated. 15 Z-stacks were analyzed per co-culture setup and per biological
replicate.
10
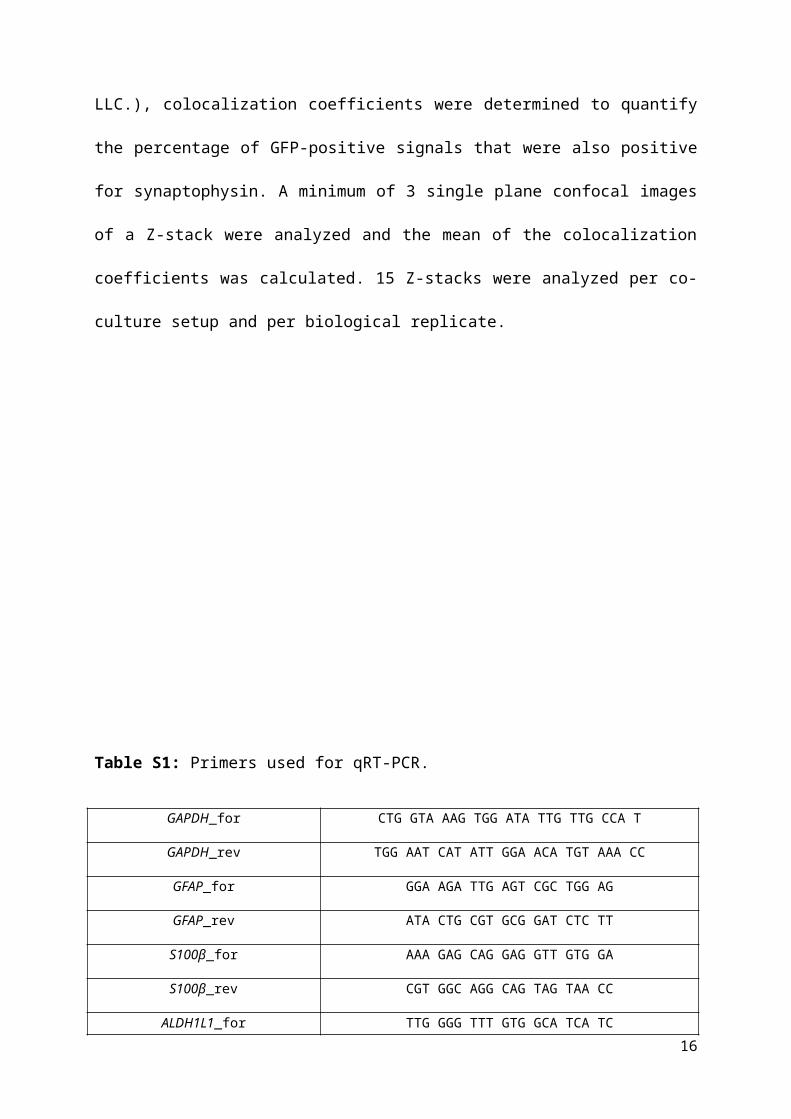
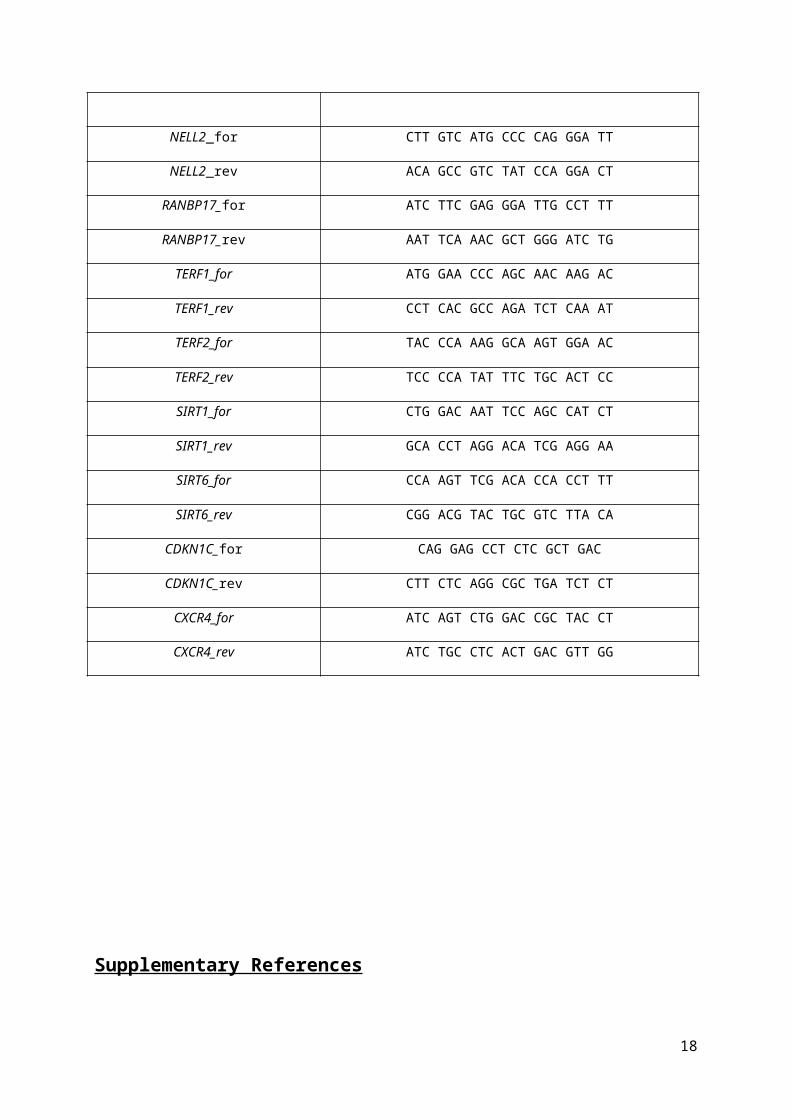
Table S1: Primers used for qRT-PCR.
GAPDH_for CTG GTA AAG TGG ATA TTG TTG CCA T
GAPDH_rev TGG AAT CAT ATT GGA ACA TGT AAA CC
GFAP_for GGA AGA TTG AGT CGC TGG AG
GFAP_rev ATA CTG CGT GCG GAT CTC TT
S100β_for AAA GAG CAG GAG GTT GTG GA
S100β_rev CGT GGC AGG CAG TAG TAA CC
ALDH1L1_for TTG GGG TTT GTG GCA TCA TC
ALDH1L1_rev AGC TCT GCA AAC TTC AAG GC
SLC1A2_for CAT GGA TGG TAC AGC CCT TT
SLC1A2_rev AGC AGG CTG ATG TCC TCT GT
SLC1A3_for CTC ACA GTC ACC GCT GTC AT
SLC1A3_rev CCA TCT TCC CTG ATG CCT TA
MAPT_total_for CTC GCA TGG TCA GTA AAA GCA A
MAPT_total_rev GGG TTT TTG CTG GAA TCC TGG T
MAPT_Exon10_for CCA AGT GTG GCT CAA AGG AT
MAPT_Exon12_rev CCC AAT CTT CGA CTG GAC TC
ANXA2_for GGA CGC GAG ATA AGG TCC TG
ANXA2_rev GCT TTC TGG TAG TCG CCC TT
GAS7_for ATC AAG AAG GCG CGG AGA AA
GAS7_rev GCT GCC GGA TCA TCT CTA CC
NPY_for CGG AGG ACA TGG CCA GAT AC
NPY_rev TCA AGC CGA GTT CTG GGA AC
TCEAL7_for GAA CGC CAG CAA ACA GAA GG
TCEAL7_rev GGT CCC GAG AAT GCC TAT GG
MMP14_for GGT GCC CTA TGC CTA CAT CC
MMP14_rev CAC AGC CAC CAG GAA GAT GT
CXCL12_for GAA AGC CAT GTT GCC AGA GC
11
CXCL12_rev TCG GGT CAA TGC ACA CTT GT
DYSF_for TTT GCG GGG AAA ATG CTG TG
DYSF_rev ATG GAG GGA AAC ATG GCA GG
EN1_for GCA ACC CGG CTA TCC TAC TT
EN1_rev CGC TTG TCC TCC TTC TCG TT
MAOB_for CTC CCC TTG CAG AAG AGT GG
MAOB_rev CCA CAG GAA CCA GAG AGC AG
NELL2_for CTT GTC ATG CCC CAG GGA TT
NELL2_rev ACA GCC GTC TAT CCA GGA CT
RANBP17_for ATC TTC GAG GGA TTG CCT TT
RANBP17_rev AAT TCA AAC GCT GGG ATC TG
TERF1_for ATG GAA CCC AGC AAC AAG AC
TERF1_rev CCT CAC GCC AGA TCT CAA AT
TERF2_for TAC CCA AAG GCA AGT GGA AC
TERF2_rev TCC CCA TAT TTC TGC ACT CC
SIRT1_for CTG GAC AAT TCC AGC CAT CT
SIRT1_rev GCA CCT AGG ACA TCG AGG AA
SIRT6_for CCA AGT TCG ACA CCA CCT TT
SIRT6_rev CGG ACG TAC TGC GTC TTA CA
CDKN1C_for CAG GAG CCT CTC GCT GAC
CDKN1C_rev CTT CTC AGG CGC TGA TCT CT
CXCR4_for ATC AGT CTG GAC CGC TAC CT
CXCR4_rev ATC TGC CTC ACT GAC GTT GG
12
Supplementary References
1 Ehrlich, M. et al. Distinct Neurodegenerative Changes in an Induced Pluripotent Stem
Cell Model of Frontotemporal Dementia Linked to Mutant TAU Protein. Stem Cell
Reports 5, 83-96 (2015).2 Reinhardt, P. et al. Derivation and expansion using only small molecules of human
neural progenitors for neurodegenerative disease modeling. PLoS One 8, e59252
(2013).3 Hargus, G. et al. Origin-dependent neural cell identities in differentiated human iPSCs
in vitro and after transplantation into the mouse brain. Cell Rep 8, 1697-1703 (2014).4 Irizarry, R. A. et al. Summaries of Affymetrix GeneChip probe level data. Nucleic
Acids Res 31, e15 (2003).5 Kim, J. B. et al. Direct reprogramming of human neural stem cells by OCT4. Nature
461, 649-653 (2009).6 Wiznerowicz, M. & Trono, D., Conditional suppression of cellular genes: lentivirus
vector-mediated drug-inducible RNA interference. J Virol 77, 8957-8961 (2003).
13
Supplementary Figures
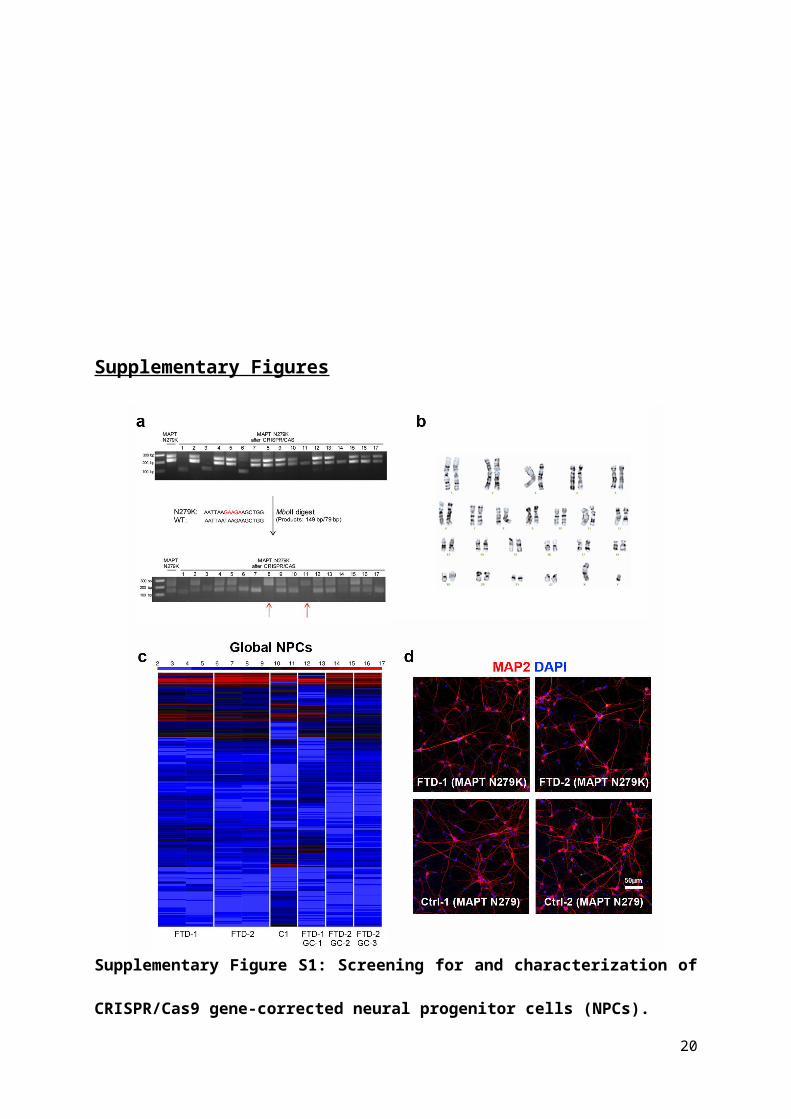
Supplementary Figure S1: Screening for and characterization of CRISPR/Cas9 gene-
corrected neural progenitor cells (NPCs).
(a) Genomic DNA was isolated from puromycin-resistant CRISPR/Cas9/ssODN transfected
FTD N279K MAPT NPCs. A 228 bp fragment spanning the mutation-containing region in
exon 10 of MAPT was amplified via PCR and was digested with MboII. MboII does not cut
the rescued wildtype N279 MAPT sequence in indicated clones (red arrows). (b) G-banded
karyotype analysis of isogenic Ctrl NPCs (FTD-1 GC-1). (c) Heat map of transcriptome
profiles in FTD and Ctrl NPCs. (d) Immunostaining of FTD and Ctrl neurons for MAP2 (red).
Nuclei were counterstained with DAPI (blue). Scale bar = 50 µm. 14
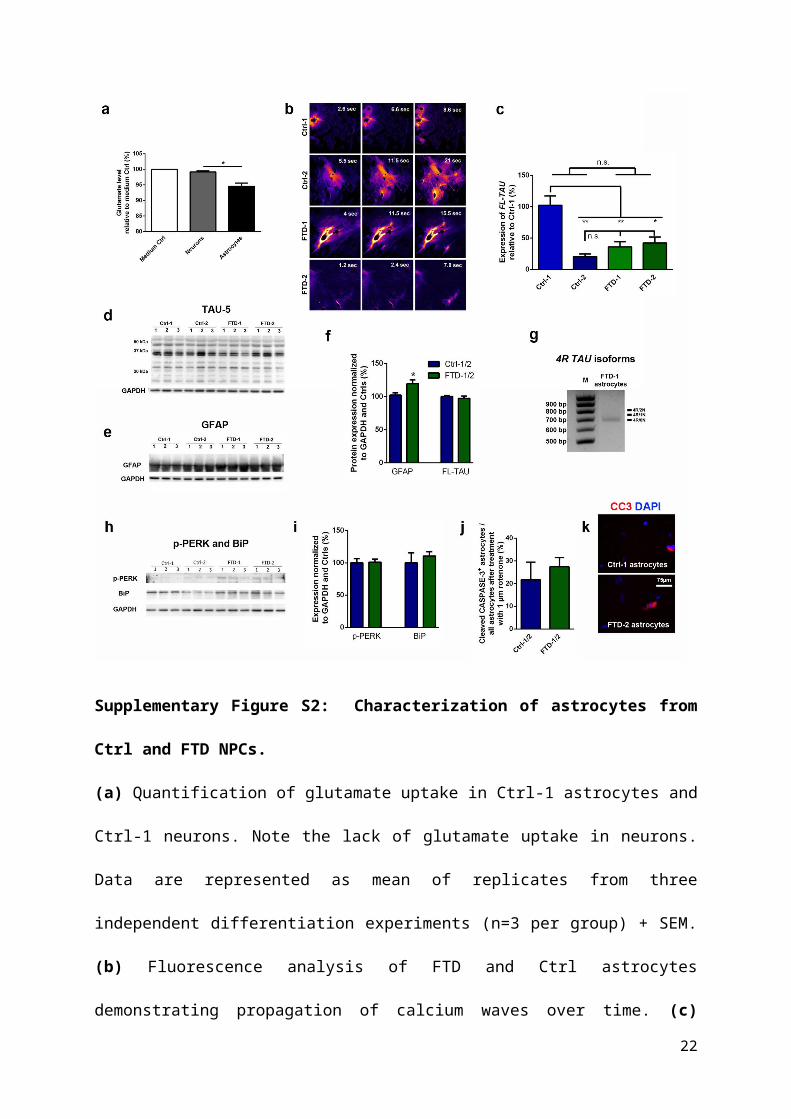
Supplementary Figure S2: Characterization of astrocytes from Ctrl and FTD NPCs.
(a) Quantification of glutamate uptake in Ctrl-1 astrocytes and Ctrl-1 neurons. Note the lack
of glutamate uptake in neurons. Data are represented as mean of replicates from three
independent differentiation experiments (n=3 per group) + SEM. (b) Fluorescence analysis of
FTD and Ctrl astrocytes demonstrating propagation of calcium waves over time. (c)
Quantification of full-length TAU (FL-TAU) expression in Ctrl-1, Ctrl-2, FTD-1 and FTD-2
astrocytes via qRT-PCR. Note increased expression in the non-isogenic Ctrl line (Ctrl-1) but
no significant difference between lines Ctrl-2, FTD-1 and FTD-2. Data are represented as
mean of replicates from three independent differentiation experiments (n=3 per line) + SEM.
15
One-way ANOVA with post hoc Bonferroni test was performed for statistical analysis
(*p<0.05, **p<0.01). (d-e) Western blot expression analysis of (d) TAU (clone TAU-5) and (e)
GFAP protein in FTD and Ctrl astrocytes. GAPDH was used as loading control. Independent
replicates are shown for each line. (f) Quantification of TAU and GFAP protein expression in
FTD and Ctrl astrocytes. (g) qRT-PCR expression analysis of 4R-TAU isoforms using primers
binding in exon 1 and exon 10 of MAPT. NPC-derived astrocytes express the shortest 4R-
TAU isoform (4R/0N, 676 bp), while other 4R-TAU isoforms (4R/1N, 764 bp; 4R/2N, 851 bp)
are undetected. (h) Western blot expression analysis of p-PERK and BiP protein in FTD and
Ctrl astrocytes. GAPDH was used as loading control. Independent replicates are shown for
each line. (i) Quantification of p-PERK and BiP protein expression in FTD and Ctrl
astrocytes. (j) Quantification of cleaved CASPASE-3-positive astrocytes 48 h after
application of 1 µm rotenone. (k) Immunostainings of FTD and Ctrl astrocytes for cleaved
CASPASE-3 (CC3, red). Nuclei were counterstained with DAPI (blue). Scale bar = 75 µm.
Data in panels f, i and j are represented as mean of replicates from three independent
experiments per line + SEM (n=3 per line; n=6 per group). Student’s t-test was performed for
statistical analysis (*p<0.05).
16

Supplementary Figure S3: Transcriptome profiles in FTD and Ctrl astrocytes,
expression analysis in Ctrl and FTD neurons and expression of aging-associated genes in
FTD and Ctrl astrocytes.
(a) Heat map of whole genome expression profiles in FTD and Ctrl astrocytes. (b) qRT-PCR
expression analyses in FTD and Ctrl neurons of genes differentially expressed in FTD and
Ctrl astrocytes. (c-d) qRT-PCR expression analysis of aging-associated genes in (c) FTD and
Ctrl astrocytes and in (d) FTD and Ctrl neurons. Data in panels b-d are represented as mean of
replicates from three independent differentiation experiments (n=3 per line; n=6 per group) +
SEM. Student’s t-test was performed for statistical analysis (*p<0.05; **p<0.01). (e)
Hierarchical cluster analysis of 255 genes, which are upregulated in the aging brain. Note that
the FTD astrocytes form one cluster and separate from Ctrl-1 and Ctrl-2 astrocytes.
17
Supplementary Figure S4: Co-culture of control neurons with FTD astrocytes results in
changes in gene expression profiles in previously healthy neurons.
(a) Quantification of the coverage of CtrlGFP neurons with synaptophysin-positive punctae. (b)
Immunostainings of CtrlGFP neurons cultured on either FTD or Ctrl astrocytes for
synaptophysin (Syn; red). Nuclei were counterstained with DAPI (blue). Scale bar = 20 µm.
(c) Quantification of the percentage of cleaved CASPASE-3-positive neurons after co-culture
with either FTD or Ctrl astrocytes and rotenone treatment. (d) Immunostainings of Ctrl
neurons cultured on either FTD or Ctrl astrocytes for cleaved CASPASE-3 (CC3; red) and
βIII-Tubulin (TUJ1; green). Nuclei were counterstained with DAPI (blue). Scale bar = 50 µm.
18
(e) Heat map demonstrating the expression of regional genes along the rostro-caudal axis in
FTD and Ctrl NPCs, FTD and Ctrl astrocytes and in Ctrl neurons co-cultured with either FTD
or Ctrl astrocytes. (f) Quantification of Ctrl neurons cultured in conditioned medium from
either FTD-2 or Ctrl-2 astrocytes and after rotenone treatment. (g) Immunostaining of Ctrl
neurons cultured in conditioned medium from either FTD-2 or Ctrl-2 astrocytes and after
rotenone treatment for TUJ1 (green). Nuclei were counterstained with DAPI (blue). Scale bar
= 50 µm. (h) Quantification of the percentage of cleaved CASPASE-3-positive Ctrl neurons
cultured in conditioned medium form either FTD-2 or Ctrl-2 astrocytes and after rotenone
treatment. (i) Heat map showing the expression of genes differentially regulated in FTD
astrocytes in FACS-isolated CtrlGFP neurons after co-culture with either FTD or Ctrl
astrocytes. (j) Hierarchical cluster dendrogram of global expression profiles from CtrlGFP
neurons co-cultured with either FTD or Ctrl astrocytes. (k-l) Functional annotation of (k)
downregulated and (l) upregulated genes in CtrlGFP neurons co-cultured with FTD astrocytes
with p-values. (m) qRT-PCR expression analysis of CXCR4 in FACS-isolated CtrlGFP neurons
after co-culture with either FTD or Ctrl astrocytes. Data in panels a, c, f, h and m are
represented as mean of replicates from three independent co-culture experiments (n=3 per
line) + SEM. Student’s t-test was performed for statistical analysis (*p<0.05).
19
Supplementary Figure S5: Full-size western blots showing expression of ubiquitin,
ANXA2, beta-ACTIN and GAPDH in FTD and Ctrl astrocytes.
(a) Uncropped western blot showing expression of ubiquitin in human NPC-derived FTD and
Ctrl astrocytes. (b) Uncropped western blot showing expression of GAPDH in human NPC-
derived FTD and Ctrl astrocytes. Images in (a) and (b) correspond to images in panel k of
Fig. 2. (c) Uncropped western blot showing expression of ANXA2 in FTD and Ctrl
astrocytes. (d) Uncropped western blot showing expression of β-ACTIN (ACTIN) in FTD
and Ctrl astrocytes. Images in (c) and (d) correspond to images in panel c of Fig. 3. (e)
Uncropped western blot showing ANXA2 protein in Ctrl-1 and FTD-1 astrocytes after co-
immunoprecipitation using TAU-5 antibody for extraction from protein lysates. TAU-5
immunoprecipitates were analyzed by western blot and probed by ANXA2 antibody. (f)
Uncropped western blot showing ANXA2 expression in input fractions from Ctrl-1 and FTD-
1 astrocytes. (g) Uncropped western blot showing GAPDH expression in input fractions from
Ctrl-1 and FTD-1 astrocytes. Images in (e), (f) and (g) correspond to images in panel e of Fig.
3.
20

Supplementary Figure S6: Presentation of bar diagrams depicting non-pooled data of
FTD and Ctrl lines
(a-b) qRT- PCR expression analysis of astrocyte marker genes in FTD and Ctrl astrocytes (a)
and of 4R-TAU isoforms in FTD and Ctrl astrocytes and neurons (b). (c-e) Quantification of
the cell size (c), nuclear size (d) and nucleus / cytoplasm ratio (e) of FTD and Ctrl astrocytes.
(f) Quantification of ubiquitin protein expression in FTD and Ctrl astrocytes. (g) Effect of
oxidative stress on FTD and Ctrl astrocyte viability as analyzed by measurement of LDH 21
release after 48 h of rotenone treatment. Data are represented as mean of four replicates per
line (n=4 per line) + SEM. (h) qRT-PCR expression analysis of differentially expressed genes
in FTD and Ctrl astrocytes. (i) Quantification of ANXA2 protein expression in FTD and Ctrl
astrocytes. Data in panels a-f and h-i are represented as mean of replicates from three
independent differentiation experiments per line (n=3 per line) + SEM. (j-k) Quantification of
the number of CtrlGFP neurons (j) and their neurite density (k) after co-culture with either FTD
or Ctrl astrocytes. (l) Effect of oxidative stress on CtrlGFP neurons after co-culture with either
FTD or Ctrl astrocytes as analyzed by the number of surviving neurons after 48 h of rotenone
treatment. (m) qRT-PCR expression analysis of ANXA2 in FACS-isolated CtrlGFP neurons
after co-culture with either FTD or Ctrl astrocytes. Data in panels j-m are represented as mean
of three replicates per line from three independent co-culture experiments (n=3 per line).
22