acquisition of wood mackenzie · 3 transaction summary acquisition highlights • verisk analytics...
TRANSCRIPT

March 10, 2015
Acquisition of Wood Mackenzie
Forward Looking Statements, Safe Harbor & Non-GAAP Financial MeasuresForward-Looking StatementsThis presentation contains forward-looking statements. These statements relate to future events or to future financial performance and involve known and unknown risks, uncertainties, and other factors that may cause our actual results, levels of activity, performance, or achievements to be materially different from any future results, levels of activity, performance, or achievements expressed or implied by these forward-looking statements. In some cases, you can identify forward-looking statements by the use of words such as “may,” “could,” “expect,” “intend,” “plan,” “target”, “seek,” “anticipate,” “believe,” “estimate,” “predict,” “potential,” or “continue” or the negative of these terms or other comparable terminology. You should not place undue reliance on forward-looking statements because they involve known and unknown risks, uncertainties and other factors that are, in some cases, beyond our control and that could materially affect actual results, levels of activity, performance, or achievements. Other factors that could materially affect actual results, levels of activity, performance, or achievements can be found in Verisk’s quarterly reports on Form 10-Q, annual reports on Form 10-K, and current reports on Form 8-K filed with the Securities and Exchange Commission. If any of these risks or uncertainties materialize, or if our underlying assumptions prove to be incorrect, actual results may vary significantly from what we projected. Any forward-looking statement in this presentation reflects our current views with respect to future events and is subject to these and other risks, uncertainties, and assumptions relating to our operations, results of operations, growth strategy, and liquidity. We assume no obligation to publicly update or revise these forward-looking statements for any reason, whether as a result of new information, future events, or otherwise.
Notes Regarding the Use of Non-GAAP Financial Measures The company has provided certain non-GAAP financial information as supplemental information regarding its operating results. These measures are not in accordance with, or an alternative for, GAAP and may be different from non-GAAP measures reported by other companies. The company believes that its presentation of non-GAAP measures, such as EBITDA, EBITDA margin and Adjusted EBITDA, adjusted net income, and adjusted EPS, provides useful information to management and investors regarding certain financial and business trends relating to its financial condition and results of operations. In addition, the company’s management uses these measures for reviewing the financial results of the company and for budgeting and planning purposes.
2

3
Transaction Summary
Acquisition Highlights
• Verisk Analytics to acquire Wood Mackenzie (“WoodMac”) for £1.85B (~$2.8B)
• WoodMac is a leading provider of data analytics to the global energy, chemicals, metals and mining markets with a strong track record of growth and innovation
‒ FY 2014 Revenues, EBITDA and unlevered FCF(1) of £227 million, £107 million and £70 million, respectively
Financing for the Transaction
Combined Financial Profile
• Funded with ~$2 billion of debt and equity issuance of up to $800 million
• Investment grade debt ratings expected to be affirmed
• Committed bridge financing of $2.9 billion received with permanent financing expected to occur via public offerings before close in second quarter 2015
• PF Verisk 2014 revenue, EBITDA and unlevered FCF(1) of $2.1B, $979 million and $520 million, respectively, with EBITDA margin of 46%
• Financial attributes consistent with Verisk’s long-term growth and margin and accretive to cash flow conversion
• Assuming a full year of 2015 WoodMac results, the transaction is expected to be $0.16 to $0.20 accretive to 2015 adjusted EPS(2)
Other Transaction Elements
• Expected to close in second quarter of 2015, subject to regulatory and other customary closing conditions
• WoodMac CEO Stephen Halliday will continue to lead WoodMac; reported as part of Specialized category of our Decision Analytics segment
(1) Unlevered Free Cash Flow calculated as net operating profit (EBIT less taxes based on tax rate of 22%) plus depreciation and amortization less capital expenditures; WoodMac includes capitalized software development costs.
(2) Verisk Adjusted EPS is defined as net income plus after tax intangibles amortization; excludes transaction costs
Note: 2014 WoodMac financials converted based on monthly financials and converted to USD based on the average monthly FX rate; 2014 average implied FX of 1.645 based on WoodMac USD revenue divided by WoodMac GBP revenue.

4
Premier Data and Analytics Asset
• Uncommon business and a leading data analytics provider to the global energy, chemicals, metals and mining verticals
• Internationally recognized and trusted brand known for its quality, integrity, accuracy and accessibility
• Highly attractive financial characteristics: subscription based model with high margins and free cash flow generation
• Outstanding track record of growth for over 20 years
Verisk-Like Business
• Proprietary data set and analytical differentiation with continuous investment in new solutions
• Mission critical data set is very sticky throughout cycles
• Business model is “build once, sell many times” and recurring & durable with high renewals and significant cross-sell and upsell to customer base
Accelerates Global Footprint
• Instantly positions Verisk in a variety of international markets
• Strong local presence provides detailed regional knowledge for expansion of existing Verisk businesses
Strong Fit with Vertical Market Strategy
• Significant “white space” in WoodMac’s core markets of energy, chemicals, metals, and mining
• Opportunity to monetize connections/synergies between the energy vertical and climate science with emerging supply chain opportunities
• Ability to repurpose Verisk risk analytics including climate risk, country and political risk and environmental health and safety to WoodMac’s customers
Strategic Rationale for WoodMac
Financially Attractive Transaction
• Revenue growth and EBITDA margin profile like Verisk (15% 2010-2014 CAGR(1) and 47% margin in 2014)
• Accretive to cash flow conversion due to WoodMac’s lower international tax rate
• Immediately accretive to Verisk Adjusted EPS
(1) CAGR calculated based on GBP financials; no currency impact.

5
WoodMac is a Verisk-Like BusinessWood
MackenzieVerisk Distinctives
Company Specific Attributes
Strong Margins and Free Cash Flow ��
Deep Domain Expertise � �
Unique Data Assets � �
Subscription Revenue Model and Embedded Solutions � �
First-Mover Advantage � �
Track Record of Growth & Innovation � �
Embedded in Customer Workflows � �

WoodMac Overview
• WoodMac is a leading data analytics provider in Energy, Chemicals, Metals and Mining
• Provides data analytics and services to support strategic decisions for Oil & Gas (O&G) operators and financial institutions
− Deep domain expertise, proprietary data built over 40 years
− Long-standing and embedded customer relationships with 800+ global customers
− Highly regarded by customers; satisfaction with core products is high
• Verisk-like attractive financial attributes:
− Subscription based revenues, long-term contracts with high renewal rates, track-record of growth, high margins and free cash flow conversion
• HQ: Edinburgh, UK – additional primary offices in London, Singapore, and Houston
6
80%+ subscription-based revenues
~45% customers on multi-year contracts
98% subscription renewal in 2014
2014 Revenue: £227 million
2014 EBITDA: £107 million
2014 Unlevered FCF (1): £70 million
Tax Rate: 22%
18%
82%
Services
Data Analytics
Revenue by Segment:
(1) Unlevered Free Cash Flow calculated as net operating profit (EBIT less taxes based on tax rate of 22%) plus depreciation and amortization less capital expenditures; includes capitalized software development costs.
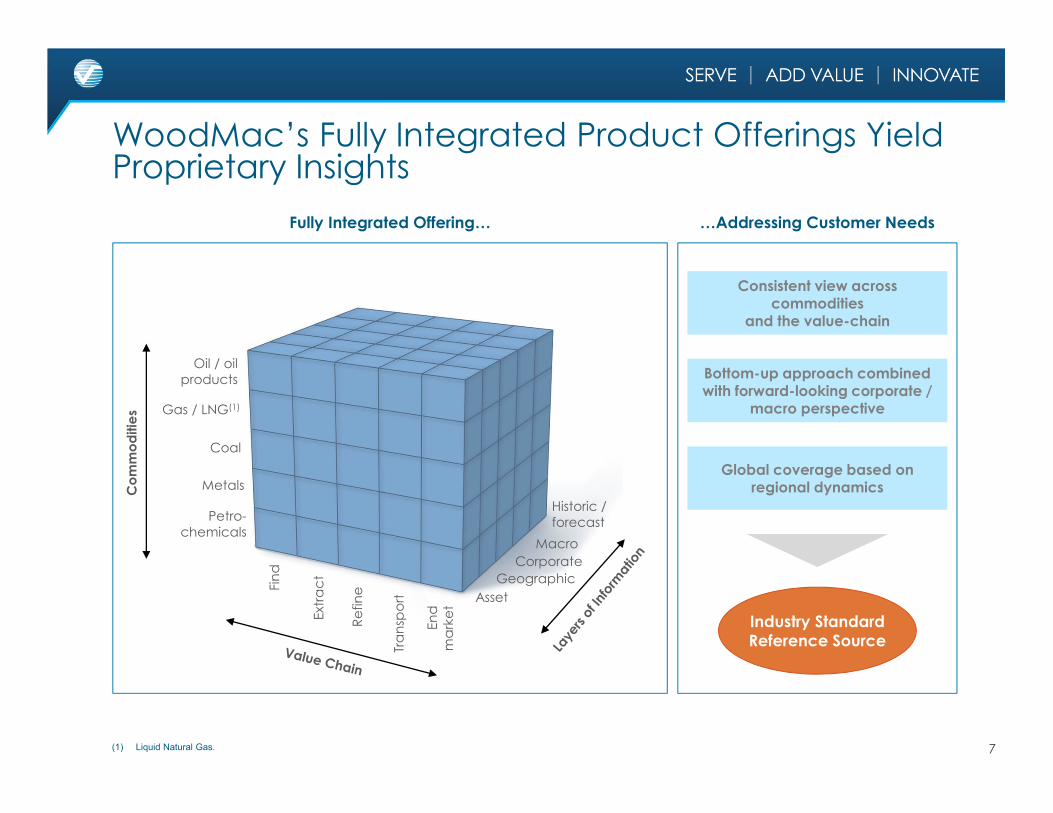
Commodities
Oil / oil products
Gas / LNG(1)
Coal
Metals
Petro-chemicals
Fin
d
Ext
rac
t
Re
fin
e
Tra
nsp
ort
En
d
ma
rke
t
Macro
Corporate
Geographic
Asset
Historic / forecast
Consistent view across commodities
and the value-chain
Global coverage based onregional dynamics
Industry Standard Reference Source
Bottom-up approach combined with forward-looking corporate /
macro perspective
7
WoodMac’s Fully Integrated Product Offerings Yield Proprietary Insights
Fully Integrated Offering… …Addressing Customer Needs
(1) Liquid Natural Gas.
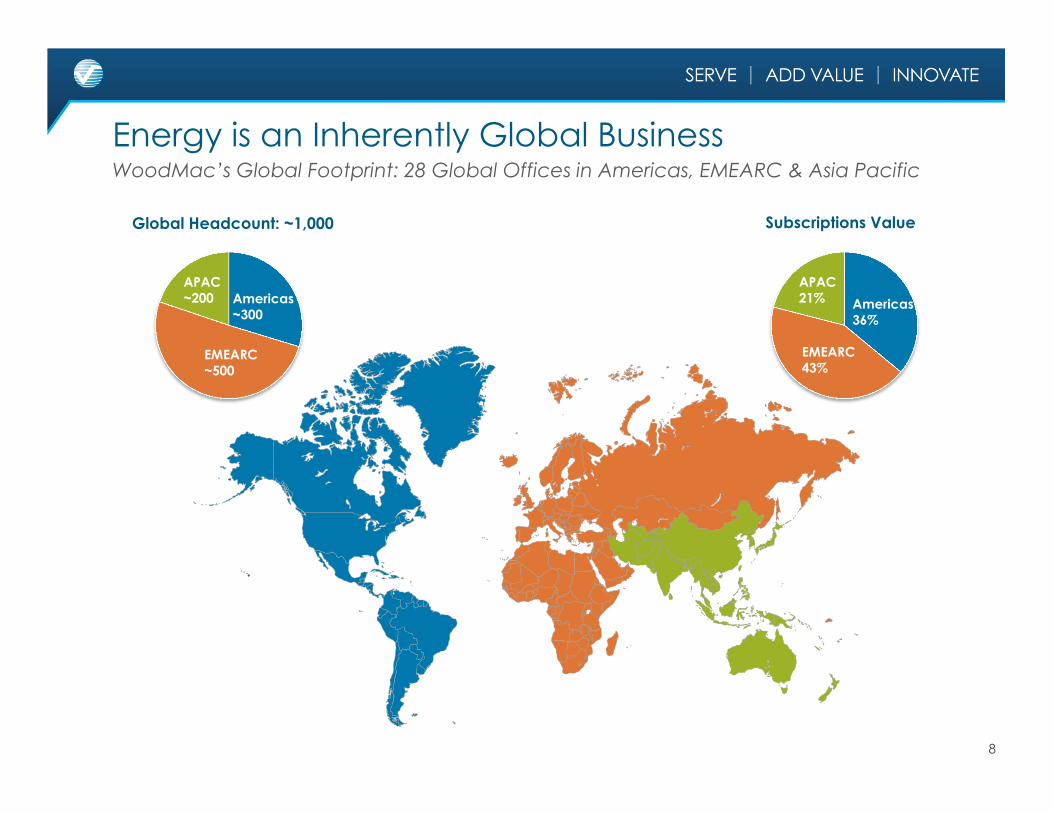
Energy is an Inherently Global Business
8
WoodMac’s Global Footprint: 28 Global Offices in Americas, EMEARC & Asia Pacific
Global Headcount: ~1,000
Americas~300
APAC~200
EMEARC~500
Subscriptions Value
Americas36%
APAC21%
EMEARC43%
O&G Operators
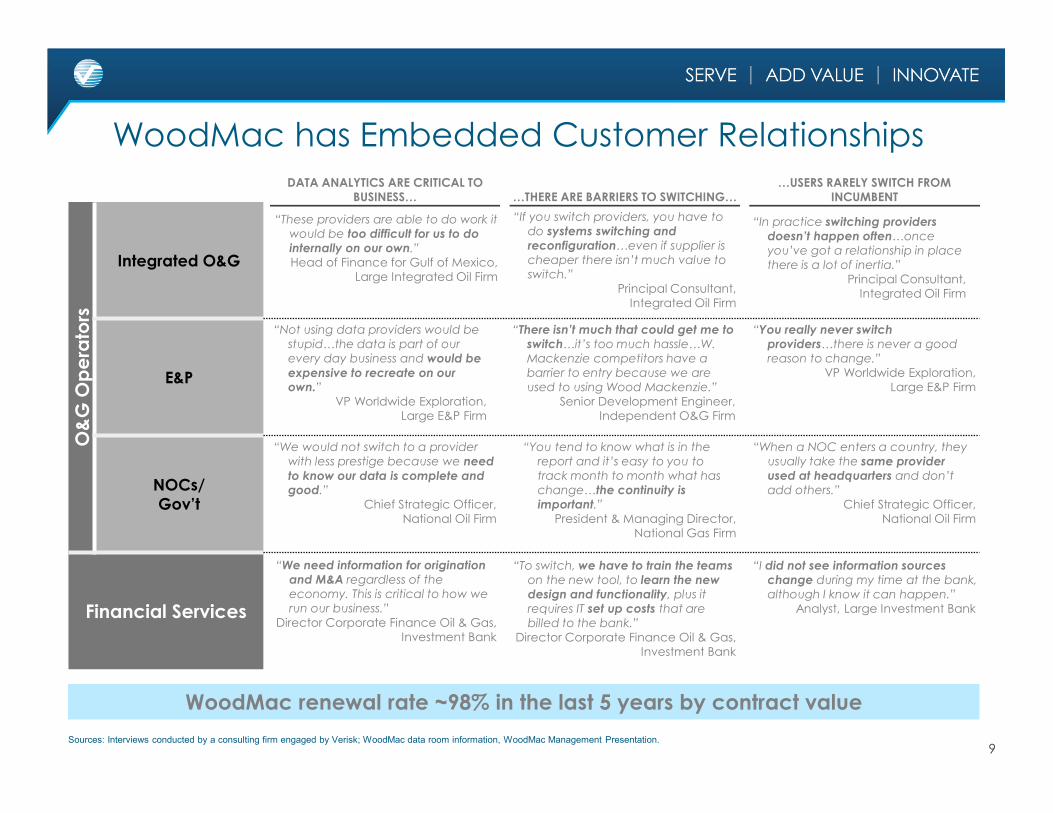
Integrated O&G
E&P
NOCs/Gov’t
Financial Services
DATA ANALYTICS ARE CRITICAL TO BUSINESS… …THERE ARE BARRIERS TO SWITCHING…
…USERS RARELY SWITCH FROM INCUMBENT
“In practice switching providers
doesn’t happen often…once
you’ve got a relationship in place
there is a lot of inertia.”
Principal Consultant, Integrated Oil Firm
“Not using data providers would be
stupid…the data is part of our
every day business and would be
expensive to recreate on our own.”
VP Worldwide Exploration, Large E&P Firm
“You tend to know what is in the
report and it’s easy to you to
track month to month what has
change…the continuity is
important.”
President & Managing Director, National Gas Firm
“You really never switch
providers…there is never a good
reason to change.”
VP Worldwide Exploration, Large E&P Firm
“If you switch providers, you have to
do systems switching and
reconfiguration…even if supplier is
cheaper there isn’t much value to
switch.”
Principal Consultant, Integrated Oil Firm
“To switch, we have to train the teams
on the new tool, to learn the new
design and functionality, plus it
requires IT set up costs that are
billed to the bank.”
Director Corporate Finance Oil & Gas, Investment Bank
“There isn’t much that could get me to
switch…it’s too much hassle…W.
Mackenzie competitors have a
barrier to entry because we are
used to using Wood Mackenzie.”
Senior Development Engineer, Independent O&G Firm
“We would not switch to a provider
with less prestige because we need
to know our data is complete and good.”
Chief Strategic Officer, National Oil Firm
“When a NOC enters a country, they
usually take the same provider
used at headquarters and don’t
add others.”
Chief Strategic Officer, National Oil Firm
“I did not see information sources
change during my time at the bank,
although I know it can happen.”
Analyst, Large Investment Bank
“We need information for origination
and M&A regardless of the
economy. This is critical to how we
run our business.”
Director Corporate Finance Oil & Gas, Investment Bank
“These providers are able to do work it
would be too difficult for us to do
internally on our own.”
Head of Finance for Gulf of Mexico, Large Integrated Oil Firm
9Sources: Interviews conducted by a consulting firm engaged by Verisk; WoodMac data room information, WoodMac Management Presentation.
WoodMac has Embedded Customer Relationships
WoodMac renewal rate ~98% in the last 5 years by contract value

Existing Verisk End MarketsInherently Global
Opportunity for Data Advantage
Customer Concentration
Underlying End Market Growth
P&C Primary (U.S.) Low single digits
Healthcare (U.S.) High single digits
Consumer Banking Mid single digits
New Vertical
EnergyLow to mid single
digits
Energy is an Attractive Market that Fits with Verisk
10
Adds a global dimension to Verisk in a growing vertical where proprietary data assets create value and customer concentration is modest
Ability to Grow Ahead of Underlying End Market Growth

Sources: WoodMac; Industry research.
11
(50%)
(30%)
(10%)
10%
30%
50%
£0
£50
£100
£150
£200
£250
Y-o-Y Change in Global O&G Capex(1)
WoodMac Revenue (£ million)
Strong Historical Secular Demand Future Demand Supported by Key Drivers
KEY DRIVER LONG TERM (5+ YEARS)
CAPEX growthCapital intensive industry requires continuous reinvestment
Production shift towards unconventional resources
Likely to remain a growing portion of global supply
Production shift towards new geographies
Search for new resources likely to continue in remote geographies
Return of industry cost inflation
Greater demand for supply chain analytics
Asset-based M&A activity
Stable asset M&A; potential consolidation in the Exploration and Production segment
Continued internationalizationof National Oil Companies
Gradual convergence between data and analytics requirements of NOCs and IOCs
WoodMac Has Seen Steady Growth through Cycles
(1) Based on nominal USD

12
Transaction is Financially Attractive
Powerful Combination
• Enhancing to margin and Free Cash Flow
• Diversifies revenue by geography & industry
Strong Cash Flow Generation
Attractive Financing Structure
• Combined unlevered free cash flow(1) of >$500 million
• Improves cash flow conversion due to lower tax rate
• Favorable working capital and low capex
• Rapid delevering and debt paydown
• Combination of debt & equity
• Maintain investment grade ratings
• Flexibility to pursue future growth opportunities
(1) Unlevered Free Cash Flow calculated as net operating profit (EBIT less taxes based on tax rate of 22%) plus depreciation and amortization less capital expenditures; WoodMac includes capitalized software development costs.
Note: 2014 WoodMac financials converted based on monthly financials and converted to USD based on the average monthly FX rate; 2014 average implied FX of 1.645 based on WoodMac USD revenue divided by WoodMac GBP revenue.
13
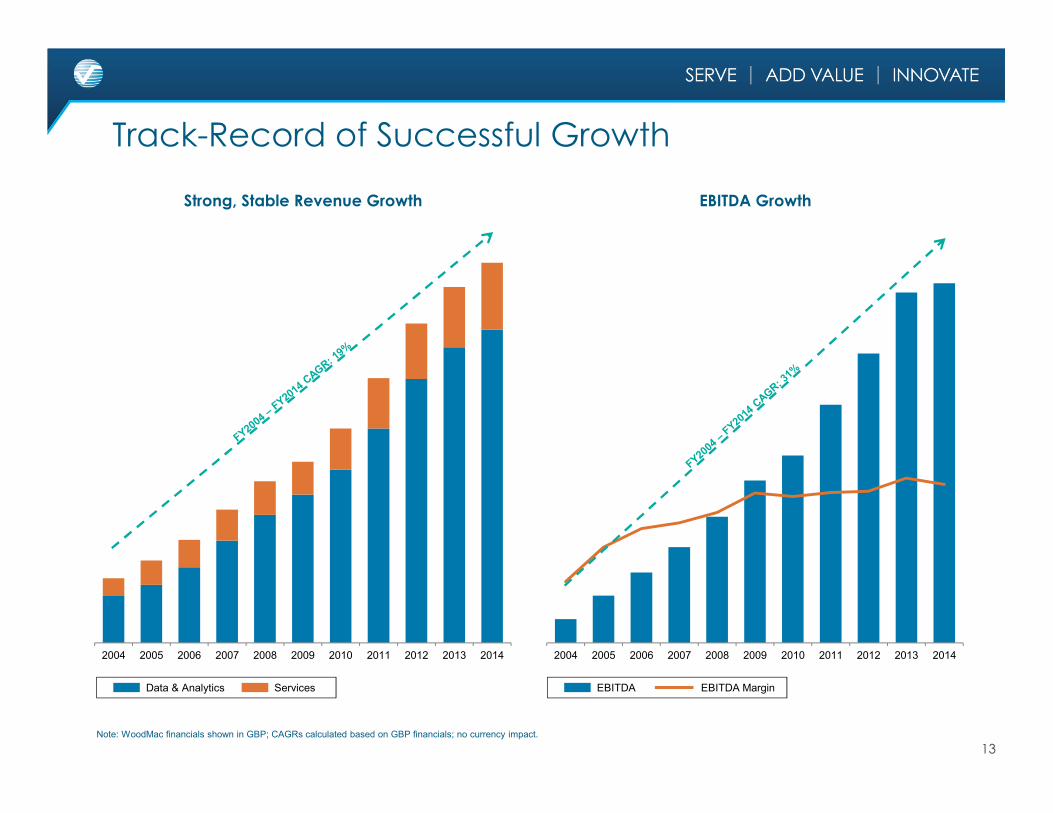
Track-Record of Successful Growth
2004 2005 2006 2007 2008 2009 2010 2011 2012 2013 2014
Strong, Stable Revenue Growth
2004 2005 2006 2007 2008 2009 2010 2011 2012 2013 2014
EBITDA Growth
EBITDA EBITDA MarginData & Analytics Services
Note: WoodMac financials shown in GBP; CAGRs calculated based on GBP financials; no currency impact.
14
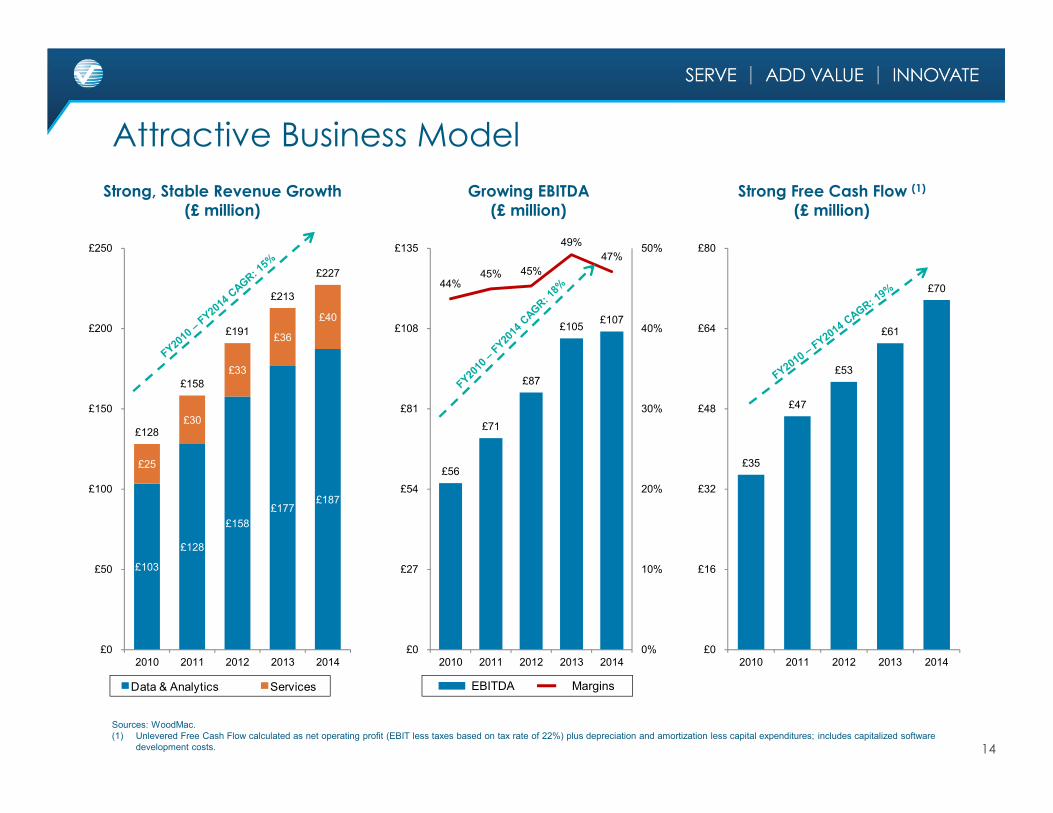
Attractive Business Model
Strong, Stable Revenue Growth (£ million)
Growing EBITDA(£ million)
Strong Free Cash Flow (1)
(£ million)
Sources: WoodMac.(1) Unlevered Free Cash Flow calculated as net operating profit (EBIT less taxes based on tax rate of 22%) plus depreciation and amortization less capital expenditures; includes capitalized software
development costs.
Data & Analytics Services MarginsEBITDA
£103
£128
£158
£177£187
£25
£30
£33
£36
£40
£128
£158
£191
£213
£227
£0
£50
£100
£150
£200
£250
2010 2011 2012 2013 2014
£56
£71
£87
£105£107
44%45% 45%
49%
47%
0%
10%
20%
30%
40%
50%
£0
£27
£54
£81
£108
£135
2010 2011 2012 2013 2014
£35
£47
£53
£61
£70
£0
£16
£32
£48
£64
£80
2010 2011 2012 2013 2014

Growing & Deeply Embedded Customer Relationships
…with Low Customer Concentration
No customer >3%
Consistently High Renewal Rates…
98% 98%
2010 2014
…Diversified Across End Users (Industry) (2)
15
2010 2011 2012 2013 2014
Subscriptions Value Growth (1)…
(1) WoodMac financials shown in GBP.(2) Represents percentage of FY2014 revenue.(3) National Oil Companies.
800+Total Customers
7%Customer Growth CAGR since 2010
Energy40%
Capital Markets25%
Other19%
NOC(3)
16%
16
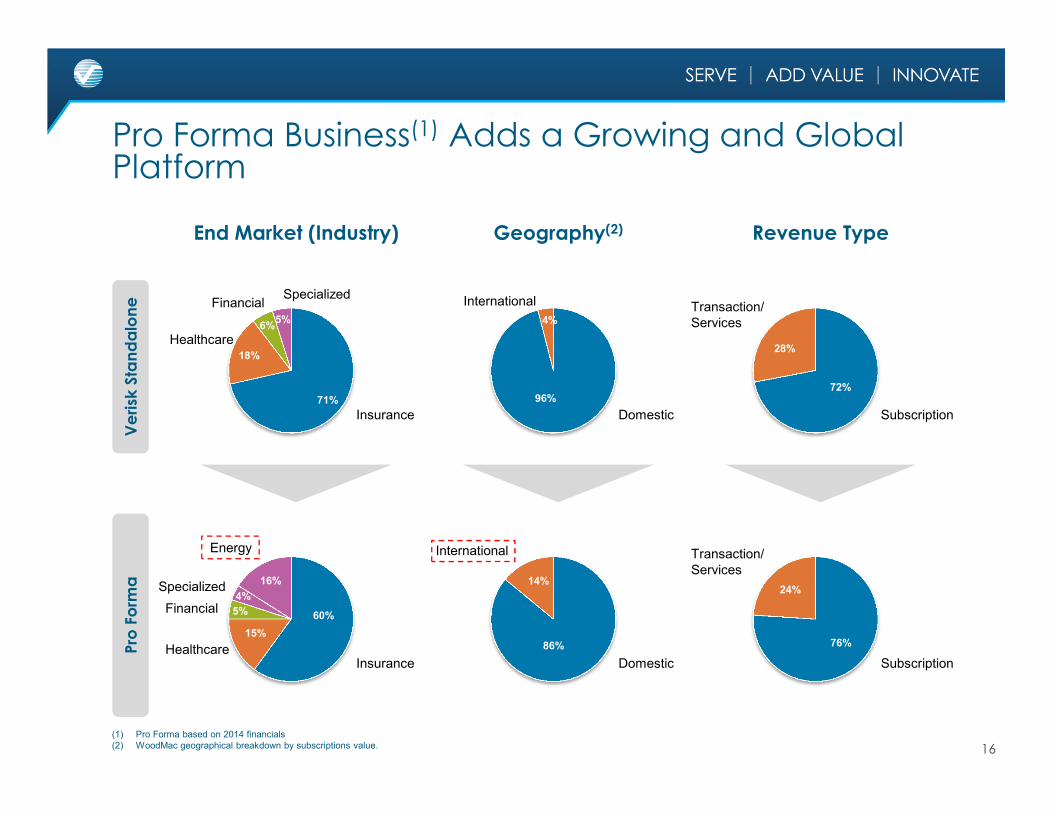
Pro Forma
Verisk Standalone
Pro Forma Business(1) Adds a Growing and Global Platform
71%
18%
6%5%
Insurance
Healthcare
FinancialSpecialized
End Market (Industry)
InsuranceHealthcare
Financial
Specialized
96%
4%
Domestic
International
Geography(2)
86%
14%
Domestic
International
72%
28%
Subscription
Transaction/Services
Revenue Type
76%
24%
Subscription
Transaction/Services
Energy
16%
60%
15%
5%
4%
(1) Pro Forma based on 2014 financials(2) WoodMac geographical breakdown by subscriptions value.

$1,596 $1,747 £213 £227 $1,929 $2,121
Transaction/ServicesSubscription
17
74% 72%
26% 28%
0
20
40
60
80
100
2013 2014
83% 82%
17% 18%
0
20
40
60
80
100
2013 2014
75% 74%
25% 26%
0
20
40
60
80
100
2013 2014
Verisk Standalone WoodMac Pro Forma(1)
Pro Forma Verisk has ~75% Recurring RevenueStrong visibility into future inflows from contractual, subscription based revenues
(1) WoodMac financials converted based on monthly financials and converted to USD based on the average monthly FX rate; 2014 average implied FX of 1.645 based on WoodMac USD revenue divided by WoodMac GBP revenue; 2013 average implied FX of 1.564 based on WoodMac USD revenue divided by WoodMac GBP revenue.

Unlevered Free Cash Flow Free Cash Flow / EBITDA
18
Tremendous Ability To Generate Cash Flow(1)
Both businesses operate with EBITDA conversion rates of ~50%
Verisk Standalone WoodMac Pro Forma(2)
$366
$405
49%50%
20%
40%
60%
80%
$0
$150
$300
$450
$600
2013 2014
£61
£70
58%
65%
20%
40%
60%
80%
£0
£30
£60
£90
£120
2013 2014
$462
$520
51%53%
20%
40%
60%
80%
$0
$150
$300
$450
$600
2013 2014
(1) Unlevered Free Cash Flow calculated as net operating profit (EBIT less taxes based on tax rate of 22%) plus depreciation and amortization less capital expenditures; WoodMac includes capitalized software development costs.
(2) WoodMac financials converted based on monthly financials and converted to USD based on the average monthly FX rate; 2014 average implied FX of 1.645 based on WoodMac USD revenue divided by WoodMac GBP revenue; 2013 average implied FX of 1.564 based on WoodMac USD revenue divided by WoodMac GBP revenue.

Combined Company Financial Profile
19
$1,747
$803
46%
$405
Verisk Standalone
$ million
WoodMac£ / $ million
Pro Forma$ million
$374
$176
47%
$115
$2,121
$979
46%
$520
2014 Revenue
2014 EBITDA
% Margin
2014 Unlevered Free Cash Flow(1)
(1) Unlevered Free Cash Flow calculated as net operating profit (EBIT less taxes based on tax rate of 22%) plus depreciation and amortization less capital expenditures; WoodMac includes capitalized software development costs.
Note: 2014 WoodMac financials converted based on monthly financials and converted to USD based on the average monthly FX rate; 2014 average implied FX of 1.645 based on WoodMac USD revenue divided by WoodMac GBP revenue.
GBP USD
£227
£107
47%
£70
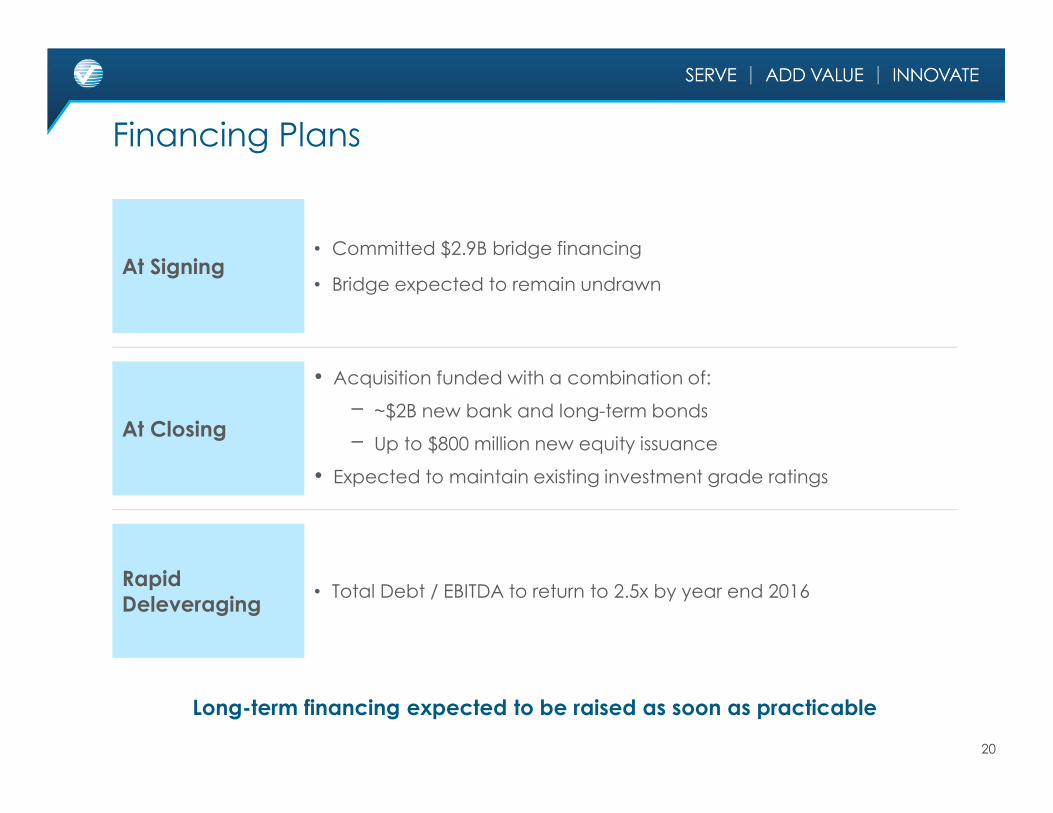
• Acquisition funded with a combination of:
− ~$2B new bank and long-term bonds
− Up to $800 million new equity issuance
• Expected to maintain existing investment grade ratings
Financing Plans
Long-term financing expected to be raised as soon as practicable
20
At Signing• Committed $2.9B bridge financing
• Bridge expected to remain undrawn
At Closing
Rapid Deleveraging
• Total Debt / EBITDA to return to 2.5x by year end 2016

March 10, 2015
Appendix
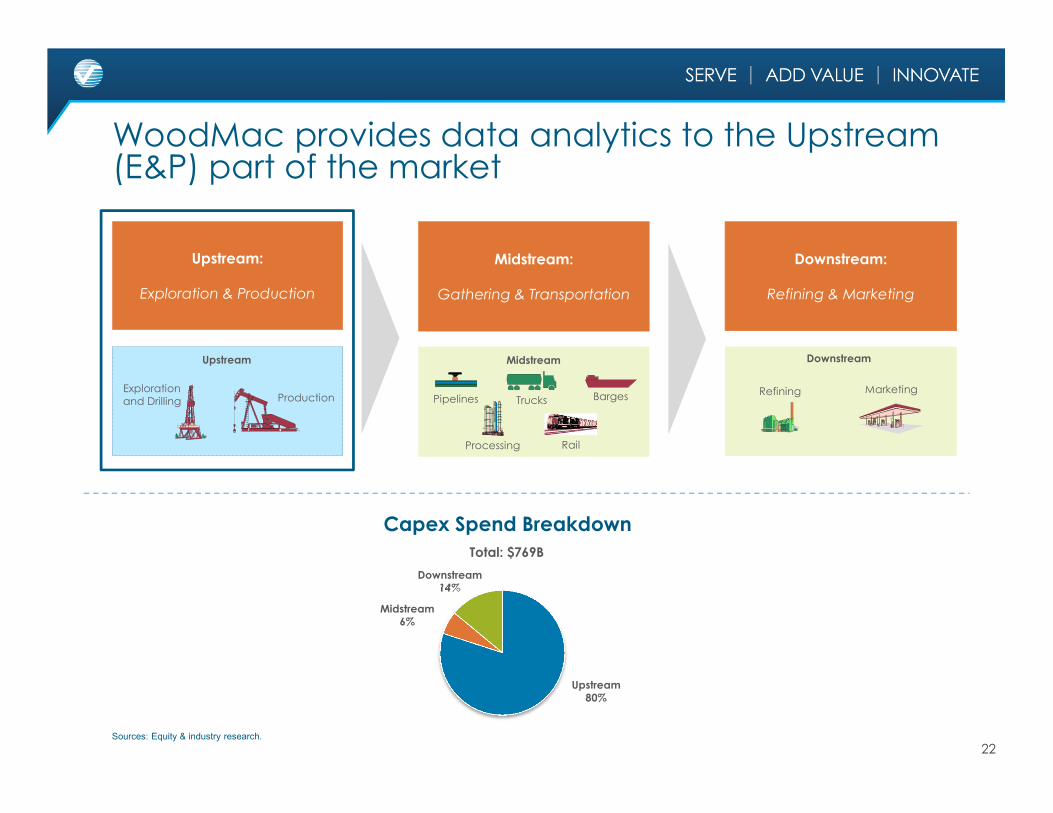
WoodMac provides data analytics to the Upstream (E&P) part of the market
22
Upstream
Exploration and Drilling Production
Downstream
Refining MarketingPipelines Trucks Barges
Midstream
Processing Rail
Downstream:
Refining & Marketing
Upstream:
Exploration & Production
Midstream:
Gathering & Transportation
Midstream6%
Downstream14%
Total: $769B
Upstream80%
Capex Spend Breakdown
Sources: Equity & industry research.