acronyms - dfat.gov.au · web viewlives saved tool, module in spectrum software for estimating...
TRANSCRIPT

Year One Evaluation Report
Medical Supply Reform Impact Evaluation Papua New Guinea
December 2013

Year One Evaluation Report Medical Supply Reform Impact Evaluation
Table of ContentsAcronyms.......................................................................................................................................3
Executive Summary........................................................................................................................4
1. Introduction............................................................................................................................9
2. Overview of evaluation methods for Year One......................................................................11
3. Findings: national planning, procurement and regulation......................................................16
3.1. National planning and budgeting..........................................................................................16
3.2. Procurement tendering and governance...............................................................................19
3.3. Quality control and regulation...............................................................................................21
4. Findings: supply chain systems..............................................................................................26
4.1. National planning and governance of distribution within PNG.............................................26
4.2. Warehousing and medical store stock management.............................................................28
4.3. Distribution practices and communications, in ‘pull’ and ‘push’ systems.............................31
5. Findings: availability and usage of essential medicines in health facilities..............................41
5.1. Availability of essential medicines.........................................................................................41
5.2. Rational use of essential medicines and appropriate prescribing..........................................47
6. Findings: storage and management of medical supplies in health facilities............................52
6.1. Storage and handling in facilities and stores.........................................................................52
6.2. Disposal of expired or unwanted medicines..........................................................................53
7. Findings: community engagement.........................................................................................54
7.1. Community perspectives on medicines availability...............................................................54
7.2. Community costs and accessibility........................................................................................55
8. Findings: equity, health services and population health impact.............................................57
8.1. Equity and health services impact.........................................................................................57
8.2. Linking medicines availability to improved survival...............................................................61
8.3. Health services readiness for EMONC and potential health impact......................................63
9. Implications and Recommendations......................................................................................65
10. References and List of Selected Background Documents........................................................77
11. Annexes (supplied as separate file).........................................................................................80
11.1. Health Facility survey methodology
11.2. Detailed findings and data tables from the health facility survey
11.3. Other data collection tools
11.4. Qualitative analysis from managers survey and discussions
11.5. Year One Evaluation Plan
11.6. Health Facility Surveys tools
11.7. Evaluation team and roles
11.8. Assessment against standard Australian Government evaluation criteria
Page 2 of 81

Year One Evaluation Report Medical Supply Reform Impact Evaluation
AcronymsACT Artemisinin-containing Combination Therapy (for malaria)AMS Area Medical StoreAP Aid PostAUD Australian dollarsCCG Clinical Consultation GroupCFR Case Fatality RateCHW Community Health WorkersCKP Charles Kendall and PartnersCSTB Central Supplies and Tender BoardDAC OECD Development Assistance CommitteeeLMIS Electronic Logistics Management Information SystemsEMONC Emergency Obstetric and Neonatal CareFEFO First Expiry First OutGF Global Fund for AIDS, TB and MalariaGoPNG Government of Papua New GuineaHC Health CentreHEO Health Extension OfficerHF Health Facility/iesHHISP Health & HIV Implementing Service Provider, of Australian Government in PNGHIV Human Immunodeficiency VirusHPA Health Procurement AuthorityIDA IDA FoundationLiST Lives Saved Tool, module in Spectrum software for estimating intervention impactLMIS Logistics Management Information SystemsM&E Monitoring and EvaluationMTDP Medium Term Development PlanMOU Memorandum of UnderstandingMSPD Medical Supplies Procurement and Distribution, within the NDOHNDOH National Department of HealthNRI National Research InstituteO&G Obstetrics and GynaecologyPHA Provincial Health Authority (new governance operational in some provinces)PHO Provincial Health OfficePGK Papua New Guinea KinaPNG Papua New GuineaPOM Port MoresbyPSTB Pharmaceutical Supply and Tenders BoardPTS Provincial Transit StoreRAM-PNG Rotarians Against Malaria in Papua New GuineaSC Health Sub-centreSMHS (UPNG) School of Medicine and Health SciencesTB TuberculosisTOR Terms of ReferenceTNMSC Tamil Nadu Medical Services Corporation Ltd.UPNG University of Papua New GuineaVHV Village Health VolunteerWHO World Health OrganizationWPRO Western Pacific Regional Office of WHO
Page 3 of 81

Year One Evaluation Report Medical Supply Reform Impact Evaluation
Executive SummaryOverall summary
Overall availability of essential medicines in Papua New Guinea (PNG) is at 64%, using a standard WHO measure, which compares well to similar countries in the region, although stock-outs are still experienced. Availability of some important essential medicines in first-line health facilities in PNG has increased in recent years, largely due to the impact of ‘push’ systems, including health centre and aid post kits distributions. This has reached even remote facilities and those in poor districts, and represents a significant increase in their capacity to treat common and life-threatening diseases. A detailed assessment of distribution in the ‘push’ system reveals opportunities for improvement, particularly in coordination and communication, accurate quantification of needs at various levels, and other potential integration of management with the government ‘pull’ system.
National procurement of medical supplies remains hampered by major information gaps constraining effective quantification of needs across different procurement and supply chains. A new reform of medical supplies management has commenced and appropriately prioritizes improved information flow, including the introduction of an electronic logistic management information system (eLMIS), continuation of kits supplementation to standard orders, prioritization within an over-large essential medicines list, introduction of national quality testing, and improved medical stores capacity, all needs that this evaluation confirms.
National procurement and supply chain governance and tendering structures in the government ‘pull’ system, while showing some signs of change, still have yet to display required systems for transparency, accountability, quality and value for money. In the recent ‘push’ system of health centre and aid post kits, the international quality-assured supplier, IDA, was assessed as providing good value-for-money, and the stringent contract and performance management procedures have supported effective distribution of supplies. This experience offers lessons for improved governance in the ‘pull’ system and for future integrated supply-chain management (co-ordinating ‘pull’, ‘push’ and vertical programs), including stronger contract management of out-sourced supply chain functions.
There is scope for considerable improvement in the storage, handling and rational usage of medicines in health facilities, although many facilities are clearly making good use of increasingly available essential medicines to manage significant health priorities.
This evaluation, by including an internationally standardized health facility survey, has generated baseline information, built capacity through local academic partnerships, and commends continued investment in a multi-year evaluation process to track progress in this crucial area of PNG’s health system. These quantitative measures can also, with appropriate stakeholder consultation, be used to model estimates of lives saved in PNG through increased availability of good quality and well-used medicines, as demonstrated in this report. They could also inform review of the way that the NHIS presents current stock-out measures.
Overview of this evaluation
This report presents the first year of a multi-year evaluation into medical supply reform in PNG. It aims to assess and provide benchmarks for the whole medical supply system, including recent ‘push’ system interventions such as the procurement and distribution of ‘100%’1 essential medical supply kits by the Australian Government and the previous ‘40%’ kits, that were introduced to supply the government ‘pull’ system of Area Medical Stores (AMS) and out-sourced delivery to health facilities (HFs). The objectives of this first year of evaluation were to:
1 The terms “40%” and “100%” refer to notional proportions of standardized annual quantities of basic medical supplies for health facilities in PNG and help identify different phases of recent ‘push’ systems. They are not intended to meet all health facility requirements and other supplies from the ‘pull’ system are required.
Page 4 of 81

Year One Evaluation Report Medical Supply Reform Impact Evaluation
Review the status in 2013 of procurement, distribution, access and usage of medical supplies, with a focus on recent procurement experiences;
Consider the broader evaluation needs of medical supplies in PNG, including development of a multi-year evaluation plan that proposes usable indicators to track future progress; and
Provide short-term recommendations that can supplement other planning that is underway.
The Health and HIV Implementation Services Provider supported an evaluation team: an international Procurement and Supply Chain Specialist and four specialists (plus support staff) from the Burnet Institute, in conducting the first year of this evaluation. The evaluation work included:
Desk review of previous assessments and re-analysis of NDOH health information data; International review of IDA Foundation (IDA) the 100% kit supplier; National consultations with a large number of government and partner programs; Interviews and written survey with 131 provincial and district health managers; A survey of 103 health facilities and 8 medical stores in 8 provinces, carried out in
partnership with Department of Pharmacy at UPNG, and UNFPA, under the auspices of NDOH Monitoring and Research Branch.
Key Findings
Availability of essential medicines and supplies, and impact on equity and populationAvailability in 2013 was measured at 64% of selected tracer medicines, available across all levels in the health system from AP to hospital, using WHO’s standardized indicator. This is similar to measures in comparable countries and to a 2009 measurement we inferred from data in a costing study. At this level, however, stock-outs still remain a common occurrence. National Health Information System (NHIS) data and qualitative findings suggest availability of selected high-priority medicines has increased over the past three years, seen for example in a halving of NHIS reports of amoxicillin stock-outs, with analysis suggesting there is likely to be a significant contribution from the kits (initially the ‘40%’ and later the ‘100%’ kits) distributed through the ‘push’ system. Qualitative data from HFs demonstrates that the ‘push’ distribution is highly valued and sometimes the only mechanism to enable continued service provision, especially for more remote facilities and the AP level.
Overall, the kits program has contributed to improved equity in medicines availability. We measured equal availability of essential tracer medicines in high poverty districts and good penetration to HFs designated as ‘remote’. Our findings suggest that the kits (‘push’) system is likely to have contributed more, relative to the ‘pull’ system, to medicines availability in disadvantaged areas. Most qualitative data from interviews back up this finding, with many HF staff reporting that a kit delivery has meant a new level of medicines availability in their facility; as well as a range of specific reports, one example being managers and staff in conflict-affected areas who noted the ‘push’ system option had made it easier to re-open closed rural facilities with more rapid re-commencement of services.
The medicines usage data indicate that much of the supplementary kit contents have been a good fit for the disease profile in PNG, noting that most reports of non-usage of kit medicines related to issues of staff training or authorization, and that most medical supplies are being used to manage conditions of population health importance. While program impact on morbidity and mortality cannot be directly measured at present2, the increase in medicines availability combined with our usage data may be used to model likely increases in case management coverage and subsequent improved survival. As demonstration of part of the potential impact of increased medicines availability, we modelled a possible coverage increase just in childhood pneumonia management as averting an extra 416 child
2 This may be possible in future years, see Section 8 for the difficulties with immediate impact assessment
Page 5 of 81

Year One Evaluation Report Medical Supply Reform Impact Evaluation
deaths by 2013 compared to 2010, using the Lives Saved Tool3. Further modelling using this evaluation’s data is recommended, including examination of maternal deaths averted, but is best done in collaboration with in-country stakeholders, as an adjunct to continuing evaluation.
Review of HF emergency obstetric and newborn care (EMONC) readiness, and of the spectrum of treatments made available through 100% kits, also establishes benchmarks for measurement of future progress in the health system’s capacity to manage important diseases. Serious coverage gaps in EMONC persist, particularly for remote communities, a constraint that represents a major hindrance to universal access to health care in PNG.
Other aspects of the evaluation focused on medical supply system determinants of availability and use of essential medicines, both in the government ‘pull’ system and the ‘push system, are summarised below.
National planning and procurement tendering and governanceA new process of multi-year planning for medical supplies procurement commenced in 2012, supported by increasing budget allocations, but remains hampered by weaknesses in quantification, a critical lack of data on medicines usage and needs, and difficulties in coordinating procurement across ‘pull’, ‘vertical’ and ‘push’ systems. National stock-outs and an associated need for emergency procurements persist.
Recent reviews and stakeholder interviews acknowledge the persistence of difficulties in procurement governance, with processes that still do not guarantee transparency and avoidance of conflict of interest. Current reforms are aiming to strengthen NDOH in-house systems for procurement and tendering, although there remains a mix of opinions as to whether out-sourcing procurement authorities would be of greater benefit. Some developments are evident in the current tender for 2014 kits, introducing international competition and more stringent quality requirements, although review of implementation of improved procedures reveals several needs for strengthening.
The 100% medicines kit represent good value for money for the contents as tendered, and represents excellent value when considering such kits provided a means to increase availability in some of the most remote health facilities in PNG. Some contents were in over-supply (such as intravenous fluids, due to difficulties in quantification), some were not used as planned (such as artesunate suppository and zinc tablets), and others were consumed more quickly than planned (such as common antibiotics and analgesics), however much of the over- or under-use was due to poor compliance with standard treatment guidelines rather than a mismatch of contents with population health needs. In the absence of regular, reliable usage data, future quantification can be improved with attention to differential treatment roles at health centre (HC) and aid post (AP) levels, review of this survey’s findings, supplementary operational research into comprehensive medicines usage at health facilities, and efforts to improve rational use of medicines. Equivalent value for money assessments in the ‘pull’ system are hampered by lack of documentation, although a 2012 rapid assessment noted that public procurement prices were highly variable, with a significant proportion exceeding international median price ratios.
Quality control and regulationStandard Treatment Guidelines are generally up-to-date, relevant and available, however the recently revised national essential medicines catalogue/list remains large and complex, and attempts to prioritize vital and essential medicines within it are not yet operational. In-country quality testing is not yet functional, despite recent investment. There is some evidence of poor quality medicines distributed through the ‘pull’ system, for example discoloration or crumbling (which may result from poor handling in supply chains as much as poor quality at manufacture). However fewer concerns were seen in the 100% kits, whose contents were perceived as higher quality by health workers and
3 Referenced in the main body of the report
Page 6 of 81
Year One Evaluation Report Medical Supply Reform Impact Evaluation
community members. There was some recognition of the fact that 100% kit medicines are procured from a quality-assured supplier (IDA), whose spot-checking and other quality assurance mechanisms were verified in this evaluation.
Supply chain planning, governance and managementNational planning and governance of the supply chain within PNG in the ‘pull’ system is hampered by similar difficulties as for national procurement, with problems relating to inadequate information on performance, as well as transparency and accountability. District and provincial health manager opinions on the value of the ‘pull’ system’s out-sourcing of distribution are mixed, however most expressed a commitment to out-sourcing as on balance the appropriate option, if there is stronger contract management. The introduction of a new eLMIS, mSupply, is one of the most critical investments for medical supplies management and has the potential to meet a crucial information need essential to development; our findings support its extension to AMSs with good uptake capacity, and to a provincial pilot that can assess its contribution to HF-AMS communications.
There were frequent reports and letters of complaints of failed delivery in the ‘pull’ systems between AMS and HF, especially to remote facilities, although records to quantify this are lacking. AMS order processing and timeliness of delivery in the ‘pull’ system also received criticism from managers and HF staff, especially at Badili AMS, and our evaluation measured some baselines in relation to this. In the ‘push’ system delivery data (more accessible but still incomplete) suggest high compliance and quality of transport for kits distribution; although there were some reports of failed supply, these seemed to be traceable and uncommon. Availability data suggests the kits’ ‘push’ system has been more effective in reaching the most peripheral facilities, particularly APs. Criticisms of poor communication between kit delivery contractors and provincial/district health managers point to the need for integrated and more consultative planning in future ‘push’ system distribution. Improved communication and data flow, particularly through the new eLMIS, has the potential to support development in both ‘pull’ and ‘push’ systems.
AMS stocks of essential medicines, measured in this evaluation at 73%, are closer to the NDOH target (90%) than other recent estimates, although there are still critical shortages. AMS processes show many areas for potential improvement and planned refurbishments should be rolled out as soon as possible, to all stores. The establishment of Provincial Transit Stores (PTS) is underway at some sites and, if matched by increased provincial pharmacy staff, could offer a productive way forward for all provinces. Deficiencies in stock tracking at this level were commonly observed and would also require change as part of instituting PTSs as provincial supply hubs.
Handling and usage of essential medicines in health facilitiesWhile many facilities are using medicines well, with good compliance with core aspects of STGs (including new malaria treatment protocols), there are few STGs that are followed completely. Over-use of some medicines (such as antibiotics) and under-use of others (such as zinc) are more likely to reflect deficiencies in staff training than community pressures. It was reported that information resources provided with kits could be more user-friendly and STGs could be helpfully tailored to the AP level.
Both record keeping and storage facilities at HFs require significant attention, with limited storage capacity negatively affecting their ability to store and process medicines in a systematic and hygienic manner. Temperature control, both in the regular monitoring of their cold storage and methods to cool the internal ambient temperature needs attention to maintain the quality of medicines.
Although the kits distribution has proven a valuable supplement, overall, stock-outs are still common and the majority of HFs needed to privately purchase supplementary medicines at some point.
Page 7 of 81

Year One Evaluation Report Medical Supply Reform Impact Evaluation
Overview of implications and recommendations
These findings call for continued investment in both ‘push’ and ‘pull’ system development, and in future evaluation of progress and impact, as discussed below and in the evaluation plan annexed. It is also important to include in both development and evaluation, assessments of the way in which available medicines are used: a critical determinant of improved access to care. Detailed program recommendations are provided in the report, of which the most important are summarised below.
1. From 2014, once GoPNG has reached a clear position on governance structures: all agencies should work to strengthen transparency, value-for-money and an emphasis on quality assurance for health procurement structures, governance and institutional arrangements; including the outsourcing of procurement and supply chain operations accompanied by more detailed and stringent contract and performance management in the ‘pull’ system (which may draw on some of the procedures developed under the recent kits distribution).
Applicable to GoPNG central agencies (including procurement authorities), NDOH, provincial health agencies, development partners
2. From 2014 over next three to five years: continue the ‘push’ system of kit distribution, with out-sourced distribution directly to facilities (including APs), to promote equitable coverage until the ‘pull’ system reaches agreed benchmarks for accurate needs-based supply.
Applicable to NDOH and Ministry of Health, development partners3. From 2014 over next two years: quantification for both ‘push’ system distribution kits and
the NDOH multi-year procurement plan should be enhanced by integrated estimates that maximize all available information: from vertical programs and AMS medicines usage records, the ‘pull’ system’s vital and essential medicines review, and new eLMIS data; and also be informed by rapid operational research (by WHO or another technical partner) into the full range of medicines usage and disease threats in a representative sample of HCs, SCs, and APs. This may allow revision of the NDOH multi-year plan in two years’ time.
Applicable to NDOH, development partners4. From 2014 over next three years: intensify support to other current medical supplies
management reforms, as in the MSPD reform plan, particularly: expanded introduction of the eLMIS (mSupply) to regional AMS and pilot provincial locations; integration of distribution resources and systems across ‘pull’, ‘push’ and vertical programs; and expanded quality assurance staffing, equipment and procedures for whole of system monitoring.
Applicable to NDOH, development partners, provincial health agencies, government and non-government health facilities with existing eLMIS
5. From 2014: Support provincial and district involvement in management and quality improvement for both ‘push’ system kits deliveries and the handling of medical supplies in rural facilities through planning meetings of contractors and provincial/district managers prior to kit deliveries; and support stronger integrated supervision of medicines management and rational usage within provinces by increasing pharmacist and pharmacy technician positions and placements in provincial health agencies, including PTS, as well as supporting existing district/provincial managers and/or AMS staff in supervision visits at HFs.
Applicable to provincial health managers, NDOH, development partner activity planners, non-government health planners, local health NGOs
6. From 2014: continued commitment to evaluation, tracking progress and impact using the benchmarks in this first year’s work, maintaining the academic partnership with UPNG (noting their benefits in capacity development and sustainability) and other technical partners, as well as review of findings in this report and the detailed recommendations below to inform program management. Consider review of the NHIS stock-out indicator.
Applicable to program managers at national and provincial levels, in government and development partner programs, NDOH, development partners
Page 8 of 81

Year One Evaluation Report Medical Supply Reform Impact Evaluation
1. Introduction
1.1. Report overview and purposeThis report presents the methods, findings and recommendations arising from the first year of a multi-year impact evaluation of medical supplies reform in Papua New Guinea (PNG). The report is intended for use by the Government of PNG (GoPNG), its development partners, stakeholders involved in medical supplies, and health service providers in government and non-government services.
This report presents an overview of the methods used, then the findings of this year’s evaluation in separate sections representing different aspects of the medical supplies system, followed by a concluding section collating the various implications and recommendations from the evaluation team. Annexes provided detailed findings from key evaluation activities, including a large health facility survey, and qualitative analysis of data from interviews and written surveys.
1.2. BackgroundThe GoPNG is aiming to improve procurement and distribution systems to provide quality-assured medical supplies, especially essential medicines and life-saving commodities, to all health facilities. The government and its development partners, in particular the Australian Government, have been working on improving medical supplies availability for more than a decade. In response to what a ministerial taskforce termed “serious on-going medical supply problems”[1]4 the Government of PNG commenced a program of governance and implementation reforms in 2009, including re-structuring of National Department of Health (NDOH) agencies, out-sourcing of distribution to a third-party logistics company, LD Logistics, to distribute medicines between AMS and health facilities5, and a request to the Australian Government to support direct distribution of medical supply ‘kits’ (see below).
Changes continued in the period 2010 – 2012, including a number of reviews of procurement and distribution, both of the general government system, and of the ‘vertical’ programs for malaria, tuberculosis, HIV, family planning and other reproductive health commodities. The NDOH has developed a medical supplies reform plan, gearing up in 2013, including work on:
Procurement and Supply Management Governance; Vital and Essential Medical Supplies Availability and a Multi-Year Procurement Plan; Logistics Management Information System (mSupply), improvement to logistic and
distribution arrangements; Area Medical Stores refurbishments, refocusing medical stores functions in just three Area
Medical Stores (AMS: in Baidili, Lae and Mt Hagen), and planning for Provincial Transit Stores (PTS) in each province;
Continuing and strengthening Medical Supply Kits, and Vertical Supply Chains; Quality Assurance, Policies, and Standard Operating Procedures; and Staff Development / Capacity Building, Communications and Engagement.
These years have also seen a major reinvestment in approaches to ‘push’ systems of medical supply kits, that is: standard consignments of supplies delivered direct to health facilities at regular intervals.
4 Both footnotes (comprising explanatory statements) and references to source documents are used in this report. Document references are noted as [1] and listed in Section 10.5 Although the LD Logistics contact seems to specify delivery from AMS to HC, field interviews report successful and failed attempts at contractor deliveries to the AP level as well as to HCs.
Page 9 of 81

Year One Evaluation Report Medical Supply Reform Impact Evaluation
These had been employed in the past, with mixed results; the most recent implementation included new procedures to enable supplies to reach the most peripheral health facilities. These included, in 2011-12, the “40%6 HC and AP kits” that were procured by NDOH, but then (following a cancelled tender) distributed by the Australian Government at NDOH’s request, using a single national logistics company. Then from 2012 onwards, the “100% HC and AP kits” were procured by the Australian Government an international quality-assured supplier (IDA in The Netherlands) and distributed in 2012 and 2013, using a commercial agent (CKP) managing three logistics companies. NDOH with technical support from the World Health Organization (WHO) developed standard contents lists for these kits, and volumes were adjusted according to reported numbers of outpatients at each facility. The kit programs were intended to provide assured delivery of medical supplies directly to rural health facilities, including aid posts, without passing through the government medical stores of the standard ‘pull’ system.
Work by NDOH, with partner support, to improve tendering processes was also initiated, including an international competitive tender, underway during the evaluation period in mid-2013, for new kits to be procured for 2014-16. These add to recent attempts to strengthen the standard NDOH supply chain (‘pull’ system) through the NDOH medical supplies reform plan noted above.
As current options for medical supplies monitoring and evaluation are limited, and this represents an area of major investment by the GoPNG and development partners, the Australian Government is supporting a multi-year impact evaluation.
6 The terms “40%” and “100%” refer to notional proportions of standardized annual quantities of basic medical supplies for health facilities in PNG and help identify different phases of recent ‘push’ systems. They are not intended to meet all health facility requirements and other supplies from the ‘pull’ system are required.
Page 10 of 81

Year One Evaluation Report Medical Supply Reform Impact Evaluation
2. Overview of evaluation methods for Year One
2.1. Overview of Year One evaluation approachThe overall objectives of the first year of the evaluation plan were to verify the efficiency, sustainability and progress towards PNG sector-wide medical supply reforms and their contribution towards health service delivery outcomes in PNG.
Review status in 2013 of procurement, distribution, access and usage of medical supplies, with a focus on recent procurement experiences;
Consider the broader evaluation needs of medical supplies in PNG, including development of a multi-year evaluation plan that proposes usable indicators to track future progress; and
Provide short-term recommendations that can supplement other planning that is underway.
The evaluation work included: Desk review of previous assessments; Analysis of NDOH health information data – in particular to conduct a detailed analysis of
changes in stock-out records for individual commodities (currently consolidated as a single indicator) over 2010 to 2012;
International review of IDA, the 100% kit supplier, to assess quality, efficiency, performance and value, through a site visit to IDA, document review and consultations with the transport management contractors and CKP, their managing agent;
National consultations with more than 30 government and partner programs working on medical supplies procurement, ‘push’ and ‘pull’ supply systems, and medical supply kit programs;
Consultations with 131 provincial and district health managers from all provinces in PNG as an addition to Partnership in Health workshops carried out for another purpose in late June and July, 2013;
A health facility survey of more than 100 facilities and medical stores in eight provinces being carried out in partnership with Department of Pharmacy at UPNG, and UNFPA, under the auspices of NDOH Monitoring and Research Branch, during June 6 – 22, 2013.
Work in Year One respond to a set of detailed evaluation questions provided in early terms of reference for a multi-year evaluation, and consolidated, for this work, as part of a Year One evaluation plan (Annex 11.5). This annex also tabulates where in this report each question is addressed. These questions covered topics of:
Multi-year procurement planning and forecasting: accuracy of forecasting and quantification to reflect PNG essential medicine needs, feasibility of improvements required for current national information systems;
Budgeting and expenditure: effectiveness of medical supply expenditure and links to procurement planning;
Quality control and regulation: including standard and quality of medical supplies, appropriateness of the Standard Treatment Guidelines and Essential Medicines List (medical and dental catalogue);
Procurement and tendering: changes of medical supply procurement through internationally competitive bidding and/or national standards, and procurement through quality assured suppliers;
Distribution, warehousing and inventory control: availability and timeliness of medical supplies, especially changes since the introduction of the 100% kit system;
Facility storage, supplies management and waste management: appropriateness of medical supplies and quantities between different distribution systems;
Page 11 of 81
Year One Evaluation Report Medical Supply Reform Impact Evaluation
Access and utilisation (including rational use of medicines): changes in stock-out rates, medicines availability and the contribution by different distribution programs, changes in government and household spending on medicines, rational use of medicines and compliance with Standard Treatment Guidelines;
Community engagement: perception of change in medicines availability and quality, consultation of community members regarding medical supplies and health facility management;
Transparency, governance and anti-corruption: impacts of anti-corruption efforts on medical supply reforms and perceptions of corruption; and
Health impacts: changes in morbidity and mortality attributed to increased availability of quality assured medicines.
2.2. National consultationsThe medical supplies team met with over 30 nationally based stakeholders from government, contractors, and development partner programs working on medical supplies procurement, tendering and distribution. They included stakeholders in:
National Department of Health;- Secretary, deputy Secretaries and senior executive, including National Health Policy and
Corporate Services, as well as senior managers from Strategic Policy, Medical Standards, Public Health, Family Health, Corporate Services
- Managers from Medical Supply Procurement and Distribution, Financial Management Services, Commercial Support, Central Public Health Laboratory, Performance Monitoring and Research, Pharmaceutical Standards
- International advisors supporting Medical Supplies Procurement and Distribution, Public Health Management, Warehousing, Health Information systems
Managers in other government departments coordinating contract management and procurement, as well in the Central Supply and Tenders Board, Auditor General Office;
Academic institutions including National Research Institute (including the Promoting Effective Public Expenditure (PEPE) project team), Institute for Medical Research, Divine Word University, University of PNG;
Senior clinicians including the Director of Medical Services and Pharmacy Staff, Port Moresby General Hospital, Churches of Medical Council, and Church Health Services liaison office;
Development partners including International Finance Corporation, Rural Primary Health Services Delivery Project, WHO, UNICEF, UNFPA, Asian Development Bank, World Bank, Oil Search, Global Fund, World Vision, Medicines Sans Frontiers, Transparency International, Population Services International, Clinton Health Access Initiative, Business Coalition Against HIV and AIDS, Strongim Pipol Strongim Nesen;
Commercial contractors working in medical supplies including Charles Kendall and Partners, Loha Customs, Panamaseier, Post PNG, Protocal Investment, LD Logistics
IDA, Borneo Pacific and other pharmaceutical suppliers; Non-government organisations; and Australian Therapeutic Goods Administration (TGA).
2.3. Health facility surveyA national survey of health facilities was conducted to allow objective measurement of the impact of outsourced procurement and direct distribution and establish benchmarks against a number of the evaluation questions for future measurement.
Page 12 of 81

Year One Evaluation Report Medical Supply Reform Impact Evaluation
The WHO Operational Package for Assessing, Monitoring and Evaluating Country Pharmaceutical Situations was adapted for use in PNG for reliable methodology and international comparability. The survey purposively sampled geographic areas, with a mix of purposive and random sampling within those areas, as recommended in the WHO Operational Package (detailed methodology is provided in Annex 11.1). Two provinces from each of PNG’s four regions were sampled, which provided contrasts in the primary mode of transport access, distribution methods, and socio-cultural makeup. At least one province per region with a higher proportion of districts classified as most disadvantaged and where distribution problems have been noted were included. Additionally, there was inclusion of provinces that were deemed to be development priorities due to population health needs and a commitment to governance reform. Mixed purposive sampling and random selection within each province included hospitals, health centres, sub centres and aid posts. In each province, a set of alternate sites were pre-selected, using an extension of the above criteria, if unexpected security or weather events required a change in plans.
The survey visited 103 health facilities, eight medical stores and interviewed 487 patients, observing 1088 prescriptions. The survey was conducted by 61 students, five staff and four specialists during June 6 – 22, 2013.
Table 1: Summary of recruited sites by geographical area and facility type.Number of sites
Geographical area Hospital HealthCentre
SubCentre
AidPost*
Area Medical Store
Provincial TransitStore
SOUTHERNWestern 3 4 1 6 1Milne Bay 1 4 5 1MOMASEMadang 1 5 1 8 1West Sepik 1 4 1 4ISLANDSEast New Britain 2 3 2 7 1North Solomons 1 5 1 12 1HIGHLANDSEnga 3 2 2 4Western Highlands 1 3 2 4 1OTHERLae 1Port Moresby 1TOTAL 13 30 10 50 4 4
*Includes APS that were visited and 12 that were not visited but whose staff were interviewed off-site.
This survey added a limited set of open qualitative questions, on four areas: supplies availability, stores management procedures, medical supplies distribution (especially the 100% kits), recording of health information on medical supplies, and the rational use of medicines. This provided additional information on health worker and patient opinions. The assessment of health facility readiness for emergency obstetric and newborn care (EMONC), a limited set of questions on EMONC equipment and its usage was addressed through observation and interview. These quantitative responses were derived from the EMONC Needs Assessment tool from the WHO-accredited program at Columbia University, Averting Maternal Death and Disability, which is an acknowledged global standard.
The health facility survey was undertaken in collaboration with the University of PNG, School of Medicine and Health Sciences (SMHS)’s Department of Pharmacy. Staff and students highly valued their involvement, with students learning good international practice related to rational medicines
Page 13 of 81

Year One Evaluation Report Medical Supply Reform Impact Evaluation
use and activities to improve access to essential medicines, while experiencing rural health system realities, often for the first time. Student involvement enabled survey fieldwork to be conducted in just two weeks and exposed them to international research methods. The mobilisation of participants and logistics of the survey was successfully conducted by the Australian Government’s Health and HIV Implementation Services Provider (HHISP). The EMONC assessment was performed in partnership with UNFPA PNG Country Office and the Family Health Services Division of NDOH.
Ethics approval to conduct the survey was received both from the Alfred Ethics Committee, Melbourne, Australia, the University of PNG, and the Medical Research Advisory Committee, NDOH, PNG.
2.4. Consultation with church, provincial and district health managers The medical supplies team administered surveys and held interviews and focus group discussions (FGD) with 28 provincial, 57 district, and 46 church health service health managers from all provinces in the country. This took advantage of Partnership in Health workshops that brought these managers together for another purpose. All managers were first asked to complete a short anonymous written survey regarding their perceptions of the medical supplies system. After this, participants were involved in a group discussion (FGD) to discuss issues relating to the research questions, with separate groups for church health service managers, provincial health office managers, and district health managers. The findings were compiled and analysed using NVIVO, and are presented in the Qualitative findings section (Annex 11.4). Detailed tools and a report on the findings are annexed. These findings also contributed to the main body of this report at appropriate points.
2.5. Data analysis, interpretation and disseminationQuantitative data were analysed in standard analysis software (STATA7), with associations and precision examined with reference to 95% confidence intervals. Given the purposeful nature of the sampling, such confidence intervals were generally not useful to determine statistically significant differences in means. They have been used to gain insight into the spread of standard error in our measures (and in this report are displayed only where this is helpful). Calculation of means, especially in relation to medicines availability, has been weighted according to variety of medicines sampled at different levels in the health system. In many cases, median values were used to better characterise measurements, due to the large variation in numbers and responses.
Qualitative data were subject to thematic analysis by use of the analysis software NVIVO 8. Thematic analysis was verified by two researchers independently, conducted separately to quantitative measures, and used to triangulate quantitative measures of relevant indicators.
Direct measurements from the survey were expected to comprise: availability of the key tracer medicines and EMONC equipment, brand origins and quality; affordability of key medicines; prescribing and rational usage of key tracer medicines, and in key tracer medical conditions
(including pneumonia and EMONC), compliance with Standard Treatment Guidelines; quality of medical supplies management, staffing and infrastructure; and validation of some aspects of health information system reporting on pneumonia case
fatality rates, EMONC outcomes and medical supplies stock-outs.
The sampling methods could allow for comparison tests to contrast by:
7 StataCorp, 4905 Lakeway Drive, College Station, Texas 77845 USA, http://www.stata.com 8 QSR International Inc., 55 Cambridge Street, Burlington, MA 01803, USA www.qsrinternational.com
Page 14 of 81

Year One Evaluation Report Medical Supply Reform Impact Evaluation
region (ecological zone), predominant means of transport; remoteness of facilities; mechanism of supplies distribution, comparing direct distribution “100% kits” with a vertical
program (malaria) supplies, and the ‘pull’ system; and level in the health system, hospitals, health centres and aid posts.
Further analysis and interpretation included triangulation against two NHIS indicators, reporting case-fatality rates in childhood pneumonia, and medical supplies stock-outs.
2.6. Evaluation team, roles and oversightThe evaluation team was contracted by the Australian Government, with mobilization and logistics for all aspects of the work provided by the HHISP. The team comprised four researchers (supported by management and analysis staff) provided by the Burnet Institute, whose Public Health Specialist led the process, and an independent Procurement Specialist. The large health facility survey in this year was conducted in partnership with the UPNG, School of Medicine and Health Sciences (SMHS)’s Department of Pharmacy, the NDOH and the United Nations Family Planning Association (UNFPA) country office. Burnet Institute, the independent Procurement Specialist, and UPNG, provided the objectivity of independent agencies with no direct responsibility for medical supplies provision in PNG.
The Burnet Institute’s research team coordinated the health facility survey, including all aspects of sampling, survey instruments, data entry, storage and analysis. SMHS academic staff advised on survey structure and surveyor training, enabled 61 pharmacy students to support data collection alongside Burnet staff and SMHS Academic staff, and reviewed initial survey findings.
The core evaluation team conducted the national consultations in May and June 2013, with both contributing to the analysis and findings in this report. The Burnet team and SMHS academic staff conducted the provincial and district health manager surveys and focus group discussions, with Burnet staff responsible for the collation and analysis of this qualitative data.
The HHISP coordinated travel, security and logistics for all meetings, as well as the extensive field travel involving over 70 surveyors travelling to ten provinces within a two-week period in June 2013.
A Technical Review Committee was formed to provide advice on the adaptation of standard methods to PNG, to determine the type of tracer medicines selected and to ensure that details of importance to national medical supply reforms are included in the survey. This committee first met on 8th May 2013, and provided advice to inform the methods proposed below. This committee includes: PNG NDOH Monitoring and Research section, PNG NDOH Medical Supplies Procurement and Distribution section, PNG NDOH Pharmaceutical Standards section, WHO Country Office, UNICEF Country Office, UNFPA Country Office, Australian Aid Health and HIV Program (including those responsible for medical supplies distribution contracts), and the independent Procurement Specialist. This committee, with other observers, also received an Aide Memoire report on the evaluation fieldwork and initial interim findings on June 27 th June 2013. It will review the draft of this report and receive a final presentation of findings, however the responsibility for final analysis, interpretation and conclusions rested with the core evaluation team and other academic partners who contribute as authors on technical reports and publications.
Page 15 of 81

Year One Evaluation Report Medical Supply Reform Impact Evaluation
3. Findings: national planning, procurement and regulationThis section presents findings on national planning, financing and procurement of medical supplies, including considerations of governance and transparency in these functions. The majority of findings in this section were derived from national consultation interviews and document review, although some assessments draw on health facility survey measurements.
3.1. National planning and budgetingKey finding: A new process of multi-year planning for medical supplies procurement commenced in 2012, supported by increasing budget allocations, but remains hampered by weaknesses in quantification, a critical lack of data on medicines usage and needs, and difficulties in coordinating procurement across ‘pull’, vertical and ‘push’ programs. National stock-outs and associated need for emergency procurements persist. The recent 100% HC and AP kit procurement represented good value for money for the contents as tendered, with the supplier, IDA, and the payment procedures enabling good quality provision at a competitive price.
For the ‘push’ system kits, difficulties in quantification meant some contents were in over- or under-supply however evaluation findings suggest this was due to poor compliance with standard treatment guidelines rather than a mismatch of contents with population health needs. In the absence of regular, reliable usage data, future quantification can be improved with attention to differential treatment roles at HC and AP levels, review of this survey’s findings, supplementary operational research into comprehensive medicines usage at health facilities, and efforts to improve rational use of medicines.
3.1.1. National planning of multi-year procurement and quantification
National consultations and document review demonstrated increased attention to national planning for estimation of medical supplies needs, although external technical assistance continues to be required. In 2012 quantification of HIV, malaria, tuberculosis, vaccines and other essential medicines was undertaken with international development partner support (the Australian Government, GF and WHO) to inform a new three-year procurement plan. Associated commodity and shipment costs were also included. The intention was to identify all procurements required during this time period, value of procurement, funder and financial gaps to ensure predictable funding to cover medicine requirements. To date this procurement strategy is in its infancy and is only partially adopted within NDOH systems. The brief plan put together by the NDOH lists tenders and prospective procurements but it is not comprehensive and has not been used to track procurements as yet. A Medical Supplies Management Committee is established and being strengthened to operationalize some aspects of the plan.
A major limitation is the absence of timely, accurate data on usage or stock levels across the health system, and this gap drives some of the NDOH medical reform planning discussed below, such as the Logistics Management Information System. Although some consumption information is recorded, including in the NHIS, there is currently no broad data collection method that would enable consumption data to be captured and used to inform annual forecasts. Information related to facility orders held by Area Medical Stores (AMS) is incomplete and reportedly inaccurate. There is also no established system for monitoring of effective procurement planning thus far. Current plans do not yet include a mechanism to analyse actual usage against disease burden or population health needs (for example to predict reductions in irrational usage of medicines) as part of quantification. The planned vital and essential medicines review will help compensate for the data gap, but is challenged by the size of the essential medicines list (see below). At present annual forecasts use
Page 16 of 81

Year One Evaluation Report Medical Supply Reform Impact Evaluation
issues data9 from the AMS and other historical data such as outdated forecasts, adjusted by adding a small arbitrary percentage. A six month buffer stock of medicines is intended, however the 2012 procurement specialists exit report[2] revealed that in the AMS more than 71% of the items had less than three months stock. Stock on hand data, expired and locally procured medicines were excluded from the quantification. Outstanding purchase orders whose status could not be ascertained were excluded.
Emergency orders to fill unanticipated shortages are common. These requirements may not be shown in current procurement planning particularly those that are procured outside the NDOH. AMS Badili records could not quantify the frequency or size of emergency orders that they placed although it was reported that this was a routine activity once it was known that an item was in low supply with no stock in the pipeline. Analysis in 2008 suggested 18% of total procurement as emergency orders[1], and a 2012 rapid assessment confirmed a high frequency of purchase orders. However it is not yet possible to quantify changes at a national level. Sub-nationally, analysis of the Lae AMS records from January to March 2013 suggested 19% of registered orders from facilities were emergency orders. Improved records may allow tracking of this into the future and is considered in our proposals for evaluation planning. Other subnational emergency order frequencies are discussed in the Distribution section below. Qualitative data from AMS and provincial health manager interviews report national shortages as a persisting reason behind AMS failing to fill some health facility orders.
Overstocking of some items continues, with a range of slow-moving items routinely expiring (for instance tracheal tubes)10, as well as general medicines that are in oversupply. A 2010 study by an AMS pharmacist11 estimated expired medicines in Badili, Lae and Hagen to account for a value of 2.2, 1.6, and 0.9 million PGK respectively. The pharmacist’s study also quoted historical estimates of wastage of significantly greater amounts. Qualitative data from provincial and district health managers in our evaluation suggest a common practice within the ‘pull’ system of dispatching supplies with short expiry times from medical stores to health facilities – a practice that recipients sometimes viewed as ‘dumping’ especially when the short-dated supplies had not been ordered by the facility.
Until there is widespread use of usage tracking, such as stock-cards at the HF level, additional pharmaceutically trained staff to monitor supplies management, and an electronic logistic management information system (eLMIS) at the medical stores level, what constitutes as ‘appropriate’ quantities cannot be understood. Vertical programs which have access to specific case management data can attempt more accurate estimations on needs and demands. However in the case of Malaria, despite point-of-care testing for more accurate case-finding, mismatch between supply and demand for ACTs has continued in this evaluation period. The other major contributor is the level of staff training in standard treatment guidelines (STG, discussed below) to avoid under- or over-use of supplies.
3.1.2. Coordination among procurement programs
There are a number of procurement programs operating in parallel with the NDOH ‘pull’ system, for: health facility kits; vertical disease control programs in HIV, tuberculosis and malaria; vaccines and related consumables;
9 The distribution of a specific amount of an item to an intermediary stocking facility or a health facility.10 At AMS Hagen there were 6,600 units of over 20 types of tracheal tubes expired from 2009 to 2012 at an estimated cost of 36,000 kina. There are 8,700 further tracheal tubes with expiry dates in 2016 and 2017.11 Pre-registration research by Timothy Yomba, accepted by Pharmaceutical Society, not in formal circulation
Page 17 of 81

Year One Evaluation Report Medical Supply Reform Impact Evaluation
family planning commodities; and other specific supplies, such as for obstetric equipment.
These parallel programs were intended to be included in recent national quantification exercises, however unreliability of usage data (perhaps with the exception of tuberculosis medicines) in both vertical programs and the general ‘pull’ system means that it was estimated that true integrated quantification may not be possible until 2015 or later. Several vertical programs, and the ‘push’ system have so far operated independently, although reproductive health commodities such as medroxyprogesterone are procured by UNFPA and then incorporated directly into the NDOH system. For many programs, especially if values are below a certain threshold, procurement continues to take place without reference to the NDOH medical supplies management.
Only some medicines and medical supplies in the kit system were included in past forecasts (among the 85 medicines from the health centre kits) with potential overstocks of some medicines and under stocks of others. For forecasting purposes, the 100% Aid Post kit content was assumed to cover all AP needs. This particular quantification was conducted by WHO on behalf of NDOH and based on international standardized morbidity and mortality data together with a comparison of the United Nations emergency kit. It was tailored to PNG using NHIS outpatient data with one HC kit equated to 5,000 outpatient visits per year, however inconsistencies in local databases made this difficult, and it was not possible to incorporate information on disease profiles derived from local settings in PNG.
In the absence of representative usage data (as noted above) the contents for the 2014 kit tender had to be revised on the basis of feedback received during monitoring visits and in delivery reports. Additional consultation for this included HC and AP health workers, NDOH’s Chief Specialists and the WHO. The tender for kits for 2014 was incorporated into an integrated national budgeting process, but the continuing difficulties in estimating expected consumption mean it will be impossible to avoid some duplication with the ‘pull’ system.
Given this, quantification of ‘push’ system kits, which remain essential in the medium-term, presents significant challenges. If possible, future exercises should attempt to incorporate expired and locally procured supplies into the final procured quantities. Without adequate use of records such as stock cards at the HF level and no electronic logistic management information system (eLMIS) at the medical stores level, what constitutes ‘appropriate’ quantities remain difficult to clearly define. The detailed notes on HF opinions captured in this survey (see Annex 11.2) may provide some additional insights. In addition, operational research into comprehensive use of medicines at rural facilities for all conditions seen (something beyond the scope of this evaluation), will help fill information gaps while routine LMIS is being introduced.
3.1.3. Budgets and expenditure
Budgets for medical supplies are increasing, as are overall PNG government health. In 2012 there was a budget of K112 (or K127m12) million, K133 (or K148m) million allocated for 2013 and a significant increase to K214 (or K229m) is being programmed for 2014, including allocation for HC and AP kits. Some expert assessments suggested that this still represents an under-estimate of PNG’s true medical supply needs, however concerns regarding the health system’s capacity to make use of supplies have restrained greater increases. The World Bank has in the past estimated that about 80% of health expenditure is funded by the national government[3] although this figure does not include health expenditures by private providers. Informal reports suggest that there have been significant delays in in the Department of Treasury releasing funds for medical supplies procurement and distribution. In 2011 and 2012, the first substantial tranche was received during the second
12 Both verbal and written estimates varied.
Page 18 of 81

Year One Evaluation Report Medical Supply Reform Impact Evaluation
quarter of the year and funding did not meet planned expenditure until the fourth quarter. In 2013, the funding did arrive in a relatively timely fashion (February). This was sufficient to cover approximately two thirds of annual planned expenditure.
Until now expenditure reporting has not provided a helpful gauge of budget accuracy and a rapid assessment in 2012 confirmed a very poor match between budget and reported expenditure, with approximately 50% of budget not captured in expenditure reports. A finance advisor reports that the medical supplies budget has usually been either expended fully or slightly underspent, although accounting is made more difficult by the fact that medical supply budget lines have been shifted to other purposes; a practice that may account for up to 15% of the total annual budget. Other accounting practices make this difficult to correlate: budget orders are based on expected consumption, while expenditure is recorded only when the cash actually leaves the Department bank account. This timing gap may amount to several months, with few supplies paid for in advance, all leading to irregular expenditure patterns. The expenditure figures for 2013 are hoped to provide a better assessment of the accuracy of the budgeting process, through improvements underway in both the financial management and the procurement management systems.
As national medical supplies expenditures, in the ‘pull’ system are made after delivery, acquittals do not present a major concern at this level. However, it is reported in focus group discussions that for local procurement, provinces may make advance payments for medicines that have not been delivered. Inspection of purchase orders in Lae AMS during the HF survey found that not all of ordered supplies were delivered and many were unlikely to have been delivered without follow up with the suppliers. These expenditures are audited as part of the annual audit report carried out by the Auditor General’s office, however information later than 2011 is not yet available.
Detailed review of IDA, the international supplier of the 100% HC and AP kits, suggests that this achieved acceptable value for money. This included review of contracting documentation, visit to IDA operations, and triangulation against manager consultations and HF survey findings. This confirms that the kits contain quality assured medicines and were efficiently handled in their supply chain (see below). Advance payments for the 100% kits supply were noted as a means of achieving better value for money By provision of payment for the whole 5 round deliveries at the outset, the pharmaceutical supply contractor was able to negotiate advantageous pricing for the duration of the 100% HC and AP kit contract (around 18 months). IDA reported that there was a direct positive correlation between the price and the length of time that a price validity was required. However this was able to be offset by providing pre-payment to manufacturers to enable them to buy raw material in bulk at the outset of project. The kit cost could have been more cost effective if quantifications were made closer to requirements (though note the difficulties in achieving this discussed below).
Equivalent value-for-money assessments in the ‘pull’ system are hampered by lack of documentation. In the 2012 rapid procurement assessment[2] it was found not all procurement is at international prices: 50% of medicines surveyed exceeded the Median Price Ratios (MPR) cut off for international prices. This assessment noted that there was a great deal of variability in prices paid, with 27% of the procurement prices more than twice the international prices for national procurement.
3.2. Procurement tendering and governanceKey finding: Recent reports, and interviews in this evaluation, acknowledge the persistence of difficulties in procurement governance, with processes that still do not guarantee transparency and avoidance of conflict of interest. Current reforms are aiming to strengthen NDOH in-house systems for procurement and tendering, although there remains a mix of opinions as to whether out-sourcing procurement would be of benefit. Some developments are evident in the current
Page 19 of 81
Year One Evaluation Report Medical Supply Reform Impact Evaluation
tender for 2014 kits, introducing greater international competition and more stringent quality requirements, however the implementation of some of these improved procedures remains weak.
3.2.1. Internal governance of medical supplies procurement
A number of assessments and reviews pointed out significant problems persisting in PNG in procurement (flowing through to supply chain, as noted below) of medicines and medical commodities. Reforms have been put in place to strengthen the current system rather than to instil new procurement structures (or seek outsourced third or fourth party logistics solutions13). Among interviewees, including some government interlocutors, opinion was divided. Some strongly supported the notion of strengthening in house systems on the rationale of sustainability, while others – including a previous Minister of Health and HIV/AIDS - supported an independent Health Procurement Authority (HPA)14 tasked to manage the procurement and distribution of medicines and medical supplies.
The Government of PNG has examined a cabinet submission in 2013 to establish an independent HPA. This is currently being consulted with central agencies prior to submission to the Central Agencies Coordinating Committee (CACC) and National Executive Council (NEC) for endorsement. Other options, including appointment of a procurement agent, especially if using international competitive means, could provide increased governance and transparency in support of internal procurement systems, particularly to resist undue pressures from individual medical suppliers. Agencies such as the World Bank were reported to support outsourcing of all procurement and supply chain functions to a quality operator that can be managed through a set of performance indicators. If the government so wishes, such contracts could include capacity building and institutionalization, which in other countries has led to privatisation of these functions.
Current developments include reinstatement of a Pharmaceutical Supply and Tenders Board (PSTB) that was abolished in 2009. For this reinstatement to be functional, an extension of their procurement delegation, such as to PGK 5 million, is sought. At present, procurement greater than PGK 300,000 and up to PGK 10 million are handled by the Central Supply and Tenders Board (CSTB), a central government agency beyond the health sector. Information available to this evaluation suggests that it is not yet clear that there has been sufficient change in proposed PSTB structures and procedures to avoid recurrence of earlier problems, which historically were cited as including collusion, inefficiency and lack of transparency. It is currently unclear how a PSTB would work alongside a CSTB to improve procurement practices.
One critical issue is representation on either the PSTB or CSTB. The Auditor General noted that the former PSTB membership required review due to inappropriate representation, which limited accountability. Interviewees, and document review, reported that both the NDOH evaluation team and the CSTB tender evaluation team are reported to lack broader participation that is common in other settings, such as academics, health professionals, senior staff from other Government
13 While a third party is in charge of a specific function (i.e. procurement, distribution etc…), a 4 th party logistics (4PL) provider is in charge of the whole management system as it acts as an integrator.14 This concept differs from current arrangements through separating procurement and distribution from other health care service delivery responsibilities. One successful international example, from India, is the Tamil Nadu Medical Services Corporation Ltd. (TNMSC), set up in 1994 to ensure availability of all essential drugs and medicines in Indian Government Medical Institutions throughout the State by adopting a streamlined procedure for their procurement, storage and distribution. Their services include life-cycle maintenance of medical equipment, as well as quality assurance for medicines. TNMSC provides technical assistance to countries who would like to establish a similar arrangement.
Page 20 of 81

Year One Evaluation Report Medical Supply Reform Impact Evaluation
departments and others holding relevant positions in the public and private sectors. A number of written and verbal reports suggested current structures favour local suppliers without ensuring appropriate guarantees on value for money, quality or appropriateness of supply.
Such developments and potential gains, at the time of the evaluation, remain hypothetical, and the actual implementation of these changes is yet to be seen. An updated draft National Medicines Policy, July 2013[4], did become available at the end of this evaluation period, which describes helpful intended developments, however it lacks a detailed implementation plan to support the medical supplies reform planning mentioned above.
Importantly, it seems at present that despite a large number of procurement process assessments over the past decade, including of the CSTB and individual sectors, there is still no consistent whole-of-government commitment to implement agreed reforms for accountability and transparency.
3.2.2. Medical Supply kit tender process in 2013
The Australian Government funded the procurement and distribution of 100% kits in 2012-13 as a short-term measure to address critical shortage and quality of rural health medical supplies. In mid-2013, the NDOH opened an international multi-year tender for procurement of 2014-16 medical supply kits. They will fund the procurement, with the Australian Government to fund the distribution of kits over 2014-2016 subject to an international competitive, transparent and fair tender process and awarding the contract to a quality-assured supplier. The conduct of this tender , preceding some of the planned changes noted above, is a significant development in tendering practice for PNG. This tender represented a new approach to international competitive tendering, with conditions specifying the need for quality-assurance standards to be met by tenderers. Some extensions of time and changes to conditions were observed during the tender process, including the waiving of quality certification requirements. Bids were opened in late June, with bid prices displayed in accordance with current practice, showing a wide range across six international and local suppliers, with some at the lower range coming from quality-assured suppliers. As at end of July (completion of this evaluation data collection) the process has not been finalized, however the outcome will help define viable routes for future development and should be included in future evaluations.
This experience demonstrates the difficulties any new procurement governance in PNG will need to address, especially if principles of support to local agencies and quality assurance remain in direct conflict. One avenue to support quality principles may be through broader participation in tender evaluations, as discussed above. Closer collaboration with CSTB at earlier stages in tender evaluation may also support more streamlined and effective assessments. However, a larger issue reported by a number of informants, is the degree to which political or other considerations mean central procurement authorities, such as CSTB, take a position that conflicts with health sector recommendations. Progress on this seems to rest on the need for whole-of-government commitment to procurement reforms, as noted above.
3.3. Quality control and regulationKey finding: Standard Treatment Guidelines are generally up-to-date, relevant and available, however the recently revised national essential medicines catalogue/list remains large and complex, and attempts to prioritise vital and essential medicines within it are not yet operational. In-country quality testing is not yet functional, despite recent investment. There is some evidence of poor quality medicines distributed through the ‘pull’ system, for example discoloration or crumbling (which may result from poor handling in supply chains as much as poor quality at manufacture). However fewer concerns were seen in the 100% kits, whose contents were perceived as higher quality by health workers and community members. There
Page 21 of 81

Year One Evaluation Report Medical Supply Reform Impact Evaluation
was some recognition of the fact that 100% kit medicines are procured from a quality-assured supplier, whose spot-checking and other quality assurance mechanisms were verified in this evaluation.
3.3.1. Standard Treatment Guidelines and Essential Medicines designations
Standard Treatment Guidelines (STG) in key areas of adult, child and reproductive health are updated by specialist professional societies, sometimes with external assistance, on a regular basis. The most recent significant change to national treatment policy, for malaria, was well-distributed across health facilities and well-recognised by health staff (described further under rational use of medicines below). Most facilities (85%) had a copy of the Adult STG, although only 43% had the latest 2012 edition, and overall 58% of facilities had copies of all the surveyed STGs and essential medicines list of which 58% were the latest editions. Availability of STGs was comparable to regional norms[5] seen in WHO studies. Annex 11.2 contains complete data on STG availability.
The recently updated 2012 Medical and Dental Catalogue (PNG’s equivalent of an Essential Medicines List (EML)) have only been recently disseminated – it was available in 38% of surveyed facilities and fewer (27%) had a copy of PNG’s National Formulary. PNG’s EML contains 900 medicines and a total of 4500 items. By comparison, the WHO Model Essential Drug List (2011) has approximately 445 items, and the Tamil Nadu Medical Services in India, which runs a successful supply chain has around 450 items, and globally in 2007, there were a median of 397 medicines on EMLs. The current EML seems unsustainable in relation to procurement and storage, and its large size may work against promoting rational medicine use. Examination of the EML shows multiple strengths and formulations for the same medicine. The EML also shows very expensive and clinically complex items such as peritoneal dialysis fluids and cancer chemotherapeutic agents - medical supplies unlikely to be used by the majority of the population and that have a high cost. A recent study by a UPNG student found peritoneal dialysis fluids represented the largest proportion of expired IV fluids among three large Area Medical Stores. Some items in the EML have no clear specifications for easy procurement (e.g.: “Scabies/Head Lice Lotion” 1%) and some seem unnecessary (e.g.: Vitamin C 50mg tablets).
As part of reforms, a sub-committee of the Pharmaceutical Advisory Committee (in consultation with WHO and other technical assistance) is in the process of defining and assessing “Vital and Essential medical supplies” to ensure continuous availability and quality of this subset medical supplies. It is expected that the 2014 procurement will be based on this outcome – adding focus to future procurement if this does take place, something that should be assessed as part of continuing evaluation.
Central regulation also impacts usage of medicines, with concerns raised around the need for the supply of medicines to be matched to the level of health facility and to the prescribing and dispensing level of the health worker. Qualitative data from health manager consultations (both provincial and district informants) suggested that the recent changes in the categories of medicines in the 2012 Medical/Dental catalogue and the corresponding changes in the list of items that can be ordered have restricted the number of ‘category A’ (medicines allowed to be used by all workers) Aid Posts can order, even though some APs have adequate skills to administer these medicines. Our survey found that despite APs being supplied only authorised medicines in the ‘push’ system kits, other medicines were available to them through the ‘pull’ system and informal transfers between HFs. Some examples detected at APs in our survey included some injectable medicines that AP staff were theoretically not intended to administer, such as chloramphenicol injection, found in 61% of APs, as well as Oxytocin 28%, Saline infusion 17%, Ampicillin 14%, magnesium sulphate 9%, and gentamicin 8%. Supply of medicines that they were not authorised to use was also mentioned as a problem by a small number of HF staff, both HC and AP, during field survey interviews, but a greater
Page 22 of 81
Year One Evaluation Report Medical Supply Reform Impact Evaluation
proportion of HF staff reported managing this by returning supplies to hospitals or medical stores, and many staff simply made use of all medicines that they felt were needed and within their actual competence.
District and provincial health managers also reported not being consulted during the review for the 2012 catalogue. Other managers had different concerns when reporting that category C or D medicines such as morphine and ketamine were being made available at the HC or AP level, which was in conflict with current prescribing guidelines. No category C or D were supplied in the AP kits, but limited category C (diazepam and morphine) were supplied in the HC kits, on the rationale that they could be authorised by medical officers remotely by telephone or radio. Our field survey found that, such medicines were often returned to higher levels; we did not find any specific examples of abuse related to this aspect of the ‘push’ distribution. Category C or D medicines could also migrate to HCs through the ‘pull’ system or informal transfers.
Within the vertical program for malaria, qualitative data suggest there is a very strong link made in training between use of new treatment (ACT) and a positive rapid diagnostic test (RDT) – important for correct treatment and minimization of medicine resistance – however RDTs were reported to be limited in distribution to HC level, restricting the malaria treatment options at APs. As reported below this had some consequences in inappropriate management of fever, when RDT was negative, with older anti-malarials.
3.3.2. Quality of medicines observed and perceived
There have been recent reports of poor quality medical supplies[6] through both supplier problems as well as storage deficiencies. The HF survey also attempted to assess this (see Annex 11.2). Surveyors were asked to inspect medicines from open containers at HFs and comment on their quality – both of the medicine and the packaging. Overall instances of poorer quality medicines were more often reported among non-kit medicines compared to medicines from the 100% kits (26% vs. 11%). Quality of medicines is also affected by deficiencies in storage and handling at various levels, discussed in section 6 below.
Table 2: Proportion (%) reporting YES to medicine quality questions (N=95)100% kit medicines Non-100% kit medicines
TOTALHosp HC/SC APTotal(kit) Hosp HC/SC AP
Total(non-kit)
Medicines discoloured? 15% 8% 11% 11% 31% 23% 42% 32% 22%
Medicines broken/crumbled? 8% 21% 9% 14% 23% 30% 25% 26% 20%
Containers broken/cracked? 8% 5% 4% 5% 15% 13% 17% 15% 10%
TOTAL (median) 8% 8% 9% 11% 23% 23% 25% 26% 20%
Note: differences between hospital and other levels were not regarded as significant, in our sample.
Qualitative data from health facilities suggested that kit medicines, supplied by the Australian Government’s pharmaceutical supplier, IDA, were perceived as higher quality, a perception generated in part through the consistent packaging and labelling required of this procurement, backed up by quality assurance conditions. Some facilities reported changing treatment practices to ensure sicker patients received medicines from the Australian Government’s pharmaceutical supply contractors, or that these medicines were dispensed prior to their alternatives. Overall in our survey only 63.6% of medicines at HFs were from the Australian Government’s pharmaceutical supply contractors, suggesting at the time of the survey, these medicines had been replaced with those
Page 23 of 81

Year One Evaluation Report Medical Supply Reform Impact Evaluation
from the AMS via the pull system in many facilities. A few participants from health manager consultations spoke of the quality of medicines and the need for certified suppliers to ensure good quality control. More details can be found in Annex 11.4.
Previous studies[6] found some substandard medicines manufactured by the North China Pharmaceutical Corporation (NCPC), and the health facility survey noted many NCPC medicines continuing to circulate in PNG, in both ‘pull’ and ‘push’ systems; this highlights the need for further study and regular vigilance to review the quality assurances provided by this company in particular, and all manufacturers in general. Among stocks held at the medical stores, 6 out of the 10 available tracer medicines measured (60%) were manufactured by NCPC. Our evaluation did not however have capacity to undertake formal testing of quality and potency of medicines. The Australian Government’s pharmaceutical supply contractor noted that they have only approved two types of medicine from this supplier (powder for injection of beta-lactams and cephalosporins), from among the wide range of products NCPC produces at its many manufacturing sites. The Australian Government’s pharmaceutical supply contractor noted that the NCPC products it supplies to the 100% kits (Ampicillin injection and Benzathine penicillin injection) have been checked and approved by their internal quality assurance processes (see Section 3.4.1). Their approval does not extend to the many other NCPC pharmaceuticals in circulation.
3.3.3. Quality testing capacity
Formal laboratory quality testing of medicines is very possible in PNG but has not been actively pursued. The Pharmaceutical Standards Board performs a small number of inspections of the private sector pharmacy with a small annual budget of ~75,000K. There is currently no inspection related to the quality testing of pharmaceuticals and no sampling methodology has been drafted for either the public or private sector. A GPHF-Minilab was previously procured for NDOH for simple medicine testing but has never been actively used and is not now operational. A MOU has been signed with the Therapeutic Goods Administration (TGA) to assist with medicine quality assurance (QA) however the costs are high.
Currently two sophisticated high performance liquid chromatography machines are being procured however staff training has not yet been undertaken, and the facilitating agreement between the School of Pharmacy at UPNG and NDOH remains incomplete. Presently there is no staff to undertake regular quality testing, although a scientific officer position to undertake this role has recently been re-advertised. A WHO Medicine Quality project has recently completed sampling of a range of medicines for testing at the University of Newcastle, however these samples were taken from AMS Badili and not from subnational sites.
The current July 2013 draft of the National Medicines Policy (NMP) has a substantial components related to “regulations and quality assurance” including pre- and post-marketing surveillance of registered medicines, enforcement of good storage and distribution practices and “quality control” measures, including “ a continuous program of sampling and testing of selected medicinal products marketed in the country”. However, to date only one small sample had been sent through NDOH to an international laboratory for testing. The majority of medicine testing remains the province of external studies, rather than a routine local capacity within PNG.
3.3.4. Quality review of IDA, the 100% HC and AP kits supplier
In the absence of in-country testing, the strongest approach to quality is to require compliance with international quality standards on the part of suppliers and the pharmaceutical manufacturers they procure from, with the 100% kits supply representing the most recent comprehensive example of this.
Page 24 of 81

Year One Evaluation Report Medical Supply Reform Impact Evaluation
IDA, the Australian Government’s pharmaceutical supply contractor, was also reviewed for quality assurance procedures, confirming that they have a comprehensive system for this that includes procedures from the manufacturer through to delivery. This includes a program, where needed of Good Manufacturing Practice audits at manufacturer’s sites, inspection of production lines, later evaluation and approval of batches of production, with occasional verification audits supplemented by chemical testing or visual inspection as needed.
Page 25 of 81
Year One Evaluation Report Medical Supply Reform Impact Evaluation
4. Findings: supply chain systems4.1. National planning and governance of distribution within PNG
Key finding: National planning and governance of the supply chain within PNG in the ‘pull’ system is hampered by similar difficulties as for national procurement, with problems relating to inadequate information on performance, as well as transparency and accountability. District and provincial health manager opinions on the value of the ‘pull’ system’s out-sourcing of distribution are mixed, however commitment to out-sourcing, but with much stronger contract management, seems on balance to remain the appropriate option. The introduction of a new eLMIS, mSupply, is one of the most critical investments for medical supplies management and has the potential to meet a crucial information need essential to development; our findings support its extension to AMSs with good uptake capacity, and to a provincial pilot that can assess its contribution to HF-AMS communications.
4.1.1. National oversight of supply chain and medical stores
As noted above the restructured Medical Supplies Procurement and Distribution (MSPD) branch has developed a Medical Supplies Reform plan, including a new Medical Supplies Management Committee, aiming to improve many aspects of the supply chain within PNG. The system is being reorganised into three main area medical stores (AMS: Badili15, Mt Hagen, Lae), managed by NDOH for storage of essential medicines and supplies, and subsequent distribution within provinces. Each AMS can receive supplies directly from international suppliers, coordinated by NDOH. AMS generally receive major shipments every six months, with additional emergency procurements common, as noted in sections above. Within provinces, supplies are to be distributed based on bimonthly orders, directly to health facilities or in some cases to Provincial Transit Stores (PTS), all of which are under provincial health agency (either PHO or PHA) management. PTS aim to be short-term holding points, although some PTS are performing similar functions to an AMS (one example being Rabaul PTS, at Kokopo). PTS have the potential to act as medical supply hubs with information and supervision functions as well as simply hold and transfer shipments, but only with appropriate staffing, such as provincial pharmacists, and other support.
The MSPD is setting new targets for the supply chain, for example aiming for stock availability levels in AMS of more than 90% for vital and essential medicines and fulfilment times for orders of 14 days from order placement. As discussed in section 4.3 below, our measurements of current performance suggest a mean availability at AMS of 73% (median = 88%) for 12 essential medicines 16 and order processing times that range from 11 to 86 days.
Expanding national costs also place pressure on central management of all supply chains. Estimated transport costs sometimes increase significantly during implementation, and some contractors noted that their limited knowledge of local conditions in difficult and remote locations made estimates difficult and led to unanticipated costs. Competition by resource extraction enterprises, especially on Highlands roads, has considerably increased transport costs. Protocal, the Highlands contractor for the ‘push’ systems 100% kits, reported that over five years, the road transport cost of a 20 foot container from Lae to Mt Hagen increasing from 4,000 to 8,000 PDK and is now between 12,000 and 16,000 PGK.
Our findings on medicines availability (see Section 5), noting lower availability of medicines supplied solely through the ‘pull’ system, provide a quantitative benchmark for measuring future progress in central oversight of the supply chain (as well as in stores functioning as discussed later in this section).
15 Which despite being based in Port Moresby is to act as a regional, rather than national, store.16 Only 12 of the 16 tracer medicines in our survey were expected to be stocked at an AMS.
Page 26 of 81

Year One Evaluation Report Medical Supply Reform Impact Evaluation
Our qualitative findings include many comments from HF staff and provincial/district health managers regarding weaknesses in supplies distribution systems through the ‘pull’ system – many of which related to sub-national practices within provinces that are discussed in later sections. Those opinions that relate specifically to central supply chain governance include an opinion by a few respondents that the ‘old’ system of funding stores and facilities to carry out transportation themselves should be reinstated, however most opinions, and other evidence in this evaluation, suggests that better gains may be achieved by continuing third-party contractors but with far stronger contract management. Many managers commented that an important current constraint was that central arrangements do not seem to require transport agents to formally co-ordinate with provincial or district health managers – a deficiency that is blamed, in part, on long delivery times, failed deliveries to the wrong address, and close-to-expired medicines being delivered. It should be noted that for the ‘push’ system, CKP managed contractors are supposed to formally coordinate with provincial health managers, although this is not reflected in the qualitative findings from managers.
Similarly, there were many comments from health managers seeking stronger accountability requirements by NDOH, both in disciplining staff who fail to ensure good supply chain practice, and of contractors who fail to provide satisfactory service, as example:
“How the contractors have been paid is questionable. Agencies responsible should aggressively manage their contractors.”
Additional quantitative detail is in Annex 11.2 and qualitative detail in Annex 11.4.
4.1.2. Contracting of logistics and transportation
A major shift in the national supply chain of the government ‘pull’ system has been the outsourcing of medicines distribution to commercial transport companies – most recently to the firm LD Logistics, which is tasked with delivering all NDOH medicines from AMS to health centre and sub centre levels (but not to APs). National consultations and field observations suggest that some vertical program medicines, specifically those for malaria and tuberculosis have been excluded from this arrangement, although the formal contract does not specify this exclusion. Another vertical program providing HIV medicines has a separate logistics agreement with TNT for all their distribution needs. And, as discussed more fully below, the 40% and 100% kits programs have used distribution approaches, again with commercial logistics companies that work independently of the government AMS ‘pull’ system. These agreements replace earlier programs (prior to 2010) whereby distribution was the responsibility of stores and facilities that needed to use their own, often limited, transport arrangements.
Some reports in national consultations suggest, similarly to procurement findings, that implementation of proposed improvements for transparency and more stringent contracting of logistics suppliers remains incomplete. Some aspects of the LD Logistics contracting seem irregular. For example, some interviews and document review suggested that: the desire for prompt payment to suppliers should over-ride the time that might be required for verification of charges by AMS; there is no need for detailed performance measures in terms of delivery coverage and timing (although the contract does include performance measures in relation to complaints); contractual arrangements have been extended in time without formal renegotiation or re-documentation; and there is wide variation in the costing of individual elements without clear criteria for estimating these costs.
Findings during interviews also implied that the anecdotal reports of poor delivery performance (some discussed later in this section) may not be fully considered in their relevance to future supply chain tendering decisions. These, and other reports, suggest weak implementation of procedures and structures that could increase the likelihood that future logistics contracting arrangements are transparent, commercially competitive and performance-based. Qualitative data from managers,
Page 27 of 81

Year One Evaluation Report Medical Supply Reform Impact Evaluation
including stores managers, confirmed this concern. Several suggested that more nuanced contracting, including a combination of a national contract matched with a variety of local distribution contracts managed through regional AMS or provincial health agencies, may give better outcomes.
Contracting for ‘push’ system 100% kits have so far been handled independently, through Australian Aid. Inspection of contract information, visit to IDA, and correlation with other evaluation data confirm international delivery from origin either directly to PNG ports (full container loads from India and China) or consolidated in an ISO certified warehouse in Singapore and shipped to named PNG ports. Transport suppliers were tasked with delivering kits to hospitals, health centres and aid posts on a regular basis, through logistics companies managed by the agent Charles Kendall and Partners (CKP -the management contractor for inland transport and distribution). Sub-national distribution as part of this aspect of the supply chain is discussed further below.
4.1.3. Logistics Management Information Systems – mSupply
Steps have been taken to introduce the computerized LMIS, mSupply, to MSPD in NDOH and one AMS, in Badili. This is to replace the out-dated Foxpro system which has not been fully operational for a couple of years. It is expected that mSupply will provide a broad range of functionality including procurement, warehousing and inventory management, logistics and distribution of medical supplies – the system’s capacity has been demonstrated in other countries in the Pacific and elsewhere that face similar challenges to PNG. As such, this would be one of PNG’s most critical investments for medical supplies management, which has the potential to meet a crucial information need essential to addressing gaps in many parts of the medical supplies system.
Technical problems such as communications connectivity need to be resolved prior to implementation, as the technical infrastructure needs to be set up in conjunction with the NDOH information technology branch. It is planned that after Badili AMs is operational that Mt Hagen and Lae AMS will follow suit before it is rolled out nationally. The evaluation team shared concerns that some of the underlying issues with record keeping, human resource capacity and communications observed at Badili (documented elsewhere in this report) may militate against an effective pilot of this system. Qualitative observations during this evaluation suggest that there is significant potential in terms of interest, human resources, and current familiarity with computerized stock management in other AMSs – Lae and Mt Hagen – and a number of hospitals, including Port Moresby General as well as some provincial and rural hospitals visited during the HF survey. Consideration of more rapid inclusion of these facilities in the mSupply pilot may enable successful demonstration in some sites (even if Badili upgrading takes longer than planned).
Inclusion of hospitals or other HFs in a pilot could more rapidly demonstrate the potential of more timely and reliable HF-to-AMS communications. For future application, it is noted that mSupply has mobile phone SMS communication capacity, that it has demonstrated the use of tablet computers accessing mobile internet in the Solomon Islands, and that within PNG the ADB-managed Rural Primary Health Service Delivery Project is testing the role of mobile phones in various health applications.
4.2. Warehousing and medical store stock managementKey finding: AMS stocks of essential medicines, measured in this evaluation at 73%, is closer to the NDOH target (90%) than other recent estimates, although there are still critical shortages. AMS processes show many areas for potential improvement, especially at Badili, and planned refurbishments should be rolled out as soon as possible, to all stores.
Page 28 of 81
Year One Evaluation Report Medical Supply Reform Impact Evaluation
4.2.1. Medical store stock levels
In September 2012 [2] consolidated stock reports of four AMS indicated availability of medicines at 44% (based on a stock-out rate of 56%, with stock-outs defined as less than one month stock on hand based on the average monthly issues from MSPD). Another indicator of availability in this report, buffer stock, measured that 71% of the medicines assessed had less than three months cover (with the target being more than six months) and that 36% of these had an outstanding purchase order with MSPD.
The stock availability at medical stores was also measured in our survey. The overall average availability across the eight medical stores was 61% but was 73% when considering just AMS. This is lower than WHO regional norms 2004 report[7] which had an average >80% for basket of essential medicines at public sector warehouses - although the WHO data mainly related to African countries rather than pacific countries. The average availability at AMSs, at 73%, is higher than that predicted in by the stock-out rates from 2012 assessments note above. The table below gives an overview across four AMS17 and four PTS, in terms of warehouse stock availability among the medicines we surveyed.
Table 3: Availability of Stocks at Area Medical Store or Provincial Transit StoreHigh availability
(available in > 75% AMSs)Low-Medium availability(available in <50% AMSs)
No availability
Amoxicillin capsules Cotrimoxazole tablets Fe/folic tablets ORS powder Saline injection Oxytocin injection Medroxyprogesterone injection Gentamicin injection
Chloramphenicol injection
Magnesium sulphate injection
ACT
Ampicillin injection Artesunate suppository Misoprostol tablet* Zinc tablets Vitamin A
*should be available
It should be noted that three of the medicines listed as not available at AMSs (ampicillin, vitamin A and zinc) are not normally procured through NDOH but were assessed in our survey because they are contained in the 100% kits. ACT availability at AMS/PTS varies by province and estimations of malaria burden. Annex 11.2 (at section 11.2.5) provides a detailed breakdown of stock levels across the four AMS and four PTS that we surveyed.
4.2.2. AMS storage and stock management
Overall storage conditions at medical store were inadequate, with only 53% having proper storage conditions. Storage was better at AMSs compared to PTSs in relation to controlling the ambient internal temperature and having a systematic means of organising and managing the stocks e.g. FEFO. Although most medical stores had a refrigerator only 25% monitored the temperature.
Hygiene storage needed improving with only 13% of warehouses storing all medicines off the floor and only 25% that were pest free. Only 13% of the eight medical stores surveyed place all their medicines on pallets, 50% managed medicines using first-expiry-first-out method and 38% stored medicines separately from non-medicinal products (e.g. chemicals). In many stores, these practices were a side effect of having inadequate storage space for efficient storage and workflow for receipt,
17 Although there are only three AMS in the reorganized system, Rabaul PTS, when surveyed, was still functioning as an AMS and so was assessed in that category of store.
Page 29 of 81
Year One Evaluation Report Medical Supply Reform Impact Evaluation
processing and delivery of supplies. Additional detail of survey findings on storage and handling in medical stores is in Annex 11.2, Section 11.2.13.
Several informants mentioned the potential benefits of greater flexibility in funds allocation. Badili AMS has been prioritized, however it is clear in this evaluation that all three AMS need refurbishment, and that both Lae and Mt Hagen are well placed to absorb this support. AMS Lae had been preparing for this refurbishment, having begun negotiations for renting a warehouse in the ‘Malahang’ area to store the supplies during refurbishment. Current refurbishment plans for three AMSs will not see them fully functional until the end of 2014 and without inventory control from the eLMIS until after these refurbishment are complete (although purchasing and receipting functionalities will be working at this time).
It is true that, after a comprehensive assessment in Badili, it is obvious that more support will be needed, greater detail is available in the Warehouse and Logistics Advisor exit report (July 2013). This report recommends both infrastructure and functional development at Badili, noting that:
‘the current organizational structure of the Badili AMS does not reflect the basic functions performed within a warehouse, e.g. receiving, dispatch and inventory control’ and …’the existing inventory control system is effectively non-functional. Stock balances are incorrect and most issue and receipt transactions go unrecorded. Any inventory usage information able to be obtained from this system is virtually useless’.
Other stores, including other AMSs visited, also noted problems at Badili AMS: citing lack of capacity, cooperation and communication that means, in effect, that inter-store transfers of supplies to meet exceptional needs, cannot normally include Badili. Another functional deficiency noted at this AMS was the absence of forward planning to anticipate surges or drops of demand, resulting in a frequent use of emergency ordering from the NDOH (as discussed above) to maintain stock levels. This evaluation visit found no functional stock records were found in Badili AMS, and difficulties in paper or computer systems for this function in other AMS – indicative of the absence of a culture of using stock-cards, or similar tools to routinely monitor stock controls, with the exception of some vertical program stock managers whose supplies are physically held in an AMS. AMS managers do report spot physical counts being done, and the triggering of emergency supply requests when orders are unable to be filled due to no stock being present.
Dysfunctional stock monitoring, matched with difficulties in quantification in national procurement is likely to lead to wastage. In the past there have been reports of significant amounts of expired medicines held at AMS, for example an informal study by a pharmacist who estimated the total value of expired items to be 2.2, 1.6 and 0.9 million PGK respectively in Badili, Lae and Hagen AMS during 2010. Qualitative data reported AMS Lae as receiving expired stock from Hagen, Madang and Wewak AMS for disposal. Currently AMS Lae is seeking to dispose of 24 pallets of waste, which will be by burning in a pit by alternating layers of medicines and tyres in a public disposal area. In our survey (see details in Annex 11.2) we found 11% of stock measured in the survey in PTS was expired (noting in two PTS, some or all of the ORS held was due to expire in two months), but found no expired stock in AMS. Our survey coincided with annual stock-takes being done in all AMSs, so expired medicines may have been removed from shelves shortly before the survey.
A table of observed practices in all eight stores visited is provided in Annex 11.2, Section 11.2.14, along with a consolidated list of the qualitative findings on AMS managers’ views on areas for improvement in medical supplies management (much of which is incorporated at various points in the main section of this evaluation report).
Page 30 of 81
Year One Evaluation Report Medical Supply Reform Impact Evaluation
4.3. Distribution practices and communications, in ‘pull’ and ‘push’ systemsKey finding: There were frequent reports of failed delivery in the ‘pull’ systems between AMS and HF, especially to remote facilities, although records to quantify this are lacking. AMS order processing and timeliness of delivery in the ‘pull’ system also received criticism from managers and HF staff, especially at Badili AMS, and our evaluation measured some baselines in relation to this. In the ‘push’ system delivery data (more accessible but still incomplete) suggest high compliance and quality of transport for kits distribution; although there were some reports of failed supply, these seemed to be traceable and uncommon. Availability data suggests the kits’ ‘push’ system has been more effective in reaching the most peripheral facilities, particularly APs. Some reported instances of poor communication between kit delivery contractors and provincial/district health managers point to the need for integrated and more consultative planning in future ‘push’ system distribution. Improved communication and data flow, particularly through the new eLMIS, has the potential to support development in both ‘pull’ and ‘push’ systems.
The measurements of availability of essential medicines (Section 5) in this evaluation provide a benchmark against which future changes in the supply chain can be measured, both for ‘pull’ and for ‘push’ systems. Additional process measures and qualitative data, presented in the sections below, provide assessments of the functioning of the standard government ‘pull’ system, the 100% kits ‘push’ system, and some of the vertical programs that vary in the many by which they are distributed.
4.3.1. Distribution and communications within the ‘pull’ system
Some managers interviewed reported satisfaction with their communications with AMS and receipt of supplies through LD Logistics provided transport. However many informants at all levels noted continuing problems in the distribution through the ‘pull’ system, with qualitative findings including lengthy waiting periods after ordering medicines from the AMS (in some cases up to 18 months); packages delivered to the wrong addresses; inadequate communication; damaged supplies being delivered; and a general distrust for the efficacy of the entire medical supply system. These seem to relate to problems in the processing of orders, and in delays in dispatch and transportation.
A number of problems with ordering were observed and reported in interviews. HFs often do not receive all items requested in their bimonthly order. During the evaluation team’s visit to Badili AMS an analysis of random orders found that the order fulfilment rate was on average 63%, and qualitative reports from HFs suggest this is representative. Over years this has generated a culture whereby HFs exaggerate their needs in bimonthly orders, to the point that AMS staff justify partial fulfilment on the basis that orders are unrealistic. Outstanding items are not kept as a back order in the AMS; simply two months later if the item is still required the facility orders it again.
Long order processing times for orders were frequently reported. For this evaluation ten order forms received from HFs at medical stores in Lae, Mt Hagen, Rabaul and Buka were screened, and 18 in Badili AMS. The time to process an order was calculated as the number of days between the date the order was written and the closest record of a dispatch time. The table below notes the median processing team in each store, noting Badili took over four times as long as other stores.
Table 4: Median time (days) to process an orderArea Medical Store Provincial Transit StoreBadili Lae Hagen Rabaul18 Buka19
86 26 11 24 7
18 Located in Kokopo, but still called Rabaul AMS. 19 Buka PTS is processing orders unlike other PTSs
Page 31 of 81

Year One Evaluation Report Medical Supply Reform Impact Evaluation
There were mixed reports regarding transportation within the ‘pull’ system by LD Logistics, who were reported to sub-contract most of the actual delivery to local freight companies. A number of managers reported satisfaction with delivery but there were also many reports of failed delivery, or of shipments being left in inappropriate sites where they were exposed to degradation or theft. As well as reports in interviews and discussions, the evaluation team was presented with a number of written complaints regarding non-delivery. Some examples are provided here, noting that the wording of many of these is indicative of a high level of frustration:
One church health secretary writes: “our drug order two months ago is still sitting in the LD Logistics office in Mt Hagen waiting to be dispatched and we had a second order sitting in the AMS. All this drugs are sitting in Hagen waiting for dispatchment while our people I Karamui/Nomani district are dying.”
Sandaun Provincial administration wrote in May 2013 regarding ongoing poor and inconsistent deliveries by LD Logistics of essential and TB medicines, citing risks of treatment interruption, noting that deliveries expected in March arrived in May and that medicines that arrived at Badili AMS in February for air freight were instead sent by sea.
A UNICEF vaccine shipment that remained un-shipped so close to vaccination campaign deadlines that the program needed to recover the supplies and freight them themselves.
Difficulties in replacement orders, for example reported by Mt Hagen AMS, when facilities complaining of missing shipments place a new order, which the AMS is unable to replenish because original goods are still in transit.
Transit practices that disadvantage more remote air-access sites. Long transit times negatively affect facilities’ commodity access given that an AMS is unable to send an additional shipment if there is one on record as being on transit. One extreme example is represented by a consignment to Bomai in the Chimbu province, of an order placed in July 2012, collected from the AMS by LD Logistics in August but not received until June 2013, a transit time of 10 months. The reason given was that LD Logistics waited on other loads to consolidate shipments making it more cost efficient.
HFs attempted to overcome this with a variety of trouble-shooting – using phone calls or visits to AMS to attempt to track their orders. Badili AMS was frequently reported as unresponsive to such calls, while some informants noted that NDOH contacts in MSPD often did help solve delivery problems on behalf of either HFs or AMS. Many health managers reported having to send their staff to an AMS (most often Badili) to retrieve their own supplies, and there were occasional reports of AMS staff request funds from a provincial health office before distributing supplies. The AMS in Lae monitored through a weekly check on stocks held at LD Logistics. Records from an audit in May 2013 showed stock being held at the LD Logistics office for between 2 to 39 days (excluding weekends). Calls are made to HFs to validate if orders have indeed been received, triggered by discrepancies between date of receipt and date of dispatch and if the person signing for the goods at the HF are not the officer in charge.
Health managers raised many issues with communication in the distribution process. It was generally noted that there was a lack of communication between the AMS, LD Logistics and the health facility as to when the health facility’s order was going to arrive with the pull system of ordering and distribution. Provincial staff reported often trying to communicate to find out delivery schedules. In the Warehouse and Logistics Advisor Exit Report (July 2013), it mentioned that LD Logistics does not provide regular shipping schedules that would assist AMS Badili in coordinating the picking and packing of consignments (the contractor uses multiple shipping agents). A number of health managers cited the core of the problem being the intermediary of a private contractor, which may be managing timing and routes in way that favours their own cost-efficiency over the need for timely delivery.
Page 32 of 81

Year One Evaluation Report Medical Supply Reform Impact Evaluation
One health manager stated (but without providing evidence) “There is no communication. Our bimonthly MSIVs have not been processed for one and a half years.” This level of frustration over inadequate communication was echoed many times in the qualitative data, for example:
“The Provincial Health Office (PHO) from the start must be part of the team, particularly in the distribution of drugs from the AMS to the PTS and then down to the health centres and aid post level. Currently the PHO is not part of the team and that is why medical supplies are still not reaching the aid post level.”
The absence of communication requirements, or their enforcement, in logistic contracting seems a serious hindrance to supplies. Future support from better logistics management information, especially if computerised and/or making use of new communications technologies, may be a key to improving information flow and enabling greater transparency within the ‘pull’ system supply chain.
4.3.2. ‘Push’ system contracting and organisation for the 100% kits
The 100% kits were the latest iteration of the ‘push’ system of emergency measures that have been deployed in PNG for more than ten years. Previous push systems were said to improve availability (though availability increases were not clearly measured) and the period from 2006 to 2010 when they were discontinued was reported as characterized by increased supply disruptions. The 100% kit contract was awarded as single source procurement (due to the need to urgently address acknowledged problems, including high rates of stock-out) to an international quality-assured pharmaceutical supplies contractor, which delivers directly to five ports: Port Moresby, Lae, Madang, Wewak (transhipment from Lae) and Rabaul. Earlier arrangements for delivery to Kimbe port were discontinued for round 2 of the kit distribution. Full container loads went directly from China and India to the PNG ports while the small volumes from Europe were consolidated in Singapore and shipped to PNG ports separately. Narcotics were shipped directly from the European supplier’s base though with frequent delays when import licenses, a responsibility of NDOH, were not available on time. As noted in Section 3 above, the international procurement contracting is assessed as providing good value supply of quality medicines, although difficulties in estimating required quantities has meant more medicines were purchased than have been used. As noted elsewhere in this report, the evaluation team view the benefits in increased availability achieved by the kits in the ‘push’ system as outweighing the additional costs related to over-supply.
Figure 1. Kit distribution flow
Arrangements for in-country distribution of the 100% kits differ from previous kit distribution (40% kit) experience where a sole contractor (Panamaseier) was used to distribute nationally. For the 100% kits Charles Kendall and Partners (CKP) were engaged to procure and manage logistic services from regional transport service operators. Over 20 organisations presented expressions of interest and preferred location of provision of distribution services. Four tenders were floated and three contractors engaged in the kit delivery: Protocal Investments (supplying Highlands), Loha Customs and Forwarding (Momase) and Post PNG (Southern and Islands). The contract conditions include performance management conditions not reflected in the ‘pull’ system contracting described above. Payment is contingent on successful delivery, verified by HF report and a photograph with a geo-
Page 33 of 81
International Supplier
(shipments from Europe, India, China
or Singapore)
PNG Port (POM, Lae, Madang, Wewak or Rabaul)
Health facility or aid post (via transport contractor
facilities)

Year One Evaluation Report Medical Supply Reform Impact Evaluation
location tag. Another distinction from ‘pull’ system contracting is that contract arrangements between CKP and the 100% kit transport contractors outline all transport costs per facility.
Although distribution is successfully reaching facilities (see below), the contract management is substantial (but not overly laborious in relation to the size of the task): monitoring deliveries, responding to sub-contractor issues, helping trouble-shoot transport problems and other daily demands. CKP currently allocates one international specialist and eight national staff (four part-time), insufficient for this type of operation, with the result that the Australian Government has had a much greater role in contract management and monitoring than planned, with routine interactions with the three contractors, a role that normally should belong to a management agent. This was exacerbated when in the early phase of 100% kit distribution; CPK managed the 40% kit distribution, but allocated oversight to a different staff member, with limited communications between the two programs. This lack of coordination resulted in some facilities receiving both the 40% and the 100% kit in quick succession. Communication and supervision would be greatly improved if CPK could allocate more human resources to adequately supervise and resolve day-to-day operational issues. A management agent, rather than a procurement agent, may have had greater management capacity to oversee sub-contracts and provide close monitoring.
Interviews with the three transport contractors highlighted some other organizational challenges, including:
Camera-based ‘geo-pics’ sometimes do not detect the correct location resulting in invoicing disputes, noting that a UPNG mapping expert agreed this can occur with incorrect camera use, underlining the importance of consistent equipment and adequate training;
Limited contractor contact with provincial and district health authorities (expanded below) can result in misunderstanding, with informants noting Protocal Investments has been more successful in advising provinces of the distribution schedule via radio announcements;
Transport costs that escalate with underestimation of the difficulty of terrain or roads; and Identification of closed facilities, either due to outmoded listings or temporary changes such
as tribal fighting.
There was general agreement that allocating responsibility by region, across three contractors with local strengths, was an effective way to apportion contracts and that the contract conditions, while onerous in monitoring, did help assure delivery. However some assessments suggest that distribution costs have the potential to be lower if contractors did not have strict regional contracts but are able to cross provincial boundaries to deliver to remote facilities close to the border. For instance, the contractor for East Sepik Province does not provide transport services to the HFs in the northern part of Western Province close to the East Sepik border.
Another potential efficiency gain relates to the timing of deliveries. While making four monthly deliveries to HC and six monthly to AP is a rational distribution method, in that it avoids storage problems at the HC that might occur with less frequent six monthly deliveries, and the higher costs of more frequent delivery to APs (given they are greater in number and more remote). It may be less cost effective because delivering a round solely to APs means transporters potentially carry out five deliveries in a year. Many aid posts are close to health centres, and if their delivery was combined with that to the health centre savings could be achieved. Revisions for 2014 could examine other options, such as integration of at least the first HC and AP rounds, which would reduce overall delivery frequency to some degree.
4.3.1. ‘Push’ system distribution and communication for the 100% kits
The ‘push’ system distribution of 100% kits aims to reach around 750 health centres every four months and 2000 aid posts every six months, through direct deliveries that supplement the ‘pull’
Page 34 of 81

Year One Evaluation Report Medical Supply Reform Impact Evaluation
system of AMS and PTS. As noted in Section 5 there is evidence that there has been effective penetration to rural facilities with a measurable increase in availability of essential medicines. There is some, but not large variation in availability of medicines supplemented by the 100% kits by region: Highlands had the greatest availability (76.3%), followed by Islands (71.3%), then Southern (64.9%), and finally Momase (63.2%) (Annex 11.2, Table A12) this variation is as likely to represent differing local conditions as much as contractor performance.
Contractor delivery database analysisThe evaluation attempted to measure overall delivery efficiency of the 100% kits and examined a number of contractor-supplied spread-sheets. Unfortunately the amount of missing data means a definitive calculation is not possible, although examination of delivery completion data available for two rounds of HC delivery is at least 83% and for the first round of AP delivery at least 55%, as at June 2013. The actual completion is likely to be higher and should be verifiable by reports to the Australian Government in late 2013. An extract from the delivery database20, covering only the first rounds of HC and AP 100% kits delivery (as the most complete) was analysed both quantitatively and qualitatively. The table below provides an overview of some of this delivery information. Here it can be seen, that where delivery data is known, 3% of HC deliveries and 12% of AP deliveries were recorded as ‘Failed’. In each case the delivery is recorded as having been redirected to a nearby HF or provincial store or, for APs, to a supervising HC. These match well with delivery completion rates for round one, derived from contractor information on remoteness (see Section 8) of 94% for HCs and 80% for APs21.
Table 5: Contractor delivery information (including HF staff comments) from first round of 100% kits HC AP
n % of deliveries n % of
deliveries
Total HFs listed in contractor database 739 2036
HFs for which first round delivery data was available(used as denominator) 615 1365
PHO Notified HF of planned delivery? (view of receiving staff)
Yes 259 42% 518 38%No 235 38% 506 37%Not recorded 121 20% 341 25%
Receiving staff comment
(‘Other comment’ category includes reason for a ‘Failed’ delivery)
Very satisfied 117 19% 276 20%Satisfied 267 43% 365 27%Dissatisfied 15 2% 15 1%Other comment 14 2% 343 25%No comment 202 33% 366 27%
Delivery recorded as ‘Failed’(due to HF closure, HF not found, or inaccessibility) 21 3% 166 12%
The qualitative data recorded as comments by receiving HF staff in this database have been used to expand and cross-check the qualitative findings obtained during our HF survey (see Annex 11.4). Overall, there is a very close match between both sources of HF staff opinion: staff expressed high
20 Consolidated spreadsheet as at of 10th May 2013. However the latest delivery date noted was the clearly impossible 13/12/2013, highlighting the data inconsistencies of this information; cleaning and re-coding was performed by the evaluation team to the extent possible.21 Remoteness report from CKP, dated 28th May 2013
Page 35 of 81

Year One Evaluation Report Medical Supply Reform Impact Evaluation
appreciation of the ‘push’ system, and noted that it often enabled services to continue by providing a crucial supplement to fill gaps in supply from the ‘pull’ system. This last comment was especially seen for APs. Comments coded as ‘satisfied’ or ‘very satisfied’ (62% of HCs and 47% of APs) generally contained some comment to this effect, as well as acknowledgement that the boxes were received in good condition. The low rate of ‘dissatisfied’ comments (HC 2%, AP 1%) confirms the value seen in the program. Most comments coded as ‘dissatisfied’ at HC level sought improved transport communications, with a few suggesting some medicines were in over-supply and only one noting rain damage to boxes. ‘Dissatisfied’ comments at AP level all contained either a request for improved communications or a request to supply additional medicines.
Comments coded as ‘other’ generally included the reason for a ‘Failed’ delivery and were far more frequent at the AP level. Reasons given for a failed delivery were most commonly because the facility was not there (most often because it had been burnt or destroyed during conflict), the name or location was wrongly listed, or the operating staff were absent. Less commonly, road blockage due to conflict was recorded. Only rarely were other transport difficulties (poor conditions of road or water) given as reasons for failed delivery and many comments note the occurrence of a successful delivery despite the logistic obstacles that are common in rural PNG. Other information provided that was coded as ‘Other’ included information that an AP was operating in a private home (in the absence of a functional facility), comments about changes in facility status, and many requests for increased storage capacity.
Other qualitative findings on the ‘push’ systemInterviewees noted that a major organizational challenge is accurate central listing of recipient HFs, including name, location, status and outpatient activity; all essential to correct ‘push’ system distribution. These lists originated with NDOH and CKP was then required to verify. Out-dated listings held in NDOH and provincial health agencies, especially APs, created major difficulties. For example, a NDOH listing of 3,111 APs estimated that 1,042 facilities were closed at any one time. Resolving this required provincial health information, phone calls to facilities, review of mapping data, and information from the earlier 40% kit verification. Nevertheless, the evaluation still observed a number of different effects, including HFs that were open but not receiving kits (due to being omitted from the NDOH master listing) or HFs that were closed but listed to receive kits. This problem is difficult to quantify, but is important. Of the ‘Failed’ AP deliveries noted above, by far the most common reason was that the AP was wrongly listed (by name and/or location) or was not known to be closed.
As the ‘push’ program has progressed, this audit has proven useful to provincial health agencies in updating their own facility listings, especially when a HF existence and location is verified by a successful delivery. The delivery database described above contains updated HF names, geographic positioning system location data and other information that will be of future use to health administrators, especially if continually updated as ‘push’ system rounds continue. Greater involvement of provincial and district health managers to identify changes in the status of facilities of rural and remote facilities will be helpful to future rounds. However, given the gaps in national and provincial records and the speed with which facilities open or close (especially in conflict-affected areas), this may need to happen through consultations no earlier than when a delivery round is commencing in provinces.
Interviews with managers and HF staff at all levels requested greater communication around 100% kit distributions. Provincial health staff wanted to be more closely involved in the decision making processes around the selection of the 100% kit items and quantities appropriate to various facilities. All stakeholders – provincial/district managers and HF staff – wanted greater communication around the distribution plans and scheduling, including delays or cancellations. HF staff and health
Page 36 of 81

Year One Evaluation Report Medical Supply Reform Impact Evaluation
managers reported not knowing when the kits would be delivered, with uncertainty as to whether a delivery had failed. As tabled above analysis of contractor records for round one report suggest that in only 42% of HCs and 38% of APs did the receiving staff report that they had received some communication from provincial health managers. It is noted that communication with the provincial (but not district) health agencies is a clearly stipulated part of logistics companies’ contract conditions. Health managers commented that it was particularly the district health manager who had the ability to identify HF locations, operational status and travel conditions. The local health authorities mentioned that they know the geographic terrain and if the aid posts were open or closed as the situation changed frequently. It was reported that poor coordination in some cases meant that kit deliveries arrived at the same time as a ‘pull’ system order, resulting in excess stock that would then expire. Sandaun Province was reported as a good practice example for enabling communications between transport contractors, provincial health agency, and district managers: prior to distribution District Health Managers travel to the provincial capital to centrally coordinate and discuss the distribution with contractors.
The qualitative data from the great majority of interviews with HF staff (seen Annex 11.4), as with comments in delivery reports (see above), reported very positive opinions on the ‘push’ system delivery. As described further in later sections of this report, kit delivery direct to the HF was associated with increased availability of services, and decreased cost to the HF and community. This was especially noted by AP staff as they had rarely in the past received their medicines straight to their doorstep rather than having to organise transport to pick up their medical supplies from the HC. When asked about the main changes that the ‘push’ system brought, the overwhelming majority responded very positively about the kits. It was frequently mentioned that the 100% kits delivered through the ‘push’ system supplemented their supplies as the orders from the AMS were often delayed and their stock levels were low:
“Lots of medication available, especially the necessary ones. So happy about the program.” and “since the start of this program, more patients are admitted at the aid post, instead of the health centre … or the hospital.”
Among provincial and district managers, most approved of the ‘push’ system as a supplement, but some expressed dissatisfaction, questioning whether it weakened the routine ‘pull’ system, or actually performed any better; this perhaps reflects the views of those who had been less engaged in the operation of the ‘push’ system. Some managers felt that the ‘push’ system’s presence also meant some HFs reduced the number of bi-monthly orders HF’s placed with the AMS; something that caused alarm among some provincial and district managers who saw this as an abandonment of the routine system. Some provincial managers worried that HF staff had stopped using stock-cards because predetermined quantities were being delivered (although it is worth noting that very few HFs in either system ever used stock-cards routinely).
Managers also provided examples, from all regions, of failed kit deliveries, deliveries to the wrong site, or poor logistics practices, such as breaking up consignments and delivering them piecemeal. A few HF staff interviews confirmed such reports (in one HC and a few APs)22, noting instances where they had not received kits, either through not being listed appropriately, or through transport failures. Increasing monitoring and security were suggested by some health workers as a way to reduce the incomplete and failed deliveries. Other suggestions for improvement from HF staff included more frequent delivery.
Concerns about the storage and handling of the kits was also raised by some staff and managers (see Annex 11.4) as an issue, citing reports of boxes delivered wet or damaged to a HF. One example provided was a consignment of round three kits in Kiunga (Western Province), reported to be stored
22 Quantification of this qualitative HF survey data is not helpful, due to the purposeful sampling employed.
Page 37 of 81
Year One Evaluation Report Medical Supply Reform Impact Evaluation
outside the post office, questioning Post PNG’s storage capacity in that site. It is unclear whether all reports of this nature relate to ‘pull’ or ‘push’ systems or both. Examination of the 100% kits contractor delivery database suggests over 98% of boxes were delivered in good condition (whether to the designated HF or in case of a ‘Failed’ delivery to alternative site), from among approximately 70,000 boxes for which records were available in the first two rounds.
As noted above, contractor records do document ‘Failed’ deliveries, which resulted in redirection of the delivery to another facility, often the supervising HC of an AP, or a medical store. Contractor records in these instances note intact delivery to the alternate site and often include photographic evidence of the obstacles preventing delivery, although some informants questioned the authenticity of some photographs. In later rounds in 2013, some kit components (intravenous fluids and category C medicines) were intentionally held back from more peripheral facilities, based on monitoring information. These aspects of the program could potentially lead to confusion among informants. The evaluation team’s overall conclusion is that while there were some aspects that could be improved, these issues were uncommon in the 100% kits distribution.
Although the kits’ purpose is to supplement the ‘pull’ system, they often were reported to serve as the primary supply source, and that without them, many facilities would not have had medicines. As described in Sections 5 and 8, the distribution of 100% kits did have greater penetration than the ‘pull’ system, however for 2014 there are clear issues to address in communication and coordination with provincial and district staff, continued monitoring of contractor performance, and the seeking of synergy with the ‘pull’ system so that it can be strengthened as ‘push’ programs continue.
4.3.2. Distribution of supplies through other programs
Although not the primary focus of this evaluation, the supply chain for other ‘vertical’ programs was reviewed. These include malaria program supplies, that operates a ‘push’ system similar to the kits, as well as supplies for HIV, TB which are integrated to varying degrees within the ‘pull’ system, and vaccines, which operate separately again. Some reproductive health supplies are separately procured by UNFPA but immediately enter the ‘pull’ system and are discussed at various points elsewhere in this report.
Malaria supply chain (‘push’ system)
The malaria program receives funding from Global Fund and most ACTs are procured through their voluntary pool procurement (VPP) mechanism whereby a nominated procurement agent procures in the international open market and delivers consignments to AMSs. These are supplemented with local procurement through third party suppliers, however serious quality problems with storage and dispatch were noted in this process by a number of informants. From the AMS, stock moves to the provinces (transit stores and malaria program provincial supervisor) who in turn organizes with facilities for delivery or collection as local resources and infrastructure may allow. Given the paucity of the malaria program data, this is effectively a ‘push’ system. Malaria medicines have been in short supply due to problems with the Global Fund appointed procurement agent not being able to deliver on time. When medicines were finally received, large quantities were about to expire and there were numerous reports of expired or close to expired medicines in facilities verified by this evaluation.
Forecasts so far have been informed by catchment and incidence historical data based on sentinel surveillance for the last ten years. The Global Fund grant supports four logisticians and four M&E officers who monitor supplies in the system. The grant’s Principal Recipient reports that there is currently an excess of ACTS in the country. Our survey (see Section 5) did confirm significant levels of expired medicines, with 25% of HFs recording some expired stock (18% hosp, 23% HC/SC and 31%
Page 38 of 81

Year One Evaluation Report Medical Supply Reform Impact Evaluation
APs) an expiry rate higher than that for all other (‘push’ or ‘pull’) medicines in our survey (10%). ACT was also reported as under-used in HFs (especially APs) that had difficulties in using or accessing RDTs. Overall availability of new antimalarials was reasonable across the health system (at 79% of HFs overall), suggesting this ‘push’ system also achieved a relatively high delivery rate in the face of these inefficiencies.
The Global Fund financed mosquito nets are procured directly (as this is cheaper than through the VPP mechanism) and distributed by the Rotarians Against Malaria in Papua New Guinea (RAM-PNG) (Rotary Club PNG). To date, RAM-PNG has delivered 2.3 million mosquito nets and it is estimated that two thirds of all villages in PNG have received nets. Nets are bought together with the container which is transported to districts and from there local networks are used to deliver door to door after a needs assessment of nets per household requirement has been undertaken. It has taken the Rotarians three years to achieve these results.
No satisfactory explanation was given as to the reason why LD logistics was not distributing malaria or TB medicines to facilities given that their contract with the NDOH covers all medicines and there are no specific program exemptions. The MSPD reported that they now plan to extend this service.
HIV supply chain
The HIV programme requirement of anti-retroviral (ARV) medicines is wholly funded by the GoPNG. UNICEF acts as a procurement agent and the Clinton Health Access Initiative (CHAI) provides quantification services with a contract ending in 2013. The program contracts the logistics firm TNT to deliver to all 400 ARV treatment sites from a dedicated storeroom within Badili AMS, in amounts quantified in accordance with surveillance and treatment data. In essence, the HIV programme bypasses the national ‘pull’ system to meet their programmatic targets.
Tuberculosis (TB) Supply Chain
The TB program has been able over the years to collect consumption data from what the program terms ‘Basic Management Units’ (BMUs): health facilities providing tuberculosis services. This has allowed relatively accurate forecasts based on registered cases, sufficient to quantify a three month buffer in supply. BMUs submit quarterly reports to the TB program including cases notified, consumption of TB medicines, treatment outcomes and HIV/TB co-infection data.
The program procures from the Global Drug Facility (GDF) for TB medicines funded by Global Fund through the NDOH (MSPD). Initial attempts to procure from the local market failed to garner sufficient quality. Medicines and medical supplies are moved from AMS to provincial transit stores from where BMUs collect supplies using their own resources. The lack of resources to provide a predictable transport service was identified as a hindrance to commodity access. It is estimated there is a BMU reporting level of 70% and each report has the medical supplies order integrated with activity and prevalence data, which enables efficient and accurate ordering at provincial level. The provincial office keeps a copy of the order/report for replenishment from the transit store, and where provincial store staff raises monthly stock takes, this adds to system efficiency.
The TB program is not included in the transport and distribution service provided by LD Logistics although there is no contractual reason for this and NDOH managers have committed to review this.
Vaccines
UNICEF partners with the NDOH in providing vaccines, which are funded both by GoPNG and the
Page 39 of 81
Year One Evaluation Report Medical Supply Reform Impact Evaluation
GAVI Alliance (for pentavalent vaccine). UNICEF acts as a procurement agent. There is no specified frequency for ordering vaccines, although quantification is done annually, including the use of data from micro-planning exercises carried out for special immunization activities. The vaccine supply chain is reported as not well organized though in general vaccines move from AMS to province then to district and finally to health facilities. Informants report difficulties in meeting transport costs that hampers vaccine availability. Most of the time shipments are pushed to health centres in quantities determined by population data. Because of problems with identification of catchment area populations and monitoring of vaccine coverage, high wastage rates have been reported for some time; noting that there is an immunization program review underway in 2013 that can clarify this.
Though it was reported that all AMS have cold storage, the infrastructure is poor. Our evaluation survey found that 76% of health facilities had cold storage available (92% of hospitals and 76% of health centres and sub centres, but minimal cold chain facility at AP levels. Only 17% make regular temperature monitoring checks.
The Australian Government supported cold chain improvements and tasked CKP to undertake the procurement of cold chain equipment (refrigerators and solar units to a value of USD 280,482). The last units were received on 2nd April 2012 and were procured by UNICEF as direct source of supply. Transport costs in country were revised to 590,126 PGK, this included freight forwarding services of redirecting one unit from Amboin (East Sepik) to Bosset Health Centre in Western Province.
Through an open tender method Bookland PNG was awarded the transport contract to distribute the cold chain equipment. Distribution commenced on March 2012, with 90% of deliveries completed by September 2012 and final deliveries by January 2013. There were some reports of difficulties in installation of refrigerators supplied with European power connectors. However, adaptors were provided to all supplied facilities to address this.
Out of the 22 districts where cold chain equipment was delivered based on the NDoH and WHO’s agreed list, only Middle Ramu, Rai Coast and Bogia districts in Madang Province, and Ambunti-Drekikir district in East Sepik Province, are designated as high priority districts, using immunization program markers based on reported vaccine coverage23. None of the hospitals (21) where equipment was provided were in priority districts. This suggests that future cold chain procurement is likely to be needed.
23 Note that this is a different priority ranking system than the one we use in Section 8.
Page 40 of 81

Year One Evaluation Report Medical Supply Reform Impact Evaluation
5. Findings: availability and usage of essential medicines in health facilities
5.1. Availability of essential medicinesKey finding: Availability of essential tracer medicines in 2013 was measured at 64%, using an internationally standardised indicator. NHIS data and qualitative findings suggest availability has increased over the past three years, with a significant contribution from the kits distributed through the ‘push’ system. However stock-outs are still common and the majority of facilities needed to privately purchase supplementary medicines at some point.
5.1.1. Current availability and recent trends
The overall measurement of availability, using the WHO-comparable indicator, of 16 tracer medicines in PNG was 64%. Of these, 63.6% were from the Australian Government’s pharmaceutical supply contractors, taken as reliable quality due to the quality-guaranteed nature of their source. Compared to other countries in the region, this is higher than the availability found in a 2011 WHO/HAI pricing survey[5] that reported an average and median availability of less than 35% across a number of Asian and Pacific countries. The level is comparable to East Timor in 2011, which reported an average availability of 60.4% (range 54.2-66.6%) for 24 selected medicines, and Solomon Islands with 64% (average across 80 HFs using 30 tracer medicines). It is lower than Tonga, which reported 92% availability among 15 medicines24.
The medicines with the highest availability were: ORS (96% across all HFs), cotrimoxazole tablets (90%), amoxicillin tablets (89%), iron/folic acid tablet (83%) and artesunate suppository (79%).
Lowest availability was for gentamicin injection (37% across all HFs) and misoprostol tablets (44%). ACT had reasonable availability at 70% across all HFs. Annex 11.2, especially Tables A11 and A12, provides detailed results of availability and other core measures for the 16 tracer medicines. A comparison of availability in different programs, contrasting ‘push’ and ‘pull’ systems is provided below, along with a review of the contribution of 100% kits.
Measuring changes in availability over recent years is made difficult by a lack of earlier data. The evaluation team examined raw data in a 2009 study that measured the presence of 37 medicines in 55 HCs in PNG[8], estimating a comparable availability measure of 70%. This compares well with the 64% we measured in this evaluation, especially when considering that the 2009 study (primarily performed for another purpose) did not include the more peripheral AP level in its sample.
Other trend data was sought from the National Health Information System, which consolidates data from monthly HC and hospital reports. The consolidated NHIS stock-out indicator (indicator 27), reported annually in sectoral reports, suggested 47% availability in 2010, with little movement in the past decade. However this indicator is calculated very differently than the WHO indicator we used and is highly sensitive to any stock-outs across a varied range of medical supplies.
To examine NHIS trends in more detail we re-analysed the NHIS database to assess stock-out trends of individual medicines over 2010, 2011 and 2012. This is possible because each HF monthly report
24 http://www.pharmascholars.com/admin1/files/23002.pdf
Page 41 of 81

Year One Evaluation Report Medical Supply Reform Impact Evaluation
records whether or not a stock-out occurred25 separately for each of 28 different items. The figure below shows stock-out rates for eight essential medicines (those included both in the NHIS monthly reports and in our survey) – with rates measured as the percentage of all monthly reports supplied in that year. This covers all hospitals, HCs and SCs that submit monthly reports (but not APs), and is very representative of HFs at these levels.
This further analysis of the NHIS suggests that availability of some essential medicines has increased in the past three years. There were significant changes26 in overall stock-out rates between 2010 and 2012 for all eight medicines that were reported. Stock-out rates decreased (availability improved) for five medicines (Amoxicillin, Chloramphenicol, Cotrimoxazole, ORS, ACT). It is noted that these are all distributed within the ‘push’ system of 100% kits (as well as the ‘pull’ system) or vertical malaria program. Stock-out rates increased (availability decreased) for two medicines, distributed only through the ‘pull’ system (medroxyprogesterone, oxytocin) and one kit medicine (ferrous sulphate/ folic acid) that are essential to scheduled preventative services. The time-frame of this data overlaps only partially with the distribution of the 100% kits, and is likely to also reflect the influence of the ‘push’ system distribution of the earlier 40% kits.
Figure 2: Changes in stock-out rates for eight essential medicines, 2010 - 2012
Qualitative findings, detailed in section 5.1.3 below, highlight HF staff perceptions that the bulk of any recent increase in medicines availability is attributable to the ‘push’ systems of distribution.
25 Defined as absence of the supply for at least one week in the month being reported.26 Statistical test for two proportions, comparing 2010 and 2012, p <0.5
Page 42 of 81
0
5
10
15
20
25
10 9
22
1618
8
5
21
11 12
21
16
19
11
5
23
12 11 1214 14
11
2
12
National yearly rate (%) of NHIS monthly reports that reported a stock-out
201020112012+
Stoc
k-ou
t rat
es (%
)
+ Stock-out rates (%) = (number of stock-outs reported for each medicine)/(total number of stock-out reports collected) x 100* Indicates medicines that are only part of the 'pull' distribution system ^ Indicates medicines that are part of the 'pull' and 'push' distribution system# Indicates medicines that are only part of the vertical malaria distribution program

Year One Evaluation Report Medical Supply Reform Impact Evaluation
5.1.2. Comparisons of availability in different settings and health system levels
We reviewed the relative availability, as a proportion of relevant tracer medicines available across all HFs. These findings are presented in detail in table A12 of Annex 11.2. Stratified analysis of this HF survey availability data showed that:
Availability was similar among government-managed and church-managed facilities (where known) – 69.0% vs. 74.7% respectively.
Availability was similar for all regions (ranging from 60 to 65%), being lowest in Madang (56%), Western (58%), and WHP (59%) and Bougainville (61%).
Availability was highest in more central levels of the health system: with 92% of tracer medicines available across hospitals, and 75% of tracer medicines available across the HC/SC level. The most critical level for increasing population access to care is the AP level. When measured using the standard indicator, the proportion of all tracer medicines available at the AP was 48% - reflecting the unsurprising finding that this level of the system is less supplied than more central levels. However the more important measure is to consider AP availability of some of the more essential medicines for important population health threats. In this regard, the current AP situation is better than this figure suggests, as discussed in the section immediately below.
The overall test of availability relates to 16 tracer medicines and thus follows the logic of the standard WHO indicator. It is stringent, but less so than the NHIS indicator (Indicator 27), which is more sensitive to stock-outs because, while the NHIS only consolidates reports across eight tracer medical supplies the variety of these supplies (including vaccinations, oxygen and child health record books in addition to medicines) increases the likelihood that a stock-out will be calculated for any one HF. In our data, while the summary measure (64%) we calculated is comparable to similar countries in the region, this still represents inadequate provision of essential medicines across the board in facilities. This can be seen by the significant experiences of stock-outs, and their subsequent effects, experienced by HFs and discussed in sections below.
Even if the overall measure of availability is modest in comparison to elsewhere, what is different to recent years is that the availability of certain vital, life-saving medicines, such as amoxicillin, ORS, and antimalarials, does seem to have increased. Our findings suggest a strong contribution to this from the ‘push’ systems of distribution, as discussed below.
5.1.3. Contribution of the 100% kits to availability at HC and AP levels
The overall availability measure of 64% is measured as a proportion across all 16 tracer medicines. We also contrasted the availability of medicines available only through the ‘pull’ system, with those that were supplemented by the ‘push’ system, and one vertical program medicine, ACT. Within those supplemented by the ‘push’ system we also attempted to measure the proportion observed that were from IDA, the 100% kits international supplier. This was possible because this supplier used unique and consistent labelling across all its products27.
Overall, the HF survey data showed that medicines supplemented by ‘push’ distributions of 100% kits had greater availability (at 68.8%) than ‘pull’-only system medicines (at 46.0%), fewer expired medicines, were more likely to comprise generic medicines, but recorded similar durations of stock-outs when a stock-out did take place (see section on stock-outs below).
The table below is extracted from Table A12 in Annex 11.2 and presents the comparisons of availability between different distribution systems, at different levels in the system.
27 Even though this was the case, some of our data collectors had difficult accurately recording the brand of medicine – so this is subject to some margin of error, which we estimate at about 10%, as noted in the Annex.
Page 43 of 81

Year One Evaluation Report Medical Supply Reform Impact Evaluation
Table 6: Availability of medicines in different distribution systems
Proportion of the relevant tracer medicinesavailable all relevant HFs, % (95%CI)
Hospitals HC and SC AP
Medicines (3)supplied only through the
‘pull’ system77% 57% 25%
Medicines(12, HC or 12 and 7,AP)
supplemented through the ‘push’ system
78% 80%
54% (12 meds)or
79%(when only the seven
medicines from the 100% AP kits are considered)
Vertical program: ACT 92% 79% 53%
Note: Confidence intervals (95%) are displayed in the Annex, not for statistical testing (given the purposeful sampling) but to show the spread of standard error in these samples.
This suggests that both ‘push’ systems examined (the 100% kits and the vertical malaria program which functions similarly to a ‘push’ system) achieve similar levels of availability and that ‘push’ system supplementation provides higher availability in peripheral HFs (HC/SC and AP levels) than does the ‘pull’ system. One caution is that the specific medicines chosen as tracers 28 will have significant effect on these measures; however our conclusion is strengthened by the correlation with qualitative findings and other supply chain analyses, that clearly attribute recent availability gains to the impact of ‘push’ system distributions.
The most peripheral AP level is important to examine. ‘Push’-supplemented availability is higher even when availability is tested by the basket of 12 medicines provided in the 100% HC kits; while only seven of these are included in 100% AP kits, others of the 12 tracer medicines do end up in APs through the ‘pull’ system or through informal inter-facility transfers. However availability is strikingly higher when the analysis is restricted to just the seven medicines 29 provided to APs in the 100% AP kits: at 79%, this brings AP availability to a similar level as that seen at HCs and SCs.
The specific impact of the recent 100% kits distribution can be seen in that of the ‘push’-supplemented medicines at HC/SC level (with availability at 80%) 64% were reported as derived from IDA (the Australian Government’s pharmaceutical supplier) and of the 79% of ‘push’-supplemented medicines at the AP level (with availability at 79%) 66% were reported as derived from IDA.
The ‘push’-supplemented tracer medicines we chose are some of the most important medicines needed at peripheral levels in PNG. As examples one can consider the following specific medicines. The table below shows selected medicines (see Annex 11.2, Table A11 for full listing) at HC and AP levels, including the proportion reported as derived from IDA, the 100% kits supplier. In these
28 Our choice of tracer medicines combined competing priorities: the need to be close to the WHO 15 tracer standard; the need to include both ‘push’ and ‘pull’-only medicines; and the need to include medicines that were not yet in the ‘push’ system but which would be in the future.29 Amoxicillin tab, Artesunate suppository, Cotrimoxazole tab, ferrous/folic, ORS, Vitamin A and Zinc
Page 44 of 81

Year One Evaluation Report Medical Supply Reform Impact Evaluation
examples, the contribution of the 100% kit varies: for cotrimoxazole around one half of availability is from the ‘pull’ system, but for amoxicillin, ORS and zinc the major contribution is from the 100% kits.
Table 7: Selected medicines availability at HC and AP levels, with 100% kits contribution
HC AP
Proportion of HFs with any availability
(%)
Proportion of available medicines
derived from IDA (100% kit supplier)
(%)
Proportion of HFs with any availability
(%)
Proportion of available medicines
derived from IDA (100% kit supplier)
(%)
Amoxicilin 97% 82% 76% 97%
Cotrimoxazole 90% 46% 87% 64%
ORS 97% 84% 97% 84%
Zinc 78% 93% 68% 100%
ACT 79% Vertical program, not in 100% kits 53% Vertical program,
not in 100% kitsNote: AP measures only include those APs visited in the survey, with observation of stock levels, and excludes those where the AP staff was simply interviewed.
The higher level of availability seen here represents a significant contribution to these facilities’ capacity to provide services, as discussed in Section 8. Qualitative findings add evidence for a strong contribution by ‘push’ systems to medicines availability. In interviews with HF staff during the survey, staff were asked open, non-leading questions about changes seen since the commencement of the 100% kits distribution. The overwhelming majority of reports from facilities were positive about the ‘push’ program, frequently mentioning that the supplement to their supplies compensated for delays or missing orders from an AMS in the ‘pull’ system. Almost all noted increased stock levels and supply lasting longer as illustrated by a range of quotes:
“Lots of medication available, especially the necessary ones. So happy about the program.”(AP, Highlands)
“It helps a lot with stock outs. When medicines ordered from AMS are N/S the kits help the HC keep going” (HC, Islands)
“…when there is a delay in their order from area medical store. The availability of these kits in the healthy facility keeps the health centre in operation” (HC, Momase).
“Major boost to overcoming shortages. Much less stock outs, reduced cancellation of surgical lists. Used to need to purchase privately from Hagen, but now not needed for about 1 year.” (District Hospital, Highlands)
“ These medicines are readily available for the best treatment of patients and which overcome the chances of giving incomplete doses” (AP, Islands)
5.1.4. HF experiences with stock-outs
In cases where lack of stock of certain medicines was recorded, the average stock-out rate in hospitals, HC/SC or APs overall was 51.4%; that is: overall, among medicines subject to stock-out, they were unavailable for approximately 45 days over a three month period. There were lower stock-out rates at church run facilities compared to government managed HFs (34.8% vs. 58.9%). Stock-out rates were similar among ‘push’-supplemented and ‘pull’-only system medicines (49.1% vs. 57.9%). Stock-out rates were lowest at hospitals (25.5%) but similar at HC/SC (71.4%) and APs (66.4%).
Page 45 of 81

Year One Evaluation Report Medical Supply Reform Impact Evaluation
Lower stock-out rates at hospitals may be a result of the hospital’s closer location to AMS or PTS, as well as the fact that they have internal budgets, which allow them to purchase medicines outside the regular supply chain. Survey data suggest that actions taken by HFs when they had a stock-out included:
obtaining stock from another HF was most commonly undertaken (75%); ordering from AMS (52%); then local procurement (35%); or other options (n=3) included sending a patient with a prescription to obtain the medicines
privately.
Table 8: Actions taken by HFs when there are stock-outs30
HFs type% HF obtaining stock from another HF (N=88)
% HFs who order from AMS(N=88)
% HF Buy from local market(N=88)
Hospital 44%31 100% 60%HC/SC 60% 70% 35%APs 90% 19% 19%TOTAL 75% 52% 35%
The private sector will continue to be an option to supplement medical supplies through the current substantive use of local procurement mechanisms. Local procurement of medicines occurs frequently and at substantial costs, especially at hospitals: two hospitals recorded spending ~between 150,000 PGK to 600,000 PGK each in 2012 and one district in the Southern region had spent ~200,000 PGK in just three months of 2013 on locally procured medicines. Procured items range from paracetamol or aspirin to items not on the EML (e.g. hydroxyurea, Haemacel/gelofusine). Overall 51% of all respondents in our survey had purchased medicines in the last 12 months as a result of stock-outs with most (90%) hospitals taking this option.
Table 9: Medicines purchased in last 12 months due to stock-outs
HFs type % HF who purchased medicine in the past 12 months
Hospital (n=10) 90%HC/SC (n=42) 52%APs (n=37) 41%TOTAL 51%
Even though peripheral HFs, especially APs, do not in theory have any discretionary budget for supplementary purchases, the qualitative data demonstrate that in reality it is common for these facilities to use consolidated user fees, donations or other informal sources of income to buy supplementary medicines from local private suppliers. As noted elsewhere, in some cases patients were instructed directly to purchase medicines that were not available in the facility when needed.
Qualitative findings also suggest that communication between health facilities was reported by health managers to be generally working well and particularly useful in responding to stock-outs. This was demonstrated through comments around sharing of medicines if one health facility had run out:
“When there’s stock-outs, they use alternate medicines or close clinics for emergencies only. The health facilities contact each other for sharing of drugs if
30 HFs could choose to take multiple concurrent actions 31 Only 9 hospital responded to this question
Page 46 of 81
Year One Evaluation Report Medical Supply Reform Impact Evaluation
they have run out.” Some participants noted that communication between the AMS and PTS was reasonable.
Health managers reported that when health facilities ran out of medicines, the health facility or the patient had to bear the cost for purchasing extra medicines from private pharmacies or use the facility’s funds to arrange transport for delivery of supplies. This was noted as an expensive exercise, with health facilities using patient user fees to cover the costs of purchasing extra medicines.
“Enga doesn’t buy drugs, but the patients have to go and buy the drugs which is very expensive.”
Health managers were also wary of the potential impact of the current user fee system being abolished; in which case the health facilities would not have enough funds to purchase the extra supplies: “The problem is when we do not have patient fees; we will not have the money to pay.” Buying extra supplies was also only feasible for health facilities that were located in areas where they could access a private pharmacy. This is generally only in towns, with most rural areas lacking this option. A few participants mentioned that lack of funding was being used as an excuse for not purchasing adequate medical supplies – which they felt wasn’t the case as there were funds to pay private distributors.
As noted above, under distribution, qualitative data from health managers and HF staff confirmed that availability of medicines and supplies in the ‘pull’ system was constrained by difficulties in the supply chain. Some staff reported AMS dispatch of excess medicines that the health facility did not order and that were close to expiring, using the health facility as what one informant termed a “dumping ground”. More information can be found in Annex 11.4.
5.2. Rational use of essential medicines and appropriate prescribingKey finding: While many facilities are using increasingly available medicines well, with good compliance with some core aspects of STGs (including new malaria treatment protocols), there are few STGs that are followed completely. Over-use of some medicines (such as antibiotics) and under-use of others (such as zinc) are more likely to reflect deficiencies in staff training than community pressures. It was reported that information resources provided with kits could be more user-friendly and STGs could be helpfully tailored to the AP level.
5.2.1. Rational medicine use
Rational use of medicines, for this survey was assessed through important tracer conditions noted in the survey methodology. It can be viewed as the proportion of health staff reported using the correct medicine for a given condition, and avoidance of un-needed medicines – in assessing this, the evaluation related judgements to compliance with national STGs. Full details are provided in Annex 11.2, including a breakdown by level of HF.
Proportions of staff using a correct medicine for a condition included: For children under five years of age treated for childhood diarrhoea, 80% reported using oral
rehydration solution (ORS). Our ORS prescribing rates were similar to that reported by WHO in 2004 (80-95% in low/middle-income countries)[7] and regionally (at 79%)[5] but only 23% reported using zinc, which has been part of STGs for diarrhoea for some years;
For acute respiratory infections (pneumonia) in children under five years of age, overall 77% reported using the recommended treatment with amoxicillin and 55% reported using an injectable antibiotic (mainly benzylpenicillin) – noting that the injectable antibiotic is compliant with STGs if the child is assessed as having severe pneumonia;
Page 47 of 81

Year One Evaluation Report Medical Supply Reform Impact Evaluation
For adult malaria, 75% reported using artemisinin combination therapy (ACT) (with some adding artemether injection for severe infections);
For prevention of post-partum bleeding in childbirth, 73% reported using an injectable oxytocic (oxytocin or ergometrine) but only 30% reported using the oral alternative, misoprostol.
Compliance with STGs, in terms of giving the correct medicine for a condition was not significantly higher at hospitals than HCs or APs, if anything it was slightly higher in APs for all conditions except for prevention of post-partum bleeding.
Proportion of staff who gave an un-needed medicine for a condition included: For children under five years of age treated for diarrhoea, 62% reported using an anti-
worming medicine and 54% reported using an antibiotic; Among treatment for upper respiratory tract infections (URTI) in any age, overall 75%
reported using an antibiotic; and For adults with malaria, 49% reported using an older antimalarial (such as chloroquine and
sulfadoxine/pyrimethamine), with some stating they would only use this if the RDT was negative – noting a positive RDT required the use of ACT.
This represents a significant level of over-use of some medicines, especially antibiotics – which are the most commonly dispensed form of medicine (see below). The use of older antimalarials is also concerning, suggesting that health staff find it difficult to rely on the new RDTs (rather than simply the presence of fever) for diagnosis. This level of over-use is of concern because of the potential to contribute to drug resistance, as well as being wasteful of supplies. It was notable that this over-use was more common at HC and AP levels than at hospitals in our survey.
Rational prescribing requires ongoing training and improvement with only 54% of the most senior prescriber at HFs having received some rational medicine use/clinical training update in the last 3 years. Overall 58% of facilities had all the surveyed STGs /EMLs/National Formulary of which 58% were the latest editions. Availability was low compare to regional WHO measures[5] which indicated a copy of STGs was present in approximately 82% of public health facilities in the region.
Two of our survey tracer medicines that are in the EML, zinc tablets and artesunate suppository, were under-used, despite being available in facilities, with the reason reported as lack of staff training. Although the 100% kits are distributed with an information booklet providing details of new medicines, this may need revision or supplementation. Qualitative findings included recommendations that the dosing information in the booklets delivered with the kits could be more user friendly, especially in weight-based dosing schedules for children.
Another source of confusion was some health facility workers’ found it difficult to distinguish between the generic name and brand name of the medicines, for example most staff only understood medroxyprogesterone injection when it was mentioned as “depot”. Similarly staff did not know Plasmotrim™ was artesunate. As medicines are increasingly provided under generic names, (as is the case in the 100% kits), specific communication materials on this issue may help improve rational use of medicines.
As noted in Section 3, some revision of the level of facility to which medicines are distributed will be helpful. Some health facility workers reported delivery of category B and C medicines (requiring a doctor or specialist) in the kits, which could not be used because there were no doctors at the facility. Central sources noted that this was part of an intentional strategy to improve access, in the hope that such medicines could be used if a medical officer provided remote authorization by phone
Page 48 of 81
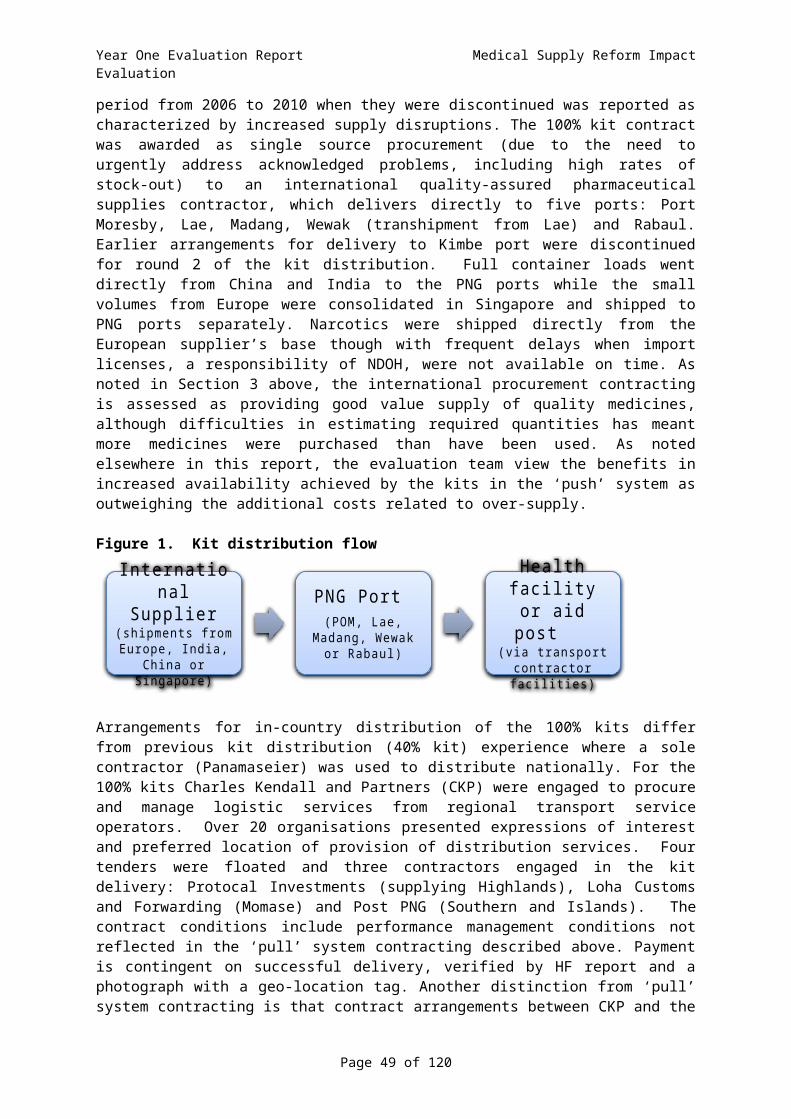
Year One Evaluation Report Medical Supply Reform Impact Evaluation
or radio. Some of these kit medicines (e.g.: carbamazepine and hydrochlorothiazide) do not have dosing information in STGs. Lastly the STGs are written for “Nurses, Health Extension Officers and Doctors”, rather than for Community Health Workers, who commonly staff APs (66% in our survey). Feedback from health manager’s feedback (Annex 11.4) was also in accordance with these findings.
5.2.2. Different medicines dispensed, and dispensing practices
The survey provided an opportunity to review the types of medicines commonly dispensed at HFs in PNG. Among the 1088 prescriptions assessed after random selection of outpatients in over 100 facilities:
36% were antibiotics; 27% were for analgesics; 14% were antimalarials; 5% were anthelminthic.
If all anti-infective agents (excluding medicines for malaria) are combined, this estimates that 45% of prescriptions were for anti-infectives; this finding is similar to the WHO regional study[5] that measured a regional mean percentage of patients receiving antibiotics at 53%.
The survey also assessed dispensing practices for 1088 prescriptions, noting good dispensing is critical to ensuring that patients have the ability to use medicines accurately. Although 89% of patients reported that they understood how to take their medicines at the time of the interview (comparable to WHO 2004 data of 80-89% [7]). Good practice dictates that verbal advice is supplemented by the application of a patient-specific label by the dispenser, noting prescribing advice for that individual patient. This aspect of labelling32 was poor, with only 47% of medicines labelled with all of a medicine name, dose and duration of therapy. Proportions of prescription with good standards of dispensing labelling were much lower than the WPRO report [5] which found 94% of medicines in public health facilities to be adequately labelled.
Dispensing of expired medicines is not recommended, although PNG has an informal policy (reported by HF staff during interviews) that medicines can be used up to a certain number of months (variously quoted as 3 or 6) after their expiry date. 42% of Health facilities had dispensed expired medicines to patients in the last 12 months because they did not have enough non-expired stock but needed to treat their patient. This was similar across facility types.
Table 10: Proportion (%) Facilities dispensing expired medicines in last 12 months
HFs type % dispensing expiredmedicines in last 12 months
Hospital (n=11) 45%HC/SC (n=39) 41%APs (n=45) 42%TOTAL (median) 42%
Other benchmarks of prescribing measured in the survey can be compared to regional norms in the WPRO report[5] as:
median number of items prescribed per consultation in PNG was 2 items of which majority (96%) were dispensed/administered to the patient (WPRO 96%);
proportion of medicines prescribed by generic name in PNG was 57% (WPRO 80%);
32 Dispensing labels should not be confused with the medicine identification labels applied by the manufacturer and/or distributor. Manufacturer-applied medicine identification labels also varied, although those on IDA medicines were noted as being of high quality by most respondents.
Page 49 of 81

Year One Evaluation Report Medical Supply Reform Impact Evaluation
proportion of medicines that were injections (noting ours was an outpatient sample) was 8% (WPRO 20%), noting that low rates of injections not only reduce costs but are less invasive and taken as a positive indicator for rational medicines use.
5.2.3. Opinions on usability of 100% HC and AP kit contents, and other supplies
Our HF survey attempted to assess usage of medicines in 100% kits in some detail, seeking suggestions for where both contents and quantities could be improved. The survey captured HF staff opinions on which contents were less likely to be used – with detailed analysis suggesting non-use was very often due to lack of staff training or awareness of the proper use of certain medicines, rather than a mismatch between kit contents and population health needs.
The table below summarises the most common medicines cited as not being used at some time (including both ‘push’ and ‘pull’ system products). Lack of relevant training was cited as the reason for less usage than anticipated of a range of medicines, most commonly: Artesunate suppository (16% of total respondents), Zinc tablets (10%), Ampicillin injection (6%) and misoprostol tablets (6%). Absence of the relevant disease was cited for less usage of medicines such as Zinc tablets (9%), Artesunate suppository (7%), and Whitfield’s ointment. In many cases it was clear that disease was actually prevalent (for example diarrhoea requiring zinc treatment by new STGs), but that this had not been recognized at the HF. Other reasons for not using a medicine related to Artesunate suppository (8%) and Primaquine (3%) and Quinine (3%) with artesunate suppository being an embarrassing form of administering a medicine (especially as up to 4 suppositories may be needed).
Table 11: Medicines reported as not used at some point by some HFsHospital HC/SC APs
Ampicillin injection*Artesunate Suppository*Vitamin A* Zinc*
Ampicillin injection*Artemether-LumefantrineArtesunate suppository*Chloramphenicol injection*Gentamicin injectionMagnesium sulphate injection*Medroxyprogesterone depot injectionMisoprostol*Oxytocin injectionSodium Chloride solution*Vitamin A*Zinc*
Ampicillin injectionArtemether-LumefantrineArtesunate suppository*Chloramphenicol injectionGentamicin injectionMagnesium sulphate injectionMedroxyprogesterone depot injectionMisoprostolOxytocin injectionSodium Chloride solutionVitamin A*Zinc*
Note: Analysis where the HF had stock of items. 100% kit medicines designated by*. Artemether-Lumefantrine supplied by vertical ‘push’ program.
Most facilities reported antibiotics (e.g. oral amoxicillin and benzylpeniciilin injection) and analgesics (aspirin and paracetamol) as the most common medicines that ran out too quickly and were therefore considered undersupplied. However, it is also likely that over-use of antibiotics and analgesics (as noted in our analysis of rationale use of medicines) contributed to shortages; in fact this may be as important as any true under-supply.
Table 12: Medicines reported by some HFs as running out too quicklyHospital HC/SC APsAmoxicillin tablet 10% Amoxicillin tablet 17% Amoxicillin tablet 18%
Page 50 of 81
Year One Evaluation Report Medical Supply Reform Impact Evaluation
Benzylpenicillin injection 8%Paracetamol tablet 8%Cotrimoxazole tablet 6%
Paracetamol tablet 14%Cotrimoxazole tablet 11%Benzylpenicillin injection 7%Aspirin 6%Chloramphenicol injection 6%
Paracetamol tablet 17%Cotrimoxazole tablet 10%Aspirin 8%Benzylpenicillin injection 8%
Note: reported only if there was >5% of total respondents reporting any medicine
Most provincial health staff wanted to be involved in discussions on the contents and quantities of items in the kits. Suggestions have also been received to involve hospitals and provincial AMSs as a group to decide on what to procure and how much to distribute to the provinces.
District and Provincial managers suggested kits could also contain TB and HIV supplies (Malaria ACT and RDTs are planned to be in Kits in 2014) and reported medroxyprogesterone injection to also be in short supply despite most AMSs holding large supplies of this medicine.33 Qualitative feedback (more detail in Annex 11.4) from health managers echoed this point:
“Supplies need to be improved so that they are matched with needs of individual health facilities and aid posts, this would stop wastage.”
Given that the information from HFs and managers noted that the 100% kits are highly valued, it is unsurprising that the majority of suggestions for improvement from HF staff in the qualitative data (apart from suggestions for more frequent delivery) were for some tailoring of kit contents to their needs.
As discussed in earlier sections, usage data is currently difficult to obtain anywhere in the system. For the ‘push’ system, our survey found only 17% of HFs reported having stock-cards that, if used, could help quantify usage. These were actually dispatched with kits, but few HFs recognized their presence, and very few attempted to use them. Additional information on medicines used more or less frequently from our survey is provided in the data annexes. Use of this for future quantification of kit contents at various levels in the system is likely to be helpful, but should be combined with other data, such as rapid operational research, as noted in other sections of this report and in the recommendations. The 2014 kits tender has already taken a more integrated approach across ‘push’ and ‘pull’ systems, and the evaluation team feel there is an opportunity to review the most useful contents for ‘push’ system supplements, continuing to vary at HC and AP levels, now that the tender is concluded.
33 Other information received suggests that shortage of this may be a global problem in the short-term.
Page 51 of 81

Year One Evaluation Report Medical Supply Reform Impact Evaluation
6. Findings: storage and management of medical supplies in health facilities
6.1. Storage and handling in facilities and stores
Key Finding: Storage and record keeping at health facilities requires significant attention, with limited storage capacity negatively affecting their ability to store and process medicines in a systematic and hygienic manner. Temperature control, both in the regular monitoring of their cold storage and methods to cool the internal ambient temperature needs attention to maintain the quality of medicines
Overall conditions for storage and handling of medicines outside of a hospital setting were inadequate. Overall storage at HFs were inadequate with only ~60% of all HFs having all the optimal storage and handling condition for medicines. Conditions became poorer with the remoteness of the HF with hospitals having better conditions compared to APs (~80% vs. ~50%). Monitoring of cold storage temperatures (19%), poor stock management (FEFO=54%, and systematic method of storing medicines=57%) and active methods to cool the storage areas (57%) needed the most attention.
Table 13: Proportion (%) of HFs with good storage and handling of medicines at health facilitiesStoreroom (% YES) Dispensing area (% YES)
N = 100 Hosp HC/SC APAll
Stores(median)
Hosp HC/SC AP
AllDispens-ing area(median)
TOTAL(median)
Method in place to control temperature (e.g. ceiling space fan) 75% 54% 42% 54% 92% 57% 54% 57% 57%
There are windows that can be opened or there are air vents. 100% 80% 75% 80% 92% 90% 88% 90% 90%
Direct sunlight cannot enter the storage area 75% 63% 52% 63% 69% 63% 51% 63% 63%
Area is free from moisture (e.g. leaking ceiling, roof, drains, taps) 75% 83% 74% 75% 85% 85% 78% 85% 85%
Cold storage in the facility.% type:
Electricity (E), Gas (G) and Solar (S)
92%E:91%G:9%
76%E:37%G:47%S:17%
0%
-
76%E:64%G:28%S:17%
69%E:89%G:11%
51%E:52%G:29%S:19%
0%
-
51%E:71%G:20%S:19%
51%E67%G:24%S:19%
Regularly filled temperature chart for the cold storage 17% 45% 2% 17% 27% 19% 0% 19% 19%
Medicines are not stored directly on the floor. 42% 41% 62% 42% 69% 41% 58% 58% 58%
100% Kit medicines are stored in a systematic way 67% 59% 36% 42% 85% 41% 23% 57% 57%
Non 100% Kit medicines are stored in a systematic way 75% 63% 42% 42% 92% 40% 29% 57% 57%
Medicines are stored first-expiry-first out (FEFO). 83% 73% 48% 73% 100% 54% 34% 54% 54%
Medicines are stored separately to non–medicinal products 92% 80% 75% 80% 100% 88% 76% 88% 88%
No evidence of pests in the area. 50% 54% 60% 54% 69% 51% 65% 65% 65%Tablets/capsules are not
manipulated by naked hand. NA NA NA NA 755 48% 51% 51% -
TOTAL (median) 75% 63% 50% 59% 85% 51% 51% 57% 57%
Page 52 of 81

Year One Evaluation Report Medical Supply Reform Impact Evaluation
Most HFs and medical stores lack adequate storage space to house all the medicines, especially bulky IV fluids. There are also inconsistent recommendations within the EML to store certain items in ‘cool storage” (e.g. amoxicillin/chloramphenicol capsules, antibiotic eye ointment, atropine injection) while most medicines would need to be stored in ‘cool’ conditions. Note that only 57% of HFs had adequate active methods for cooling (e.g. fans).
One example of the impact of inadequate storage infrastructure is seen in Garuhi HC (Milne Bay), where staff had been using a large building to house 100% kit medicines until a new HC was opened. Unfortunately staff reported there will not be enough space in the new HC for storage, implying that during the design of this new HC, little consultation was done with medicines supply or storage in mind.
Additional detail is available in Annex 11.2
6.2. Disposal of expired or unwanted medicinesThe current draft of the National Medicines Policy, in regard disposal of expired and unwanted medicines states “expired and unwanted medicines shall be disposed of safely to minimize hazard to the community and environment” and “the Department of Health will establish incinerators for Area Medical Stores and major provincial hospitals for safe disposal of medicines and medical supplies”. This is yet to eventuate and most health staff voiced concerns with inadequate methods to dispose of medical supplies.
Expired stock were generally seen at HFs (as recorded in this survey) and were seen to be left to one side for disposal, with some stocks accumulating to a significant degree.
Health managers reported (full analysis in Annex 11.4.) that the disposal of medicines was a problem, especially where there were no incinerators available to dispose of expired medicines safely. Health care workers were often disposing of medicines by digging a pit in the ground or by burning the waste. Furthermore, medicines were sometimes reported as being left outside the health facility, as there was not enough space to store the supplies properly, subjecting them to the risk of damage or theft.
The issue of disposal is driven as well, by the contributors to over-supply, as noted in earlier sections of this report, including errors in quantification, provision of items that are unable to be used at certain levels (either through absence of authority or training), and the ‘push’ distribution procedure that means consignments cannot be split prior to delivery.
Page 53 of 81

Year One Evaluation Report Medical Supply Reform Impact Evaluation
7. Findings: community engagementKey finding: There is evidence that some community members find medicines more accessible, that more consistent supply has increased community trust, and that kit distributions help reduce community costs, with benchmarks now measured for use in assessing future progress.
7.1. Community perspectives on medicines availabilityQualitative findings from interviews with HF staff, especially from more remote facilities, suggested that community members were aware of the boost to medical supplies represented by delivery of kits in the ‘push’ system, and the evaluation team observed some instances of this in favourable interactions with community groups such as local management committees of APs. Some HF staff reported that the ‘GoPNG’ badging on medicines was recognised, and some staff also reported that some patients perceived the consistently labelled 100% kit medicines as being of higher quality. A number of HF staff provided observations suggesting increased community trust in facilities as a result of greater availability of treatment, resulting from improved medicines supply.
The HF survey attempted to assess patient perspectives during interviews with 487 outpatient clients, while assessing prescriptions. This question asked the patient’s perception of the recent (only over the past three months) trend in ease of accessing medical supplies. Overall, 39% of patients reported their perspective that access to medicines in the last 3 months had been better. Potential bias in these responses should be noted, both that due to a possible desire to please the interviewer, and that these questions were asked of community members who had already successfully accessed a HF and received treatment.
Table 14: Community opinions on trends in access to medicines
N Access to medicine in last 3 mth is (%)
Hospital 87better: 41%worse: 13%same: 46%
HC/SC 297better: 40%worse: 9%same: 50%
AP 103better: 35%worse: 18%same: 48%
TOTAL 487better: 39%worse: 12%same: 49%
Future analysis would benefit from triangulation of these results with other community-based surveys, including household surveys, conducted in PNG. The 2009-10 Household Income and Expenditure Survey[9] confirmed the importance of service availability to local communities, noting that 15.4% of the population had visited a HF in the month before the survey, although service availability may not have been meeting demand, given that the same survey measured 30% of the population having experienced illness in the previous month, with only 55% seeking care. For those who did not seek care, treatment at home was the most common reason given, along with concerns about the distance, cost and availability (in commodities and staff) of services.
A number of HF staff noted a positive impact on improved community trust and confidence in health services from the ‘push’ system; “Biggest change is filling the gap when medicines run out due to
Page 54 of 81

Year One Evaluation Report Medical Supply Reform Impact Evaluation
delays and difficulties in getting supplies from Hagen. Community trust noticeable since started.” (AP, Highlands). This was related to increased patient usage of services, with HF staff hypothesizing this as due to both increased availability and perceived better quality of medicines: “Since kits started tally sheets are showing more patients because they hear more powerful medicines are here.” (AP, Highlands). Other staff at HC and hospital levels, as well as at APs suggested that expanded services meant fewer referrals, with savings in community time and cost.
7.2. Community costs and accessibilitySome of the standardised indicators in the WHO methodology assess the costs of accessing medicines, and the time and distance from facilities. These were measured in this survey to enable tracking of future progress in this area. PNG has recently revised costing expectations, re-emphasising national policy that essential primary health care (which includes the bulk of medicines and conditions assessed in this evaluation) should be provided free of charge. Interpretation of cost-recovery policies varies significantly across PNG as, until recent policy changes, non-government run facilities generally had greater freedom to charge fees. In our HF survey, cost of treatment was approximately 3 PGK (4 PGK including transport) overall, and higher at hospitals (8 PGK including transport).
Table 15: Cost for treatment and transport
N Total cost for treatment- Kina(average, range)
Cost to travel(average, range) - Kina
Hospital 87 4.9 (0-60) 3.2 (0-90)HC/SC 297 2.5 (0-35) 0.8 (0-24)AP 103 2.0 (0-9) 0.1 (0-4)TOTAL 487 2.6 1.1
Our estimates suggest that 10 PGK is a reasonable benchmark of affordability, using WHO norms (see Annex 11.2). This seems largely in line with GoPNG aspirations and with international norms, at least for outpatient medicines at HC or AP. However the cost of treatment at a hospital may be reaching the limits of affordability, especially as the costs of laboratory and other ancillary services has not been included. Some non-government facilities charged additional service fees – for example in Enga, some facilities charged an annual service fee of between 30-60 PGK rather than an individual cost per medicine. Hospital charges for inpatient stays were not assessed in our survey.
In terms of payment for individual medicines, overall 43% of items were supplied free of charge. APs were more likely to charge for medicines: noting that of medicines provided, 49% were free at HC/SC, 42% at hospitals and 29% at APs.
Future analysis would benefit from triangulation of these results with other community-based surveys, including household surveys, conducted in PNG; noting that a survey of public and private expenditure is currently being completed, which included some indicators that can be contrasted with these measures. The 2009-10 Household Income and Expenditure Survey[9] found that 7.2% of the population had purchased medicines without prescription in the previous month, spending an average of PGK15.6 per person. As noted below, increased medicines availability through the ‘push’ system, supplied free by HFs, is likely to reduce this need for non-prescription spending by community members.
The qualitative data from HF staff interviews confirmed cost savings for HFs, which often translated to reduced cost to the local community. As noted above, private purchase of medicines was a common practice in HFs at times of stock-out. A reduction in stock-outs, supplementing the medicines received in the pull system, helped reduce this need: “helps improve and cure lots of
Page 55 of 81

Year One Evaluation Report Medical Supply Reform Impact Evaluation
diseases. Reduce cost of buying medicines.” (AP, Southern), “…before the arrival of the kits they usually experience drug shortages so they have to buy at local markets. However, since the introduction of the kits it saves them money and provides the required treatment” (SC, Islands). Other comments also noted that reduced need to privately purchase medicines during stock-outs also meant reduced cost to community members, because private purchase costs were generally passed onto the patient. Reducing need for referral was also reported as having a community cost savings benefit, as in: “Very helpful and supportive. Reduced the patient cost to refer them to the HC in Arawa” (AP, Islands)
Page 56 of 81

Year One Evaluation Report Medical Supply Reform Impact Evaluation
8. Findings: equity, health services and population health impact
8.1. Equity and health services impact Key finding: Overall the ‘push’ distributions have contributed to improved equity in medicines availability. We measured equal availability of relevant tracer medicines in high poverty districts and good penetration to HFs designated as ‘remote’, apart from some difficult pockets. Our findings suggest that the kits (‘push’) system is likely to have contributed more, relative to the ‘pull’ system, to medicines availability in disadvantaged areas. Most qualitative data from interviews back up this finding, with many HF staff reporting that a kit delivery has meant a new level of medicines availability in their facility; as well as a range of specific effects.
8.1.1. Poverty and medicines availability
The ‘push’ system for 40% and 100% HC and AP kits was intended to reach remote and disadvantaged areas of PNG; in line with the aims for equitable access to health embedded in PNG health planning. Our HF survey sample purposefully included some of the 20 most disadvantaged districts that had been classified as ‘high-poverty’ from a World Bank ranking[10] that is still being used in PNG. The table below disaggregates surveyed HFs in our sample by whether or not they were in a ‘high-poverty’ district.
Table 16: Surveyed health facilities in ‘high-poverty’ and ‘non-high-poverty’ districts
In ‘high-poverty district’?
Hospital HC AP Total
No 11 28 37 76Yes 2 12 13 27
Total 13 40 103 103
HFs from our sample designated as ‘high-poverty’ were fairly evenly distributed across ecological regions, although there were relatively more in Momase (10) and fewer (4) in the Highlands. We contrasted overall tracer medicines availability measures (as described in Section 5) for HFs in ‘high-poverty’ compared with ‘non-high-poverty’ districts (available for 91 HFs after excluding APs that were not visited). We also disaggregated this by the three levels in the health system. These results are presented in the table below and demonstrate equal availability of essential tracer medicines in high poverty districts. The pattern of overall lower availability at the AP level is seen, as in Section 5, but even at the AP level, there is no difference between ‘high-poverty’ and ‘non-high-poverty’ districts.
Table 17: Medicines availability by ‘high-poverty’ districts
‘High-poverty district’?
Overall availability% of relevant tracer medicines
(95% CI)
Availability by health system level% of relevant tracer medicines
(95% CI)
Hospital HC AP
No 62%(56.5 – 67.3)
90%(82.7-99.1)
74%(65.5-82.3)
49%(43.6-53.8)
Yes 70%(59.9 – 80.5)
100%(NA)
79%(67.6-89.7)
46%(41.3-51.2)
Note: Confidence intervals (95%) are displayed, not for statistical testing (given the purposeful sampling) but to show the spread of standard error in these samples.
Page 57 of 81
Year One Evaluation Report Medical Supply Reform Impact Evaluation
The table below provides a similar analysis, disaggregated for medicines that were distributed only in the ‘push’ system, compared to those distributed by ‘push’ system supplementing ‘pull’ systems.
Table 18: Medicines availability by ‘high-poverty’ districts and distribution method
‘High-poverty
district’?
Availability by distribution% of relevant tracer medicines
(95% CI)
Availability by health system level and distribution method% of relevant tracer medicines
(95% CI)
‘Pull’ only‘Push’
supplementing ‘pull’
HC AP
‘Pull’ only‘Push’
supplementing ‘pull’
‘Pull’ only‘Push’
supplementing ‘pull’
No 44%(35.3-51.8)
66.8%(61.0-72.5)
51%(38.7-63.7)
79%(70.6-87.7)
27%(17.5-37.0)
53%(48.0-58.5)
Yes 56%(39.3-73.0)
76%(66.6-86.1)
69%(56.7-82.3)
81%(68.0-94.5)
6%(0.0-19.9)
60.0(53.8-66)
Page 58 of 81

Year One Evaluation Report Medical Supply Reform Impact Evaluation
Our findings suggest that the kits (‘push’) system is likely to have contributed more, relative to the ‘pull’ system, to medicines availability in disadvantaged areas. Most qualitative data from HF interviews back up this finding, with many HF staff reporting that a kit delivery has meant a new level of medicines availability in their facility.
To cross-check, we also performed the same analysis using a different definition of ‘high-poverty’ districts, based on the 20 districts with the lowest Human Development Index rating, adapted to PNG districts by McGillivray and presented at a conference at Deakin University in April 2012. On this scale 35 of surveyed HFs were in ‘high-poverty’ districts. As with the analysis above, availability was similar in both ‘high-poverty’ (66% of tracer medicines across all HFs) and ‘non-high-poverty’ (62%) districts across all levels in the health system. With the McGillivray ranking, however, the distinction between ‘pull’-only and ‘push’-supplemented medicines is not seen.
8.1.2. Remoteness and access
For use by the management contractor CKP, certain HFs were coded as ‘remote’ and contract conditions with transporters aimed to ensure that remote HFs did not get left behind in either timing or completeness of deliveries. Those coded as remote comprise: 107 HCs, by region: 34 Southern, 17 Highlands, 33 Momase and 23 Islands; and 321 APs, by region 56 Southern, 67 Highlands, 138 Momase, and 60 Islands. We examined contractor records and the availability data in our HF survey to assess whether ‘push’ system 100% kits were reaching remote facilities.
We analyzed CKP’s own report of the first round of deliveries to HCs and to APs looking at the rate of completion of deliveries in the round, as at end of May 2013, weighted by the number of HFs in each province. This is presented in the table below, consolidated by region because that was the basis for transport company contracting.
Table 19: Completion (%) of round one deliveries, by remoteness and regionSouthern Highlands Momase Islands
HC AP HC AP HC AP HC APNot
remote 97% 84% 100% 100% 91% 71% 96% 95%
Remote 85% 63% 100% 100% 33% 30% 78% 62%
Note: Contractor-supplied data supplied as at 28/5/2013
When comparing remote HFs with non-remote, at the HC level there is good coverage of remote HFs in Southern and Highlands, and reasonable coverage in Islands. At AP level there is good coverage only in the Highlands region, with fair coverage in Southern and Islands region. In Momase, there is clear difficulty in the ‘push’ contractors reaching HFs designated as remote, whether HC or AP. We also analyzed our HF survey data comparing medicines availability in HFs coded as remote or not coded as remote. The table below shows the proportion of tracer medicines available across all facilities, disaggregated by remoteness coding, for the whole database, and then disaggregated further, by distribution method in HCs and APs, in Southern and Momase regions34.
Table 20: Medicines availability by remoteness, health system level and distribution methodAvailability Availability by health system level and distribution method
34 Deficiencies in the coding database meant we were only able to code these regions at the time of analysis, however future work may be able to provide more detailed comparisons.
Page 59 of 81

Year One Evaluation Report Medical Supply Reform Impact Evaluation
overall% of
relevant tracer
medicines(95% CI)
% of relevant tracer medicines(95% CI)
HC APSouthern Momase Southern Momase
‘Pull’ only
‘Push’ and
‘Pull’*
‘Pull’ only
‘Push’ and
‘Pull’*
‘Pull’ only
‘Push’ and
‘Pull’*
‘Pull’ only
‘Push’ and
‘Pull’*
Not remote
63%
(57.4-68.5)
67% (42.5-90.8)
84% (65.
9-100.0)
54%
(26.4-82.0)
83%
(71.2-95.5)
29%
(9.6-48.7)
52%
(40.5-63.7)
5%
(0.0-14.2)
51% (40.1
-62.3)
Remote57%
(45.5-68.2)
33%
(NA)
80%
(60.7-100.0)
55%
(33.5-77.6)
56%
(26.4-84.8)
67%
(0.4-100.0)
55% (26.4-84.8)
17%
(0.0- 49.8)
50%
(NA)
Note: Confidence intervals (95%) are displayed, not for statistical testing (given the purposeful sampling) but to show the spread of standard error in these samples. * Medicines distributed by the ‘push’ system supplementing the ‘pull’ system.
The spread of confidence intervals in these measures, especially for the ‘pull’ only AP measures, suggests they should be interpreted with caution, however the trends here do match those seen in the contractor data (above) and the qualitative data (below). The previous trend to higher availability when the ‘push’ system supplements the ‘pull’ system continues in these data, and at the AP level there is equivalent availability in both remote and non-remote sites. Also seen is the difficulty for the ‘push’ system in reaching HCs in Momase region – as was also demonstrated in the contractor’s data, and difficulty for the ‘pull-only’ system to reach remote HCs in Southern region.
Overall, these analyses suggest that the ‘push’ systems of distribution are likely to have contributed to equitable availability of medicines, findings confirmed by the disaggregated analysis of qualitative data (details in Annex 11.4.2), which showed HFs in high-poverty districts, and those coded as remote, reporting a similar weight of positive opinion regarding kit supplementation as non-disadvantaged HFs.
Useful indices of both remoteness and poverty remain pressing needs for public sector analysis and planning in PNG. The database being collected by the ‘push’ system distribution of medical supply kits can continue to play a part in these discussions, especially given the increasing accuracy of geographical information being collected as deliveries proceed. Within our HF survey were included WHO indicators to measure distance travelled to facilities by patients that we interviewed (see also information in Section 7). Among the 487 patients we interviewed, ten patients (2%) were outliers, reporting having travelled more than 24 hours to get a HF (seven taking two days). After excluding them from the analysis it took on average 57 minutes (median 30 minutes) for patients to reach a HF – slightly longer to reach a HC/SC (68 minutes) and less to an AP (28 minutes). Accessibility is defined by WHO as being able to reach a HF within one hour of walking. This suggests that, of the patients we interviewed, there were a small proportion who travelled extreme distances, but the majority had acceptable access. It is essential, though, to note the bias in our sample – in that we surveyed patients who had already successfully reached a health facility.
The 2009-10 Household Income and Expenditure Survey[9] reported that in rural areas 74% of visits to a HF required walking (22% car, 2% boat), making accurate estimates of distance an important element of future field work, including correlation of this evaluation’s information with future community-based population surveys.
Page 60 of 81

Year One Evaluation Report Medical Supply Reform Impact Evaluation
8.1.3. Impact on health services
The findings above and in Section 5 demonstrate a plausible increase in availability of certain essential medicines, with availability maintained in areas of disadvantage, most likely through the impact of the ‘push’ system of kits distribution acting as a supplement to the routine ‘pull’ system. The qualitative data from HF survey interviews, and to a lesser extent from health managers, suggests that increased availability translates to increased capacity to provide health services.
Most interviewees felt the ‘push’ system of delivery of the 100% kits (and in some cases the earlier 40% kits) straight to the health facility represented a significant expansion of their capacity. This was especially noted from AP staff, the most peripheral level and the level where the greatest boost has been needed to achieve equitable access to health care. AP staff experienced this as a new level of support, with many noting they had not experienced this level of supply stocks previously. Many, from both HC and AP levels, linked this to a greater ability to improve provision of services, especially in rural or difficult areas. This is discussed further in the equity-oriented review of the qualitative data below.
Many comments from all levels detailed the impact of the ‘push’ system on HF service delivery capacity, reporting that ‘push’ system kits addressed some deficiencies in the routine system so as to ensure they had a more complete set of medical supplies to address their catchment area’s health needs.
As noted in the district hospital comment above, many HF staff noted the impact in enhanced ability to treat patients, especially at the AP level; “Since the start of this program, more patients are admitted at the aid post, instead of the health centre at Yampu or the hospital.” (AP, Highlands). In some cases, additional medicines were noted to increase staff capacity to provide new services: “Officer learnt new knowledge of unfamiliar drugs from catalogue” (AP, Southern), “Good to see usage of zinc for diarrhoea [at peripheral levels]” (Hospital, Highlands). “…IDA supplements the supply from AMS. Gave workers exposure to new drugs.” (AP, Southern).
Other specific service impacts were occasionally noted, for example: “Treatment of malaria has improved” (AP, Momase, referencing the vertical program), “Supplies of codeine helped in pain where previously there was none in stock.” (District hospital, Southern), “Helps improve the health of the community, for example some fungal infections are not often seen as before” (AP, Islands). Other specific impacts included reports from managers and staff working in conflict-affected districts stating that the presence of kits and a ‘push’ system option made it easier to re-open closed rural facilities with more rapid re-commencement of services.
The HF survey also examined service capacity in EMONC, discussed below.
8.2. Linking medicines availability to improved survivalKey finding: The medicines usage data indicate that much of the supplementary kit contents have been a good fit for the disease profile in PNG, noting that most reports of non-usage of kit medicines related to issues of staff training or authorization, and that most medical supplies are being used to manage conditions of population health importance. While program impact on morbidity and mortality cannot be directly measured at present, the increase in medicines availability combined with our usage data may be used to model likely increases in case management coverage and subsequent improved survival. As demonstration of part of the potential impact of increased medicines availability, we
Page 61 of 81

Year One Evaluation Report Medical Supply Reform Impact Evaluation
modelled a possible coverage increase just in childhood pneumonia management as averting an extra 416 child deaths by 2013 compared to 2010, using the Lives Saved Tool.
8.2.1. Evaluation plans for examining mortality impact, and use of CFR
As noted in the evaluation plan (see Annex) part of the overall aims of this multi-year evaluation were to link changes in medical supplies to changes in population health, especially examining survival gains for women and children. Critical data in the chain of contribution are the degree to which increased medical supplies lead to increased coverage with life-saving interventions (both preventive and curative services). Also required are data on the burden of disease in PNG and the relative efficacy of interventions that rely on medical supplies. All these data sources are in short supply in PNG at present. In particular there are no population-based surveys of intervention coverage (including interventions such as pneumonia management employing antibiotics), morbidity or mortality, which post-date the introduction of the recent ‘push’ programs. Conduct of such a large enterprise was not deemed cost-effective if solely for the purpose of this impact evaluation.
To provide some immediate proxies by which to estimate the survival impact of increased medicines availability, this evaluation attempted to measure pneumonia case fatality rates (CFR) and emergency obstetric care trends in HFs. Two reasons for choosing pneumonia CFR were that it is the only relevant health outcome measure routinely collected in the NHIS, and that the first-line medicine prescribed by child health STGs is amoxicillin, a product included in the 40% and 100% kits. The survey sampling purposefully sought HFs in districts where CFRs were known to be high. The intention was to undertake internal comparisons between varying levels of medicines availability and CFR and emergency obstetric care coverage; to try to detect an effect size of any measured change in availability. A secondary aim was to collect HF measures of CFR to compare with and help validate the NHIS indicator.
The intention of using CFR to provide an immediate comparator for impact assessment provided impossible due to limitations found in record-keeping at HFs during the survey. Measuring this required questions about pneumonia admissions (only inpatient pneumonia is included in the NHIS indicator) and deaths. Unfortunately, very few HFs had reliable historical records of admissions and deaths, and those that did tended to be hospitals, rather than the HCs or APs, which were the main focus of the ‘push’ programs. We did find some data on pneumonia admissions and related deaths in about half of the facilities we visited but many of the data were verbal reports reliant on staff memory. From this, we have calculated rates in 52 HFs that reported admitting children under five years of age for treatment of pneumonia. Examining the children admitted with pneumonia (range 0-494; median 2, mean 18), and the number that died (range 0-12) gives:
an overall average CFR of 4.0% across all facilities, but with a wide range (0-50%); at five hospitals, an average case fatality rate (CFR) of 15.4% (range 0-50%; median 2.3%); at HC/SC an average CFR of 2.3% (range 0-37.5%; median 0%); and at APs an average CFR of 3.3% (range 0-50%; median 0%).
These hospital rates are significantly higher than that reported for hospitals in the 2011 NDOH Child Mortality and Morbidity Report[11] of 5.6% for 2010 and 6.1% for 2011. This is most likely due to problems in our estimates: being based on interviews, having small sample sizes, and low denominators which could easily result in overestimations in rates.
Discussion with the Monitoring and Research Branch of NDOH suggest there are plans to increase data availability. Given that we have been able to generate some trend measures (in Section 5) from a detailed reanalysis of NHIS raw data, similar gains may be possible from future analysis of CFRs in the national database. Other options include integrating analysis of medicines availability data from this evaluation with future population-based surveys, such as a demographic and health survey, that may be comparable with recent benchmarks established in the national census of 2010.
Page 62 of 81

Year One Evaluation Report Medical Supply Reform Impact Evaluation
It is also planned that this year one measurement of medicines availability will be repeated in several years, which will give a reliable measure of any change in availability. This change can be used in conjunction with other population-based surveys that provide information on intervention coverage and mortality rates, as above, or in future modelling exercises, as discussed below, to provide more information on the impact of increased medical supplies on mortality.
8.2.2. Modelling impact on survival, of changes in medicines availability
As noted, the contribution to improved survival rests on increased medicines availability being used to provide life-saving interventions. The medicines usage data in our survey indicate that much of the supplementary kit contents have been a good fit for the disease profile in PNG, noting that most reports of non-usage of kit medicines related to issues of staff training or authorization, and that most medical supplies are being used to manage conditions of population health importance.
We have also demonstrated a plausible increase in availability of essential medicines supported by the supplementary ‘push’ programs, such as amoxicillin (see Section 5.1). When combining this increase in availability with our usage data, it is reasonable to assume that this enables an increase in coverage with interventions that make use of these medicines. This is especially the case in a setting where frequent stock-outs had compromised services in the recent past, as demonstrated in our qualitative findings. Hypothetical increases in intervention coverage can be used in WHO-approved standard modelling tools to estimate the impact on mortality; in this case the Spectrum software incorporating the Lives Saved Tool (LiST35). LiST draws on international multi-country analyses of disease burden and efficacy of interventions[12, 13], tailored to individual countries, including PNG, to enable such modelling.
To illustrate this modelling we examined just one use of amoxicillin, for case management of childhood pneumonia. Our data in Section 5 suggest a halving of stock-outs in amoxicillin over the past three years. As tabled below, if we postulate that this corresponds with a 20% increase in coverage with case management for pneumonia over the period from 2010 to 2013, then this equates to an additional 416 child (under-five years) deaths averted, compared to the base case with no increase in coverage of pneumonia case management. It is important to note the various assumptions: that increased availability does translate to increased case management, and that the LiST estimates of disease burden and intervention efficacy are accurate for PNG.
Table 21: LiST modelling of child deaths averted through increased coverage with pneumonia case management
Additional child (under 5) deaths averted, relative to the baseline year (cumulative)
Medicines availability leads to 20% increase in case management coverage
Base case: no change in medicines availability
Year All child deaths averted
Newborn deaths averted
All child deaths averted
Newborn deaths averted
2010 0 0 0 02011 225 0 88 02012 462 46 188 482013 616 46 200 47
35 Available from several sources, for example: http://www.jhsph.edu/departments/international-health/centers-and-institutes/institute-for-international-programs/list/
Page 63 of 81

Year One Evaluation Report Medical Supply Reform Impact Evaluation
The LiST tool, and other modules within the Spectrum software such as for family planning, are modifiable, allowing tailoring to more accurate PNG data when available. They can also give combined estimates of the impact of a large range of interventions. For example, interventions during pregnancy can be adjusted to account for proportion of births taking place in HFs, and proportion with access to varying levels of emergency obstetric care.
LiST and related tools are often combined with modelling of health-system bottlenecks to provide more comprehensive and accurate pictures of mortality impact. Bottle-neck modelling allows planners to estimate what proportion of low coverage with pneumonia case management is due to non-availability of medicines, what proportion is due to lack of trained staff, what proportion is due to inaccessible facilities, and what proportion due to low utilization by the community. Established methods for this are well described and have been used in many countries[14], but not yet in PNG.
The evaluation team strongly recommends making use of the availability data in this report, and that which might be obtained through additional analysis of 2013 NHIS data next year, to characterise the impact on mortality that could be achieved through gains in medical supplies availability. The team are reluctant, however, to undertake this without close partnership and detailed consultation with national government and technical partner stakeholders. This consultation especially needs to focus on the assumptions around the relative importance of different health system bottlenecks and the trustworthiness of data being used in the software. This is an integral part of the modelling process and experience elsewhere, conducted with the Australian Government and UNICEF support[15], show it is critical to its success.
8.3. Health services readiness for EMONC and potential health impactKey finding: Review of HF EMONC readiness, and of the spectrum of treatments made available through 100% kits, also establishes benchmarks for measurement of future progress in the health system’s capacity to manage important diseases.
This aspect of the evaluation was conducted in partnership with a UNFPA/NDOH team also assessing readiness for emergency obstetric and newborn care. That team took responsibility for assessment at provincial hospitals, using an adapted assessment tool from the WHO Collaborating Program, Averting Maternal Death and Disability. Our evaluation further adapted this tool (see Annex 11.1) so we could feasibly apply harmonised measurements at the HC/AP level. Our results will be combined with those obtained by the UNFPA/NDOH team. There is qualitative evidence, observed during survey visits, of the provision of the Australian Government supported EMONC kits to hospitals and HCs, but absence of prior availability data meant we could not quantify this in the same way as for medicines. Thus the main focus of this part of the evaluation was to establish baselines useful to NDOH and development partners.
We assessed the level of service coverage provided at these facilities. Among 71 sites (38 HC/SCs and 33 APs): 48% of HC/SC reported carrying out some childbirths in the last three months, with half, 24% of total, reporting more than 31 childbirths. Among APs, 48% reported having delivered some childbirths in the last three months, of which 3% delivered more than 31 childbirths. This suggested a relatively low level of activity in supervised delivery at the APs that we surveyed.
Our survey aimed to assess levels of equipment, whether they had been used, and whether staff at the facilities had EMONC skills, regardless of equipment levels. Detailed tables of results for individual items of equipment and individual skills are provided in Annex 11.2. At APs, overall only 6% had the necessary equipment and 42% reported having some skills (but not all skills that comprise basic EMONC) to perform EMONC. Rates were higher in HC/SC where 58% of HC/SC had EMONC equipment available and 67% reported having the skills to practice EMONC. In examining
Page 64 of 81

Year One Evaluation Report Medical Supply Reform Impact Evaluation
the difference in equipment levels at the HC level, compared with APs, it is worth noting that equipment ‘push’ systems so far have only extended to the HC level.
Among HC/SCs the equipment most often found to be lacking were those for: blood transfusion (79% not available); steroids for use in premature labour (46%); and general anaesthetic medicines (41%).
Note that under current classifications in the EML, ketamine can only be ordered by doctors/HEO and anaesthetic technical officers (ATO) and halothane by doctors/ATOs only. Extending the use of ketamine to HC/SC may be feasible given 70% of HEO in the survey were at HC/SCs. Skills most often reported as lacking among HC/SCs related to:
caesarean section (18% reported this skill); blood transfusion (36% reported this skill); and giving medicines for HIV during delivery (48% reported this skill).
Among APs, currently the most frequently reported skills related to active management of third stage of labour (72% reported this skill) and removal of the placenta (67% reported this skill).
Page 65 of 81

Year One Evaluation Report Medical Supply Reform Impact Evaluation
9. Implications and Recommendations9.1. Current situation and cross-cutting observations9.1.1. Availability of medicines, equity, access to care, and impact of the kits programs
The findings described above give a measurement of medicines availability and usage in 2013 that compares well with measures in other comparable countries in PNG’s region. They also provide a reliable baseline by which future measurements can quantify the impact of progress in governance, procurement, supply chain and other systems development. The limited currently available trend data discussed in this report suggest that overall medicines availability has not declined in the past four years and has increased for some particular essential medicines of high public health importance, such as antibiotics for pneumonia, oral rehydration solution for diarrhoea, and new antimalarials. This report’s findings also suggest that gains in availability are largely due to the ‘push’ programs, including ‘40%’ and ‘100%’ distributions. The contribution of the 100% kits is especially important at the most peripheral Aid Post level. Qualitative and quantitative data show that the ‘push’ distribution has been highly valued in all facilities, but especially so in more remote facilities, contributing to greater availability of medicines at this level than has been experienced in the past.
Overall the 100% kits and ‘push’ program has contributed to improved equity in medicines availability. The HF survey in this evaluation was designed to include remote facilities and those from high-poverty districts, and the measured availability of essential tracer medicines was equal in both disadvantaged and other settings. This is an indication of program penetration to underserved populations with positive outcomes for equity of access to health care. Our findings (described above) suggest that the kits (‘push’) system is likely to have contributed more, relative to the ‘pull’ system, to medicines availability in high-poverty districts. The overall lower availability at AP level does suggest that more needs to be done to preferentially target this level of care. Again, our data suggest that the particular contribution of ‘push’ systems is especially important in poorer districts at the peripheral level. Most qualitative data from interviews back up this finding.
The medicines usage data suggest that the kit medicines content have been a good fit for the disease profile in PNG, noting that most reports of non-usage of kit medicines related to issues of staff training or authorization, rather than absence of the relevant disease. Improvements are possible in more accurate quantification of needs and, to a lesser extent, in kit contents (noting that the evaluation team endorse the revised kit contents proposed for 2014). Analysis of rational medicines usage shows appropriate use of many medicines for life-threatening conditions such as pneumonia, malaria and complications of childbirth, although some specific areas for improvement (for example: under-use of zinc for diarrhoea) were noted. This usage assessment suggests that quality of care varies across the health system, and is worse at the HC/SC and AP levels for some specific conditions and for general over-use of medicines. Some essential services assessed, particularly emergency obstetric and newborn care, are not yet widely available to remote communities, a constraint that represents a major hindrance to universal access to health care in PNG.
Given that the medicines usage data suggest that all supplies, including the kits, are being used to manage some of the most important conditions of the rural majority and urban poor, such as pneumonia or malaria, it can be concluded that the 100% kits and ‘push’ programs are addressing key threats to population health. While program impact on morbidity and mortality cannot be directly measured at present, the increase in medicines availability is plausibly contributing to better case management and increased survival for women, children and men in PNG. As demonstrated in the section above, the data measured in this year one evaluation can be modelled to quantify the estimated lives saved in this way – a process best done in collaboration with in-country stakeholders, as recommended in Section 9.3 below.
Page 66 of 81

Year One Evaluation Report Medical Supply Reform Impact Evaluation
These findings call for continued investment in both ‘push’ and ‘pull’ system development, and in future evaluation of progress and impact, as discussed below and in the evaluation plan annexed. It is also important to include in both development and evaluation, assessments of the way in which available medicines are used: a critical determinant of improved access to care.
9.1.2. Transparency and accountability
The difficult area of transparency and accountability was raised by interviewees at all levels: in health facilities and by district and provincial health managers, as well as by government and non-government staff in major centres. There was general acknowledgement that this had been a serious problem across the medical supplies system, accompanied by a sense that many informants perceived or hoped that improvements were being seen. Some developments, such as international competitive tendering with aspirations for stringent quality criteria in the 2014 tender for medical kits, seemed to present cause for optimism, however full implementation of this planned development remains lacking. For other systems at national level, our data gathering suggests there is a general desire for more transparent and accountable governance structures than in the past, but again implementation of this appears currently lacking in important areas, as described in sections three and four.
In peripheral levels, the strong focus of contract management that aims to ensure supply of intact consignments right to the health facility door seems likely to have contributed to the increasing medicines availability. This emphasis, particularly the necessary consequence that intermediaries cannot examine and break-up kit consignments even in the interests of efficiency, has possibly missed some opportunities for fine-tuning by district and provincial health managers. Greater involvement of this level, based on our findings, is clearly essential to better functioning of future kit programs. Greater involvement of district managers in decisions as to where and when ‘push’ system deliveries can best take place does not seem to pose unreasonable additional risks to security of supply.
However greater involvement of intermediaries will need to continue to balance these competing priorities. Manager consultations reveal stories of abuse in both ‘pull’ and ‘push’ systems, including anecdotes where 100% kits were delivered to incorrect sites, subjecting the supplies to potential theft or misuse. This is of note even though the majority of qualitative data, especially from health facility staff, supports contractor reports that only a very small proportion of kit deliveries experienced irregularities. Exceptionally, some managers and a few HF staff interviews reported that even though the 100% kit medicines have been branded ‘GoPNG-Not for Resale,’ there have been credible reports of these medicines being sold on the streets and in unauthorized shops, with investigation by local authorities underway (more detail in Annex 11.4). This reinforces the need for continuance of the stringent monitoring of delivery that is currently a feature of 100% kits contracting.
There was a strong desire expressed by many health managers for greater accountability to be demanded of health staff at all levels, with many seeking greater penalties and more regular consequences to be applied when wrongdoing is uncovered. This evaluation suggests that one key to greater accountability is achieving a greater flow of accurate information in the system. This may be through more stringent contract management in both ‘pull’ and ‘push’ systems, such as demanding data to verify intact deliveries, but may also occur through improved logistics information management, including wider deployment of a eLMIS, that helps all stakeholders clearly see volumes and timing of supplies as they move through the system.
Page 67 of 81

Year One Evaluation Report Medical Supply Reform Impact Evaluation
9.1.3. Capacity development and sustainability
Throughout health manager surveys and FGDs, human resource issues were a commonly raised theme, even though there were no specific questions about it. The lack of skilled workforce in the health sector is a widely acknowledged systems issue in PNG. A variety of staffing and training issues were raised, with weaknesses at all levels of the health system acknowledged. The majority of comments highlighted the need for a larger number of qualified staff at the provincial, district and health facility level – especially pharmacists:
“Pharmacist positions should be created in each province; with the aim of training health centre OICs and monitor medical supplies. These Pharmacists would also liaise with the PTS, AMS and PHO.”
One logical response could also include re-examination of pharmacy assistants as a useful cadre: most larger health facilities had recruited a number of staff to the equivalent of this position in fact. Gaps in staffing has led to a greater burden being placed on existing staff, leading to mis-management of stock and a lack of supervision:
“Often health workers are either too busy or not trained to do proper stocktake and stock rotations.”
Health facility staff agreed with this point seeking pharmaceutical expert training in new medicines, new protocols and issues such as dealing with unfamiliar presentations (such as dispersible tables for liquid medicines or suppositories for seriously unwell patients) and generic labelling. Further information can be found in Annex 11.4.
Sustainable improvement in supplies management at the facility level also requires greater attention to the training in and implementation of SOPs for pharmaceutical management. This again was related to human resource deficiencies with supportive supervision to deliver this proving difficult for over-worked pharmacists to provide. Proposals for regular outreach to facilities, such as those raised by the pharmacist at Mt Hagen AMS are surely worthy of further examination.
This evaluation involved a taxing national survey that was designed and conducted in a very short time frame, with field-work travel to more than 100 rural sites by survey teams of two or three taking place over just 15 days. The successful, incident-free fulfilment of this task is testament to the logistic and security capabilities of the HHISP. It is also true that this could not have taken place without the energetic participation of the academic staff and 61 students of the Department of Pharmacy at UPNG. The evaluation team draw an important sustainability lesson from this experience: the active engagement with academic stakeholders makes such data gathering possible in a short time, and also, by treating the exercise as a joint research activity, creates an academic home for the findings and methods. This ownership is likely to sustain recognition and usage of evaluation findings into the future. The challenge for later years of this evaluation is to also create links with PNG’s fledgling community of evaluation expertise to extend this even further.
9.2. Program recommendations from the evaluation teamWhile the primary intention of this evaluation was to commence a multi-year assessment of progress and impact, there are programmatic recommendations that emerge for the evaluation team. These are listed below, firstly a short list of the most important, and secondly a listing of more detailed recommendations that address various parts of the medical supplies system. Many of these echo developments currently underway.
Page 68 of 81

Year One Evaluation Report Medical Supply Reform Impact Evaluation
9.2.1. Key recommendations for various stakeholders
1. From 2014, once GoPNG has reached a clear position on governance structures: all agencies should work to strengthen transparency, value-for-money and an emphasis on quality assurance for health procurement structures, governance and institutional arrangements; including the outsourcing of procurement and supply chain operations accompanied by more detailed and stringent contract and performance management in the ‘pull’ system (which may draw on some of the procedures developed under the recent kits distribution).
Applicable to GoPNG central agencies (including procurement authorities), NDOH, provincial health agencies, development partners
2. From 2014 over next three to five years: continue the ‘push’ system of kit distribution, with out-sourced distribution directly to facilities (including APs), to promote equitable coverage until the ‘pull’ system reaches agreed benchmarks for accurate needs-based supply.
Applicable to NDOH and Ministry of Health, development partners3. From 2014 over next two years: quantification for both ‘push’ system distribution kits and
the NDOH multi-year procurement plan should be enhanced by integrated estimates that maximize all available information: from vertical programs and AMS medicines usage records, the ‘pull’ system’s vital and essential medicines review, and new eLMIS data; and also be informed by rapid operational research (by WHO or another technical partner) into the full range of medicines usage and disease threats in a representative sample of HCs, SCs, and APs. This may allow revision of the NDOH multi-year plan in two years’ time.
Applicable to NDOH, development partners4. From 2014 over next three years: intensify support to other current medical supplies
management reforms, as in the MSPD reform plan, particularly: expanded introduction of the eLMIS (mSupply) to regional AMS and pilot provincial locations; integration of distribution resources and systems across ‘pull’, ‘push’ and vertical programs; and expanded quality assurance staffing, equipment and procedures for whole of system monitoring.
Applicable to NDOH, development partners, provincial health agencies, government and non-government health facilities with existing eLMIS
5. From 2014: Support provincial and district involvement in management and quality improvement for both ‘push’ system kits deliveries and the handling of medical supplies in rural facilities through planning meetings of contractors and provincial/district managers prior to kit deliveries; and support stronger integrated supervision of medicines management and rational usage within provinces by increasing pharmacist and pharmacy technician positions and placements in provincial health agencies, including PTS, as well as supporting existing district/provincial managers and/or AMS staff in supervision visits at HFs.
Applicable to provincial health managers, NDOH, development partner activity planners, non-government health planners, local health NGOs
6. From 2014: continued commitment to evaluation, tracking progress and impact using the benchmarks in this first year’s work, maintaining the academic partnership with UPNG (noting their benefits in capacity development and sustainability) and other technical partners, as well as review of findings in this report and the detailed recommendations below to inform program management. Consider review of the NHIS stock-out indicator.
Applicable to program managers at national and provincial levels, in government and development partner programs, NDOH, development partners
9.2.2. Detailed recommendations for national planning, financing and procurement
National planning and budgeting
From 2014, reconsider the length of the multi-year procurement plan (proposing two years rather than three years) to allow for review and re-planning after two years (as new data come in), in an integrated quantification and planning process including vertical programs
Page 69 of 81

Year One Evaluation Report Medical Supply Reform Impact Evaluation
and kit medicines (with reference to usage data in this evaluation), and support operationalization of this plan as soon as possible following the vital and essential medicines review.
Immediate rapid operational research into the full range of medicine usage patterns at representative health facilities (HC, SC and AP), matched with local profiles of disease36 and the degree of rational medicines usage, along with analysis of the detailed usage data in this evaluation’s survey, as an interim quantification tool until more comprehensive and timely routine usage data become available from an eLMIS and other sources. Over the next three years, consider structured involvement of provincial and district managers in planning content lists for kits.
Over three to five years, plan for continuation of supplementary kit ‘push’ systems, until the ‘push’ system reaches agreed development benchmarks (perhaps until it can undertake accurate needs-based supply of the majority of health facility orders).
This evaluation has demonstrated an alternative presentation of the data already collected within the NHIS, providing a stronger focus on specific vital and essential medicines. This approach, and alignment with WHO measures, could be considered in review or expansion of the current Indicator 27, that consolidates stock-out measures.
Procurement tendering and governance Once GoPNG has reached a clear position on governance structures, all agencies
(government and development partner) should work to strengthen transparency, value-for-money and an emphasis on quality assurance for health procurement structures, governance and institutional arrangements, once; including the outsourcing of procurement and supply chain structures operations by more detailed and stringent contract and performance management (which may draw on some of the procedures developed under the recent kits distribution).
From 2014: institutionalise appropriate quality requirements for medicine suppliers (including, but going beyond ISO certification for greater guarantees of agent quality), perhaps with consideration of the assessment tools developed by WHO Model Quality Assurance for Procurement Agents (MQAS) which were piloted last October 2012 in conjunction with Quality Medicines for All (QUAMED) that provides a harmonized assessment of procurement agencies. Linked to this: continue to pursue consistent branding exemplified by the “GoPNG. Not for resale.” labeling used in kit medicines.
Quality control and regulation
From 2014: review and rationalize items on the EML, prioritizing current work on vital and essential medicines and including a review of the category of medicines, in relation to STGs, that should be available at different levels (including APs) in the health system.
From 2014: NDOH pursue implementation of the agreements between NDOH and UPNG for quality assurance testing and on the quality assurance position within WHO; and renew options for testing medicine quality through international partners.
9.2.3. Detailed recommendations on supply chain systems
National planning and governance of distribution From 2014 over the next three years: NDOH undertake stepwise integration of both ‘pull’
and ‘push’ distribution systems, including contracting, quality and performance management, along with active engagement of resources and information within vertical programs (including tuberculosis medicines) also needing to distribute supplies.
36 Perhaps drawing on WHO tools such as at http://apps.who.int/medicinedocs/en/d/Jh2931e/3.html
Page 70 of 81

Year One Evaluation Report Medical Supply Reform Impact Evaluation
From 2014: as noted above, increase the detail and stringency of ‘pull’ system contract and performance monitoring (perhaps drawing on some ‘push’ system procedures for validating deliveries and/or delivery confirmation by text message available in mSupply) with LD Logistics to make clear contract conditions, charges and performance targets, undertake formal review of distribution performance (as data are likely to be now available) as well as consideration of increasing the variety and flexibility of arrangements with transport providers to ensure best value for money and efficiencies are achieved by tailoring agreements to local conditions.
Over next three to five years: NDOH inclusion of performance monitoring indicators in the MSPD multi-year plan, possibly including close follow-up of purchase orders, spot checks on supply, frequency of emergency orders, order-to-delivery times, and other indicators of supply chain function once an eLMIS is operational.
Warehousing and medical store stock management Immediate: NDOH and development partners continue to roll out an eLMIS (mSupply)
including additional pilots in AMSs outside Badili and some trial hospitals with uptake capacity, including government and non-government facilities that have already established eLMIS and can pilot data to improve health facility supplies ordering.
From 2014: NDOH work with development partners for a coordinated approach to AMS refurbishment, incorporating the 2013 Badili AMS needs assessment and considering how this assessment may help specify needs at Mt Hagen and Lae AMSs, which also need to be refurbished as planned.
Distribution practices for ‘push’ system for kits From 2014: To expand consultation, ‘push’ system program managers should support
provincial and district involvement in management and quality improvement for both ‘push’ system kits deliveries and the handling of medical supplies in rural facilities through planning meetings of contractors and provincial/district managers prior to kit deliveries, that may identify the functional facilities, the optimum timing of deliveries, and the number of kits each require. Expand expectations of any transport contractors to include a consultative partnership approach with local health authorities that includes adequate communication with local health managers, for example through including evidence of joint planning meetings as part of payment conditions. Boxes should be labeled to indicate contents and support consultation for fine-tuning of delivery needs.
From 2014: To ensure verification, ‘push’ system program managers should continue existing contract and performance monitoring, considering enhancements such as: identifying a management agent to supervise transport contractors and coordinate with the pharmaceutical supplier; continuing use of ‘Geo-pics’ as part of proof of delivery with consistent camera equipment and training; signed minutes of the meeting with provincial/district health managers; where relevant locations and delivery estimates were discussed.
9.2.4. Detailed recommendations on availability, usage and handling of essential medicines in health facilities
Over the next three years: NDOH, provincial health managers and health workforce planners support stronger integrated supervision of medicines management and rational usage within provinces by increasing pharmacist or pharmacy technician positions and placements in provincial health agencies, including Provincial Transit Stores as a key component of provincial systems, as well as supporting existing district/provincial managers and/or AMS staff in supervision visits at HFs. This may require review of pharmaceutical workforce education and planning.
Page 71 of 81

Year One Evaluation Report Medical Supply Reform Impact Evaluation
From 2014: NDOH and development partners engaged in health workers training to review survey findings on errors in rational medicines usage and management of supplies and HF stores to inform in-service training plans, including the Rural Health Facility Management Training program scheduled for 2014 – 2017.
Over next two to three years: NDOH and technical partners such as WHO revise and update the current information provided with kits, and increase the variety of information distribution methods to provide rational medicines use information, for example simple rational medicines use bulletins sent with kits addressing pertinent topics, updated terminology or labeling (e.g. generics) and new medicine uses (e.g. dispersible tablets), with a focus on good quality job aids suitable for display in HFs and development of simple up to date SOPs for medicines management.
Over next two to three years: NDOH and technical partners such as WHO develop simple, user-friendly STGs oriented to CHWs needs and the treatment portfolio of Aid Posts.
From 2014: NDOH MSPD and rural health sections review medical supplies storage needs at standard HC/SC and AP, and incorporation of these into plans for new facilities, including Community Health Posts.
9.2.5. Detailed recommendations on community engagement
From 2014: NDOH MSPD implement community engagement strategies as expressed within the medical supply reform plan, with a focus on education to reduce pressure for over-use of medicines such as antibiotics, generation of community support for quality-assured supply and avoidance of unauthorised sale of medicines, and protection of supply chains, health staff and facilities during periods of civil unrest.
Over next two to three years: Consideration for development of a ‘customer service’ hotline in NDOH MSPD to allow community members to register opinions on medicines access or report system abuses.
Page 72 of 81
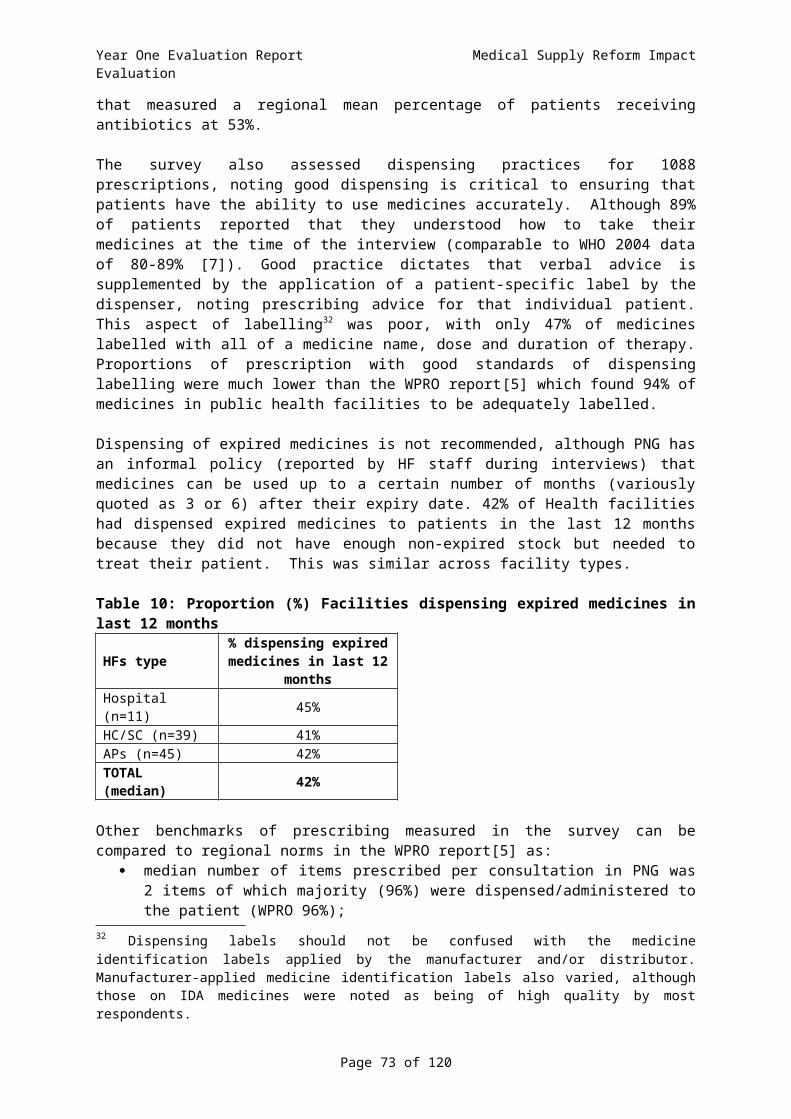
Year One Evaluation Report Medical Supply Reform Impact Evaluation
9.3. Future monitoring and evaluation9.3.1. Background to a multi-year plan
The original TORs for this evaluation foresaw a multi-year program of assessment to track progress in medical supplies reform until approximately 2016. A full multi-year plan, meeting international standards for evaluation rigour, has been developed with support from development partners, particularly the Australian Government. The multi-year plan is available separately. The plan recognises the importance of medical supplies to health system functioning, the level of investment in kit programs as well as overall system development by the GoPNG, the Australian Government and other development partners.
During consultations with health managers a range of opinions were expressed, supporting the need for further monitoring and evaluation. When commenting on the type of indicators that could be measured to ensure the effectiveness of the medical supplies system, many noted that although most health facilities completed the NHIS form, the data collected were not used to report back to the respective health facility, provincial or district staff; and health managers generally felt that the data weren’t being used to inform broader procurement systems. Our re-analysis of the NHIS (Section 5) demonstrates that a more nuanced analysis of the current dataset is possible, with potential for finer detail in display of progress. An extension of this analysis to other items currently reported in the NHIS system could play a role in informing managers at all levels.
Many managers highlighted the role that monitoring data could play to improve accountability within the medical supplies system, for example:
“Agreeing on specific indicators to monitor systematically should be the starting point. In the interim, there should be someone to assist in ‘kick-starting’ the process. Systematic evaluation processes should be implemented.”
Comments delineate a strong need for an evidence based approach to the medical supply system, which would utilise data to inform gaps and highlight blockages within the system. More information can be found in Annex 11.4.
This consultation was continued through presentation of the draft Year One findings to a Technical Review Committee on 6th December 2013, with agreement from both NDOH and other stakeholders on the areas of emphasis and types of indicators needed. This included work to achieve consensus on benchmarks and performance judgments for the impact evaluation, and identification of data availability and quality for identified data needs. Presented below are proposals to extend the follow-up of this year’s evaluation work and respond to these local desires for strong monitoring and evaluation.
9.3.2. Possible evaluation activities in Years 2 to 4
Below are brief notes on proposed evaluation work that has been discussed and refined through discussion with in-country stakeholders. As noted, these are aligned with the separate multi-year evaluation plan. A guide to the evaluation directions in that plan can be found in the current Year One Evaluation Plan (Annex 11.5).
On a yearly basis: Desk review of relevant policies, procedures, SOPs, system reviews and evaluation reports; Full description of the medical supply reform program as it is being implemented including
changes/adaptations in the planning documents and implementation guidance and descriptions of other relevant programs working in conjunction with the medical supply reform program;
Review of key outputs and agreed benchmarks including data quality assessment, including impact measures for Year 4.
Page 73 of 81

Year One Evaluation Report Medical Supply Reform Impact Evaluation
Year 2 (2014) – an emphasis on medicines quality and regulation: Support for and linkages to prospective operational research into comprehensive medicines
usage at representative HFs, as proposed by WHO and the NDOH – to inform the quantification of national supplies;
Monitoring of quality assurance systems, including support to data collation and analysis in relevant sections of NDOH (for example MSPD and Pharmaceutical Supplies and Standards) and tracking of the outcomes of quality testing undertaken in 2014;
Triangulation of HF survey results from this report against other surveys conducted in PNG including the past Household Income and Expenditure Survey (HIES) (conducted in 2009-2010 and likely repeated in 2015) and the current Public and Private Expenditure Survey;
Analysis of relevant NHIS data to expand the description of trends in medical supplies, incorporate data from 2013 (updating the analysis begun in Section 5 of this report), and examine linkages between medical supply-related indicators and health-related indicators in the NHIS. This may also inform revision of the reporting of medicines stock-outs in the annual sector performance review. A linked activity should be to undertake a more comprehensive modeling of lives saved (as in Section 8 of this report), along with government and partner health manager consultations on bottlenecks to service delivery, and consensus discussions on what constitutes good ‘value-for-money’ in this area;
Review all available distribution data (once contractor spreadsheets have been updated) in both ‘pull’ and ‘push’ systems to update the analysis of distribution begun in Section 4;
Other evaluation tasks that could be considered include:o Initiate good practice case studies such as the ‘push’ and ‘pull’ supply chain
management to explore in depth determinants of a successful system; o Targeted data reviews of progress in kits distribution and documentation of any
measures against the NDOH medical supplies reform plan indicators.
Year 3 (2015): an emphasis on medicines distribution: Updated analysis of NHIS to expand the description of trends in medical supplies; Continued analysis, including 2014 data, of enhanced monitoring data from NDOH and
provincial agencies, and of contractor delivery records, for review of distribution efficiency in both ‘pull’ and ‘push’ systems; and
Targeted data reviews of progress in kits distribution and documentation of any measures against the NDOH medical supplies reform plan indicators.
Year 4 (2016): an emphasis on medicines availability and usage, and overall system review: Repeat implementation of the health facility survey, including client and community surveys,
to update and extend measurements made in the Year One evaluation; Updated analysis of NHIS to expand the description of trends in medical supplies, and
health-related indicators in the NHIS; Targeted data reviews of progress in kits distribution and documentation of any measures
against the NDOH medical supplies reform plan indicators; Follow-up on good practice case studies initiated in Year 2 of ‘push’ and ‘pull’ supply chain
management to explore in depth determinants of a successful system, with a particular focus on the phase-out of ‘push’ systems if that is anticipated;
Key informant interviews with stakeholders at all levels; and Formal assessment of program impact through contribution analysis that:
o Reviews impact data from years 1 – 4;o Models health service and outcome data, for example using service proxies for
maternal mortality, measured case-fatality-rates for childhood pneumonia and service coverage estimates based on types of expansion noted in medical supplies availability;
o Establishes a counterfactual case using historical data collected through years 1 – 4.
Page 74 of 81

Year One Evaluation Report Medical Supply Reform Impact Evaluation
9.3.3. Potential benchmarking indicators
The first steps in the consultations noted above included gaining consensus on the most appropriate benchmarking indicators to monitor reform processes and also establish progress in the impact of improved medical supplies in terms of stronger health systems and better population health. This included a discussion by this evaluation’s Technical Review Committee following their review of the Year One findings. An additional 14 evaluation indicators are proposed.
The proposed indicators below aim to align with the current NDOH Medical Supplies Reform Plan of the MSPD, and also the monitoring and audit responsibilities of the Pharmaceutical Supplies and Standards Branch. Measurement of these indicators will benefit from external support, but should be led by, and serve the needs of, those agencies. The evaluation team also note that , for the benefit of sustainability and capacity development, successful evaluation work in coming years must link with local evaluation expertise, particularly that within the Monitoring and Research Branch of the NDOH, but also with other PNG evaluation experts such as members of the PNG Association of Professional Evaluators.
The indicators below are categorised according to medicines supply system categories (as used for reporting findings in this report) and incorporate process indicators already listed as Key Performance Indicators in the MSPD reform plan
National planning, procurement and regulationNDOH process indicators already planned:
Procurement and Supply Management Governance: a Medical Supplies Procurement Committee will be operational and meeting monthly with reports and minutes provided to the SEM Committee;
Pharmaceutical Supply and Tenders Board: the PSTB is operational and meeting fortnightly with reports and minutes provided to the SEM committee;
Three Year Procurement Plan: The 3 year procurement plan is developed and key milestones are achieved;
Policies and Standard Operating Procedures: SOPs are relevant to the tasks and work activities are being performed, available, understood and adhered to as recorded in regular work performance appraisals;
Quality Assurance: QA processes are in place, targets are being met for quality of goods received and loss through expiry is reduced;
Staff Development / Capacity Building: Staff are trained and competent to perform their roles in accordance with role descriptions and as recorded in regular work performance appraisals.
Proposed additions from this evaluation: Indicator 1. Percentage of the total value of contracts that were awarded through an open
and competitive processes, with adherence to processes as planned by GoPNG, and review of contract outcomes (Note: this, as with many of suggested indicators below, is based on international norms, as tabled below);
Indicator 2. Multi-year procurement plan execution rate, including: o Integrated procurement planning, based on prospective assessment of
comprehensive medicines usage at facilities and mSupply datao Percentage, by value and number, of purchase orders or contracts issued as
emergency orders;o Budget allocation, release of funds, and expenditure against budget;
Page 75 of 81
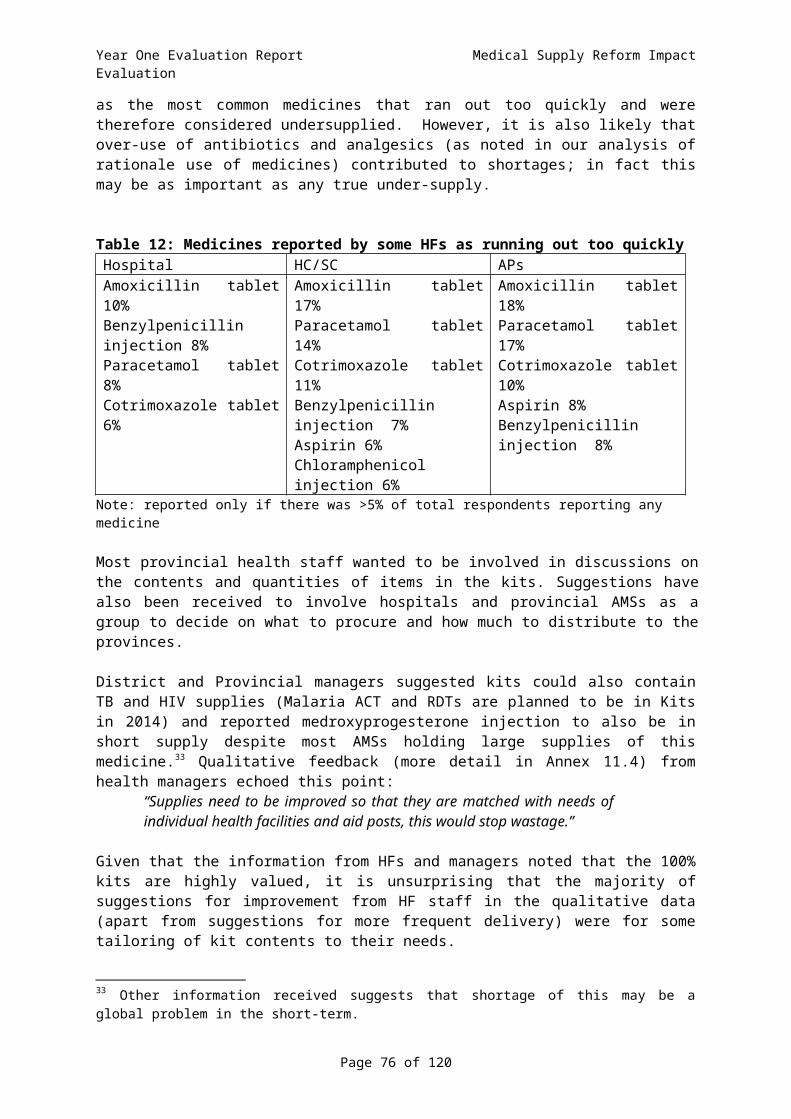
Year One Evaluation Report Medical Supply Reform Impact Evaluation
Indicator 3. Percentage price variance between contract unit price and international unit price for focus products, emphasizing vital and essential medicines;
Indicator 4. Percentage of individual products/lots/shipments entering the country that undergo quality testing over a specific period of time, as defined in national guidelines (for all vital and essential medicines), outcomes of testing as proportion of medicines tested;
Indicator 5. Pharmaceutical Supplies and Standards Branch systems monitoring against new National Medicines Policy, including: rates of licensing failure for organisations, adverse events reporting, functioning of Medicines and Therapeutics committees at facilities.
Supply chain systemsNDOH process indicators already planned:
LMIS – mSupply: mSupply will be implemented on time, on budget and in accordance with approved project plans;
Medical Supply Kits: Kits to be supplied on time and in accordance with the required quality standards;
Logistics / Distribution Arrangements: Logistics contract to be performed in accordance with the contracted terms and conditions, NDOH is receiving good value for money and deliveries are being made as and when required to health facilities;
AMS Refurbishments: AMS Refurbishments to be completed on time, on budget and in accordance with the approved project plans.
Proposed additions from this evaluation: Indicator 6. Distribution performance, including: (a) average amount of time (i.e., days) from
the moment an order is received at the storage facility until the time the order is actually shipped to the health facility (by type of facility, geographical area), [and complementary timing for frequency and duration of ‘push’ deliveries] and (b) percentage of items ordered that are actually received (correct quantities with the correct products);
Indicator 7. Stock out rate at AMS, focused on vital and essential commodities.
Availability and usage of essential medicines in health facilitiesNDOH process indicators already planned:
Vital and Essential Medical Supplies Availability: Vital and Essential Medical Supplies availability both in AMSs and in health facilities to the required levels and order fulfilment times in accordance with stated targets.
Proposed additions from this evaluation: Indicator 8. Availability of essential medicines at various levels in the health system, using
the WHO standard indicator; Indicator 9. Percentage of facilities ((a) AMS; (b) health facility type) that experienced a
stock-out of a specific product (e.g., all vital and essential medicines; certain tracer medicines) that the site is expected to provide, at any point, within a defined period of time;
Indicator 10. Percentage tracer cases treated according to Standard Treatment Guidelines.
Storage and management of medical supplies in health facilitiesProposed additions from this evaluation:
Indicator 11. Storage and handling of medical supplies, against WHO standard criteria.
Page 76 of 81

Year One Evaluation Report Medical Supply Reform Impact Evaluation
Community engagementNDOH process indicators already planned:
Communication and Engagement Strategy: Communications and engagement with key stakeholders is effective as measured by feedback from customers, quarterly reviews and reports on the work performance of MSPD and the AMSs, as well as relevant national health indicators.
Proposed additions from this evaluation: Indicator 12. Community experiences of medicines costs, quality of dispensing and attitudes
to medicines availability, against the WHO standard criteria and other measures.
Health services, population health impact and equityProposed additions from this evaluation:
Indicator 13. Percentage of districts (by geographical area and other equity criteria) with the capacity to treat important diseases, including EMONC;
Indicator 14. Estimated impact on survival and morbidity of increased medicines availability.
Page 77 of 81

Year One Evaluation Report Medical Supply Reform Impact Evaluation
10. References and List of Selected Background Documents 10.1. References1. Ministerial Task Force on Medical Supplies, Medical Supplies Technical Review Mission,
Report on Key Findings and Recommendations, 2008, MInistry of Health: Port Moresby.2. Health and HIV Implementation Services Provider, Specialist Procurement Adviser Report.
National Department of Health and Australian Government, 2012.3. Central Operations Services Unit, Papua New Guinea Country Procurement Assessment
Report, 2006.4. National Department of Health Papua New Guinea, The National Medicines Policy, 2013.5. World Health Organization, Synthesis Report of Pharmaceutical Country Profiles 2011
(DRAFT), 2011, Western Pacific Regional Office of WHO: Manila.6. Nair, A., et al., Are counterfeit or substandard anti-infective products the cause of treatment
failure in Papua New Guinea? J Pharm Sci, 2011. 100(11): p. 5059-68.7. World Health Organization, Using indicators to measure country pharmaceutical situations.
Fact Book on WHO Level I and Level II monitoring indicators, 2006, WHO: Geneva.8. Inder, B., et al., Papua New Guinea: Modeling costs and efficiency of primary health care
services in Papua New Guinea, 2009, Monash University: Australia.9. National Statistical Office, Papua New Guinea Household Income and Expenditure Survey
2009-2010, 2011, Government of Papua New Guinea: Papua New Guinea.10. Datt G, F.D., Parajuli D, Hwang V, Cumpa M, Ackland R, Walker T, Poverty Assessment of
PNG, 2004, World Bank Country Office: Port Moresby.11. National Department of Health, Annual Report on Child Morbidity and Mortality 2011, 2012,
NDOH: Papua New Guinea.12. Boschi-Pinto C, Y.M., Black RE, The Child Health Epidemiology Reference Group reviews of the
effectiveness of interventions to reduce maternal, neonatal and child mortality. International Journal of Epidemiology, 2010. 39(Suppl 1): p. i3-6.
13. Walker N, F.-W.C., Bryce J, Bahl R, Cousens S, Standards for CHERG Reviews of Intervention Effects on Child Survival. International Journal of Epidemiology 2010(39(suppl 1)): p. i21-31.
14. Rudan I, K.L., Tomlinson M, Balliet M, Cohen B, et al., Evidence-Based Priority Setting for Health Care and Research: Tools to Support Policy in Maternal, Neonatal, and Child Health in Africa. PLoS Med., 2010(7(7)): p. e1000308.
15. Jimenez Soto E, L.V.S., Clark A, Firth S, Morgan A, et al. , Developing and Costing Local Strategies to Improve Maternal and Child Health: The Investment Case Framework. PLoS Med . 2012(9(8)): p. e1001282.
10.2. Selected Documents used in Year One PNG Health System Capacity Development Program: Design and Implementation Framework,
2011, Australian Government: Australia. Baghdada-Sabeti, G., J. Cohen-Kohler, and E. Wondemagegnehu, Measuring Transparency in the
Public Pharmaceutical Sector Assessment Instrument, 2009: Geneva. Baker, J. and G. Robins, Papua New Guinea: Support for Public Expenditure Review and
Rationalization, 2008, PDP Australia: Australia. Bauze, A.E., et al., Equity and geography: the case of child mortality in Papua New Guinea. PLoS
One, 2012. 7(5): p. e37861. Brudon, P., J.-D. Rainhorn, and M.R. Reich, Indicators for monitoring national drug policies,
1999, World Health Organization: Geneva. Cammack, D., Chronic Poverty in Papua New Guinea, 2008, Chronic Poverty Research Centre:
United Kingdom.
Page 78 of 81

Year One Evaluation Report Medical Supply Reform Impact Evaluation
Central Operations Services Unit, Papua New Guinea Country Procurement Assessment Report, 2006, World Bank.
Central Supply and Tenders Board, PNG Procurement assessment report: using the OECD-DAC methodology for assessing procurement systems, 2010: Papua New Guinea.
Charles Kendall and Partners, Assessment of government partner procurement capability and capacity, and associated procurement risk; Final assessment report, 2011, Charles Kendall and Partners.
Chokshi, M., Tamil Nadu Public Drug Procurement Model, 2009: New Dehli. Filed, P., J. Hudson, and G. Yeime, Medical Supplies and Drug Management Standard Operating
Procedure, Training Attachment and Moudles, 2008, Department of health, Papua New Guinea Government: Papua New Guinea.
Gibson, J., G. Datt, and B. Allen, Mapping Poverty in Rural Papua New Guinea, 2004. Hardon, A., C. Hodgkin, and D. Fresle, How to investigate the use of medicines by consumers,
2004, World Health Organization: Geneva. Hollaway, K.A., et al., have we improved use of medicines in developing and transitional
countries and do we know how to? Two decades of evidence. Tropical medicine and international health, 2013. 18(6): p. 656-64.
Inder, B., et al., Papua New Guinea: Modeling costs and efficiency of primary health care services in Papua New Guinea, 2009, Monash University: Australia.
John Snow Inc, Getting products to people: The JSI Framework for Integrated Supply Chain Management in Public Health, 2012, John Snow Inc: USA.
Kaplan, W. and M. Mathers, The World Medicines Situation Report 2011, 2011, World Health Organization: Geneva.
Matai, S., et al., Implementing an oxygen programme in hospitals in Papua New Guinea. Ann Trop Paediatr, 2008. 28(1): p. 71-8.
McNee, A., Medical supplies reform in Papua New Guinea: Some conceptual and historical lessons, 2011, Australian National University: Australia.
Ministerial Task Force on Medical Supplies, Medical Supplies Technical Review Mission, Report on Key Findings and Recommendations, 2008, MInistry of Health: Port Moresby.
Ministry of Health, Papua New Guinea Pharmaceutical Country Profile, 2012, Government of Papua New Guinea: Papua New Guinea.
Nair, A., et al., Are counterfeit or substandard anti-infective products the cause of treatment failure in Papua New Guinea? J Pharm Sci, 2011. 100(11): p. 5059-68.
National Department of Health, Ministerial Taskforce on Maternal Health in Papua New Guinea, 2009: Papua New Guinea.
National Department of Health Papua New Guinea, National Health Plan 2011-2020, Policies and Strategies, 2010, Government of Papua New Guinea: Papua New Guinea.
National Department of Health Papua New Guinea, Standard Treatment Guidelines for Adults. 6th edition, ed. W.H. Organization2012, Papua New Guinea: Government of Papua New Guinea.
National Department of Health Papua New Guinea, Medical and dental catalogue. 10 ed2012, Papua New Guinea: Papua New Guinea Government.
National Department of Health Papua New Guinea, National Medicines Formulary. 1 ed2012, Papua New Guinea: Papua New Guinea Government.
National Department of Health Papua New Guinea, The National Medicines Policy 2013, Draft of 15 July 2013, Papua New Guinea: Papua New Guinea Government.
National Department of Health Papua New Guinea, National health plan 2011-2020, 2013 Sector Perormance Annual Review, 2013, Government of Papua New Guinea: Papua New Guinea.
National Research Institute, Papua New Guinea District and Provincial Profiles, 2010: Papua New Guinea.
Page 79 of 81

Year One Evaluation Report Medical Supply Reform Impact Evaluation
National Statistical Office, Papua New Guinea Household Income and Expenditure Survey 2009-2010, 2011, Government of Papua New Guinea: Papua New Guinea.
Pan American Health Organization, Rapid pharmaceutical assessment - An indicator-based approach, 1995, Pan American Health Organization: USA.
Papua New Guinea Health Sector, National Health Plan (2011-2020), Monitoring and Evaluation Strategic Plan, NDoH, Government of Papua New Guinea: Papua New Guinea.
Pulford, J., et al., Malaria case management in Papua New Guinea prior to the introduction of a revised treatment protocol. Malar J, 2012. 11: p. 157.
Rao, R., P. Mellon, and D. Sarley, Procurement Strategies for Health Commodities: An Examination of Options and Mechanisms within the Commodity Security Context, 2006, DELIVER Project: USA.
Seiter, A., A practical approach to pharmaceutical policy, 2010, World Bank: Washington. Singh, P.V., et al., Replicating Tamil Nadu’s Drug Procurement Model. Economic & Political
Weekly, 2012. Spinks, J. and J. Richardson, Paying the right price for pharmaceuticals: A case study of why the
comparator matters, 2010, Monash university: Victoria. Sustainable Solutions, mSupply installation at NDOH Papua New Guinea: Preliminary visit
report, 2013: New Zealand. The Child Health Advisory Committee, Papua New Guinea Annual Report on Child Morbidity and
Mortality 2011, 2012: Papua New Guinea. The Lancet (editorial), Strengthening global action against poor quality drugs. The Lancet, 2013.
381(9867): p. 599. Tran, L.N., et al., Under-five mortality Analysis for Papua New Guinea. UN Procurement Capacity Development Centre, Applying the Principles for Good International
Engagement in Fragile States and Situations to Strengthen and Transform Public Procurement Systems, 2011, UN Procurement Capacity Development Centre: Geneva.
Wild, L. and D. Cammack, The supply and distribution of essential medicines in Malawi, 2013, Overseas Development Institute: London.
World Health Organization, How to Investigate drug use in health facilities, 1993: Geneva. World Health Organization, Measuring medicine prices, availability, affordability and price
components, 2008: Switzerland. World Health Organization, Harmonized monitoring and evaluation indicators for procurement
and supply management systems: Early-warning indicators to prevent stock-outs and overstocking of antiretroviral, antituberculosis and antimalaria medicines 2011: Geneva.
World Health Organization, Regional framework for action on access to essential medicines in the Western Pacific (2011-2016), 2012, World Health Organization: Geneva.
Page 80 of 81

Year One Evaluation Report Medical Supply Reform Impact Evaluation
11. Annexes11.1. Health Facility survey methodology
11.2. Detailed findings and data tables from the health facility survey
11.3. Other data collection tools
11.4. Qualitative analysis from managers survey and discussions
11.5. Year One Evaluation Plan
11.6. Health Facility Surveys tools
11.7. Evaluation team and roles
11.8. Assessment against standard Australian Government evaluation criteria.
Page 81 of 81