acronyms - · pdf filemis management information system ... udcc upazila development...
TRANSCRIPT

Acronyms
BADC Bangladesh Agriculture Development Corporation BFRI Bangladesh Fisheries Research Institute BME Benefit Monitoring and Evaluation BWDB Bangladesh Water Development Board CAD Command Area Development DAE Department of Agriculture Extension DD Detailed Design DI Drainage Improvement DLIAPEC District Level Interagency Project Evaluation Committee DLS Department of Livestock Service DoF Department of Fisheries EIA Environmental Impact Assessment EIRR Economic Internal Rate of Return EME Effect Monitoring and Evaluation FM Flood Management FMD Flood Management and Drainage FS Feasibility Study FSDD Feasibility Study and Detailed Design FY Fiscal Year GoB Government of Bangladesh ICM Integrated Crop Management IEE Initial Environmental Examination IPM Integrated Pest Management IWRMU Integrated Water Resources Management Unit JICA Japan International Cooperation Agency LCS Labour Contracting Society LGD Local Government Division LGED Local Government Engineering Department MIS Management Information System NGO Non-Governmental Organization O&M Operation and Maintenance PMO Project Management Office PRA Participatory Rural Appraisal PSC Project Steering Committee RDA Rural Development Academy (Bogra) SP Subproject SRDI Soil Resources Development Institute SSW-1 Small Scale Water Resources Development Project-1 (1996-2002) SSW-2 Small Scale Water Resources Development Project-2 (2002-2009) SSW-3 SSWRD Project in Greater Mymensingh, Sylhet & Faridpur (2009-2015) SSW-4 Participatory SSWRD Project (2010 - 2016) UDCC Upazila Development Coordination Committee UP Union Parishad WC Water Conservation WMCA Water Management Cooperative Association

ii
F AR M C AT E G OR IE S Land Holding
Farm Category (ac) (ha)
<0.01 < 0.01 Landless 0.01 – 0.49 0.01 - 0.19 Marginal Farmer 0.50 – 2.49 0.20 – 1.00 Small Farmer 2.50 – 7.49 1.01 – 3.03 Medium Farmer
>7.50 >3.03 Large Farmer LAND CATEGORIES
Depth of Monsoon Flooding Land Category
(m) (ft) 0 0 Highland
0-0.9 0-3 Medium Highland 0.9-1.8 3-6 Medium Lowland 1.8-3.0 6-10 Lowland
>3.0 >10 Bottom Land SUBPROJECT TYPES
Subproject Type Typical Works
CAD Command Area Development
Development of existing irrigation schemes by providing better water distribution systems (improved canal network, lining of canals, installation of buried pipelines, installation of control structures, etc.) to extend the irrigated area
DR Drainage Re-excavation of drainage channels (khals) to increase the capacity of drainage systems to benefit agriculture as well as fisheries and local navigation
FM Flood Management Rehabilitation and / or construction of embankments and / or sluices / regulators to reduce the extent and duration of flooding of farmland
WC Water Conservation
Development of the water retention capacity of existing haors, beels, and channels to increase availability of irrigation water by installing water retention structures and by re-excavating the bed of water bodies and channels
FMD Flood Management & Drainage Combinations of the above - there are many different
possible combinations FMWC Flood Management &
Water Conservation
iii
CONTENTS I. INTRODUCTION 1
A. Document Purpose 1 B. Data Collection 1 C. Capital Investment Costs 3
II. INSTITUTIONAL PERFORMANCE ASSESSMENT 4 A. Membership and Capital Funds 4 B. Poverty Reduction 4 C. Skill Development, Empowerment and Income Generating Activities 5
III. AGRICULTURE PERFORMANCE ASSESSMENT 7 A. Introduction 7 B. Land Use and Incremental Crop Production – Summary 7 C. Winter Season (2012 – 2013) 10 D. Pre-Monsoon (Kharif I) Season (2013) 11 E. Monsoon (Kharif II) Season (2013) 13 F. Extension Support 14 G. Production Trends 15
IV. FISHERIES PERFORMANCE ASSESSMENT 18 A. Introduction 18 B. Summary of Performance 19 C. Performance of Different Categories and Types of Subprojects 21
V. OPERATIONAL PERFORMANCE ASSESSMENT 25 A. Subprojects Handed-Over 25 B. Capacity Building and O&M Plans 25 C. O&M Performance Assessment 25
Annex A: Tables Table A-1: Subproject Areas and Construction Costs Table A-2: WMCA Membership, Capital Funds and O&M Contributions Table A-3: Micro-credit Loans Table A-4: Agriculture Land Use by Subproject in 2013 Table A-5: Rabi (Winter) Agriculture Production by Subproject in 2011-2012 Table A-6: Pre-Monsoon (Kharif-I) Agriculture Production by Subproject in 2013 Table A-7: Monsoon (Kharif II) Agriculture Production Summary by Subproject in 2012 Table A-8: Fishery Assessment FIndings

Eme Report 2013 (2) - 1 - 13 August 2014
I. INTRODUCTION
A. Document Purpose
1. The purpose of the annual Effect Monitoring and Evaluation (EME) reports is to document the changes in agriculture and fisheries production that have occurred as a result of the investments in water management infrastructure in subprojects completed under the Small Scale Water Resources Development Sector Projects. Efforts are also made to provide some insight into the overall institutional strength of the respective water management cooperative associations and the operational status of these subprojects. 2. The current Project, SSW-3 in Greater Mymensingh, Sylhet and Faridpur Areas monitors subprojects using the same monitoring framework1
3. Separate from the annual EME reports Impact Assessment studies are carried out to determine longer term impacts of the subproject investments. These comprise two major steps, a Baseline Survey for 20 subprojects and then the actual Impact Assessment carried our 5 years after the completion of the subprojects. The Baseline studies and reports were completed in 2012 and 2013
used for the SSW-1 and SSW-2 projects of ADB. This is the second SSW-3 EME report and is prepared after completion of the first 83 subprojects. In total development of 235-250 SPs is planned under the Project (revised DPP, 2013).
2
B. Data Collection
.
1. Subprojects and Period Covered
4. This 2nd EME report report is for the first 83 subprojects to be completed. Preparation of these subprojects started from April 2009. Construction works were completed by March 2013, except for some subprojects for the WMCA offices. 5. The data used in this EME refers to the following periods:
i. Construction Costs
• Engineers Estimate: 2010-2011 and 2011-2013 LGED Schedules of Rates
• Contract Amounts: tendered amounts in 2010/11; 2011/12 and 2012-2013
ii. Institutional data • As of April 2014
iii. Agricultural data • Rabi (winter) crop: December 2012 to March 2013 • Pre-monsoon (Kharif I): April to July 2013 • Monsoon (Kharif II): July to November 2013
iv. Fisheries data • To end 2013
v. Operation and Maintenance data
• As of April 2014
1 A suite of Guidelines is expected to be prepared over the next 2-3 years for SSWR development and is
expected to include for improved monitoring and grading assessments as part of maintenance support and performance enhancement, along with improvements to the MIS system. If implemented these additional data will considerable strengthen the EME reports, particularly the institutional and operational performance assessments.
2 The final baseline synthesis (summary) report was submitted in November 2013. Baseline reports for the 20 individual subprojects were submitted over several months from late 2012.

Eme Report 2013 (2) - 2 - 13 August 2014
6. Details of subproject location, area and type are given in Table A-1 and summarised below. Twenty seven of the subprojects are “non-regulatory”, ie infrastructure works comprise just khal excavation and / or embankment strengthening, while fifty four are “regulatory” with investments in (gated) water management structures as well as earthworks, and two are CAD (buried pipe irrigation system) types. The category and type of subproject has implications for operation and maintenance.
Category
of SP Type of
SP Nr Area (ha)
Avg Area (ha) Cost (Tk million) Unit Area Cost
Tk /ha US$/ha CAD CAD 2 960 480 61.9 61.9 64,500 806
Regulatory (Gated)
WC&CAD 1 540 540 19.8
912.3
36,700 458 FMD&WC 12 6,680 557 236.3 35,400 442 WC 9 3,712 412 176.5 47,500 594 FM 2 1,334 667 25.3 18,900 237 DR&WC 13 8,445 650 200.6 23,700 297 FMD 13 5,667 436 183.0 32,300 404 FM&WC 3 1,545 515 51.9 33,600 420 FMD&IRR 1 800 800 18.9 23,700 296
Non-regulatory (no gates)
DR&IRR 20 10,872 544 178.2 235.6
16,400 205 DR 7 4,365 624 57.4 13,200 164
Totals 83 44,920 541 8 1,209.8 26,933 337
2. Operation and Maintenance Data
7. O&M training for LGED district and upazila staff and for the WMCA committee / O&M sub-committee members started in May 2013. No O&M data for individual subprojects are available for this report. 8. It is envisaged that O&M data will first be prepared by the WMCAs with the assistance of the Assistant Engineer and the Upazila Engineers, and then forwarded to LGED’s IWRM Unit through the district Executive Engineers. All data will then be entered in the Project’s MIS.
3. Institutional and Related Data
9. Institutional and related data were obtained from reports submitted by the Community Participation Officers based in each district, and also by the project consultant’s institutional development staff.
4. Agriculture Data
10. Agriculture data for the three cropping seasons: (i) winter season (2012-2013), (ii) Kharif I 2013, and (iii) Kharif II 2013 was collected by the SSW-3 Agriculture Facilitators posted at district level. In some cases the Department of Agricultural Extension field officers, the Sub-Assistant Agriculture Officer were also consulted.
5. Fisheries Data
11. Fisheries data for 2013 were collected and submitted by the SSW-3 Fisheries Facilitators. The fisheries data base is rather weak. These data are probably among the most difficult to collect. Another problem is the lack of a reliable baseline (pre-Project) for fisheries data.

Eme Report 2013 (2) - 3 - 13 August 2014
C. Capital Investment Costs
12. The capital investment cost for each subproject varied from Tk 35.6 million for SP33053 Lunglia Chara in Moulavibazar to just Tk 2.3 million for SP32016, Mamudpur-Jikarbari in Gopalganj, and averaged Tk 14.6 million (US$ 182,200 / subproject). 13. SP33053 Lunglia Chara is a water conservation (regulatory) type of subproject and the high costs are due to four rather large water retention structures as well excavation of two khals. By contrast SP32016, Mamudpur-Jikarbari is a drainage & irrigation (non-regulatory) subproject where only khal excavation works were carried out. 14. About 64% of the investment cost was for water management structures (and WMCA offices where these were provided) constructed by professional contractors. The remaining 36% of the investment cost was for earthworks, both khal excavation and embankment strengthening, and was done by LCS groups, see Table A-1. 15. LCS works used to be wholly carried out manually by locally employed (usually landless) men and women. However in recent years, and for bulk excavation of large volumes of soil, excavators are also being used. 16. WMCA Offices have been built1
1 Some of the offices are still under construction, May 2013
for 70 of the 83 subprojects, where land was made available. In other subprojects rented buildings are used by the WMCAs. 17. Unit area construction costs varied from Tk 6,670 / ha to Tk 118,700 / ha (US$ 83 – 1,480 / ha) and averaged Tk 26,900 / ha (US$ 337 / ha). 18. The construction cost of the 54 regulatory subprojects was Tk 912.3 million, with unit costs varying from US$ 237 to 594 / ha. These subprojects make up 75.4 percent of the investment to date. Good gate operation is required to make the most of the regulatory structures. 19. The construction cost of the 27 non-regulatory subprojects was just Tk 235.6 million, with unit costs varying from US$ 164 to 205 / ha. These subprojects make up 19.5 percent of the investment to date. These are the cheapest type of subprojects as they have no regulatory (gated) structures, however their long term effectiveness depends maintenance of the earthworks, in particular removal of sediments from channels. 20. The construction cost of the two regulatory subprojects was Tk 61.9 million, with unit costs averaging US$ 806 / ha. These subprojects make up just 5.1 percent of the investment to date. To be effective intensive training and support for operation is required, including support for WMCAs to procure pumps.

Eme Report 2013 (2) - 4 - 13 August 2014
II. INSTITUTIONAL PERFORMANCE ASSESSMENT
A. Membership and Capital Funds
21. Membership and the accumulation of capital funds is reviewed over time and the current position for the 83 completed subprojects is tabulated in Table A-2 and subproject averages are given below:
• Area: 541 ha • Number of beneficiary households: 459 • Number of members per subproject: 331 (male) and 91 (female) • Capital funds per subproject: Tk 133,500 (US$ 1,670) • Capital funds per member: Tk 306 (US$ 3.83) • O&M funds collected per subproject: Tk 223,700 (US$ 2,796), 99.5% of target • O&M funds collected per member: Tk 667 (US$ 8.34)
22. Capital funds include: (i) shares – each member is required to buy a minimum number of shares at a fixed price per share; (ii) savings – any member may save money with the WMCA capital account thereby increasing his / her shareholding, interest accrues according to the number of shares held; and (iii) other – for example donations from interested party or sale of communal assets. The proportion of capital funds from shares, savings and other is as follows:
• Savings: Tk 79,352 / SP (59.4%) • Shares: Tk 38,665 /SP (29.0%) • Other: Tk 15,484 / SP (11.6%) • Total: Tk 133,501 / SP (100%)
23. Capital funds are available for use by members who wish to take out small loans. At the end of March 2014, micro-credit had been initiated in just fourteen of the 83 completed subprojects and data for these is given in Table A-3. For these fourteen subprojects the total loan amount disbursed averaged Tk 317,830 / subproject (US$ 3,973), of which Tk 157,000 (49%) had been repaid. Borrowers were mostly men (80%), and the average loan amount was Tk 8,600 (US$ 108) to 517 borrowers. 24. Interest rates on loans are typically 15% / year, made to individuals and / or small groups and paid back within 12 months. 25. It is too early to draw conclusions concerning WMCA and subproject sustainability – this will depend on O&M activities as well as membership, saving trends and micro-credit activities. B. Poverty Reduction
26. LCS earthworks for khal excavation and embankment strengthening are intended to provide employment opportunities to rural poor, men and women. For the 83 completed subprojects the LCS investment averaged 5,219,000 / subproject (US$ 65,200). Over the years the use of excavators for large, bulk excavation has gradually increased, with labour being used to spread and compact the excavated material and dress side slopes. Nonetheless LCS works remains a valid pro-poor way of implementing earthworks works. 27. After construction poor / destitute women are often engaged to plant and take care of tree saplings on embankments and / or along khals.

Eme Report 2013 (2) - 5 - 13 August 2014
28. Longer-term and more sustainable employment will result from infrastructure maintenance activities, from increases in agriculture production, and from increases in fish production. C. Skill Development, Empowerment and Income Generating Activities
29. Skill development and empowerment play an important role in providing individuals with better control over their economic and social environment. Skill development is related to the training for resource management (agriculture and fisheries) that is provided by the Project. Empowerment comes through the networks that are established for, by, and on behalf of the local stakeholders with various government and non-government agencies. These include linkages to support income generating activities. 30. Farmers are provided with training on improved agriculture practices, integrated pest management, and so on. This translates into increased production, which increases farm incomes and generates employment. The Project also provides training to fishers to extend skills related to pond aquaculture, establishing and operating nurseries and so on. While much of these trainings are for men, the Project includes women in many of the courses, for example for seed production and establishment of homestead gardens. 31. To ensure that women benefit from the Project, special trainings are arranged for women with a focus on Income generation. The categories of income generating activities that have been supported by the Project are tabulated below, and comprised: (i) livestock, poultry, vegetable gardening and fish cultivation for women; (ii) tailoring; and (iii) handcrafts.
Category of Training No. of Batches
No. of SPs
Duration No. of Participants
Trainee Days
Impact Assessment Grading* Very Good
Good Moderate Poor
Training on small-livestock, poultry, vegetable gardening & fish cultivation
11 22 3 days 254 762 20 83 136 15
Training on Tailoring 08 09 25 / 30 days
104 2,660 5 40 50 09
Training on handicrafts (Nakshi-kantaha)
02 03 7 / 30 days
41 620 - 10 14 17
Training on handicrafts (Candle making)
01 01 10 days 10 100 - - - 10
Total 22 35 409 4142 25 (6%)
133 (33%)
200 (49%)
51 (12%)
*Very Good- average monthly income tk. 10,000 to above *Good- average monthly income tk. 5000 -10,000 *Average- average monthly income tk. 500-4,900 *Poor- not in work 32. Out of 104 participants who attended tailoring training, 100 participants purchased new sewing machines (cost around tk. 6000) using their training / own money and also by taking loans from the WMCA. 33. Of these the greatest success was for small livestock, etc, and tailoring as the majority of the participants for these categories subsequently reported good / moderate monthly incomes as a result. Handicrafts were less successful, in particularly candle making was not successful.

Eme Report 2013 (2) - 6 - 13 August 2014
34. The IGA training has multiple positive impacts which are not quantified, for example:
• Ensuring food deficiency of their family members, • Earning money by making dresses, selling vegetable, eggs, chicks etc, • Changing attitudes / views, growing self-confidence and establishing control over their
income, and • Establishing savings like operating Deposit Pension Schemes (DPS), initiated life insurance.

Eme Report 2013 (2) - 7 - 13 August 2014
III. AGRICULTURE PERFORMANCE ASSESSMENT
A. Introduction
35. The crop information presented are for: (i) Rabi or winter crop season (December 2012 through March 2013); (ii) Kharif 1 or pre-monsoon crop season (April 2013 through July 2013); and (iii) Kharif 2 or monsoon crop season (July 2013 through November 2013). The assessments covered those subprojects substantially completed / constructed prior to the onset of each of these crop seasons, and were 48 for winter, 78 for pre-monsoon and 83 for the monsoon season. B. Land Use and Incremental Crop Production – Summary
36. Incremental production during this period was estimated at 31,536 tons for cereals, and 14,432 tons for non-cereals from a net cultivated area of 45,246 ha. Incremental cereal cropped area was 2,933 ha and non-cereal cropped area was 3,002 ha. On average, the annual cropping intensity in the 83 subprojects increased by 13 percentage points from 116 to 129 percent (see Table A.4). 37. The table below provides a summary of the changes in crop production. The data show that cereal and non-cereal production increased in all three crop seasons. Cereal crop production increased in 48 subprojects in the winter season, in 34 subprojects in the pre-monsoon season and in 76 subprojects in the monsoon season. The non-cereal crop production increased noticeably in more subprojects in the pre-monsoon season. Expansion of jute and vegetable growing area is attributable mainly to drainage improvement and water conservation. Nevertheless, the Project’s investment for flood management, drainage improvement, water conservation, and command area development contributed to an increase in both cereal and non-cereal crop production in the subprojects monitored in 2013.
Production Changes (Number of Subprojects)
Change Winter (2012 – 2013)* Pre-Monsoon (2013)* Monsoon (2013)* Cereal Non-Cereal Cereal Non - cereal Cereal Non-cereal
Decrease 1 1 10 4 1 2 No change 0 5 36 5 4 37
Increase 47 42 32 69 78 44 Nr of SPs 48 74 83
*: No. of subprojects taken into account in the analysis was 48 in the winter, 74 in the pre-monsoon and 83 in the monsoon seasons.
38. Crop production increased in all three seasons (Figure 1). The increment was higher in the winter and monsoon seasons. Overall for the year, cereal crop production increased in 80 subprojects. Replacement of rice with vegetable or jute and changes in crop variety reduced cereal production in 3 subprojects. In 77 of the 83 subprojects increase in both cereals and non-cereals production were recorded. In 5 subprojects there was no change in non-cereal production. Among these the crop production assessment was initiated in 2 subprojects in the monsoon season when heavy rainfall restricts non-cereal crop cultivation and 3 subprojects are in low-lying haor areas. Non-cereals production fell in a subproject due to the decrease in sugarcane growing area. 39. Crop area also increased in all three seasons. In the Kharif 1 (pre-monsoon) season cropped area remained relatively low (Figure 2). Cereal cropped area increased in 67 subprojects, decreased in 15 subprojects and remained the same in 1 subproject. The non-cereal cropped area increased in 75 subprojects. No change was reported in 5 subprojects which were assessed from the monsoon season or in low-lying haor area. These subprojects were Drainage and Water Conservation (DR&WC) or Flood Management, Drainage and

Eme Report 2013 (2) - 8 - 13 August 2014
Water39. Conservation (FMD&WC) types. Non-cereal crops were not grown in these subprojects in the monsoon season in the pre-subproject period. Farmers in these subprojects may attempt to grow non-cereal crops in the monsoon season, if drainage of floodwater improved or their lands are completely flood free. Non-cereal cropped areas reduced in 3 subprojects with a decrease in jute cultivation. The subprojects are in Jamalpur and Habiganj where heavy rainfall during plantation time may have restricted jute cultivation on relatively low-lying areas.
40. Cereal crop yields increased in all crop seasons (Figure 3). The increase in cereal crop yield was more in the winter season due to better irrigation and fertilizer management. The non-cereal crop yield increased more in the monsoon season due mainly to the cultivation of vegetable with drainage improvement, water conservation and flood management and improved crop management.

Eme Report 2013 (2) - 9 - 13 August 2014
Figure 3: Changes between Pre- and Post-subproject Crop Yields
0
1
2
3
4
5
6
7
8
9
10
Winter Pre-Monsoon Monsoon AnnualCrop Season
Yiel
d (t
on/h
a)
Cereal Pre-subproject Cereal Post-subproject Non-cereal Pre-subproject Non-cereal Post-subproject
41. Command area development and combinations of flood management and water conservation subprojects had the most impact on cereal crop yield levels in the winter season as shown in the following table. These types of subprojects provided adequate water for irrigation and protected crops from early flooding. The engineering improvements enabled farmers to plant vegetable, spice and oilseed crops timely, irrigate the crops and protect them from flooding. 42. Drainage improvement and water conservation increased jute yield in the pre-monsoon season. Drought stress at the early growth stage reduced jute yield in greater Faridpur area. Many jute growers in subprojects in this area now benefit from water conservation. 43. Cereal and non-cereal crop yields in the monsoon season increased for the flood management, drainage improvement and supplementary irrigation. Plantation of deepwater rice over a greater area, replacement of local varieties with high-yielding varieties of transplanted aman rice and vegetable cultivation with drainage improvement and irrigation water availability were reported in Gopalganj and Shariatpur districts. Drainage improvement allowed farmers to plant vegetable, spice and oilseeds crops timely in the post-monsoon period. Changes in type of crop, such as replacement of sugarcane by vegetables, spice and pulse crops reduced average non-cereal yield in some subprojects areas.
Incremental crop Yield by Subproject Type (ton/ha) Subproject Winter (2012-2013) Pre-Monsoon (2013) Monsoon (2013) Total Type* No Cereal Non-Cereal Cereal Non-Cereal Cereal Non-Cereal Cereal Non-Cereal
CAD, CAD&WC/ DR 3 0.84 0.33 0.67 0.08 0.19 0.28 0.48 0.15 WC 9 0.65 2.72 0.47 1.89 0.19 1.81 0.40 1.48 DR&WC 13 0.29 -0.98 -0.27 0.34 0.42 4.67 0.32 -0.01 DR&IRR 21 0.42 0.30 0.67 0.22 0.19 2.17 0.27 0.28 FM 2 0.61 0.40 - 0.34 0.49 0.25 0.61 0.25 FM&WC 3 0.95 0.67 0.32 1.22 0.03 -1.65 0.41 0.68 FMD 12 0.47 2.41 0.28 0.27 0.47 -3.88 0.47 1.03 FMD&WC 13 0.72 0.20 0.31 0.34 0.32 1.16 0.47 1.08 DR 7 0.56 1.29 0.41 0.13 0.25 0.02 0.38 0.65 Weighted Average 83 0.51 0.01 0.35 0.30 0.30 0.56 0.39 0.10
*: WC – Water Conservation, CAD – Command Area Development, DR – Drainage, FM – Flood Management, and IRR – Irrigation.

Eme Report 2013 (2) - 10 - 13 August 2014
44. Improvement in irrigation water supply in command area development subprojects (CAD, CAD&WC and CAD&DR) increased cereal crop yield more than of non-cereal in the winter and pre-monsoon seasons. It has less impact on the crop yields in the monsoon season. 45. For many subprojects timely plantation, irrigation water availability, protection of crop from flooding and improved crop management increased crop yields in the subproject areas.
C. Winter Season (2012 – 2013) 46. In the 48 subprojects assessed in the winter season, the production of cereals increased by 17,410 tons and non-cereals by 5,810 tons. The incremental winter cereal accounts for the largest contribution to the total production increased in 2013. The cereal and non-cereal cropped areas in this season increased by 1,161 ha and 844 ha, respectively. The production increases represent an increase of 16 percent and 27 percent, respectively over the pre-subproject production. Table A.5 provides the data by subproject. 47. Major reasons that contributed to the improvement of crop production in the subprojects areas in this season were increases in irrigated areas due to more water retained in the re-excavated khals, increase in residual soil moisture, conservation of seepage water for recycling, expansion of single lifting irrigated area, improved water use efficiency, timely transplantation of rice crops, early drainage allowing non-rice crop plantation, increase in irrigated crop areas and yields, decrease in pest infestation early for transplantation, adoption of improved farming technology and crop protection from inundation which was due to poor drainage of rainwater. 48. The positive impact on the winter season production is most likely only partly due to the physical infrastructure provided under the Project. Cereal cropped areas increased in 47 subprojects and non-cereal cropped areas increased in 42 subprojects in this crop season. Yields levels of cereal crops increased in 47 subprojects and non-cereal crops in 37 subprojects due to post-monsoon water retention. A secondary impact of water retention may have been increased residual soil moisture. This supported plantation of non-cereal crops after the harvest of aman rice in the monsoon season. Conjunctive use of surface water and ground water was found to have a positive effect on crop establishment as well as yield. This was most common in the subprojects in Faridpur and Mymensingh areas. Crops were initially irrigated using surface water pumped from the re-excavated khals and then groundwater was used. This resulted in proper growth and increased yields while minimizing (pumping) costs. There were also a number of subprojects wherein drainage improvements facilitated increases in the area cropped, specifically area under non-cereals because planting could be completed earlier in the winter season. 49. In Pudda Khali Khal FMD project, SP33045, in Netrokona district expansion of vegetable growing area reduced cereal production during winter season. 50. More vegetables, wheat and rice production replaced sugarcane due to improved availability of irrigation water from water conservation in the khal reduced total non-cereal production in Machpara-Lakshmandia DR&WC subproject, SP 33064, in Rajbari district. 51. Drainage improvement and water conservation increased crop areas and yields in 41 subprojects. 52. Drainage improvement contributed to an increase in the high-yielding variety (HYV) boro growing area in 36 subprojects. Deepwater rice cropping reduced in favour of the more HYV boro crop production in 13 subprojects in the Greater Faridpur area. Drainage

Eme Report 2013 (2) - 11 - 13 August 2014
improvement enabled an increase in non-rice production in the winter season. In most subprojects vegetable, oilseed and pulse crops cultivation increased. 53. Water conservation in the khal diversified crop production with cultivation of vegetable, onion, mustard and lentil. More water availability inspired farmers to increase irrigated crop area in Shomschura Ranjana Khal WC subproject, SP31005, in Sherpur district. The WMCA collected irrigation fees at the rate of Taka 1,500 per acre from 110 water user farmers. In Talbaria Beel FMD&WC subproject, SP 32014, and Nimtala DR&WC subproject, SP 32015, in Rajbari district seepage water conservation increased irrigation water availability for rice and non-rice crops. In Bansgari WC subproject, SP 32020, in Madaripur district more water availability in the khal increased the single lifting irrigated area. This has reduced irrigation (pumping) costs by about 40%, diversified crop production with cultivation of more mustard and pulses. According to an irrigation water supplier, he required 22 barrels (200 liters/barrel) of diesel to irrigate 50 to 65 acres of land before the subproject implementation. In 2013 he procured 14 barrels of diesel to irrigate the same area. 54. Adequate irrigation increased crop yields. Similar benefits were also reported in Phuleswari FMD subproject, SP32030, in Kishoreganj district. In Bapail Beel DR&WC subproject, SP 33048, in Mymensingh district more than 50 LLPs were installed along the khal embankments and operated until mid-February. Later DTW were used for irrigation. This conjunctive use of water helped farmers reduce irrigation (pumping) costs. 55. Agriculture training and extension services provided by DAE, DLS, SRDI and RDA and quality seed supply by BADC supported adoption of improved crop production technology. These included demonstrations on improved irrigation water management methods such as alternate wet and drying (AWD) in boro crop fields and mixed cropping; training on fertilizer management and application methods, soil resource management, crop yield gap reduction and livestock disease management; determination of nutrient contents of the soil and recommendations of fertilizer application rates; motivation on LCC use; supply of rice, wheat, vegetable and pulse seeds of improved varieties, fodder seedlings, new breeds of duck and poultry; support for establishment of tree plants nursery and poultry farm; and vaccination of livestock animals and poultry. The agriculture training and extension activities motivated subproject farmers to improve cultivation methods, use quality seeds, adopt seed treatment using organic method and seedbed management; irrigation planning, balanced and organic fertilizer use, mixed cropping such as potato and maize, inter-cropping between aman and boro rice crops, early vegetable production, IPM practice, organic pesticide use, grafting of fruit seedlings, homestead vegetable production WMCA woman members, production of quality seeds, seed preservation using improved method, and orchard development. 56. The Project has helped in developing farmer capability and linkage between WMCAs and the DAE, SRDI, DLS through agriculture production planning and on-farm activities on agriculture resources management and sustainable agriculture production.
D. Pre-Monsoon (Kharif I) Season (2013) 57. The pre-monsoon cereal production increased by about 1,114 tons and the non-cereal production by about 6,942 tons in the 78 subprojects assessed in this season. This represents an increase of more than 16 percent for cereal and about 62 percent for non-cereal crop production in the pre-monsoon (Kharif I) season. The incremental pre-monsoon
Box 1: Assuming a pumping efficiency of 50 m3 water / l of fuel, then 22 barrels of fuel (200 l/ barrel) gives a volume of 220,000 m3. Spread over 60 acres, this equates to 0.91 m (1 acre = 0.4047). Using just 14 barrels of diesel indicates that just 0.58 m was pumped.

Eme Report 2013 (2) - 12 - 13 August 2014
non-cereal accounts for the largest contribution to the total non-cereal crop production increase in 2013. The cereal cropped area increased by 64 ha while non-cereal cropped area increased by 1,999 ha in this crop season. Table A.6 provides data by subprojects. 58. Major reasons that contributed to the improvement of crop production in the subprojects in this season included the: (i) opportunity to plant jute, deepwater rice and vegetables with drainage improvement; (ii) improved availability of water in the re-excavated khal for irrigation at planting stage; (iii) protection of crop during early growth stages by improved flood control; (iv) cultivation of short duration boro rice variety in the winter allowing jute plantation following the harvest of the boro crop; (v) sowing of deepwater aman rice in jute fields allowing the rice crop to grow after the harvest of jute, and so on. 59. Land use for cereal crop cultivation in the pre-monsoon season was limited in the subproject areas. Aus rice was reported to be cultivated in 42 subprojects. This included a subproject where Aus rice production actually decreased. The Aus rice growing area was less than 1 to 19 percent of the cultivated land in 34 subprojects and between 29 to 78 percent in 8 subprojects. The maximum area under Aus rice was reported in a subproject in Moulvibazar district. 60. Cereal production in this season reduced in three subprojects due to an increase in jute and vegetable cultivated area and replacement of Aus rice to cultivate boro rice in the winter season. 61. The non-cereal cropped area increased in 63 subprojects and reduced in 6 subprojects. Re-excavation of khals and construction of water retention structures favourably impacted non-cereal crop production during the pre-monsoon season. This resulted in an increase in area planted to jute, deepwater rice, vegetables and spice crops. In a number of subprojects in the Greater Faridpur area drainage improvement increased jute and spice growing areas. 62. In those subprojects where non-cereal production declined in the pre-monsoon season, there was a decrease in vegetable, spice and jute growing area. Instead of jute, HYV Aus rice was grown with irrigation at the early growth stage. 63. Jute cultivation increased in subprojects in Faridpur, Gopalganj and Madaripur districts. Spice growing area in the pre-monsoon season increased in Rajbari and Gopalganj. Vegetable cultivation in this season also expanded in subprojects in Gopalganj and Rajbari as well as in Mymensingh. 64. In Basan Beel FMD subproject, SP 32036, and Barasila DR&WC subproject, SP32025, in Tangail district farmers cultivated short duration (140-day) boro rice variety (BR28) in the winter season, and then planted jute in the pre-monsoon season following the harvest of the boro crop. Drainage improvement in the pre-monsoon season provided this opportunity. Drainage improvement in the pre-monsoon increased jute and spice planted areas in the Baneswardi CAD subproject, SP33059, in Faridpur district. Farmers planted deepwater aman seed sown in jute crop fields taking advantage of drainage improvement. After the harvest of jute in July the deepwater aman continues to grow until mature in October. 65. DAE supported project efforts with quality seed production on farmers level, demonstrations on seed production under the Jute Seed Production Project, balanced fertilizers use, training on jute crop management and jute retting and motivation on use of improved technology for deepwater aman rice cultivation, vegetable production, soil management and quick compost preparation.

Eme Report 2013 (2) - 13 - 13 August 2014
E. Monsoon (Kharif II) Season (2013) 66. In the 83 subprojects, the production of monsoon season cereals increased by 13,012 tons and the production of non-cereals by 1,681 tons. This represents an increase of 18 percent and 69 percent, respectively over the pre-project production. These incremental rates were the highest among the three crop seasons. The cereal cropped area increased by 1,768 ha and non-cereal cropped area by 158 ha in the monsoon crop season. Table A.7 provides the data by subproject. 67. Much of the increase in crop production in this season was attributable to drainage improvement as well as floodwater control. This allowed timely plantation, use of HYVs, providing of supplementary irrigation, and use of more land for crop production. 68. The cereal cropped increased in 78 subprojects, remained the same in 4 subprojects and decreased in one subproject due to cultivation of rice over a smaller area. Non-cereal crops were grown in 47 subprojects and cereal crops replaced non-cereal crops in one subproject. The area under non-cereal crops increased in 43 subprojects, remained the same in three subprojects and decreased in one subproject. Cereal production increased in 78 subprojects and non-cereal production increased in 44 subprojects. 69. A large improvement in crop production in the monsoon season was reported in Langulia Khal FM&WC subproject, SP 32010, in Netrokona district. Flood management and water retention provided the opportunity to grow transplanted aman crop and use HYV in five villages in this subproject area. Drainage of floodwater, timely transplantation and supplementary irrigation contributed to the expansion of aman growing area as well as increase in yields. As a result transplanted aman rice production increased considerably. 70. A similar benefit was reported in Goilla Beel FMD subproject, SP 33042, in Tangail district. Aman production increased with HYV adoption in low-lying areas due to drainage improvement. The Samotkur, Dayarambari, Pirpur, Charabhanga and Hajorbari villages benefited from the drainage improvement. Aman rice was transplanted as early as in July. In pre-subproject period farmers transplanted late in September due to poor / delayed drainage. Timely transplantation increased yield levels. For example, Md. Hafizuddinn in Samotkur village could produce 1.04 to 1.40 ton per acre before the subproject construction. In 2013 he achieved 1.64 ton per acre with cultivation of HYV. He applied balanced fertilizers instead of low doze earlier. Rawsonara, a women farmer in Dayarambari and Mr. Rezaul Karim in Kadomtali village also reported that they harvest more aman rice than before.
Map1: Changes in Rice Production in the Monsoon Season in 2013 for Flood Management and Water Conservation in Langulia Khal Subproject, Netrokona District

Eme Report 2013 (2) - 14 - 13 August 2014
71. Farmers in Roail-Helalpur FMD&WC subproject, SP32013, in Sunamganj district increased their HYV aman rice growing area with flood management and water retention. 72. In Barua-Kumuria FMD&IRR subproject, SP 31007, and Mahmudpur-Jikarbari DR&IRR subproject, SP 32016, in Gopalganj district, drainage improvement by the re-excavation of khal and as well as retention of water in the khal for irrigation at planting time in the pre-monsoon season contributed to increase deepwater aman rice grown through the monsoon season. In the Amgram DR&IRR subproject, SP33078, in Madaripur district re-excavation of the Khagradia, Sitkibari and Vennabari Khals improved drainage in four villages. This has increased transplanted aman rice production replacing broadcast aman. 73. In Habiganj district, the Dhanchari DR&IRR subproject, SP32031, and the Ferani Beel DR&IRR subproject, SP33087, were historically subjected to water logging with no monsoon cropping. Here the channel re-excavation enabled farmers to produce crops in the monsoon season. 74. In several subprojects farmers produced non-cereal crops in this season. These include Khorma-Tilokpur FMD subproject, SP32022, in Jamalpur district; Sherpur Katakhali DR&IRR subproject, SP33074, in Habiganj district; Phulsuti DR&IRR subproject, SP 34130, in Faridpur; and Dakshinbari Khal DR&WC subproject, SP 33095, in Rajbari district. 75. Supplementary irrigation with use of water from khals was reported in a number of subprojects. In Shomschura Ranjana Khal WC subproject, SP31005, in Sherpur district irrigation of transplanted aman rice land covered 70 acres and the water users paid Taka 1,000 per acre. 76. HYV aman rice cultivation increased due to availability of water for supplementary irrigation in Laghata WC subproject, SP 32021, and Shial Chhara FMD&WC subproject, SP 33047, in Moulvibazar district. 77. Cereal production increased more than 20 percent in 33 subprojects. In Char Narayannpur-Naogaon Khal and Chitalia Khal subprojects in Shariatpur, Phuleswari-Sonai Beel subproject in Kishoreganj, Laxmiganj-Rupriya Khal subproject in Madaripur and Puddakhali Khal subproject in Netrokona district cereal production more than doubled. 78. Production of non-cereals crops increased more than 20 percent in 24 subprojects. More vegetable and spice crop production increased the non-cereal production. Drainage improvement and flood control enabled farmers to introduce non-cereal crop production in 14 subprojects. 79. The DAE supports aman rice production planning, quality seed supply, use of improved method for seedbed preparation, balanced fertilizers use, motivation on granular urea use, training on crop pest and disease management, motivation on IPM practice supplementary irrigation and demonstration on quality seed production, processing and preservation. DAE supplied a power tiller supply with 50% subsidy to the WMCA in Dubir Boro Dhair FM subproject, SP33052, in Kishoreganj district. Crop marketing by WMCA to ensure fair prices was reported in subprojects in Madaripur district.
F. Extension Support 80. Project staff supported the WMCA in each subproject on sustainable agriculture production. Each WMCA has formed an agriculture sub-committee. The sub-committee listed beneficiary farmers, and subproject agriculture production plans and land use maps have been prepared with DAE support in consideration of farmers’ response to the new

Eme Report 2013 (2) - 15 - 13 August 2014
agro-hydraulic regime enabled by the engineering works. Selected farmers received ICM / IPM training. Demonstrations were organized on improved agriculture technology such as new crop or crop varieties that match with the changes in the agro-hydraulic regime. These demonstrated opportunities for enhancement of agricultural production in terms of what crops to grow and when to grow them, what services and other inputs are required, where and how to procure them, and how to market the produce. DAE supplied quality seeds, leaf colour charts (LCCs), tree plant seedlings, fertilizers and devices for granular urea application. 81. The DLS provided support on vaccination of livestock animals, ducks and poultry. Farmers received training on livestock disease management. Support was provided on fodder production, beef fattening and new breed poultry bird procurement. 82. SRDI supported training on agriculture resources uses, soil sample collection, analysis of soil nutrient content of the sample and determination of fertilizer application rates. 83. BADC supplied quality seeds of improved varieties. SAAO, DAE supported WMCA on the procurement of seeds.
G. Production Trends 84. It is assumed that crop production practice is not spontaneously changed by farmers unless they are persuasively motivated. In the subprojects beneficiary farmers observe the changes in the natural agro-hydraulic regime after completion of the engineering works and then decide on any new crop production practice. Accordingly crop production increases steadily following subproject completion. Crop production in the subprojects was compared between 2012 and 2013 to examine the incremental trend over the year.
1. Winter Crop Production Trends
85. As indicated in Figure 4, cereal and non-cereal production in the winter season increased in 2013 from that was recorded in 2012 in 17 subprojects. 86. This increase reflects adaption of crop production practice by farmers commensurate with improved post-monsoon drainage, water availability for irrigation, and drainage improvement and flood management in the pre-monsoon season. 87. The rate of increase was more for non-cereal crop production. Drainage improvement in the post-monsoon season provided more opportunity to grow non-cereal crops in the early winter season. In Arura Kolkolia WC subproject, SP 31004, in Habiganj district, HYV boro and vegetable production increased. Some farmers in this subproject also initiated wheat and potato production.
Cereal
Non-cereal
0
5000
10000
15000
20000
25000
30000
35000
40000
45000
50000
2012 2013
Prod
uctio
n (t)
Year
Figure 4: Trends in Winter Crop Production17 Subprojects, 2 years of record

Eme Report 2013 (2) - 16 - 13 August 2014
88. HYV boro, wheat and vegetable cultivation increased in Shomschura Ranjana Khal WC subproject, SP31005, in Sherpur district. Framers introduced more non-cereal crops in 2013. 89. Availability of more water persuaded farmers to increase irrigated cropped area. Farmers in Lauer Beel DR&IRR subproject, SP32028, in Madaripur district continued to increase oilseed and pulse cropped area due to drainage improvement in the post-monsoon season. Irrigation water availability increased HYV boro growing area in this subproject. 90. In Pukuria Khal-Uziakhali Khal FM subproject, SP 31008, in Netrokona district only HYV was grown prior to the project. The engineering works enabled farmers to increase the HYV boro growing area and begin wheat, potato, vegetable, spice, oilseeds and pulse cultivation in 2012. The area under these crops increased further in 2013. 91. Farmers in Satgavia Beel DR&WC subproject, SP32009, in Faridpur district reduced their sugarcane growing area, choosing instead to crop more wheat, vegetables, spices and oilseed crops.
2. Pre-monsoon Crop Production Trends
92. In the pre-monsoon season the cereal cropped area covers a smaller area than non-cereal crops. Aus rice was the only cereal crop produced in this season in the 20 subprojects assessed to examine the incremental trend. It covered 16% of the area cultivated in the pre-monsoon season in 2012 and 17% in 2013. 93. Between 2012 and 2013 cereal crop production increased in the 20 subprojects (Figure 5). However, there was decrease in non-cereal production during the same period. This was due to a reduction in jute production in 8 subprojects in Faridpur, Rajbari Madaripur, and Shariatpur districts. Heavy rainfall in 2013 damaged the crop at seedling stage reducing area and / or yield in 2013 compared in 2012.
3. Monsoon Crop Production Trends
94. In the monsoon season cereal and non-cereal crop production increased (Figure 6) for the 27 subprojects assessed. Drainage improvements resulted in more vegetables and spices being cropped in a number of subprojects. Water retention for supplementary irrigation contributed to improved crop yields.
Cereal
Non-cereal
0
500
1000
1500
2000
2500
3000
3500
4000
4500
2012 2013
Prod
uctio
n (t)
Year
Figure 5: Trends in Pre-Monsoon Crop Production20 Suprojects, 2 years of record

Eme Report 2013 (2) - 17 - 13 August 2014
95. A subproject planning related lesson is that the ability to drain floodwater can have a significant impact on monsoon cereal production. The data also suggest this occurred in many of the drainage subprojects. However, in 5 subprojects the monsoon cereal production was found to have significantly decreased in 2013 compared in 2012. 96. While not to the same extent, this reduction occurred in Narshanda-Tongi Khal subproject designed as drainage system, in Satgavia Beel, Barashila Beel and Bapail Beel subprojects designed as drainage systems with water conservation; and in Bowlar Beel subproject designed as flood management and drainage system. In most cases local aman, which is mainly grown in low-lying lands, covered less area in 2013 compared in the preceding year in these subprojects. This indicates that the drainage capacity of the subprojects may have reduced in the second year of operation, possibly due to siltation, fisheries in the khal, or some other other possible reason. 97. In Pudda Khali Khal and Katarbari-Karagati subproject the HYV boro growing area reduced in 2013 - presumably drainage in the post-monsoon season was not as effective as in 2012. Farmers in Pudda Khali Khal tried to compensate the loss of boro with cultivation of vegetable following the drainage of floodwater. In 2012 vegetables were not grown. About 88% of the cultivated land in this subproject is low-lying.
Cereal
Non-cereal0
5000
10000
15000
20000
25000
30000
35000
2012 2013
Prod
uctio
n (t)
Year
Figure 6: Trends in Monsoon Crop Production27 Suprojects, 2 years of record

Eme Report 2013 (2) - 18 - 13 August 2014
IV. FISHERIES PERFORMANCE ASSESSMENT
A. Introduction
98. Fisheries resource development support begins after the Implementation Agreement is signed. This support usually comprises a 14 step support program, after which further support may be provided by the Department of Fisheries. Key support activities included establishment of carp nurseries, establishment and demonstrations of good aquaculture practices in ideal ponds and other training and technical support. 99. Be the end 2013 carp nurseries had been established in 37 of the 48 subprojects assessed, and ideal ponds in 27 subprojects. 100. Little progress has been made in formal leasing of public water bodies for the benefit of the WMCA members. 101. Fisheries Performance in 2013 was assessed for the 48 subprojects listed in Table A.8, and included collection of information on fisheries ecosystems (water areas), producers - both fishers and fish farmers, production and annual income. These 48 subprojects comprise various types, as listed below, with 14 being non-regulatory and 34 regulatory.
Fisheries Assessment - Types of subprojects by District
District Type and category Development Group Non-
Regulatory (14) Regulatory (34) Total
1 2 3 4
DR DR &
IRR
CAD
CAD &
WC
DR &
WC
FM FM& WC
FMD FMD &
WC
WC
1 Mymensingh - - 1 - 2 - 1 2 1 - 7 1 1 5 0 2 Tangail - - - - 1 - - 3 - - 4 0 2 2 0 3 Netrokona - - - - - 1 - 1 - - 2 1 0 1 0 4 Kishoregonj - - - - - - - 1 - - 1 0 1 0 0 5 Jamalpur - - - - - - - 3 - - 3 0 3 0 0 6 Sherpur - - - 1 - - - - - 1 2 1 1 0 0 7 Sylhet - - - - - - 1 - - - 1 1 0 0 0 8 Moulavi Bazar - - - - - - - - - 2 2 0 1 1 0 9 Habigonj - 5 - - - - - - 1 1 7 1 2 2 2 10 Sunamgonj - - - - - - - - 2 2 4 0 3 1 0 11 Faridpur 1 - - - 2 - - - - - 3 0 2 1 0 12 Rajbari - - - - 3 - - - 1 - 4 0 2 2 0 13 Gopalgonj - 3 - - - - - - - - 3 - 2 1 0 14 Madaripur - 3 - - - - - - - - 3 0 3 0 0 15 Shariatpur - 2 - - - - - - - - 2 0 1 1 0 Total 1 13 1 1 8 1 2 10 5 6 48 5 24 17 2 102. There is regional variation in fish production opportunities. For example, in the southern part of the Greater Faridpur districts, Madaripur, Gopalgonj and Shariatpur, tidal canals and huge beel areas provide good ecosystems for natural fisheries development. In the Greater Mymensingh region, for upland areas of Mymensingh, Sherpur, Jamalpur, Tangail the focus is on farming fish, while the Haor districts of Sunamgonj, Habigong and KIshoregonj enable natural fisheries development. 103. According to the project provisions, and a Memorandum of Understanding (MOU) signed between LGED and the Department of Fisheries (DOF), Ministry of Livestock and Fisheries, the DoF provides fisheries development support for the SSW subprojects. In

Eme Report 2013 (2) - 19 - 13 August 2014
addition, a MOU has been signed between LGED and Bangladesh Fisheries Research Institute (BFRI) to support training and the fisheries program. 104. In line with the MoUs line agency staff of DOF and BFRI support fisheries training, provided technical support and supplied quality fish hatchlings to subproject farmers. In addition, DoF provided fish fingerlings for open water (Beel) stocking, established a Fish sanctuary in Satgavia Beel Subproject (Faridpur) and Char Narayanpur (Shariatpur). 105. Efforts to minimize any adverse impacts of the gated regulators and other structures, includes establishment of ‘Fish Shelters’ in re-excavated canals and ‘Fish Sanctuaries’ in the Beels. In Satgavia Beel such interventions increased fish production significantly. Also the project supports use of hydraulic infrastructure to ensure that water bodies (and ponds) do not dry up B. Summary of Performance
106. Overall fish production increased in 43 of the 48 subprojects (90%), decreased in three subprojects (6%), and remained unchanged in two (4%). For Capture fisheries production increased in 23 subprojects (48%), decreased in eight (17%) subprojects and remained unchanged in 17 (35%). For Culture fisheries, production increased in 44 subprojects (92%), decreased in none and remained unchanged in four (8%). 107. The number of fishers decreased in 17 subprojects (35%), remained unchanged in 21 (44%) and increased in 10 (21%). Annual income of fishers decreased in four subprojects (8%), remained static in 19 (40%) and increased in 25 (52%). 108. For culture fisheries, the number of fish farmers increased in 38 subprojects (79%), remained unchanged in 10 (21%) but decreased in none. Annual incomes of fish farmers increased in 25 subprojects (52%), decreased in one (2%) and remained unchanged in 22 (46%). 109. Concerning fishery habitat, in the capture fisheries sector, habitat (fisheries ecosystem1
Change
) decreased in 29 subprojects (60%), increased in five (19%) and remained unchanged in 13 (27%). 110. Culture fisheries sector has done better than the capture fisheries sector.
Summary of Performance (Number of SPs)
Capture Fisheries Culture Fisheries
Habitat
Production
Fisher (#)
Annual Income/ Fisher
Habitat Incremental Production
Fish Farmer
(#)
Annual Income / Fish
Farmer Overall
Decrease 29 (60%)
8 (17%)
17 (35%)
4 (8%)
12 (25%)
- - 1 (2%)
3 (6%)
No Change 13 (27%)
17 (35%)
21 (44%)
19 (40%)
- 4 (8%)
10 (21%)
22 (46%)
2 (4%)
Increase 5 (19%)
23 (48%)
10 (21%)
25 (52%)
36 (75%)
44 (92%)
38 (79%)
25 (52%)
43 (90%)
111. In 2013 the overall incremental fisheries production for the 48 subprojects was estimated at 93 tons with 12 tons from capture fisheries ecosystems and 81 tons from culture fisheries, see table below. 1 The fisheries ecosystem comprises permanent water bodies (non-cultivated low land) plus flood plains (land
types F2 & F3)

Eme Report 2013 (2) - 20 - 13 August 2014
112. For capture fisheries the overall increase was 12 tons of fish despite a 92 ha loss of fisheries ecosystem area and -140 in the number of fishers. The incremental annual income was estimated at about Tk 1,000 per fisher – this was due to an increase in fish prices along with the reduced number of fishers. 113. For culture fisheries the overall increase was 81 tons in production, an increase of 48 ha in fish farming area, and 195 of fish farmers. The incremental annual income was estimated at about Tk 1,500 per fish farmer. Fisheries Performance by subproject Type
(Incremental values for different types of Subprojects)
Subproject Type
No.
Capture Fisheries Changes Culture Fisheries Changes Overall
(ton)
Fish Habitat
(ha)
Production (ton)
Fisher (#)
Annual Income/ Fisher
(‘000 Taka)
Fish Habitat
(ha)
Production (ton)
Fish Farmer
(#)
Annual Income/
Fish Farmer
(‘000 Tk)
1 2 3 4 5 6 7 8 9 10 11=(4+8)
Non-Regulator Subprojects 1.DR 1 -7 -1 -6 1 0 2 7 1 1 2. DR & IRR 13 -27 3 -62 2 12 27 57 1 30 Regulatory Subprojects 3.CAD 1 0 0 -9 2 1 5 12 2 5 4.CAD & WC 1 0 0 1 1 3 1 7 2 1 5.DR&WC 8 -33 6 -37 2 17 15 32 1 21 6.FM 1 0 -2 -7 0 0 1 7 2 -1 7.FM&WC 2 -5 1 -9 -1 2 4 7 2 5 8. FMD 10 -27 2 -7 0 5 18 27 1 20 9. FMD&WC 5 0 1 -9 -1 2 4 7 2 5 10. WC 6 7 2 5 2 6 4 27 2 6
Total Values (# of SPs)
48 -92 (10)
+12 (10)
-140 (10)
+10 / 1 0 = 1 / Fisher
48 (10)
81 (10)
195 (10)
15/10 =1.5 / Fish farmer
+93 (10)
Decrease: Value (# of Sp
types)
-99 (5)
-3 (2)
-146 (8)
-1 (1)
- - - - -3 (1)
No Change 0 (4) 0 ((2)
- 0 (2)
0 (2)
- - - -
Increase: Value (# of Sp
types)
(48) +7 (1)
+15 (6)
+6 (2)
+12 (7)
+48 (8)
+81 (10)
+195 (10)
15 (10)
+96 (9)
114. In 2012 just 27 subprojects were assessed, while this 2013 report includes data for 48 subprojects. Incremental production in 2012 was about 1 ton per subproject, and this increased to 1.9 tons in 2013 (93 tons in 48 subprojects). 115. Capture fisheries production usually increased in DR, WC and DR&IRR subprojects but decreased in FM, FMD, FMD&WC, DR&WC, WC&CAD subprojects. The capture fisheries ecosystem usually decreased in FM subprojects, and often in the DR subprojects, due to the reduced flooding and improved drainage. In two DR subprojects the fisheries ecosystem improved with the excavation of khals along with improved hydraulic connectivity. The numbers of fishers decreased in almost all the subprojects.

Eme Report 2013 (2) - 21 - 13 August 2014
116. For culture fisheries production increased for all types of subprojects. 117. The performance of the different types of subproject is discussed below. C. Performance of Different Categories and Types of Subprojects
1. Non-regulatory subprojects
a. Drainage Type (1 Nr)
118. Drainage (DR) subprojects facilitate drainage by khal excavation and often have an adverse impact on fisheries. A 20% loss in fishery habitat is usually assumed in the feasibility reports in the absence of actual data. However in reality a positive impact may result from the drainage interventions if hydraulic connectivity between Beels and rivers is improved / re-established. 119. In the single DR subproject, Akhoter Char Nolertek khal of Faridpur, overall fisheries production increased by 1 ton: -1 ton from capture fisheries and +2 tons from culture fisheries, see table below. In the capture fisheries sector, habitat, production and number of fishers decreased though the income of the fishers increased due to an increase in fish prices and reduced number of fishers. In the culture fisheries sector, all aspects of the fisheries recorded increases except the fish habitat which remained unchanged.
b. Drainage and Irrigation type (13 Nr)
120. DR&IRR subprojects drain excess water from farmers’ fields but have sufficient khal depth to allow irrigation in the dry season. A negative impact arises from smaller fisheries habitat, but this may be compensated due to improved hydraulic connectivity of Beels and rivers. 121. For the 13 subprojects of this type the water body decreased by 27 ha, the numbers of fishers decreased by 62, but overall capture fisheries production increased by 3 tons. For culture fisheries all indicators were positive. 122. In Katarbari Katargati (SP 32019, Sadar, Gopalgonj) , Chitolia Khal (SP 33066, Sadar, Shariatpur), natural fisheries have flourished due to the re-establishment of connections between the Beel and rivers which facilitated migratory movements including breeding migrations.
2. Regulatory subprojects
a. CAD type (1 Nr)
123. The only CAD subproject assessed was Rouha of Gafargaon, Mymensingh. CAD subprojects do not impinge on the fisheries sector and so no mitigation measures are needed. However, in view of the considerable culture fisheries resources (fish ponds) and interest of the local stakeholders, technical support for culture fisheries development was provided with good results. There has remarkable increase in fish fingerling production – there was a nursery in the subproject area and now six nurseries are established supplying fingerlings over a wide area. 124. Another innovative plan is to provide “pipe” outlets so that CAD systems can provide water to household ponds – however this has not been provided to the Rouha system which was designed as part of project preparation.

Eme Report 2013 (2) - 22 - 13 August 2014
b. Command area Development and Water Conservation type (1 Nr)
125. In CAD & WC subprojects, a gated structure and excavated khal conserves water for dry season cropping. Water distribution efficiency / extent is improved by CAD interventions – either open channel or buried pipeline. Improved WC may improve the fishery habitat, though gate operations should not prevent fish movement. 126. In Sutiar Khal of Sherpur, there was no change in overall fish production with 1 ton increase in culture fisheries production and 1 ton decrease in capture fisheries production. There is no change in the capture fisheries ecosystem but 1 ha increase in culture fisheries. Use of the CAD water to maintain the health of fishponds is proposed.
c. Drainage and Water Conservation type (8)
127. DR&WC subprojects typically included gated regulators and khal excavation and improve drainage following heavy rainfall – usually for Aus cropping, and conserve water in late monsoon for dry season irrigation. While drainage usually reduces the fisheries habitat area it may improve hydraulic connectivity, and water conservation may increase the potential for fish culture. 128. In the eight DR&WC subprojects overall production increased 21 tons mostly from an increase in culture fishery production.
d. Flood Management type (1 Nr)
129. Flood Management (FM) subprojects typically have one or more gated regulators and improved earthen embankments and reduce flooding. A 50% loss in fishery habitat is usually assumed in the feasibility reports in the absence of actual data. However these subprojects often result in an increase in fish farming, partly to compensate for the loss in capture fishery production but also facilitated by the improved protection afforded to fish farms / ponds. 130. For Pukuria Uziakhali Khal subproject of Netrokona, capture fisheries production and number of fishers decreased as expected, and was only partly compensated by a small increase in culture fishery production.
e. Flood Management and Water Conservation type (2 Nr)
131. Flood management interventions usually negatively impact on fisheries, as described above, while water retention often provides an extended habitat for fish farming. In the two FM&WC subprojects overall production increased by about 5 tons.
f. Flood Management and Drainage type (10 Nr)
132. Both the Flood Management and Drainage interventions usually have a negative impact on fisheries, although flood management may enable increased culture fisheries by protecting fish farm ponds, while deepened khals may enable increased migrations. Overall for the 10 FMD subprojects there was a decrease in the capture (open water) fisheries ecosystem area, production and number of fishers, but an increase in culture fisheries.
g. Flood Management, Drainage and Water Conservation type (5 Nr)
133. For the five FMD&WC subprojects capture fisheries indicators were mostly negative, while culture fisheries were positive. The overall incremental production was 5 tons, 1 ton from capture fisheries and 4 to from culture fisheries.

Eme Report 2013 (2) - 23 - 13 August 2014
. h. WC type (6 Nr)
134. Water Conservation subprojects typically include khal excavation and construction of gated regulators increasing water availability for dry season irrigation. These subprojects therefore also support increased fish production. 135. In all six WC subprojects, all aspects of the fisheries sector - fisheries ecosystem, production, number and income of producers - were positive. 136. In Arua kalkalia subproject, Habigonj, there has been significant increase in the open water fish production, as the Khal connecting the river to the beel was re-excavated and augmented fish migration.
3. Conclusion
a. Impact of Hydraulic Infrastructures on the Fisheries
137. The capture (open water) fishery habitat comprises permanent (non-cropped) water bodies as well as flood plains - land types F2-Medium Lowland and F3-Lowland. 138. In the absence of actual data it is commonly assumed that Flood Management and Drainage subprojects cause 50% and 25% reduction in capture fisheries production respectively. However, the re-excavated drainage canals often improve hydraulic connectivity between rivers and beels and facilitate fish migrations. The deepened drainage canals may be permanent water bodies and may be used for culture fisheries if closed off with nets / cages. Also flood embankments may increase culture fisheries by protecting ponds from flooding and damage. 139. Water Conservation (WC) subprojects retain water in canals and typically have a positive impact on fisheries, particularly if gate operations allow fish migrations at the appropriate time. 140. Command Area Development and irrigation subprojects can have a positive impact on the health and sustainability of fish ponds if provision is made for pumping of water to ponds.
b. Capture Fisheries
141. For capture fisheries there was an overall reduction in the fisheries habitat, production and number of fishers. However income of fishers increased due to an increase in fish price, low investment needed and the reduced number of fishers. 142. The EME data indicate that the impact of the subprojects on capture fisheries is not as severe as assumed in the feasibility reports. While there is loss of ecosystem, this is mitigated to some extent by improved hydraulic connectivity between rivers and beels. Examples of this are Arua Kalakalia (Habigonj), Lauer Beel (Madaripur), Katarbari Karargati (Gopalgonj, and Chitalia Khal (Shariatpur). Other mitigation measures include: (i) creation of fish shelter in canals and fish sanctuaries in Beels as done in Satgavia Beel (Faridpur); (ii) establishment of community based fisheries; and (iii) establishment of carp nurseries and stocking of Beels with good locally raised fingerlings.

Eme Report 2013 (2) - 24 - 13 August 2014
c. Culture Fisheries
143. Culture fisheries received relatively more support from the Project. Constraints included shortage of locally produced fish fingerlings and adoption of good (ideal) fish farming practices. To address these at least one fish nursery (firstly carp nursery) and an ideal fish pond was established in subprojects with fisheries potential. For 60% of the 48 assessed subprojects carp nurseries have been established and ideal farm ponds are being established. 144. In all subprojects, except one, there has been increase in production.

Eme Report 2013 (2) - 25 - 13 August 2014
V. OPERATIONAL PERFORMANCE ASSESSMENT
A. Subprojects Handed-Over
145. Subprojects are handed over to the WMCA one year after construction. To end April 2014, 42 subprojects had been handed over. B. Capacity Building and O&M Plans
146. Subproject O&M Plans are typically prepared within one year of completion of construction works, within the maintenance (defects liability) period for any works built by a contractor. The format and content of these Plans depend on the category of subproject. They cover only maintenance for unregulated subprojects without structures, but both operation and maintenance for regulated and CAD types of subproject. Typical contents of the O&M Plans are tabulated below.
Content O&M Plan Content
Un-regulated SPs Regulated SPs CAD SPs
Brief about SP A short brief about the SP is given for all categories Description of SP
Infrastructure The SSSWR infrastructure is described in reasonable detail
Maintenance Aspects Describes maintenance requirements, categories and process
including pre- and post-monsoon annual walkthroughs and maintenance plans (budgets)
Operation Aspects n/a Presents
operation calendar and gate operators
A comprehensive section covering objectives, procedures and SP operating institutions and staff
O&M Costs Only for
earthworks maintenance
For both earthworks, structures and gate operators
For infrastructure, system operators, pumping and electrical equipment and energy costs.
147. O&M plans have been prepared and O&M training of WMCA / O&M subcommittee members carried out in the regional training centres of Faridpur, Mymensingh and Sylhet for 81 subprojects. C. O&M Performance Assessment
148. No data are yet available.

Eme Report 2013 (2) - 26 - 13 August 2014
TABLES

Table A.1 1 8/13/2014
80
Engineer's Estimate
Contract Amount
Engineer's Estimate
Contract Amount
Engineer's Estimate
Contract Amount
Unit Cost (Tk/ha)
Unit Cost (US$/ha)
1. Mymensingh Gafargaon SP31001, Rouha CAD Subproject CAD 644 31,770,932 29,610,508 31,770,932 29,610,508 45,979 5752. Faridpur Nagarkanda SP31003, Beel Gobindapur Subproject FMD&WC 708 18,973,828 23,239,264 9,977,077 9,977,077 28,950,905 33,216,341 46,916 5863. Habiganj Nabiganj SP31004, Arua Kalkalia Subproject WC 546 4,889,025 5,847,357 9,826,654 9,826,654 14,715,679 15,674,011 28,707 3594. Sherpur Nalitabari SP31005, Ranjana Jharna Khal Subproject WC 380 15,396,190 16,133,368 187,369 187,369 15,583,559 16,320,737 42,949 5375. Sylhet Sadar SP31006, Bawa-Chamurakandi Boro Haor Subproject FM&WC 200 8,783,074 7,997,536 6,266,784 5,983,761 15,049,858 13,981,297 69,906 8746. Gopalgonj Kotalipara SP31007, Barua-Kumaria Subproject FMD&IRR 800 13,518,866 13,408,802 5,525,368 5,525,368 19,044,234 18,934,170 23,668 2967. Netrokona Kalmakanda SP31008, Pukuria-Uziakhali Khal Subproject FM 784 7,666,370 7,321,072 5,601,404 5,601,404 13,267,774 12,922,476 16,483 2068. Faridpur Madhukhali SP32009, Satgavia Beel Subproject DR&WC 890 13,588,372 11,201,277 4,799,721 4,782,654 18,388,093 15,983,931 17,959 2249. Netrokona Atpara SP32010, Langulia Khal Subproject FM&WC 731 23,815,512 26,844,092 306,852 306,852 24,122,364 27,150,944 37,142 464
10. Shariatpur Damuddya SP32011, Char Narayanpur-Naogaon Khal Subproject DR&IRR 350 904,972 879,392 3,816,086 3,816,356 4,721,058 4,695,748 13,416 16811. Sunamgonj Jaggannathpur SP32013, Roail-Helalpur Subproject FMD&WC 960 17,153,713 20,867,575 9,392,667 9,392,667 26,546,380 30,260,242 31,521 39412. Rajbari Baliakandi SP32014, Talbaria Beel Subproject FMD&WC 322 7,031,749 7,690,534 543,663 543,663 7,575,412 8,234,197 25,572 32013. Rajbari Sadar SP32015, Nimtala Beel Subproject DR&WC 563 6,575,086 7,136,955 894,516 894,516 7,469,602 8,031,471 14,265 17814. Gopalgonj Kasiani SP32016, Mamudpur-Jikarbari Subproject DR&IRR 350 2,332,917 2,332,917 2,332,917 2,332,917 6,665 8315. Jamalpur Sharishabari SP32017, Rothkhola-Kamarbari Subproject FMD 191 2,377,862 2,245,538 559,483 559,483 2,937,345 2,805,021 14,686 18416. Jamalpur Islampur SP32018, Batikamari Beel Subproject FMD 844 11,315,819 11,829,754 9,046,671 8,741,254 20,362,490 20,571,008 24,373 30517. Gopalgonj Sadar SP32019, Katarbari-Karagati Subproject DR&IRR 730 7,339,412 7,339,412 7,339,412 7,339,412 10,054 12618. Madaripur Kalkini SP32020, Bansgari Subproject DR&IRR 424 996,739 995,540 7,159,550 7,159,550 8,156,289 8,155,090 19,234 24019. Moulavibazar Kamalganj SP32021, Laghata Chhara Subproject WC 378 8,590,763 9,870,401 2,490,306 2,490,306 11,081,069 12,360,707 32,700 40920. Jamalpur Dewanganj SP32022, Khorma-Tilokpur Subproject FMD 453 5,696,870 6,073,951 5,082,527 5,082,527 10,779,397 11,156,478 24,628 30821. Habiganj Nabiganj SP32023, Raiarpur Boro Khal Subproject FMD&WC 650 6,415,739 7,215,546 4,229,551 4,229,551 10,645,290 11,445,097 17,608 22022. Tangail Gopalpur SP32025, Barasila Beel Subproject DR&WC 405 5,276,109 6,633,784 2,096,174 2,096,174 7,372,283 8,729,958 21,555 26923. Sherpur Nalitabari SP32026, Sutiar Khal Subproject WC&CAD 540 16,266,665 17,700,640 2,097,293 2,097,293 18,363,958 19,797,933 36,663 45824. Mymensingh Fulpur SP32027, Kharia Nadi Subproject DR&WC 1,000 11,893,014 11,534,229 6,531,287 6,531,288 18,424,300 18,065,517 18,066 22625. Madaripur Sadar SP32028, Lauer Beel Subproject DR&IRR 520 904,972 904,173 5,615,103 5,615,103 6,520,075 6,519,276 12,537 15726. Sunamgonj Chhatak SP32029, Teli Haor Subproject FMD&WC 412 9,342,013 9,226,480 2,515,699 2,515,699 11,857,712 11,742,180 28,500 35627. Kishoregonj Tarail SP32030, Phuleswari-Sonai Beel Subproject FMD 246 9,245,803 9,830,364 2,619,597 2,619,597 11,865,400 12,449,961 50,610 63328. Habiganj Lakhai SP32031, Dhanchari Khal Subproject DR&IRR 250 1,641,589 1,461,646 1,702,472 1,702,472 3,344,060 3,164,118 12,656 15829. Madaripur Rajoir SP32032, Kamarer Khal Subproject DR&IRR 700 9,571,267 9,571,267 9,571,267 9,571,267 13,673 17130. Sunamgonj Sadar SP32033, Mugai Khal Subproject WC 575 16,031,750 17,379,695 3,702,243 3,702,243 19,733,993 21,081,938 36,664 45831. Faridpur Sadarpur SP32035, Akoterchar-Nolertek-Chaiterkole Khal Subproject DR 950 4,911,361 5,248,748 5,033,885 5,033,885 9,945,246 10,282,633 10,824 13532. Tangail Gopalpur SP32036, Basan Beel Subproject FMD 491 7,049,893 9,319,777 2,906,154 2,906,154 9,956,047 12,225,931 24,900 31133. Madaripur Sadar SP32038, Laxmiganj-Rupriya Khal Subproject DR&IRR 520 3,416,429 3,932,491 8,490,535 8,490,535 11,906,964 12,423,026 23,890 29934. Moulavibazar Kamalganj SP33039, Kurma Chhara Subproject WC 380 12,324,464 13,940,951 2,893,616 2,893,616 15,218,080 16,834,567 44,301 55435. Gopalgonj Moksudpur SP33040, Ghechua-Simulsur-Kalinagar Subproject DR&IRR 440 1,668,378 1,827,610 4,758,818 4,758,818 6,427,196 6,586,428 14,969 18736. Tangail Dhanbari SP33041, Goalia (Dhanbari) Beel Subproject FMD 137 2,350,552 2,702,013 306,653 306,653 2,657,205 3,008,666 21,961 27537. Tangail Dhanbari SP33042, Goilla Beel Subproject FMD 197 7,265,396 8,285,546 1,544,451 1,544,451 8,809,847 9,829,997 49,898 62438. Netrokona Atpara SP33045, Pudda Khali Khal Subproject FMD 193 8,256,071 9,445,351 5,133,793 5,133,793 13,389,864 14,579,144 75,540 94439. Faridpur Boalmari SP33046, Rupadia-Majurdia Khal Subproject DR 300 7,595,321 7,595,321 7,595,321 7,595,321 25,318 31640. Moulavibazar Kamalganj SP33047, Shial Chhara Subproject FMD&WC 287 9,000,337 8,280,895 1,703,001 1,703,001 10,703,338 9,983,896 34,787 43541. Mymensingh Nandail SP33048, Bapail Beel Subproject DR&WC 1,000 11,515,594 12,102,777 5,560,759 5,560,759 17,076,353 17,663,536 17,664 22142. Mymensingh Nandail SP33049, Bawlar Beel Subproject FMD 860 8,896,169 9,555,455 5,244,402 5,244,402 14,140,571 14,799,857 17,209 21543. Mymensingh Nandail SP33050, Narsunda-Tongi Khal Subproject DR 860 3,311,325 3,702,020 9,935,302 9,935,302 13,246,627 13,637,322 15,857 19844. Kishoregonj Nikli SP33052, Dubir Boro Dhair Subproject FM 550 12,747,807 11,510,844 849,878 850,678 13,597,685 12,361,522 22,476 281
LCS Cost (Tk) Total Cost (Tk)
Table A.1: Subproject Areas and Construction Costs
District UpazilaContract AmountBenefited
Area (ha)Type of SPSubproject ID & NameStructure Cost (Tk)

Table A.1 2 8/13/2014
Engineer's Estimate
Contract Amount
Engineer's Estimate
Contract Amount
Engineer's Estimate
Contract Amount
Unit Cost (Tk/ha)
Unit Cost (US$/ha)
LCS Cost (Tk) Total Cost (Tk)District Upazila
Contract AmountBenefited Area (ha)Type of SPSubproject ID & Name
Structure Cost (Tk)
45. Moulavibazar Sreemongal SP33053, Lunglia Chhara Subproject WC 300 30,969,394 34,085,342 1,515,259 1,515,259 32,484,653 35,600,601 118,669 1,48346. Sylhet Gowainghat SP33054, Shialar Haor Subproject FMD 520 21,117,297 24,125,053 7,650,465 7,650,465 28,767,762 31,775,518 61,107 76447. Mymensingh Dhobaura SP33055, Tarai Nadi Subproject DR&WC 613 21,091,819 22,694,044 2,675,044 2,675,044 23,766,863 25,369,088 41,385 51748. Kishoregonj Karimganj SP33057, Saguli-Prayag Beel Subproject FMD 245 4,400,976 3,556,724 2,361,299 2,361,299 6,762,275 5,918,023 24,155 30249. Moulavibazar Sadar SP33058, Lekha Beel Subproject DR&WC 513 7,674,252 8,679,611 2,552,134 2,552,134 10,226,386 11,231,745 21,894 27450. Faridpur Nagarkanda SP33059, Baneswardi Subproject CAD&DR 316 26,763,650 31,813,445 484,697 484,697 27,248,347 32,298,142 102,209 1,27851. Gopalgonj Tungipara SP33060, Lebutala-Bashbaria Subproject FMD&WC 325 19,827,721 18,832,554 7,702,710 7,702,710 27,530,431 26,535,264 81,647 1,02152. Gopalgonj Sadar SP33061, Urafi-Jangal Danga Subproject DR&IRR 640 5,506,189 5,506,189 5,506,189 5,506,189 8,603 10853. Rajbari Kalukhali SP33063, Betbaria Khal Subproject DR&WC 569 5,681,361 6,413,308 6,489,364 6,489,364 12,170,725 12,902,672 22,676 28354. Rajbari Pangsha SP33064, Machpara-Lakshmandia Khal Subproject DR&WC 551 7,042,302 8,028,519 6,467,052 6,467,052 13,509,354 14,495,571 26,308 32955. Sylhet Kanaighat SP33065, Surai Khal Subproject WC 315 18,087,179 19,164,514 3,643,316 3,643,316 21,730,495 22,807,830 72,406 90556. Shariatpur Sadar SP33066, Chitalia Khal Subproject DR&IRR 450 1,666,426 1,812,191 7,190,694 7,190,694 8,857,120 9,002,885 20,006 25057. Moulavibazar Kamalganj SP33068, Kala Chhara Subproject FMD&WC 214 19,043,323 19,725,014 2,159,504 2,159,504 21,202,827 21,884,518 102,264 1,27858. Jamalpur Sharishabari SP33071, Borobaria-Suakair Subproject FMD 870 22,752,782 21,277,782 15,164,638 13,909,293 37,917,420 35,187,075 40,445 50659. Habiganj Nabiganj SP33074, Sherpur Katakhali Khal Subproject DR&WC 352 1,594,448 1,417,651 11,932,836 11,932,836 13,527,284 13,350,487 37,928 47460. Shariatpur Sadar SP33076, Chandrapur Khal Subproject DR&IRR 341 3,756,992 5,126,716 3,756,992 5,126,716 15,034 18861. Madaripur Rajoir SP33078, Amgram Subproject DR&IRR 976 1,512,969 1,222,693 7,599,550 7,599,550 9,112,519 8,822,243 9,039 11362. Mymensingh Gafargaon SP33079, Chait Beel Subproject FMD 420 7,476,083 7,640,199 1,021,015 1,021,015 8,497,098 8,661,214 20,622 25863. Mymensingh Fulbaria SP33080, Gujakuri Khal Subproject FMD&WC 563 9,676,126 10,983,577 3,163,146 3,163,146 12,839,272 14,146,723 25,127 31464. Mymensingh Fulbaria SP33081, Salnar Khal Subproject FM&WC 614 7,400,808 8,377,679 2,440,849 2,440,849 9,841,657 10,818,528 17,620 22065. Mymensingh Fulbaria SP33082, Kalmina Khal Subproject FMD&WC 950 26,791,550 22,757,391 893,779 893,779 27,685,330 23,651,171 24,896 31166. Habiganj Lakhai SP33087, Ferani Beel-Shakhati Khal Subproject DR&IRR 900 1,641,589 1,461,646 6,950,315 6,950,315 8,591,904 8,411,961 9,347 11767. Mymensingh Fulbaria SP33088, Foliar Khal Subproject FMD&WC 550 11,787,727 13,562,267 3,025,312 3,025,312 14,813,039 16,587,579 30,159 37768. Shariatpur Bhedarganj SP33091, Chukdar Kandi Khal Subproject DR&IRR 480 6,213,279 7,291,859 5,828,064 5,828,064 12,041,343 13,119,923 27,333 34269. Jamalpur Sadar SP33093, Nachna Salika Khal Subproject FMD&WC 739 15,194,815 17,473,629 11,155,201 11,155,201 26,350,016 28,628,830 38,740 48470. Rajbari Baliakandi SP33095, Dakshinbari Khal Subproject DR&WC 499 6,088,987 6,959,621 3,107,091 3,107,091 9,196,078 10,066,712 20,174 25271. Sylhet Gowainghat SP34107, Binnakandi Subproject WC 309 12,399,530 13,938,642 2,663,298 2,663,298 15,062,829 16,601,940 53,728 67272. Moulavibazar Sadar SP34109, Kachuar Khal Subproject DR&WC 680 21,352,707 23,339,671 5,152,086 5,152,086 26,504,793 28,491,757 41,900 52473. Madaripur Kalkini SP34113, Urarchar-Snanghata-Akalbaris Khal Subproject DR&IRR 300 1,398,042 1,276,930 9,819,884 9,819,884 11,217,926 11,096,814 36,989 46274. Madaripur Kalkini SP34114, Char Lakshmipur Khal Subproject DR&IRR 950 1,398,042 1,196,195 28,870,282 28,870,282 30,268,324 30,066,477 31,649 39675. Habiganj Nabiganj SP34116, Rashukhali Khal Subproject DR&IRR 451 6,672,477 6,672,477 6,672,477 6,672,477 14,795 18576. Habiganj Nabiganj SP34123, Muktahar Khal Subproject DR&WC 810 8,766,670 9,668,770 6,537,742 6,537,742 15,304,412 16,206,512 20,008 25077. Habiganj Nabiganj SP34124, Bara Chhara (Nabiganj) Subproject WC 529 9,618,359 10,601,479 8,618,649 8,618,649 18,237,008 19,220,128 36,333 45478. Habiganj Baniachang SP34127, Borak Khal-Kata Khal (Khagaura) Subproject DR&IRR 750 1,358,914 1,227,283 10,553,077 10,553,077 11,911,991 11,780,360 15,707 19679. Faridpur Nagarkanda SP34130, Phulsuti Subproject DR&IRR 350 1,398,042 1,519,795 6,267,086 6,267,086 7,665,128 7,786,881 22,248 27880. Habiganj Sadar SP34135, Morabotai-Longlapur Khal Subproject DR 998 1,358,914 1,277,021 10,256,201 10,256,201 11,615,115 11,533,222 11,556 14481. Habiganj Madhabpur SP34138, Jangal Khal Subproject DR 345 1,401,766 1,411,594 3,420,314 3,420,314 4,822,080 4,831,908 14,006 17582. Faridpur Saltha SP34141, Atghar-Durgapur Khal Subproject DR 512 4,709,523 4,859,106 4,709,523 4,859,106 9,490 11983. Habiganj Madhabpur SP34142, Baksair Beel Subproject DR 400 1,400,830 1,266,572 3,414,661 3,414,661 4,815,491 4,681,233 11,703 146
Total 83 44,920 732,125,849 777,014,214 433,178,077 432,837,604 1,165,303,926 1,209,851,817 26,933 337Average/SP 541 8,820,793 9,361,617 5,219,013 5,214,911 14,039,806 14,576,528
64.2% 35.8% 100.0%

Table A.2 1 8/13/2014
Male Female % Savings Shares Others Total Taka / Member Target Collected Taka /
Member % of
Target1. SP31001 Rouha CAD Subproject Mymensingh Gafargaon 644 1,494 736 335 72% 671,450 24,500 59,260 755,210 705 371,301 371,000 346.41 100%2. SP31003 Beel Gobindapur Subproject Faridpur Nagarkanda 708 750 498 233 97% 65,770 36,550 14,620 116,940 160 299,283 300,000 410.4 100%3. SP31004 Arua Kalkalia Subproject Habiganj Nabiganj 546 358 699 414 311% 1,212,240 799,600 52,035 2,063,875 1,854 213,937 308,000 276.73 144%4. SP31005 Ranjana Jharna Khal Subproject Sherpur Nalitabari 380 384 320 65 100% 204,410 24,250 3,850 232,510 604 255,000 256,000 664.94 100%5. SP31006 Bawa-Chamurakandi Boro Haor Subproject Sylhet Sadar 200 205 191 85 135% 91,940 13,800 40,607 146,347 530 231,906 318,600 1154.35 137%6. SP31007 Barua-Kumaria Subproject Gopalgonj Kotalipara 800 1,088 527 240 70% 53,000 38,000 15,340 106,340 139 251,208 252,000 328.55 100%7. SP31008 Pukuria-Uziakhali Khal Subproject Netrokona Kalmakanda 784 1,060 491 219 67% 95,090 47,680 33,130 175,900 248 431,820 540,000 760.56 125%8. SP32009 Satgavia Beel Subproject Faridpur Madhukhali 890 850 654 240 105% 79,050 44,700 17,880 141,630 158 299,012 300,000 335.57 100%9. SP32010 Langulia Khal Subproject Netrokona Atpara 731 565 409 50 81% 85,640 63,250 79,254 228,144 497 315,774 315,774 687.96 100%
10. SP32011 Char Narayanpur-Naogaon Khal Subproject Shariatpur Damuddya 350 329 247 109 108% 74,201 39,660 12,320 126,181 354 89,971 107,971 303.29 120%11. SP32013 Roail-Helalpur Subproject Sunamgonj Jaggannathpur 960 438 305 130 99% 182,590 38,500 19,250 240,340 553 400,500 414,000 951.72 103%12. SP32014 Talbaria Beel Subproject Rajbari Baliakandi 322 322 105 25 40% 21,000 20,650 13,000 54,650 420 73,047 91,100 700.77 125%13. SP32015 Nimtala Beel Subproject Rajbari Sadar 563 343 95 25 35% 23,000 6,000 12,000 41,000 342 131,910 150,000 1250 114%14. SP32016 Mamudpur-Jikarbari Subproject Gopalgonj Kasiani 350 535 340 40 71% 19,000 19,000 7,600 45,600 120 68,806 87,000 228.95 126%15. SP32017 Rothkhola-Kamarbari Subproject Jamalpur Sharishabari 191 600 350 88 73% 54,530 53,150 4,380 112,060 256 72,954 75,300 171.92 103%16. SP32018 Batikamari Beel Subproject Jamalpur Islampur 844 1,210 248 88 28% 11,600 16,800 7,650 36,050 107 300,048 318,050 946.58 106%17. SP32019 Katarbari-Karagati Subproject Gopalgonj Sadar 730 715 494 26 73% 40,000 26,000 10,400 76,400 147 181,601 200,000 384.62 110%18. SP32020 Bansgari Subproject Madaripur Kalkini 424 653 426 108 82% 120,500 62,500 40,880 223,880 419 187,171 200,000 374.53 107%19. SP32021 Laghata Chhara Subproject Moulavibazar Kamalganj 378 375 220 65 76% 28,500 28,500 300 57,300 201 150,600 225,000 789.47 149%20. SP32022 Khorma-Tilokpur Subproject Jamalpur Dewanganj 453 1,700 311 299 36% 16,540 30,500 47,040 77 215,052 197,058 323.05 92%21. SP32023 Raiarpur Boro Khal Subproject Habiganj Nabiganj 650 426 485 106 139% 319,000 59,100 32,105 410,205 694 198,930 300,000 507.61 151%22. SP32025 Barasila Beel Subproject Tangail Gopalpur 405 704 427 76 71% 93,620 25,150 14,970 133,740 266 80,493 98,493 195.81 122%23. SP32026 Sutiar Khal Subproject Sherpur Nalitabari 540 753 658 95 100% 51,660 37,650 7,530 96,840 129 294,209 312,024 414.37 106%24. SP32027 Kharia Nadi Subproject Mymensingh Fulpur 1,000 963 680 120 83% 39,690 16,000 32,000 87,690 110 463,950 482,000 602.5 104%25. SP32028 Lauer Beel Subproject Madaripur Sadar 520 714 450 151 84% 98,580 60,100 48,080 206,760 344 169,003 190,888 317.62 113%26. SP32029 Teli Haor Subproject Sunamgonj Chhatak 412 186 205 35 129% 94,000 24,000 14,000 132,000 550 138,000 150,000 625 109%27. SP32030 Phuleswari-Sonai Beel Subproject Kishoregonj Tarail 246 520 292 44 65% 24,100 16,800 6,720 47,620 142 171,105 171,200 509.52 100%28. SP32031 Dhanchari Khal Subproject Habiganj Lakhai 250 199 197 106 152% 97,550 30,300 12,120 139,970 462 52,032 80,000 264.03 154%29. SP32032 Kamarer Khal Subproject Madaripur Rajoir 700 401 230 130 90% 39,666 23,000 62,666 174 178,315 196,500 545.83 110%30. SP32033 Mugai Khal Subproject Sunamgonj Sadar 575 554 371 20 71% 93,200 39,100 15,450 147,750 378 228,000 200,000 511.51 88%31. SP32035 Akoterchar-Nolertek-Chaiterkole Khal Subproject Faridpur Sadarpur 950 210 188 76 126% 90,500 30,000 5,280 125,780 476 146,250 146,250 553.98 100%32. SP32036 Basan Beel Subproject Tangail Gopalpur 491 366 229 72 82% 51,200 15,050 8,940 75,190 250 106,197 124,197 412.61 117%33. SP32038 Laxmiganj-Rupriya Khal Subproject Madaripur Sadar 520 602 305 155 76% 86,000 46,000 27,350 159,350 346 306,696 306,696 666.73 100%34. SP33039 Kurma Chhara Subproject Moulavibazar Kamalganj 380 610 397 30 70% 21,350 21,350 12,810 55,510 130 259,350 278,849 653.04 108%35. SP33040 Ghechua-Simulsur-Kalinagar Subproject Gopalgonj Moksudpur 440 520 225 58 54% 40,705 15,650 6,260 62,615 221 196,882 136,000 480.57 69%36. SP33041 Goalia (Dhanbari) Beel Subproject Tangail Dhanbari 137 316 139 50 60% 17,800 9,450 5,670 32,920 174 64,282 59,205 313.25 92%37. SP33042 Goilla Beel Subproject Tangail Dhanbari 197 355 167 74 68% 64,000 12,050 7,230 83,280 346 156,591 98,897 410.36 63%38. SP33045 Pudda Khali Khal Subproject Netrokona Atpara 193 294 243 63 104% 30,000 30,600 14,340 74,940 245 151,560 152,000 496.73 100%39. SP33046 Rupadia-Majurdia Khal Subproject Faridpur Boalmari 300 410 302 68 90% 45,700 18,500 18,500 82,700 224 153,900 153,900 415.95 100%40. SP33047 Shial Chhara Subproject Moulavibazar Kamalganj 287 264 202 15 82% 11,638 11,736 6,510 29,884 138 130,500 130,500 601.38 100%41. SP33048 Bapail Beel Subproject Mymensingh Nandail 1,000 923 470 20 53% 16,000 24,500 14,700 55,200 113 395,640 396,000 808.16 100%42. SP33049 Bawlar Beel Subproject Mymensingh Nandail 860 708 498 48 77% 28,440 27,300 16,800 72,540 133 279,900 280,000 512.82 100%43. SP33050 Narsunda-Tongi Khal Subproject Mymensingh Nandail 860 420 150 46,000 28,500 74,500 131 238,320 238,500 418.42 100%44. SP33052 Dubir Boro Dhair Subproject Kishoregonj Nikli 550 404 203 100 75% 95,960 15,300 9,090 120,350 397 188,250 188,250 621.29 100%45. SP33053 Lunglia Chhara Subproject Moulavibazar Sreemongal 300 285 171 25 69% 10,100 9,800 5,880 25,780 132 358,998 298,500 1522.96 83%46. SP33054 Shialar Haor Subproject Sylhet Gowainghat 520 419 486 242 174% 51,680 36,400 72,800 160,880 221 488,994 490,000 673.08 100%47. SP33055 Tarai Nadi Subproject Mymensingh Dhobaura 613 625 560 85 103% 30,395 32,250 19,350 81,995 127 252,420 251,250 389.53 100%48. SP33057 Saguli-Prayag Beel Subproject Kishoregonj Karimganj 245 400 210 54 66% 27,000 13,200 7,920 48,120 182 180,000 180,000 681.82 100%49. SP33058 Lekha Beel Subproject Moulavibazar Sadar 513 352 270 25 84% 25,000 14,750 6,750 46,500 158 227,655 190,155 644.59 84%50. SP33059 Baneswardi Subproject Faridpur Nagarkanda 316 353 265 75 96% 180,000 140,000 12,510 332,510 978 303,707 289,000 850 95%51. SP33060 Lebutala-Bashbaria Subproject Gopalgonj Tungipara 325 635 376 72 71% 122,200 22,400 22,400 167,000 373 290,153 282,000 629.46 97%52. SP33061 Urafi-Jangal Danga Subproject Gopalgonj Sadar 640 616 395 95 80% 21,500 21,500 12,500 55,500 113 145,656 156,000 318.37 107%53. SP33063 Betbaria Khal Subproject Rajbari Kalukhali 569 270 199 86 106% 34,000 14,250 22,800 71,050 249 400,500 280,000 982.46 70%54. SP33064 Machpara-Lakshmandia Khal Subproject Rajbari Pangsha 551 650 103 22 19% 43,550 7,800 10,000 61,350 491 280,589 284,000 2272 101%
Table A.2: WMCA MEMBERSHIP, CAPITAL FUNDS AND O&M CONTRIBUTIONS
Subproject ID & NameO&M Contribution (Tk.)Membership Capital Funds (Tk.)
Area(ha)
Beneficiary Households
(Nos.)UpazilaDistrict
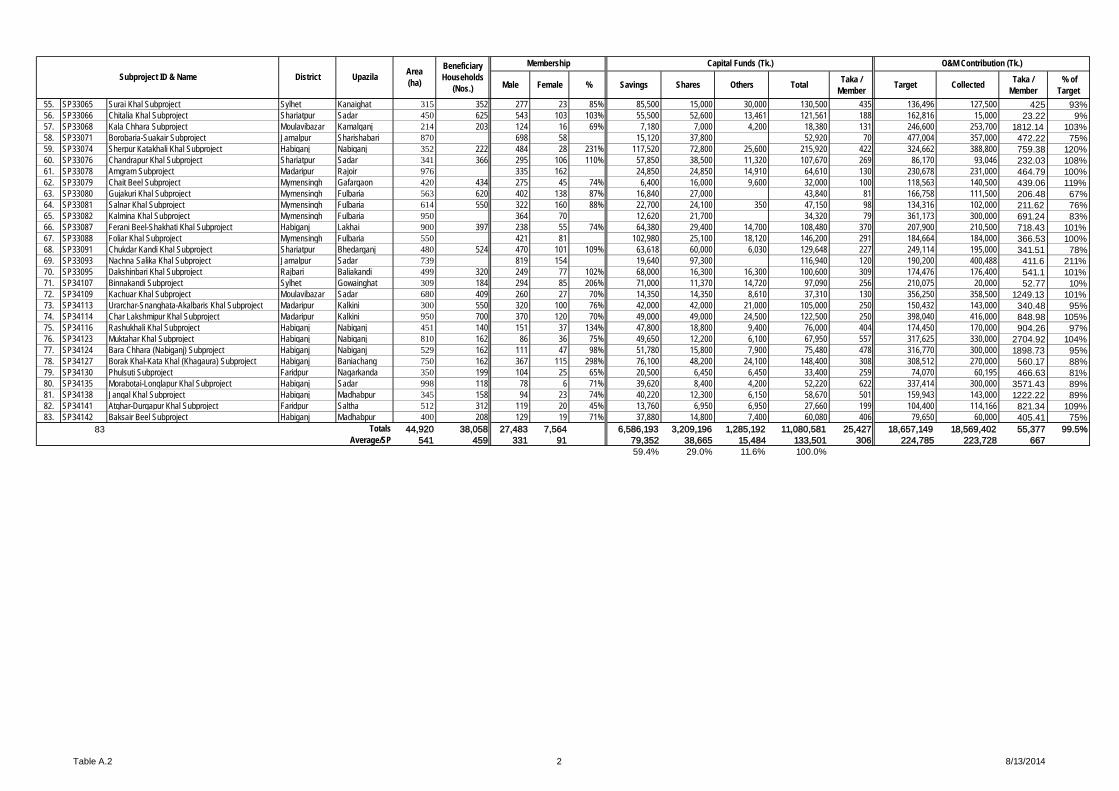
Table A.2 2 8/13/2014
Male Female % Savings Shares Others Total Taka / Member Target Collected Taka /
Member % of
TargetSubproject ID & Name
O&M Contribution (Tk.)Membership Capital Funds (Tk.)Area(ha)
Beneficiary Households
(Nos.)UpazilaDistrict
55. SP33065 Surai Khal Subproject Sylhet Kanaighat 315 352 277 23 85% 85,500 15,000 30,000 130,500 435 136,496 127,500 425 93%56. SP33066 Chitalia Khal Subproject Shariatpur Sadar 450 625 543 103 103% 55,500 52,600 13,461 121,561 188 162,816 15,000 23.22 9%57. SP33068 Kala Chhara Subproject Moulavibazar Kamalganj 214 203 124 16 69% 7,180 7,000 4,200 18,380 131 246,600 253,700 1812.14 103%58. SP33071 Borobaria-Suakair Subproject Jamalpur Sharishabari 870 698 58 15,120 37,800 52,920 70 477,004 357,000 472.22 75%59. SP33074 Sherpur Katakhali Khal Subproject Habiganj Nabiganj 352 222 484 28 231% 117,520 72,800 25,600 215,920 422 324,662 388,800 759.38 120%60. SP33076 Chandrapur Khal Subproject Shariatpur Sadar 341 366 295 106 110% 57,850 38,500 11,320 107,670 269 86,170 93,046 232.03 108%61. SP33078 Amgram Subproject Madaripur Rajoir 976 335 162 24,850 24,850 14,910 64,610 130 230,678 231,000 464.79 100%62. SP33079 Chait Beel Subproject Mymensingh Gafargaon 420 434 275 45 74% 6,400 16,000 9,600 32,000 100 118,563 140,500 439.06 119%63. SP33080 Gujakuri Khal Subproject Mymensingh Fulbaria 563 620 402 138 87% 16,840 27,000 43,840 81 166,758 111,500 206.48 67%64. SP33081 Salnar Khal Subproject Mymensingh Fulbaria 614 550 322 160 88% 22,700 24,100 350 47,150 98 134,316 102,000 211.62 76%65. SP33082 Kalmina Khal Subproject Mymensingh Fulbaria 950 364 70 12,620 21,700 34,320 79 361,173 300,000 691.24 83%66. SP33087 Ferani Beel-Shakhati Khal Subproject Habiganj Lakhai 900 397 238 55 74% 64,380 29,400 14,700 108,480 370 207,900 210,500 718.43 101%67. SP33088 Foliar Khal Subproject Mymensingh Fulbaria 550 421 81 102,980 25,100 18,120 146,200 291 184,664 184,000 366.53 100%68. SP33091 Chukdar Kandi Khal Subproject Shariatpur Bhedarganj 480 524 470 101 109% 63,618 60,000 6,030 129,648 227 249,114 195,000 341.51 78%69. SP33093 Nachna Salika Khal Subproject Jamalpur Sadar 739 819 154 19,640 97,300 116,940 120 190,200 400,488 411.6 211%70. SP33095 Dakshinbari Khal Subproject Rajbari Baliakandi 499 320 249 77 102% 68,000 16,300 16,300 100,600 309 174,476 176,400 541.1 101%71. SP34107 Binnakandi Subproject Sylhet Gowainghat 309 184 294 85 206% 71,000 11,370 14,720 97,090 256 210,075 20,000 52.77 10%72. SP34109 Kachuar Khal Subproject Moulavibazar Sadar 680 409 260 27 70% 14,350 14,350 8,610 37,310 130 356,250 358,500 1249.13 101%73. SP34113 Urarchar-Snanghata-Akalbaris Khal Subproject Madaripur Kalkini 300 550 320 100 76% 42,000 42,000 21,000 105,000 250 150,432 143,000 340.48 95%74. SP34114 Char Lakshmipur Khal Subproject Madaripur Kalkini 950 700 370 120 70% 49,000 49,000 24,500 122,500 250 398,040 416,000 848.98 105%75. SP34116 Rashukhali Khal Subproject Habiganj Nabiganj 451 140 151 37 134% 47,800 18,800 9,400 76,000 404 174,450 170,000 904.26 97%76. SP34123 Muktahar Khal Subproject Habiganj Nabiganj 810 162 86 36 75% 49,650 12,200 6,100 67,950 557 317,625 330,000 2704.92 104%77. SP34124 Bara Chhara (Nabiganj) Subproject Habiganj Nabiganj 529 162 111 47 98% 51,780 15,800 7,900 75,480 478 316,770 300,000 1898.73 95%78. SP34127 Borak Khal-Kata Khal (Khagaura) Subproject Habiganj Baniachang 750 162 367 115 298% 76,100 48,200 24,100 148,400 308 308,512 270,000 560.17 88%79. SP34130 Phulsuti Subproject Faridpur Nagarkanda 350 199 104 25 65% 20,500 6,450 6,450 33,400 259 74,070 60,195 466.63 81%80. SP34135 Morabotai-Longlapur Khal Subproject Habiganj Sadar 998 118 78 6 71% 39,620 8,400 4,200 52,220 622 337,414 300,000 3571.43 89%81. SP34138 Jangal Khal Subproject Habiganj Madhabpur 345 158 94 23 74% 40,220 12,300 6,150 58,670 501 159,943 143,000 1222.22 89%82. SP34141 Atghar-Durgapur Khal Subproject Faridpur Saltha 512 312 119 20 45% 13,760 6,950 6,950 27,660 199 104,400 114,166 821.34 109%83. SP34142 Baksair Beel Subproject Habiganj Madhabpur 400 208 129 19 71% 37,880 14,800 7,400 60,080 406 79,650 60,000 405.41 75%
83 Totals 44,920 38,058 27,483 7,564 6,586,193 3,209,196 1,285,192 11,080,581 25,427 18,657,149 18,569,402 55,377 99.5%Average/SP 541 459 331 91 79,352 38,665 15,484 133,501 306 224,785 223,728 667
59.4% 29.0% 11.6% 100.0%

8/13/2014 1 8/13/2014
Male Female Total Total Disbursed Total Realized % Male Female Total
1. SP31004 Arua Kalkalia Subproject Habiganj Nabiganj 699 414 1,113 2,374,000 1,263,000 53 260 30 290 8,1862. SP31008 Pukuria-Uziakhali Khal Subproject Netrokona Kalmakanda 491 219 710 50,000 2 3 5 10,0003. SP32014 Talbaria Beel Subproject Rajbari Baliakandi 105 25 130 46,000 8 4 12 3,8334. SP32017 Rothkhola-Kamarbari Subproject Jamalpur Sharishabari 350 88 438 22,000 14,200 65 14 1 15 1,4675. SP32018 Batikamari Beel Subproject Jamalpur Islampur 248 88 336 130,000 18 20 38 3,4216. SP32020 Bansgari Subproject Madaripur Kalkini 426 108 534 405,600 136,560 34 17 4 21 19,3147. SP32023 Raiarpur Boro Khal Subproject Habiganj Nabiganj 485 106 591 339,000 286,000 84 26 5 31 10,9358. SP32031 Dhanchari Khal Subproject Habiganj Lakhai 197 106 303 50,000 7,500 15 4 6 10 5,0009. SP32032 Kamarer Khal Subproject Madaripur Rajoir 230 130 360 20,000 5,400 27 3 2 5 4,00010. SP32035 Akoter Char Nolertek Chaiterkole Khal Subproject Faridpur Sadarpur 188 76 264 470,000 240,000 51 30 20 50 9,40011. SP33059 Baneswardi Subproject Faridpur Nagarkanda 265 75 340 215,000 150,000 70 8 1 9 23,88912. SP33060 Lebutala-Bashbaria Subproject Gopalgonj Tungipara 376 72 448 155,000 86,000 55 11 4 15 10,33313. SP33064 Machpara-Laksmandia Khal Subproject Rajbari Pangsha 103 22 125 138,000 6,000 4 12 3 15 9,20014. SP33095 Dakshinbari Khal Subproject Rajbari Baliakandi 249 77 326 35,000 3,500 10 1 1 35,000
14 Total 4,412 1,606 4,449,600 2,198,160 49 414 103 517 8,607Avereage/SP 315 115 317,829 157,011 30 7 37
Table A.3: Micro Credit Loans
DistrictSubproject ID & NameBorrowers (nos.) Disbursed /
Borrower (Tk)
WMCA Membership (nos.) Loan Information (Tk)Upazila

Table A.4 - Agric Land Use 1 8/13/2014
Table A.4: Agriculture Land Use by Subproject in 2013 Subproject Net Area Cropped Area (ha) Crop Intensity (%) Incremental Crop Production (t)No. Name (ha) Base 2,013 Increment Base 2,013 Increment Cereal Non-cereal
31001 Rouha 644 1,511 1,415 -96 235 220 -15 50 33631003 Tekhala-Naodhara-Katajora Khal 708 1,640 2,107 467 232 298 66 329 1,41831004 Arura Kolkolia 546 539 644 105 99 118 19 859 23831005 Shomschura Ranjana Khal 380 423 541 119 111 142 31 618 31031006 Bawa-Chamurakandi Boro Haor 200 189 201 12 94 101 6 293 9431007 Barua-Kumaria 800 1,448 1,751 303 181 219 38 516 1,27731008 Pukuria Khal-Uziakhali Khal 784 1,301 1,380 79 166 176 10 1,264 16332009 Satgavia Beel 890 1,470 2,117 647 165 238 73 591 2,02032010 Langulia Khal 731 1,070 1,426 357 146 195 49 1,756 19232011 Char Narayanpur-Naogaon Khal 350 416 657 241 119 188 69 1,031 9832013 Roail-Helalpur 960 1,367 1,386 19 142 144 2 779 032014 Talbaria Beel 322 606 653 47 188 203 14 498 4332015 Nimtala Beel 563 1,089 1,134 44 194 201 8 611 11932016 Mahmudpur- Jikarbari 350 395 517 122 113 148 35 404 9532017 Rothkhola Kamarbari 191 430 469 39 225 245 20 179 11932018 Batikamari Beel 844 293 289 -4 35 34 0 35 1932019 Katarbari-Karagati 730 885 946 61 121 130 8 310 7332020 Bansgari 425 350 486 136 82 114 32 623 20732021 Laghata Chhara 378 292 354 62 77 94 16 229 5532022 Khorma-Tilokpur 453 772 769 -3 170 170 -1 467 89832023 Raiarpur Boro Khal 650 729 819 90 112 126 14 1,173 9332025 Barashila Beel 386 581 659 78 151 171 20 58 15032026 Shutiar khal 540 797 874 77 148 162 14 314 19132027 Kharia Nadi 1,000 997 1,015 18 100 101 2 385 21532028 Lauer Beel 520 609 770 161 117 148 31 668 31332029 Teli Haor 412 472 497 25 114 121 6 349 032030 Phuleswari-Sonai Beel 503 594 680 86 118 135 17 389 16732031 Dhanchari Khal 250 250 258 8 100 103 3 80 4032032 Kamarer Khal 700 930 1,015 85 133 145 12 805 10932033 Mugai Khal 575 620 674 54 108 117 9 481 032035 Akterchar-Nolertek-Chaiterkole Khal 950 1,621 1,786 165 171 188 17 735 90832036 Basan Beel 491 724 744 20 148 152 4 117 11832038 Laxmiganj-Rupriya Khal 520 654 714 60 126 137 11 667 4632039 Kurma Chhara 380 379 554 175 100 146 46 719 8833040 Ghechua-Simulsur-Kalinagar 440 389 555 166 88 126 38 273 24033041 Goalia Beel 137 249 270 21 182 197 15 95 261

Table A.4 - Agric Land Use 2 8/13/2014
Subproject Net Area Cropped Area (ha) Crop Intensity (%) Incremental Crop Production (t)No. Name (ha) Base 2,013 Increment Base 2,013 Increment Cereal Non-cereal
33042 Goila Beel 197 349 360 11 177 183 5 196 10633045 Pudda Khali Khal 193 255 317 62 132 164 32 -33 44033046 Rupadia-Majurdia Khal 300 319 372 53 106 124 18 75 4633047 Shial Chhara 287 338 487 149 118 170 52 634 13733048 Bapail Beel 1,000 1,963 1,973 11 196 197 1 509 25833049 Bowlar Beel 860 1,632 1,725 93 190 201 11 1,117 13433050 Narshanda-Tongi Khal 860 1,769 1,833 64 206 213 7 1,231 23033052 Dubir Boro Dhair 550 554 550 -4 101 100 -1 238 4433053 Lunglia Chhara 300 358 424 66 119 141 22 317 4533054 Shialar Haor 520 87 90 3 17 17 1 12 5333055 Tarai Nadi 613 955 1,023 68 156 167 11 915 10933057 Saguli-Prayag Beel 332 216 266 51 65 80 15 390 10133058 Lekha Beel 513 419 422 3 82 82 1 243 033059 Baneswardi 316 547 620 73 173 196 23 225 11333060 Lebutala-Bashbaria 325 509 534 25 157 164 8 223 1733061 Urafi-Jangal Danga 640 692 752 60 108 118 9 482 4133063 Betbaria Khal 569 1,160 1,343 182 204 236 32 476 47633064 Machpara-Lakshmandia Khal 551 913 993 80 166 180 15 665 -52733065 Surai Khal 315 325 341 16 103 108 5 146 14133066 Chitalia Khal 450 505 776 271 112 172 60 939 9133068 Kala Chhara 214 224 304 79 105 142 37 312 12633071 Borobaria-Suakair 870 243 206 -36 28 24 -4 -53 2733074 Sherpur Katakhali Khal 352 314 321 7 89 91 2 56 2533076 Chandrapur Khal 341 357 405 47 105 119 14 72 5533078 Amgram 976 1,029 1,131 102 105 116 10 768 7133079 Chait Beel 420 232 233 1 55 55 0 92 1033080 Gujakuri Khal 563 499 491 -8 89 87 -1 133 16433081 Salnar Khal 614 485 441 -43 79 72 -7 -92 26833082 Kalmina Khal 950 773 789 16 81 83 2 385 12133087 Ferani Beel-Shakhati Khal 900 900 904 4 100 100 0 233 1133088 Foliar Khal 550 702 669 -34 128 122 -6 55 10433091 Chukdar Kandi Khal 480 500 532 32 104 111 7 43 15233093 Nachna Salika Khal 739 1,035 1,024 -11 140 139 -1 73 4133095 Dakshinbari Khal 499 573 635 63 115 127 13 222 18634107 Binnakandi 309 324 330 5 105 107 2 34 5434109 Kachuar Khal 680 413 640 227 61 94 33 831 034113 Urarchar-Snanghata-Akalbaris Khal 300 80 100 19 27 33 6 103 1034114 Char Lakshmipur Khal 950 26 36 11 3 4 1 44 6

Table A.4 - Agric Land Use 3 8/13/2014
Subproject Net Area Cropped Area (ha) Crop Intensity (%) Incremental Crop Production (t)No. Name (ha) Base 2,013 Increment Base 2,013 Increment Cereal Non-cereal
34116 Rashukhali Khal 451 0 3 3 0 1 1 8 734123 Muktahar Khal 810 188 191 3 23 24 0 16 1334124 Bara Chhara 529 412 417 5 78 79 1 53 1734127 Borak Khal-Kata Khal 750 706 707 1 94 94 0 4 234130 Phulsuti 350 153 213 60 44 61 17 86 13034135 Morabotai-Longlapur Khal 998 587 590 3 59 59 0 9 734138 Jangal Khal 345 353 362 9 102 105 2 38 3134141 Atghar-Durgapur Khal 512 141 181 40 28 35 8 205 2634142 Baksair Beel 400 389 399 10 97 100 2 58 7
TOTALS 45,246 52,584 58,580 5,995 116 129 13 31,536 14,432

Table A.5 - Rabi Agric Production 1 8/13/2014
Table A.5: Rabi (Winter) Agriculture Production by Subproject in 2012-2013
Winter (Rabi+Boro) Production (t) Subproject Base Production 2013 Production Incremental Production (t) Increment (%)No. Name Cereal Non-cereal Cereal Non-cereal Cereal Non-cereal Cereal Non-cereal
31001 Rouha 1,195 794 1,498 883 303 89 25 1131003 Tekhala-Naodhara-Katajora Khal 2,063 2,531 2,307 3,106 244 576 12 2331004 Arura Kolkolia 2,098 11 2,891 223 793 212 38 2,02031005 Shomschura Ranjana Khal 330 28 610 232 280 204 85 71631006 Bawa-Chamurakandi Boro Haor 535 91 828 184 293 93 55 10331007 Barua-Kumaria 2,345 8,662 2,625 9,118 280 457 12 531008 Pukuria Khal-Uziakhali Khal 3,732 0 4,609 147 877 147 23 Introduced32009 Satgavia Beel 4,014 965 4,205 994 191 28 5 332010 Langulia Khal 4,445 638 5,077 689 632 52 14 832011 Char Narayanpur-Naogaon Khal 1,009 45 1,848 83 839 39 83 8732013 Roail-Helalpur 4,592 0 5,050 0 457 0 10 Introduced32014 Talbaria Beel 1,429 112 1,727 150 298 38 21 3432015 Nimtala Beel 2,127 340 2,285 427 158 87 7 2632016 Mahmudpur- Jikarbari 1,265 88 1,650 144 385 55 30 6332017 Rothkhola Kamarbari 592 95 723 137 130 42 22 4432018 Batikamari Beel 0 0 0 0 0 0 - -32019 Katarbari-Karagati 3,641 44 3,840 113 199 69 5 15832020 Bansgari 1,228 112 1,722 332 494 220 40 19732021 Laghata Chhara 0 0 0 0 0 0 - -32022 Khorma-Tilokpur 1,183 2,021 1,632 2,839 448 819 38 4132023 Raiarpur Boro Khal 2,312 122 3,415 188 1,103 66 48 5532025 Barashila Beel 1,868 79 1,896 138 28 59 2 7432026 Shutiar khal 692 206 929 391 236 184 34 8932027 Kharia Nadi 0 0 0 0 0 0 - -32028 Lauer Beel 2,856 66 3,419 247 563 181 20 27532029 Teli Haor 1,521 0 1,771 0 250 0 16 Introduced32030 Phuleswari-Sonai Beel 2,900 318 3,036 468 136 150 5 4732031 Dhanchari Khal 1,296 34 1,360 60 64 26 5 7632032 Kamarer Khal 3,103 87 3,683 130 580 43 19 4932033 Mugai Khal 1,962 0 2,366 0 404 0 21 Introduced32035 Akterchar-Nolertek-Chaiterkole Khal 3,791 705 4,417 1,519 626 814 17 11532036 Basan Beel 2,352 151 2,457 218 105 67 4 4432038 Laxmiganj-Rupriya Khal 2,898 79 3,463 117 565 38 19 4832039 Kurma Chhara 0 0 0 0 0 0 - -33040 Ghechua-Simulsur-Kalinagar 1,730 35 1,970 76 239 40 14 11433041 Goalia Beel 678 0 685 220 7 220 1 Introduced

Table A.5 - Rabi Agric Production 2 8/13/2014
Winter (Rabi+Boro) Production (t) Subproject Base Production 2013 Production Incremental Production (t) Increment (%)No. Name Cereal Non-cereal Cereal Non-cereal Cereal Non-cereal Cereal Non-cereal
33042 Goila Beel 1,015 100 1,039 182 24 82 2 8233045 Pudda Khali Khal 1,286 77 1,095 481 -191 404 -15 52233046 Rupadia-Majurdia Khal 0 0 0 0 0 0 - -33047 Shial Chhara 0 0 0 0 0 0 - -33048 Bapail Beel 5,201 140 5,481 280 280 140 5 10033049 Bowlar Beel 3,766 96 4,505 153 739 57 20 5933050 Narshanda-Tongi Khal 4,387 236 5,126 382 739 146 17 6233052 Dubir Boro Dhair 3,017 27 3,255 71 238 44 8 16233053 Lunglia Chhara 0 0 0 0 0 0 - -33054 Shialar Haor 0 0 0 0 0 0 - -33055 Tarai Nadi 3,083 96 3,847 150 764 55 25 5733057 Saguli-Prayag Beel 1,071 69 1,461 170 390 101 36 14633058 Lekha Beel 0 0 0 0 0 0 - -33059 Baneswardi 0 0 0 0 0 0 - -33060 Lebutala-Bashbaria 2,120 83 2,274 99 154 16 7 2033061 Urafi-Jangal Danga 2,800 124 3,097 145 297 21 11 1733063 Betbaria Khal 2,113 368 2,256 440 143 72 7 2033064 Machpara-Lakshmandia Khal 620 1,653 787 1,091 166 -563 27 -3433065 Surai Khal 0 0 0 0 0 0 - -33066 Chitalia Khal 1,695 206 2,257 264 562 58 33 2833068 Kala Chhara 0 0 0 0 0 0 - -33071 Borobaria-Suakair 0 0 0 0 0 0 - -33074 Sherpur Katakhali Khal 1,486 0 1,518 0 32 0 2 -33076 Chandrapur Khal 0 0 0 0 0 0 - -33078 Amgram 4,546 55 5,188 119 642 64 14 11533079 Chait Beel 0 0 0 0 0 0 - -33080 Gujakuri Khal 0 0 0 0 0 0 - -33081 Salnar Khal 0 0 0 0 0 0 - -33082 Kalmina Khal 0 0 0 0 0 0 - -33087 Ferani Beel-Shakhati Khal 4,951 0 5,173 0 222 0 4 -33088 Foliar Khal 0 0 0 0 0 0 - -33091 Chukdar Kandi Khal 0 0 0 0 0 0 - -33093 Nachna Salika Khal 0 0 0 0 0 0 - -33095 Dakshinbari Khal 0 0 0 0 0 0 - -34107 Binnakandi 0 0 0 0 0 0 - -34109 Kachuar Khal 0 0 0 0 0 0 - -34113 Urarchar-Snanghata-Akalbaris Khal 0 0 0 0 0 0 - -

Table A.5 - Rabi Agric Production 3 8/13/2014
Winter (Rabi+Boro) Production (t) Subproject Base Production 2013 Production Incremental Production (t) Increment (%)No. Name Cereal Non-cereal Cereal Non-cereal Cereal Non-cereal Cereal Non-cereal
34114 Char Lakshmipur Khal 0 0 0 0 0 0 - -34116 Rashukhali Khal 0 0 0 0 0 0 - -34123 Muktahar Khal 0 0 0 0 0 0 - -34124 Bara Chhara 0 0 0 0 0 0 - -34127 Borak Khal-Kata Khal 0 0 0 0 0 0 - -34130 Phulsuti 0 0 0 0 0 0 - -34135 Morabotai-Longlapur Khal 0 0 0 0 0 0 - -34138 Jangal Khal 0 0 0 0 0 0 - -34141 Atghar-Durgapur Khal 0 0 0 0 0 0 - -34142 Baksair Beel 0 0 0 0 0 0 - -
TOTAL 110,941 21,789 128,351 27,599 17,410 5,810 16 27
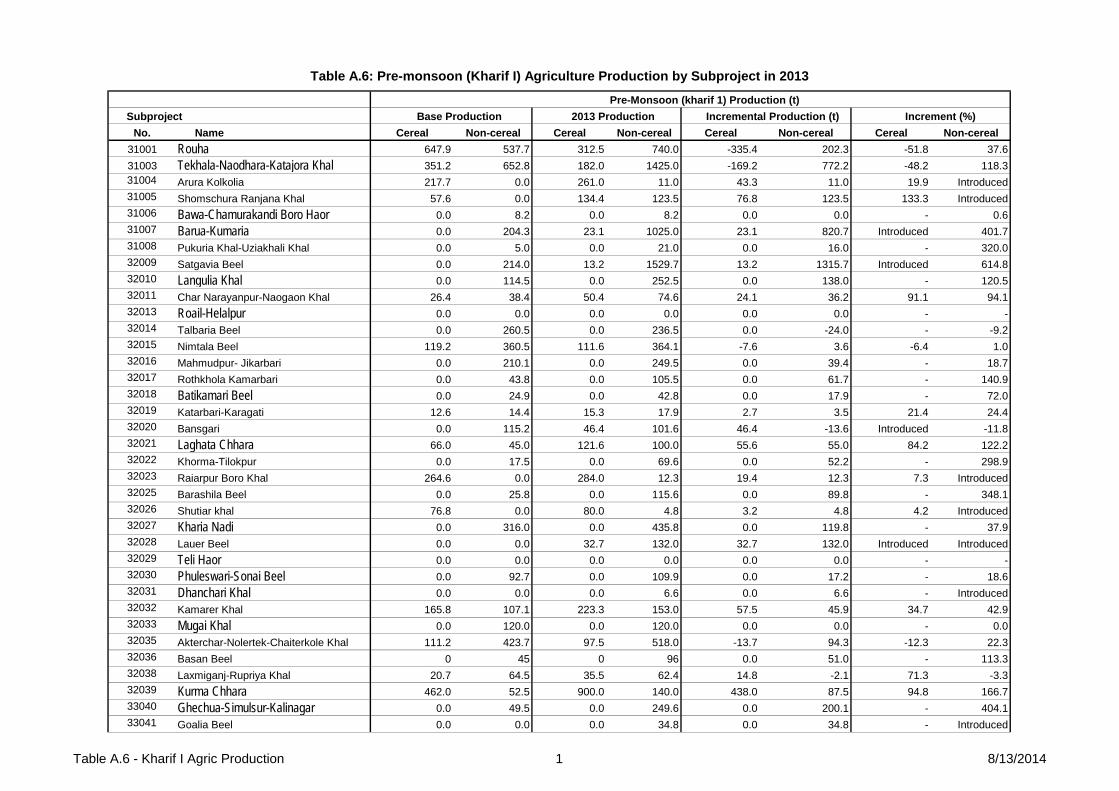
Table A.6 - Kharif I Agric Production 1 8/13/2014
SubprojectNo. Name Cereal Non-cereal Cereal Non-cereal Cereal Non-cereal Cereal Non-cereal
31001 Rouha 647.9 537.7 312.5 740.0 -335.4 202.3 -51.8 37.631003 Tekhala-Naodhara-Katajora Khal 351.2 652.8 182.0 1425.0 -169.2 772.2 -48.2 118.331004 Arura Kolkolia 217.7 0.0 261.0 11.0 43.3 11.0 19.9 Introduced31005 Shomschura Ranjana Khal 57.6 0.0 134.4 123.5 76.8 123.5 133.3 Introduced31006 Bawa-Chamurakandi Boro Haor 0.0 8.2 0.0 8.2 0.0 0.0 - 0.631007 Barua-Kumaria 0.0 204.3 23.1 1025.0 23.1 820.7 Introduced 401.731008 Pukuria Khal-Uziakhali Khal 0.0 5.0 0.0 21.0 0.0 16.0 - 320.032009 Satgavia Beel 0.0 214.0 13.2 1529.7 13.2 1315.7 Introduced 614.832010 Langulia Khal 0.0 114.5 0.0 252.5 0.0 138.0 - 120.532011 Char Narayanpur-Naogaon Khal 26.4 38.4 50.4 74.6 24.1 36.2 91.1 94.132013 Roail-Helalpur 0.0 0.0 0.0 0.0 0.0 0.0 - -32014 Talbaria Beel 0.0 260.5 0.0 236.5 0.0 -24.0 - -9.232015 Nimtala Beel 119.2 360.5 111.6 364.1 -7.6 3.6 -6.4 1.032016 Mahmudpur- Jikarbari 0.0 210.1 0.0 249.5 0.0 39.4 - 18.732017 Rothkhola Kamarbari 0.0 43.8 0.0 105.5 0.0 61.7 - 140.932018 Batikamari Beel 0.0 24.9 0.0 42.8 0.0 17.9 - 72.032019 Katarbari-Karagati 12.6 14.4 15.3 17.9 2.7 3.5 21.4 24.432020 Bansgari 0.0 115.2 46.4 101.6 46.4 -13.6 Introduced -11.832021 Laghata Chhara 66.0 45.0 121.6 100.0 55.6 55.0 84.2 122.232022 Khorma-Tilokpur 0.0 17.5 0.0 69.6 0.0 52.2 - 298.932023 Raiarpur Boro Khal 264.6 0.0 284.0 12.3 19.4 12.3 7.3 Introduced32025 Barashila Beel 0.0 25.8 0.0 115.6 0.0 89.8 - 348.132026 Shutiar khal 76.8 0.0 80.0 4.8 3.2 4.8 4.2 Introduced32027 Kharia Nadi 0.0 316.0 0.0 435.8 0.0 119.8 - 37.932028 Lauer Beel 0.0 0.0 32.7 132.0 32.7 132.0 Introduced Introduced32029 Teli Haor 0.0 0.0 0.0 0.0 0.0 0.0 - -32030 Phuleswari-Sonai Beel 0.0 92.7 0.0 109.9 0.0 17.2 - 18.632031 Dhanchari Khal 0.0 0.0 0.0 6.6 0.0 6.6 - Introduced32032 Kamarer Khal 165.8 107.1 223.3 153.0 57.5 45.9 34.7 42.932033 Mugai Khal 0.0 120.0 0.0 120.0 0.0 0.0 - 0.032035 Akterchar-Nolertek-Chaiterkole Khal 111.2 423.7 97.5 518.0 -13.7 94.3 -12.3 22.332036 Basan Beel 0 45 0 96 0.0 51.0 - 113.332038 Laxmiganj-Rupriya Khal 20.7 64.5 35.5 62.4 14.8 -2.1 71.3 -3.332039 Kurma Chhara 462.0 52.5 900.0 140.0 438.0 87.5 94.8 166.733040 Ghechua-Simulsur-Kalinagar 0.0 49.5 0.0 249.6 0.0 200.1 - 404.133041 Goalia Beel 0.0 0.0 0.0 34.8 0.0 34.8 - Introduced
Table A.6: Pre-monsoon (Kharif I) Agriculture Production by Subproject in 2013
Base Production 2013 Production Incremental Production (t) Increment (%) Pre-Monsoon (kharif 1) Production (t)

Table A.6 - Kharif I Agric Production 2 8/13/2014
SubprojectNo. Name Cereal Non-cereal Cereal Non-cereal Cereal Non-cereal Cereal Non-cereal
Base Production 2013 Production Incremental Production (t) Increment (%) Pre-Monsoon (kharif 1) Production (t)
33042 Goila Beel 0.0 14.8 0.0 31.9 0.0 17.0 - 114.933045 Pudda Khali Khal 0.0 64.0 0.0 100.0 0.0 36.0 - 56.333046 Rupadia-Majurdia Khal 13.2 536.4 20.1 547.5 6.9 11.1 52.3 2.133047 Shial Chhara 490.0 66.0 880.0 202.5 390.0 136.5 79.6 206.833048 Bapail Beel 545.1 211.8 425.3 281.0 -119.9 69.3 -22.0 32.733049 Bowlar Beel 382.8 123.0 486.0 199.5 103.2 76.5 27.0 62.233050 Narshanda-Tongi Khal 459.8 208.0 607.5 292.5 147.7 84.5 32.1 40.633052 Dubir Boro Dhair 0.0 0.0 0.0 0.0 0.0 0.0 - -33053 Lunglia Chhara 401.7 120.0 525.0 165.0 123.3 45.0 30.7 37.533054 Shialar Haor 96.3 186.3 108.0 214.7 11.7 28.4 12.2 15.233055 Tarai Nadi 0.0 40.8 0.0 72.0 0.0 31.2 - 76.533057 Saguli-Prayag Beel 0.0 0.0 0.0 0.0 0.0 0.0 - -33058 Lekha Beel 0.0 0.0 0.0 0.0 0.0 0.0 - -33059 Baneswardi 0.0 765.0 0.0 864.5 0.0 99.4 - 13.033060 Lebutala-Bashbaria 0.0 15.2 0.0 16.3 0.0 1.2 - 7.733061 Urafi-Jangal Danga 0.0 186.2 0.0 205.9 0.0 19.7 - 10.633063 Betbaria Khal 0.0 751.2 140.0 1122.3 140.0 371.1 Introduced 49.433064 Machpara-Lakshmandia Khal 0.0 480.6 30.0 516.7 30.0 36.1 Introduced 7.533065 Surai Khal 220.8 148.0 254.3 245.7 33.5 97.7 15.1 66.033066 Chitalia Khal 9.6 148.2 20.8 181.0 11.2 32.8 116.7 22.133068 Kala Chhara 143.0 54.0 270.0 180.0 127.0 126.0 88.8 233.333071 Borobaria-Suakair 0.0 7.8 0.0 34.5 0.0 26.8 - 345.233074 Sherpur Katakhali Khal 0.0 0.0 0.0 10.4 0.0 10.4 - Introduced33076 Chandrapur Khal 36.0 316.2 18.0 371.0 -18.0 54.8 -50.0 17.333078 Amgram 27.75 13.52 45.74 20.80 18.0 7.3 64.8 53.833079 Chait Beel 105.28 11.25 100 21.25 -5.3 10.0 -5.0 88.933080 Gujakuri Khal 118.65 211.7 62.5 360 -56.2 148.3 -47.3 70.133081 Salnar Khal 370.72 127.5 187.5 322.5 -183.2 195.0 -49.4 152.933082 Kalmina Khal 0 169.8 0 248 0.0 78.2 - 46.133087 Ferani Beel-Shakhati Khal 0 0 0 3.35 0.0 3.4 - Introduced33088 Foliar Khal 631.8 48 560 122.5 -71.8 74.5 -11.4 155.233091 Chukdar Kandi Khal 66.56 405.47 91.98 546.12 25.4 140.7 38.2 34.733093 Nachna Salika Khal 0 498 0 531.5 0.0 33.5 Introduced 6.733095 Dakshinbari Khal 28 339.45 34.1 507 6.1 167.6 21.8 49.434107 Binnakandi 247.5 74.48 262.6 119.7 15.1 45.2 6.1 60.734109 Kachuar Khal 0 0 0 0 0.0 0.0 - -34113 Urarchar-Snanghata-Akalbaris Khal 0 0 0 0 0.0 0.0 - -

Table A.6 - Kharif I Agric Production 3 8/13/2014
SubprojectNo. Name Cereal Non-cereal Cereal Non-cereal Cereal Non-cereal Cereal Non-cereal
Base Production 2013 Production Incremental Production (t) Increment (%) Pre-Monsoon (kharif 1) Production (t)
34114 Char Lakshmipur Khal 0 0 0 0 0.0 0.0 - -34116 Rashukhali Khal 0 0 0 7 0.0 7.0 - Introduced34123 Muktahar Khal 0 0 0 7.04 0.0 7.0 - Introduced34124 Bara Chhara 66.5 35 90 46.15 23.5 11.2 35.3 31.934127 Borak Khal-Kata Khal 0 402.55 0 404.49 0.0 1.9 - 0.534130 Phulsuti 0 22 0 76.5 0.0 54.5 - 247.734135 Morabotai-Longlapur Khal 0 0 0 6.68 0.0 6.7 - Introduced34138 Jangal Khal 0 34.7 3.54 50.27 3.5 15.6 Introduced 44.934141 Atghar-Durgapur Khal 0 0 0 0 0.0 0.0 - -34142 Baksair Beel 79.06 215.784 106.4 213.6 27.3 -2.2 34.6 -1.0
TOTAL 7139.6 11215.9 8253.7 18157.5 1114.0 6941.6 15.6 61.9

Table A.7 - Kharif II Agric Production 1 8/13/2014
SubprojectNo. Name Cereal Non-cereal Cereal Non-cereal Cereal Non-cereal Cereal Non-cereal
31001 Rouha 2,506.2 369.0 2,588.6 413.6 82.4 44.6 3.3 12.131003 Tekhala-Naodhara-Katajora Khal 2,764.5 70.0 3,018.8 140.4 254.3 70.4 9.2 100.631004 Arura Kolkolia 120.6 0.0 143.8 14.5 23.2 14.5 19.2 Introduced31005 Shomschura Ranjana Khal 1,329.2 17.6 1,590.0 0.0 260.8 -17.6 19.6 -100.031006 Bawa-Chamurakandi Boro Haor 0.0 0.0 0.0 0.0 0.0 0.0 - -31007 Barua-Kumaria 1,444.0 0.0 1,657.6 0.0 213.6 0.0 14.8 -31008 Pukuria Khal-Uziakhali Khal 1,662.0 0.0 2,049.0 0.0 387.0 0.0 23.3 -32009 Satgavia Beel 1,937.9 124.0 2,325.4 800.0 387.5 676.0 20.0 545.232010 Langulia Khal 337.5 0.0 1,461.2 2.2 1,123.7 2.2 332.9 Introduced32011 Char Narayanpur-Naogaon Khal 255.0 9.0 423.0 32.0 168.0 23.0 65.9 255.632013 Roail-Helalpur 1,618.9 0.0 1,940.5 0.0 321.6 0.0 19.9 -32014 Talbaria Beel 485.6 27.1 685.6 56.0 200.0 28.9 41.2 106.832015 Nimtala Beel 931.7 43.5 1,392.6 71.5 461.0 28.0 49.5 64.332016 Mahmudpur- Jikarbari 57.6 0.0 76.5 0.0 18.9 0.0 32.8 -32017 Rothkhola Kamarbari 455.0 4.0 504.0 20.0 49.0 16.0 10.8 400.032018 Batikamari Beel 689.9 9.0 724.5 10.0 34.6 1.0 5.0 11.132019 Katarbari-Karagati 466.3 0.0 574.2 0.0 108.0 0.0 23.2 -32020 Bansgari 48.0 0.0 130.7 0.0 82.7 0.0 172.4 -32021 Laghata Chhara 919.2 0.0 1,092.5 0.0 173.3 0.0 18.9 -32022 Khorma-Tilokpur 533.4 0.0 552.5 27.0 19.1 27.0 3.6 Introduced32023 Raiarpur Boro Khal 362.4 0.0 413.2 14.8 50.8 14.8 14.0 Introduced32025 Barashila Beel 642.6 6.0 672.8 7.6 30.2 1.6 4.7 26.532026 Shutiar khal 1,853.7 2.0 1,928.0 4.1 74.3 2.1 4.0 105.832027 Kharia Nadi 2,696.1 149.0 3,080.7 244.4 384.6 95.4 14.3 64.032028 Lauer Beel 56.4 0.0 128.8 0.0 72.4 0.0 128.4 -32029 Teli Haor 491.5 0.0 590.4 0.0 99.0 0.0 20.1 -32030 Phuleswari-Sonai Beel 96.2 0.0 348.7 0.0 252.5 0.0 262.6 -32031 Dhanchari Khal 0.0 0.0 15.5 7.4 15.5 7.4 Introduced Introduced32032 Kamarer Khal 129.0 0.0 296.9 20.2 167.9 20.2 130.1 Introduced32033 Mugai Khal 832.9 0.0 909.8 0.0 76.8 0.0 9.2 -32035 Akterchar-Nolertek-Chaiterkole Khal 1,028.1 90.0 1,150.8 90.0 122.7 0.0 11.9 0.032036 Basan Beel 620.5 20.0 632.4 20.0 11.9 0.0 1.9 0.032038 Laxmiganj-Rupriya Khal 22.3 0.0 109.3 10.1 86.9 10.1 389.2 Introduced32039 Kurma Chhara 773.4 0.0 1,054.5 0.0 281.1 0.0 36.3 -33040 Ghechua-Simulsur-Kalinagar 149.8 0.0 183.5 0.0 33.7 0.0 22.5 -
Table A.7: Monsoon (Khrif II) Agriculture Production by Subproject in 2013
Monsoon (kharif 2) production (t) Base Production 2013 Production Incremental Production (t) Increment (%)

Table A.7 - Kharif II Agric Production 2 8/13/2014
SubprojectNo. Name Cereal Non-cereal Cereal Non-cereal Cereal Non-cereal Cereal Non-cereal
Monsoon (kharif 2) production (t) Base Production 2013 Production Incremental Production (t) Increment (%)
33041 Goalia Beel 364.2 0.0 452.6 6.5 88.4 6.5 24.3 Introduced33042 Goila Beel 499.6 13.0 671.5 19.5 171.9 6.5 34.4 50.033045 Pudda Khali Khal 35.0 0.0 193.5 0.0 158.5 0.0 452.7 -33046 Rupadia-Majurdia Khal 383.9 55.5 451.8 90.5 67.9 35.0 17.7 63.033047 Shial Chhara 630.4 0.0 874.5 0.0 244.1 0.0 38.7 -33048 Bapail Beel 4,116.0 63.5 4,465.4 112.2 349.4 48.7 8.5 76.733049 Bowlar Beel 3,364.5 0.0 3,638.8 0.0 274.3 0.0 8.2 -33050 Narshanda-Tongi Khal 2,931.2 0.0 3,275.3 0.0 344.1 0.0 11.7 -33052 Dubir Boro Dhair 0.0 0.0 0.0 0.0 0.0 0.0 - -33053 Lunglia Chhara 738.4 0.0 932.0 0.0 193.6 0.0 26.2 -33054 Shialar Haor 0.0 242.0 0.0 266.5 0.0 24.5 Introduced 10.133055 Tarai Nadi 1,557.0 48.3 1,708.0 71.7 151.0 23.4 9.7 48.433057 Saguli-Prayag Beel 0.0 0.0 0.0 0.0 0.0 0.0 - -33058 Lekha Beel 1,418.0 0.0 1,660.9 0.0 242.9 0.0 17.1 -33059 Baneswardi 830.6 32.0 1,055.2 45.1 224.6 13.1 27.0 40.933060 Lebutala-Bashbaria 352.1 0.0 421.3 0.0 69.2 0.0 19.6 -33061 Urafi-Jangal Danga 340.4 0.0 524.8 0.0 184.4 0.0 54.2 -33063 Betbaria Khal 840.7 40.8 1,033.5 73.8 192.8 33.0 22.9 80.833064 Machpara-Lakshmandia Khal 1,036.8 28.0 1,505.3 28.0 468.5 0.0 45.2 0.033065 Surai Khal 571.3 180.0 684.0 223.2 112.8 43.2 19.7 24.033066 Chitalia Khal 66.6 0.0 432.5 0.0 365.9 0.0 549.4 -33068 Kala Chhara 574.8 0.0 760.0 0.0 185.2 0.0 32.2 -33071 Borobaria-Suakair 508.0 0.0 455.0 0.0 -53.0 0.0 -10.4 -33074 Sherpur Katakhali Khal 78.8 0.0 102.8 14.8 24.0 14.8 30.5 Introduced33076 Chandrapur Khal 301.8 0.0 391.6 0.0 89.8 0.0 29.7 -33078 Amgram 269.3 0.0 377.2 0.0 108.0 0.0 40.1 -33079 Chait Beel 697.1 0.0 794.5 0.0 97.4 0.0 14.0 -33080 Gujakuri Khal 1,593.1 171.0 1,782.4 186.6 189.3 15.6 11.9 9.133081 Salnar Khal 1,536.0 210.0 1,627.5 282.8 91.5 72.8 6.0 34.733082 Kalmina Khal 2,879.0 98.5 3,263.5 141.2 384.5 42.7 13.4 43.433087 Ferani Beel-Shakhati Khal 0.0 0.0 10.8 7.4 10.8 7.4 Introduced Introduced33088 Foliar Khal 2,175.3 108.0 2,302.5 137.4 127.2 29.4 5.8 27.233091 Chukdar Kandi Khal 342.2 21.0 360.0 32.0 17.8 11.0 5.2 52.433093 Nachna Salika Khal 1,888.7 22.5 1,962.0 30.0 73.4 7.5 3.9 33.333095 Dakshinbari Khal 1,161.0 0.0 1,376.7 18.8 215.7 18.8 18.6 Introduced34107 Binnakandi 1,097.9 40.0 1,117.2 48.3 19.4 8.3 1.8 20.834109 Kachuar Khal 1,404.0 0.0 2,235.0 0.0 831.0 0.0 59.2 -

Table A.7 - Kharif II Agric Production 3 8/13/2014
SubprojectNo. Name Cereal Non-cereal Cereal Non-cereal Cereal Non-cereal Cereal Non-cereal
Monsoon (kharif 2) production (t) Base Production 2013 Production Incremental Production (t) Increment (%)
34113 Urarchar-Snanghata-Akalbaris Khal 211.7 0.0 314.6 10.1 102.9 10.1 48.6 Introduced34114 Char Lakshmipur Khal 87.7 0.0 131.3 6.3 43.6 6.3 49.7 Introduced34116 Rashukhali Khal 0.0 0.0 7.7 0.0 7.7 0.0 Introduced -34123 Muktahar Khal 582.3 0.0 597.9 5.9 15.5 5.9 2.7 Introduced34124 Bara Chhara 1,056.3 29.9 1,085.8 35.9 29.5 6.0 2.8 20.034127 Borak Khal-Kata Khal 1,712.8 0.0 1,716.3 0.0 3.5 0.0 0.2 -34130 Phulsuti 434.0 0.0 520.0 75.0 86.0 75.0 19.8 Introduced34135 Morabotai-Longlapur Khal 2,006.6 0.0 2,015.4 0.0 8.8 0.0 0.4 -34138 Jangal Khal 979.8 30.1 1,014.2 45.2 34.4 15.1 3.5 50.034141 Atghar-Durgapur Khal 276.8 63.0 481.5 88.8 204.7 25.8 74.0 41.034142 Baksair Beel 1,008.2 0.0 1,039.1 9.0 30.9 9.0 3.1 Introduced
TOTAL 73,256.8 2,437.4 86,269.1 4,118.1 13,012.3 1,680.7 17.8 69.0

Table A.8 - Fishery Data - 1 - 13-Aug-14
Table A.8: Fishery Assessment Findings
District Upazila SP No. & Name Type IA
Sign Date
Capture Culture Total Production Water
Area (ha)
Produc-tion (t)
Fisher (#)
Annual Income / Fisher
(‘000 Tk)
Water Area (ha)
Produc-tion (t)
Fish Farmer
(#)
Annual Income / Fisher
(‘000 Tk) 01 Mymensingh Gafargaon 3001 Rouha
CAD 14/3/10 0 -9 2 1 5 12 2 5
TOTAL 0 -9 2 1 5 12 2 5 02 Sherpur Nalitabari 31026 Sutiar Khal
WC&CAD 31/7/11 -0 0 1 1 3 1 7 2 1
TOTAL -0 0 1 1 3 1 7 2 1 03 Mymensingh Fulpur 32027 Kharia Nadi
DR&WC
15/12/10 0 2 -9 7 4 4 10 2 6 04 Mymensingh Nandail 33048 Bapail Beel 22/11/11 0 3 8 4 3 4 9 3 7 05 Tangail 32025 Barashilla Beel 5/4/11 0 2 0 4 0 1 0 0.5 3 06 Faridpur Madhukhali 32009 Satgavia Beel 6/10/10 0 1 8 3 3 2 1 1 2 07 Faripur Boalmari 33046 Rupdia-Majurdia 21/6/12 0 0 0 0 2 1 0 1 3 08 Rajbari Kalukhali 33063 Betbaria Khal 10/1/12 12 1 7 -1 0 1 2 0.5 2 09 Rajbari Sadar 32015 Nimtala Beel 2/3/10 -5 -2 0 -1 3 1 5 0 -1 10 Rajbari Baliakandi 33095 Dakhinbari Khal 25/4/12 16 -1 -5 0 2 1 4 0 0
TOTAL -33 6 -37 16/4=2 17 15 32 8/8=1 21 11 Mymensingh 33048 Bawlar Beel
FMD
22/11/11 0 2 -2 6 1 4 5 2 6 12 Mynensingh Gafargaon 33079 Chait Beel 13/5/12 0 1 0 3 1 2 3 0 4 13 Tangail 32036 Basan Beel 5/4/11 -6 -1 2 3.5 0 1 0 1 1 14 Tangai 33041 Goalia Beel 24/11/11 0 1 0 2 0 2 0 .0 2 15 tangail 33042 Goilla Beel 4/1/12 0 0 0 1 0 .1 5 2 1 16 Netrokona 33045 Pudda Khali Khal 29/11/11 - 9 - 2 0 4 1 1 3 1 3 17 Kishor Tarail 32030 Phuleshwari-
Sonai Beel 27/4/11 0 1 -3 4 0.5 2 3 1 4
18 Jamal Sharishabari 32017 Rothkhola-Kamarbari
5/10/10 0 0 2 5 0.5 1 3 1 1
19 Jamal Islampur 32018 Batikamari Beel 27/2/11 -12 0 0 5 0.3 2 5 1 2 20 Jamal Dewangonj 32022 Khorma-Tilokpur 31/1/11 0 0 -2 5 0.7 2 0 1 2
TOTAL
-27 2 -7 0 5 18 27 1 20

Table A.8 - Fishery Data - 2 - 13-Aug-14
District Upazila SP No. & Name Type IA Sign Date
Capture Culture Total Production Water
Area (ha)
Produc-tion (t)
Fisher (#)
Annual Income / Fisher
(‘000 Tk)
Water Area (ha)
Produc-tion (t)
Fish Farmer
(#)
Annual Income / Fisher
(‘000 Tk) 21 Mymemsingh 33081 Salnar Khal
FM&WC
12/3/12 0 1 0 6 1 3 8 1 4 22 Sylhet Sadar 31006 Bawa-
Chamurakandi Baro Haor
14/2/10 0 0 -9 -7 1 2 4 0 2
TOTAL 0 1 -9 -1 2 5 12 1 6 23 Mymensingh 33088 Foliar Khal
FMD &WC
1/4/12 0 0.5 2 2 1 4 5 1 4.5 24 Habignj 32023 Raiapur Baro
Khal 17/1/11 1 4 0 0 0 0 0 0.5 4
25 Rajbari Baliakandi 32014Talbaria Beel 1/2/11 -1 -3 7 -2 1 1 3 0 -2 26 Sunam Jagannathpur 32013 Roail-Helalpur 2/1/11 0 0.5 0 2 0 0 2 0 0.5 27 Sunamgonj Chatak 32029Teli haor 24/1/11 0 1 0 0 0 0 0 0 1
TOTAL 0 1 -9 -1 2 4 7 2 5 28 Netrokopna Kalmakanda 31008 Pukuria
Uziakhali Khal FM 11/8/10 0 -2 -7 0 0 1 7 2 -1
TOTAL 0 -2 -7 0 0 1 7 2 -1 29 Sherpur Nalitabari 31005 Ranjana Jharna
Khal
WC
5/9/10 0 0.5 0 1 1..5 1.5 9 1 2
30 MviBazar Kamalgonj 32021 Laghata Chara 22/211 0 0.5 0 1 0.2 1.5 8 1 2 31 Mvibazar Sadar 33058 Lekha Beel 18/4/12 0 0 -2 0 1 0.5 2 0 0.5 32 Habigonj Nabigonj 31004 Arua kalkalia 4/2/10 1 1 7 0 1 1 4 0 2 33 Sunamgonj Sadar 32033 Mugai Khal 30/7/11 0 0 0 0.5 0.5 0.5 4 0 0.5 34 Sunamgonj Sadar 33092 Nokiar Chara 291212 6 0 0 0 0 0 0 0 0
TOTAL 7 2 5 2 6 5 27 2 7 35 Faridpur Sadarpur 32035 Akoterchar-N-Ch
Khal DR 17/11/11 -7 -1 -6 4 0 2 7 1 1
TOTAL -7 -1 -6 4 0 2 7 1 1 36 Habignj 32031 Dhanchari Khal
DR&IRR
17/11/11 0 0 -8 0 1 2.5 8 0 2.5 37 Habogonj 33074 Sherpur Katha
khali 1/12/11 2 0 -9 0 1 2 7 10 2
38 Habogonj Sadar 33087 Ferani Beel Shakati Khal
18/1/12 0 -0.5 -7 0 1 2 5 0.5 1.5

Table A.8 - Fishery Data - 3 - 13-Aug-14
District Upazila SP No. & Name Type IA Sign Date
Capture Culture Total Production Water
Area (ha)
Produc-tion (t)
Fisher (#)
Annual Income / Fisher
(‘000 Tk)
Water Area (ha)
Produc-tion (t)
Fish Farmer
(#)
Annual Income / Fisher
(‘000 Tk) 39 Habogonj Nabigonj 34116 Rashukhali Khal 3/10/12 0 0 0 0 0.5 1.5 4 0 1.5 40 Hobigong Bania chong 34127 Borak khal Kata
khal 20/12/12 0 0.5 0 0 1 1.5 6 0 2
41 Gopalgonj Kasiani 32016 Mamudpur Jhukabari
11/1/11 -2 0 -5 0 1 2.5 2 -0.5 2.5
42 Gopalgonj Sadar 32019 Katarbari-Katargati
10/1/11 -3 0.5 2 1 1 3 3 1 2.5
43 gopalgonj Sadar 33061 Urfi-Jangal danga
20/11/11 0 0 -7 0 0.5 3 0 0 3
44 Madaripur Kalkini 32020 Bansgari 17/1/11 -5 0 -9 0 0 1 4 0 1 45 Madaripur Sadar 32028Lauer Beel 10/1/11 -2 0.5 0 0 1 2.5 3 0 3 46 Madaripur Rajoir 32032 Kamarer Kha 2/10/11 -12 0.5 -9 0 1 1 0 0 1.5 47 Shariatpur Damuddya 32011 Char
narayanpur-Naogaon Khal
12/1/11 -2
.0.5 0 1 1.5 1.5 7 0 2
48 shariatpur Sadar 33066 Chitalia Khal 8/1/12 -3 1 0 0 1.5 3 8 0 4 TOTAL -27 3 -52 2 12 27 57 1 30