act 129 swe demand response study final report - … · web viewthe commission directed the swe to...
TRANSCRIPT

GDS Associates, Inc.Engineers and Consultants
ACT 129 DEMAND RESPONSE STUDYFinal Report
Prepared for:
PENNSYLVANIA PUBLIC UTILITY COMMISSION
SUBMITTED MAY 13, 2013
Addendum Added November 1, 2013
GDS ASSOCIATES, INC. 1850 PARKWAY PLACE
SUITE 800MARIETTA, GA 30067
770.425.8100770.426.0303 (FAX)
WWW.GDSASSOCIATES.COM

ACT 129 DEMAND RESPONSE STUDY Summer 2012
PREPARED BY:SALIL GOGTE – NEXANT
JESSE SMITH – NEXANT
TOM LONDOS – GDS ASSOCIATES
JACOB THOMAS – GDS ASSOCIATES
STEVE MILLER – MONDRE ENERGY
P r e p a r e d b y S t a t e w i d e E v a l u a ti o n T e a mi | P a g e
ACT 129 DEMAND RESPONSE STUDY Summer 2012
TABLE OF CONTENTS
LIST OF ACRONYMS................................................................................IIIA. EXECUTIVE SUMMARY......................................................................1B. OVERVIEW OF DEMAND RESPONSE....................................................6C. COMPARISON OF ACT 129 DEMAND RESPONSE (DR) PROGRAMS TO
OTHER JURISDICTIONS..................................................................121. Demand Response Goals in Other States.............................................122. Measurement and Verification – Determining Baselines.....................133. Cost-Effectiveness Analysis..................................................................16
a. Treatment of Payments from Multiple Sources..........................................17b. Treatment of Payments in Pennsylvania Act 129........................................17
D. PENNSYLVANIA DEMAND RESPONSE MARKET PRICING ANALYSIS.......191. Geographic Variance in DR Market Pricing.........................................212. Pricing Variance Within the top 100 Hours.........................................253. Variance in Market Pricing From Year to Year....................................27
E. ATTRIBUTION OF THE ACT 129 PHASE I DR PROGRAMS...................291. Survey Highlights.................................................................................292. Survey Design.......................................................................................303. Survey Scoring Methodology & results................................................31
F. COST EFFECTIVENESS OF ACT 129 DEMAND RESPONSE PROGRAMS. . .351. Methodology, Assumptions, and Data Sources....................................352. Sensitivity Analysis...............................................................................37
a. Generation Cost Variation...........................................................................37b. T&D Cost Variation.....................................................................................38c. Reduced Incentive Cost..............................................................................38d. Line Loss Values.........................................................................................38e. Full Load Reduction....................................................................................38f. Dual Enrollment..........................................................................................39g. Best and Worst Case Scenarios..................................................................39
3. Cost Effectiveness of Direct Load Control Programs...........................394. Cost Effectiveness of Customer Load Curtailment Programs..............45
G. WHOLESALE PRICE SUPPRESSION BENEFITS....................................511. Overview of Wholesale Price Suppression...........................................512. SWE Exclusion of Price Suppression Benefits.....................................52
H. FINDINGS AND RECOMMENDATIONS................................................54I. ADDENDUM – PRELIMINARY WHOLESALE PRICE SUPPRESSION AND
PROSPECTIVE TRC ANALYSIS.........................................................581. Prospective TRC Analysis.....................................................................66
P r e p a r e d b y S t a t e w i d e E v a l u a ti o n T e a mi i | P a g e
ACT 129 DEMAND RESPONSE STUDY Summer 2012
LIST OF ACRONYMS
AMI: Advanced Metering Infrastructure kW: KilowattANOVA: Analysis of Variance LC: Load curtailmentCAISO: The California Independent System Operator LMP: Locational Marginal PricingCBL: Customer Baseline Load LSE: Load serving entityC&I: Commercial and Industrial M&V: Measurement and VerificationComEd: Commonwealth Edison Company MW: MegawattCPP: Critical Peak Pricing MWh: Megawatt-HourCPUC: The California Public Utilities Commission NYISO: The New York Independent System OperatorCSP: Curtailment Service Providers NYPSC: NY Public Service CommissionDLC: Direct Load Control PJM: The Pennsylvania-Jersey-Maryland InterconnectionDR: Demand Response PUC: Pennsylvania Public Utility CommissionDSM: Demand Side Management RMSE: Root Mean Square ErrorEDC: Electric Distribution Company RTO: Regional Transmission OrganizationEE: Energy Efficiency SR: Sum of RankEE&C: Energy Efficiency and Conservation SWE: Statewide EvaluatorELRP: Emergency Load Response Program T&D: Transmission and DistributionFERC: The Federal Energy Regulatory Commission TRC: Total Resource Cost TestFCM: Forward Capacity Market TRM: Technical Reference ManualISO: Independent System Operators WEPCO: Wisconsin Electric Power CompanyISONE: The New England Independent System Operator
P r e p a r e d b y S t a t e w i d e E v a l u a ti o n T e a mi i i | P a g e
ACT 129 DEMAND RESPONSE STUDY Summer 2012
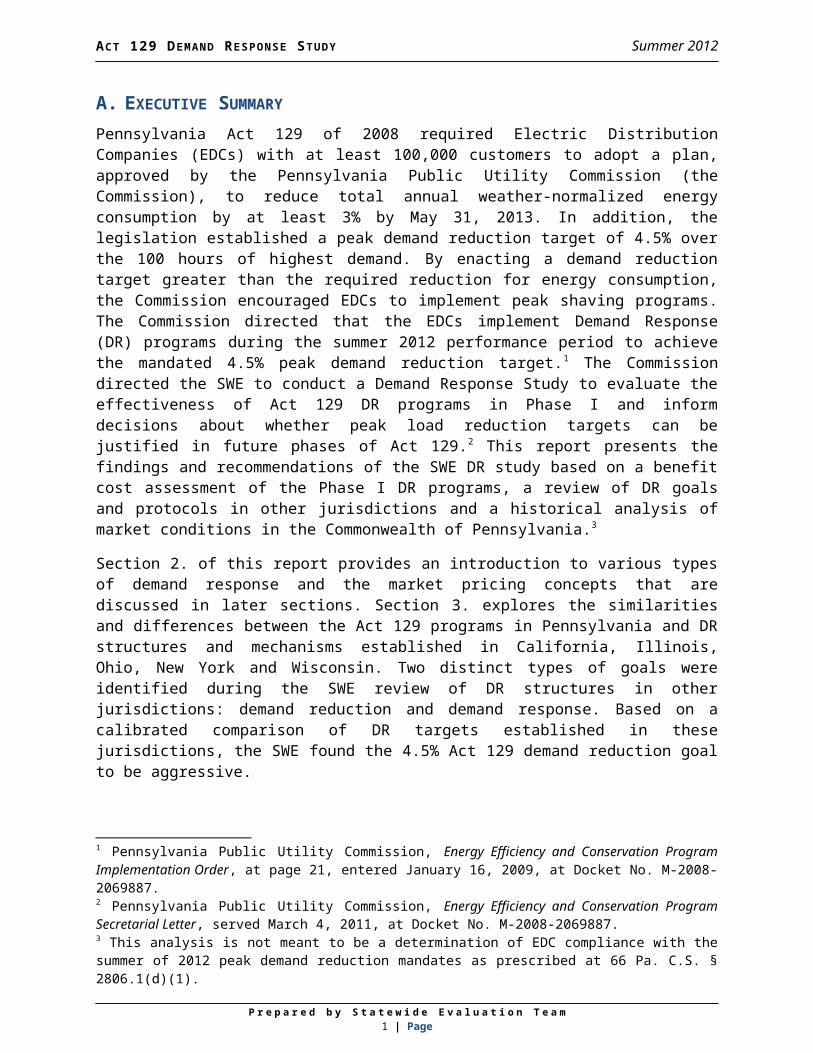
A. EXECUTIVE SUMMARYPennsylvania Act 129 of 2008 required Electric Distribution Companies (EDCs) with at least 100,000 customers to adopt a plan, approved by the Pennsylvania Public Utility Commission (the Commission), to reduce total annual weather-normalized energy consumption by at least 3% by May 31, 2013. In addition, the legislation established a peak demand reduction target of 4.5% over the 100 hours of highest demand. By enacting a demand reduction target greater than the required reduction for energy consumption, the Commission encouraged EDCs to implement peak shaving programs. The Commission directed that the EDCs implement Demand Response (DR) programs during the summer 2012 performance period to achieve the mandated 4.5% peak demand reduction target.1 The Commission directed the SWE to conduct a Demand Response Study to evaluate the effectiveness of Act 129 DR programs in Phase I and inform decisions about whether peak load reduction targets can be justified in future phases of Act 129.2 This report presents the findings and recommendations of the SWE DR study based on a benefit cost assessment of the Phase I DR programs, a review of DR goals and protocols in other jurisdictions and a historical analysis of market conditions in the Commonwealth of Pennsylvania.3
Section B of this report provides an introduction to various types of demand response and the market pricing concepts that are discussed in later sections. Section C explores the similarities and differences between the Act 129 programs in Pennsylvania and DR structures and mechanisms established in California, Illinois, Ohio, New York and Wisconsin. Two distinct types of goals were identified during the SWE review of DR structures in other jurisdictions: demand reduction and demand response. Based on a calibrated comparison of DR targets established in these jurisdictions, the SWE found the 4.5% Act 129 demand reduction goal to be aggressive.
Demand reduction goals, like the 4.5% peak demand reduction target in Pennsylvania, can be achieved by DR programs or energy efficiency programs because most energy efficiency measures permanently reduce equipment power consumption during periods of peak demand over the life of the measure. A demand response (DR) goal is achieved solely by reducing peak demand temporarily through dispatched peak shaving resources or pricing signals and does not include the permanent reduction in demand resulting from energy efficiency programs. Act 129 does not have a specific demand response goal.
Table A-1 compares the percent energy and demand reductions achieved by each of the EDCs through the end of Program Year 3. The demand reductions
1 Pennsylvania Public Utility Commission, Energy Efficiency and Conservation Program Implementation Order, at page 21, entered January 16, 2009, at Docket No. M-2008-2069887.2 Pennsylvania Public Utility Commission, Energy Efficiency and Conservation Program Secretarial Letter, served March 4, 2011, at Docket No. M-2008-2069887.3 This analysis is not meant to be a determination of EDC compliance with the summer of 2012 peak demand reduction mandates as prescribed at 66 Pa. C.S. § 2806.1(d)(1).
P r e p a r e d b y S t a t e w i d e E v a l u a ti o n T e a m1 | Page

ACT 129 DEMAND RESPONSE STUDY Summer 2012
shown in Table A-1 were achieved entirely through energy efficiency measures because no DR programs were active during the first three program years.
P r e p a r e d b y S t a t e w i d e E v a l u a ti o n T e a m2 | Page

ACT 129 DEMAND RESPONSE STUDY Summer 2012
Table A-1: Gross Verified Percent Energy and Demand Reductions through Program Year 3
EDC Percent Energy Reduction Percent Demand ReductionDuquesne 2.19% 1.35%PECO 2.73% 2.34%PPL 2.61% 2.16%Met-Ed 2.04% 1.49%Penelec 2.16% 1.58%Penn Power 2.25% 1.31%West Penn Power 1.89% 1.35%
Table A-1 shows that most EDCs are on pace to achieve between 2.0% and 2.5% of the 4.5% peak demand reduction goal established by Act 129 for Phase I through the coincident peak demand reduction produced by energy efficiency measures. This means that EDCs are effectively presented with a 2.0% DR goal to be achieved in a single summer. The SWE’s review of DR programs in other states shows that annual DR goals in several states are below 1%. Section C of this report explains the nuances of DR structures and mechanisms in further detail and identifies differences in the benefit/cost measurement guidelines, which have a significant impact on the perceived cost-effectiveness of DR programs.
After reviewing DR protocols from other jurisdictions, the SWE believes that basing demand reduction targets on the highest 100 hours of peak demand is unique to Pennsylvania and this structure does not adequately capture the complexities of the DR market. Further, the SWE believes that the top 100 hours protocol results in DR resources being dispatched when it is not cost-effective to do so. In order to make an informed recommendation on possible alternatives, the SWE conducted a review of energy prices in Pennsylvania during the top 100 hours of system demand from 2007 through 2012. Two distinct financial transaction markets need to be considered when examining DR: the Forward Capacity Markets (FCM) and the Energy Markets.
Capacity is an annual commitment to provide energy when needed and assures that there will be sufficient resources when they are most needed. A FCM attempts to ensure that demand for electricity will be met in the future by providing pricing signals to encourage reliability investments such as generation, energy efficiency and demand response. Capacity revenues are paid whether energy is produced by the committed resource or not.
Energy is the generation of electrical power over a fixed period of time and is valued on an hourly basis. Several deregulated markets in the United States, including the PJM Interconnection (PJM), use Locational Marginal Pricing (LMP) to assign wholesale market prices for electricity in dollars per megawatt-hour ($/MWh). Section B of this report includes an explanation of how LMPs are calculated and demonstrates how DR can have a positive effect on the wholesale price of electricity.
P r e p a r e d b y S t a t e w i d e E v a l u a ti o n T e a m3 | Page

ACT 129 DEMAND RESPONSE STUDY Summer 2012
Section D identifies three sources of variation that have a significant impact on the top 100 hours structure of the Act 129 DR programs. The SWE believes understanding these sources of variation and accounting for them when establishing demand response goals is critical to ensure future DR programs are cost-effective for all EDCs in Pennsylvania.
1) The need for DR is not consistent across the state. Energy and capacity prices in the eastern part of the state have historically been higher than those in the western part of the state. If this trend persists, DR is likely to be more cost-effective for the eastern EDCs compared to the western EDCs and may warrant different goals.
2) There is significant variation in energy prices within the top 100 hours summer performance period for each EDC. During certain hours, the grid is not constrained and dispatching DR will not have a significant impact on wholesale energy prices. Valuing load reductions from each hour equally does not address this variation.
3) The need for DR is highly correlated with weather patterns and will be much lower in a cool summer than a hot summer for a given performance period. An EDC may experience conditions that promote cost-effective DR for 5 hours during a cool summer and 35 hours during a hot summer.
As part of the PJM Interconnection, Pennsylvania electric customers are eligible to participate as DR resources in the PJM capacity or energy markets. A significant number of commercial and industrial participants in Act 129 DR programs were also enrolled in the PJM markets in 2012. Section E of the report presents the methodology the SWE used to examine dual participation of DR resources in the Act 129 and PJM programs. The results of this analysis were used as inputs to the DR benefit/cost analysis that is presented in Section F.
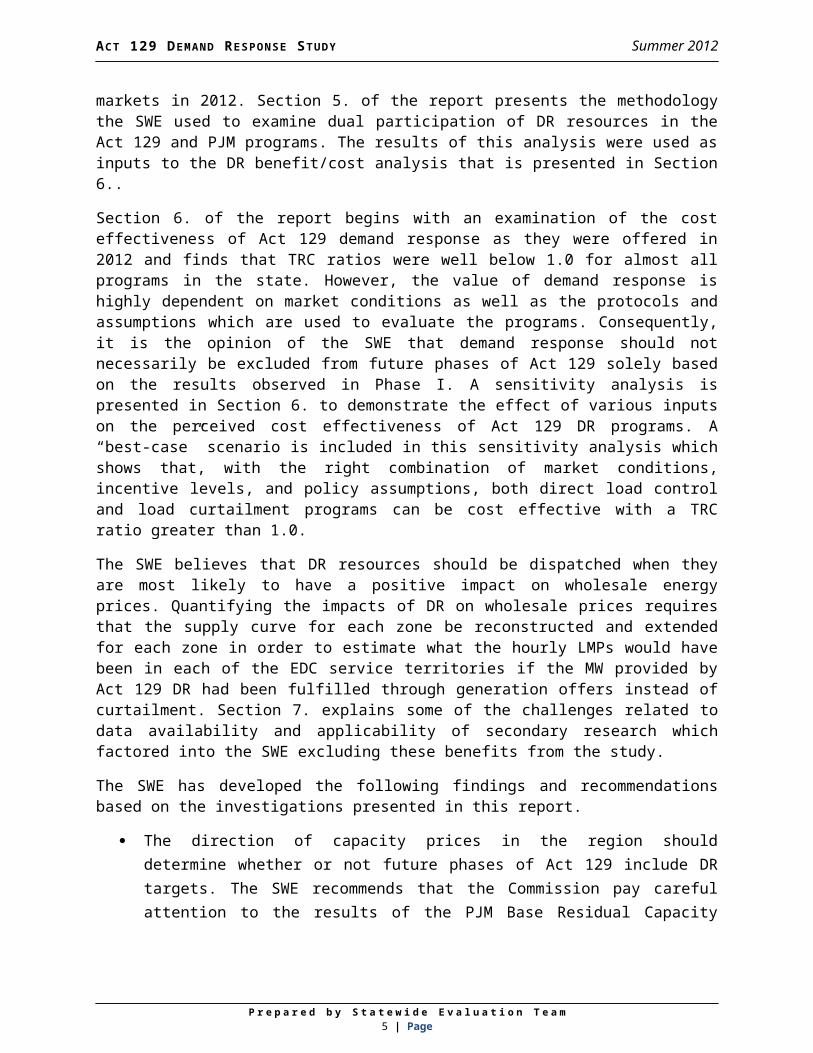
Section F of the report begins with an examination of the cost effectiveness of Act 129 demand response as they were offered in 2012 and finds that TRC ratios were well below 1.0 for almost all programs in the state. However, the value of demand response is highly dependent on market conditions as well as the protocols and assumptions which are used to evaluate the programs. Consequently, it is the opinion of the SWE that demand response should not necessarily be excluded from future phases of Act 129 solely based on the results observed in Phase I. A sensitivity analysis is presented in Section F to demonstrate the effect of various inputs on the perceived cost effectiveness of Act 129 DR programs. A “best-case” scenario is included in this sensitivity analysis which shows that, with the right combination of market conditions, incentive levels, and policy assumptions, both direct load control and load curtailment programs can be cost effective with a TRC ratio greater than 1.0.
The SWE believes that DR resources should be dispatched when they are most likely to have a positive impact on wholesale energy prices. Quantifying the impacts of DR on wholesale prices requires that the supply curve for each zone be reconstructed and extended for each zone in order to estimate what the hourly LMPs would have been in each of the EDC service territories if the MW
P r e p a r e d b y S t a t e w i d e E v a l u a ti o n T e a m4 | Page
ACT 129 DEMAND RESPONSE STUDY Summer 2012
provided by Act 129 DR had been fulfilled through generation offers instead of curtailment. Section G explains some of the challenges related to data availability and applicability of secondary research which factored into the SWE excluding these benefits from the study.
The SWE has developed the following findings and recommendations based on the investigations presented in this report.
The direction of capacity prices in the region should determine whether or not future phases of Act 129 include DR targets. The SWE recommends that the Commission pay careful attention to the results of the PJM Base Residual Capacity Auction for the 2016/2017 delivery year4 that will be held in May 2013. Based on the program expenditures and impacts observed during the 2012 performance period, the avoided cost of generation capacity will need to be in excess of $70-$80 per kW-year to consider the continuation of Act 129 DR programs in future phases.
Avoided transmission and distribution (T&D) benefits are a major source of uncertainty in the benefit/cost analysis of demand response. Additional research is needed by the Pennsylvania EDCs to quantify these benefits. The benefit/cost analysis presented in Section F considers low, medium and high cases of $0, $25 and $50 per kW-year, respectively, for the monetization of transmission and distribution benefits. Without the inclusion of some T&D benefits, the SWE believes that Act 129 DR programs are unlikely to pass a TRC test.
Additional research is needed into possible benefits from wholesale price suppression. These benefits are not currently considered for Act 129 energy efficiency programs and were not quantified in the benefit/cost analysis presented in this study. Estimates of price suppression benefits from peak-shaving will allow for a more accurate assessment and equitable comparison of demand response and energy efficiency potential. The SWE will work with Commission staff to identify the need, timing, and scope of any continued research.
EDC implementation of cost effective commercial and industrial load curtailment programs under Act 129 is extremely challenging because of the thriving PJM DR markets available to these customers. From June to September of 2012, settlements for 34,198 MWh of Economic DR were recorded by PJM across Pennsylvania.5 A significant portion of the participants in Act 129 commercial and industrial programs were among the 2,070 MW of Pennsylvania DR capacity resources in the PJM Emergency Load Response Program6. Engaging these participants in Act 129 DR programs does not offer additional capacity into the system. When EDCs secure DR resources that are not committed in the PJM
4 In PJM, the delivery year begins on June 1st and ends on May 31st of the following year.5 2012 Load Response Activity Report http://www.pjm.com/~/media/markets-ops/dsr/2012-dsr-activity-report-20130314.ashx6 Ibid.
P r e p a r e d b y S t a t e w i d e E v a l u a ti o n T e a m5 | Page
ACT 129 DEMAND RESPONSE STUDY Summer 2012
program, the capacity needs of the region are not adjusted accordingly so the benefits to wholesale capacity prices are not realized. The SWE urges the Commission to be very cautious about establishing any goals for C&I DR programs. If goals are established, we recommend carefully considering how Act 129 can offer incremental value to the competitive markets already in place.
Although direct load control programs did not prove to be cost effective in 2012 based on the SWE’s analysis, there is indication that the programs could offer value in future phases of Act 129. Equipment purchase, customer recruiting and installation costs result in high upfront costs for DLC programs. The SWE recommends the Commission view the Phase I infrastructure costs of these programs as “sunk” and consider continuing the programs if future benefits are expected to outweigh the future costs. If DLC programs are continued, the SWE believes that they should be bid into the PJM capacity market and the revenue received should count as a benefit in the TRC test.
The top 100 hours definition of DR performance caused a number of predictive difficulties and had a negative impact on the cost effectiveness of the programs offered in 2012. The SWE recommends that the definition be discontinued. If a DR target is established for an EDC, DR resources should be dispatched only when wholesale prices are elevated or the load reduction is needed for reliability. These conditions are explored in greater detail in Section D of this report.
Any future DR targets should be crafted such that the compliance metric is the average load reduction observed over a subset of peak hours during which DR is likely to provide a cost-effective alternative to generation. The actual number of hours is expected to vary by EDC and from year to year based on weather conditions.
The real-time LMP for an EDC zone should be used as the trigger for calling DR resources because energy prices account for the two conditions which promote cost-effective DR; elevated demand and reduced supply. The SWE recommends a threshold of $200 or $250 per MWh. Additional research into wholesale price suppression benefits could adjust this threshold up or down. Under this design customers could receive an upfront payment for amount of kW they pledge to curtail, a payment for each hour they are dispatched, or a combination of the two.
The optimal number of MW to acquire and dispatch in each EDC service territory should be determined through a demand response potential study. Estimates of wholesale price suppression benefits and the amount of load reduction that can be achieved with less aggressive EDC spending will be important components of this assessment.
P r e p a r e d b y S t a t e w i d e E v a l u a ti o n T e a m6 | Page

ACT 129 DEMAND RESPONSE STUDY Summer 2012
The next sections of this report are organized as follows:
Section B provides an overview of demand response and demonstrates how DR can have a positive effect on the wholesale price of electricity.
Section C examines demand response goals, measurement and verification approaches and benefit/cost guidelines in other jurisdictions and compares them to the DR protocols in place in Pennsylvania during Phase I of Act 129.
Section D is a historical analysis of energy and capacity prices in Pennsylvania. These market conditions contain valuable information about the potential cost-effectiveness of DR resources.
Section E of the report presents the methodology that the SWE used to examine dual participation of DR resources in the Act 129 and PJM programs.
Section F presents the SWE’s benefit/cost analysis of the 2012 Act 129 programs. The programs were analyzed as offered in 2012, as well as under a variety of conditions which may be in place during future phases of Act 129. Sensitivities examined include the avoided cost of generation capacity, avoided transmission and distribution costs, the treatment of customer incentives, line loss adjustment factors, a multi-year view of direct load control, and achievable load reduction if the top 100 hours protocol were lifted in favor of a narrower performance period.
Section G outlines the challenges associated with quantifying wholesale price suppression benefits and explains why the SWE chose to exclude these benefits from the TRC analysis.
Section H presents the key findings and recommendations from the SWE DR Study.
P r e p a r e d b y S t a t e w i d e E v a l u a ti o n T e a m7 | Page
ACT 129 DEMAND RESPONSE STUDY Summer 2012
B. OVERVIEW OF DEMAND RESPONSEDemand Response (“DR”) generally refers to an end-user, or retail utility customer, forgoing, shifting, or self-generating electricity7:
In response to a per-event signal from the applicable ISO or EDC on a dispatchable (or callable) basis; or
In response to high electricity prices on a non-dispatchable basis, with pricing incentives offered typically through an EDC’s retail service tariffs.
As indicated below, DR is broadly grouped into two main categories: dispatchable and non-dispatchable. Table B-2 below summarizes the common types of dispatchable and non-dispatchable DR programs.
Table B-2: Common Types of Demand Response Programs8
Non-Dispatchable Dispatchable Time-of-Use Rates: Rates with fixed price Blocks that differ by time of day
Direct Load Control: Customers receive incentive payments for allowing the utility a degree of control over equipment, such as air-conditioners
Critical Peak Pricing: Rates that include a pre-specified, extra-high rate that is triggered by the utility and is in effect for a limited number of hours
Demand Bidding/ Buyback: Customers offer bids to curtail load when wholesale prices are high
Real Time Pricing: Rates that vary at some regular interval (usually hourly) in response to wholesale market prices
Emergency: Customers receive payments for load reductions when needed for reliability purposes
Capacity Market Programs: Customers receive payments for providing load reductions as substitutes for system capacity
Interruptible/ Curtailable: Customers receive a discounted rate for agreeing to reduce load reduction upon request
Ancillary Services Market: Customers receive payments from an ISO/RTO for committing to curtail load when needed to support operation of the grid
Dispatchable DR refers to load reductions that the end-user agrees to make in response to direction from someone other than the end-user itself. For example, direct load control (DLC) programs and interruptible utility services fall into this category. The programs implemented by the Pennsylvania EDCs in 2012 consisted primarily of dispatchable DR. Non-dispatchable DR refers to
7 National Action Plan for Energy Efficiency (2010). Coordination of Energy Efficiency and Demand Response. Prepared by Charles Goldman (Lawrence Berkeley National Laboratory), Michael Reid (E Source), Roger Levy, and Alison Silverstein. www.epa.gov/eeactionplan.
8 Ibid.
P r e p a r e d b y S t a t e w i d e E v a l u a ti o n T e a m8 | Page

ACT 129 DEMAND RESPONSE STUDY Summer 2012
programs in which end-users decide whether and when to reduce consumption in response to and based on a dynamic pricing structure that exposes the end-user to higher electricity prices during high, or peak, demand periods.9 A dynamic pricing structure contrasts with average pricing (electricity is the same price regardless of period during the day, or even season), which typically provides little to no incentive to an end-user to reduce consumption when wholesale electricity prices “spike” during high demand period. Figure B-1 shows dynamic pricing structure options.
Figure B-1: Dynamic Pricing Structure Options
Pricing can either be real-time (blue), which allows an end-user to be exposed to changing wholesale prices hourly, or in blocks (red) based on hourly groupings, typically termed “time of day” or “time of use.” In exchange for exposure to peak prices during peak hours, the end-user experiences lower prices during off-peak hours.
DR programs in the United States are implemented under the auspices of Independent System Operators (“ISO”)10 and EDCs. ISOs will only accept DR bids above a certain minimum reduction threshold. While direct participation in ISO-sponsored DR programs is possible for very large, industrial entities, a vast number of retail customers participate indirectly through EDCs and Curtailment Service Providers (CSPs) because they alone do not provide enough load reduction to reach the minimum level. CSPs are agents that provide end-use customers access to wholesale markets by aggregating load from several customers to reach the level of reduction required to bid into the wholesale market. The CSP identifies opportunities for demand response and implements necessary equipment, operational processes, and/or systems, such as advanced metering, to enable DR at the customer’s facility and to sell DR
9 Federal Energy Regulatory Commission. National Action Plan on Demand Response, (June 2010), available at http://www.ferc.gov/legal/staff-reports/06-17-10-demand-response.pdf. 10 An ISO also refers to a Regional Transmission Organization (RTO) for the purposes of this paper.
P r e p a r e d b y S t a t e w i d e E v a l u a ti o n T e a m9 | Page

ACT 129 DEMAND RESPONSE STUDY Summer 2012
capacity directly into the wholesale market. The CSP has ISO membership, operational infrastructure and a full understanding of markets, rules and operational procedures to bid demand response into the electricity market. The use of such third-party DR providers in both wholesale and retail markets has grown as a percentage of total national wholesale demand response potential, from 35 percent in 2008 to 39 percent in 2010.11 End-use customers participating in DR programs must have the ability to reduce power consumption in response to either a reliability trigger or a price trigger from their EDC, ISO, or CSP.12
An ISO will sponsor demand response programs for both reliability and economic purposes. DR programs designed for reliability provide a surrogate for capacity, while economic programs provide a surrogate for energy. Capacity is an annual commitment to provide energy when needed and assures that there will be sufficient resources when they are most needed. Capacity revenues are paid whether energy is produced by the committed resource or not. Energy is the generation of electrical power over a fixed period of time and is valued on an hourly basis. Several deregulated markets in the United States, including PJM, use Locational Marginal Pricing (LMP) to assign wholesale market prices for electricity in dollars per megawatt-hour ($/MWh).
During critical electricity demand periods, typically characterized by extreme temperatures during summer months, the cost of providing power can increase significantly as power plants with higher variable costs are called upon to serve the increased demand (also termed “load”) placed on the regional transmission system (also termed “grid”). As more plants come online, the remaining available capacity to serve the system load decreases. Should a power plant shut down unexpectedly, capacity available from the remaining plants to meet the system load may be insufficient, which can result in reduced system reliability due to voltage fluctuations (brownouts) or, if additional plants shut down as a result, regional and large-scale blackouts.13
In addition to the reliability reasons explained above, an ISO can offer DR to reduce the wholesale cost of energy. Economic DR refers to a third party aggregator, such as a CSP, or end-user submitting a bid into the wholesale energy market, through the auspices of the ISO, to provide a curtailment service, similar to a generator submitting a bid for a supply service. When DR is bid into the wholesale energy market and accepted, it lowers the cost of power by avoiding the need to call a marginal generator with high variable costs. As system demand increases, the supply price curve becomes steeply sloped because the marginal generators, dispatched to serve load in peak demand periods, are typically less efficient and have higher fuel costs than the generators dispatched to serve load in non-peak demand periods. Therefore, curtailing demand through DR programs can be deployed in place of
11 Federal Energy Regulatory Commission. Demand Response & Advanced Metering Staff Report, (November 2011), available at http://www.ferc.gov/legal/staff-reports/11-07-11-demand-response.pdf . 12 Federal Energy Regulatory Commission. National Action Plan on Demand Response, (June 2010), available at http://www.ferc.gov/legal/staff-reports/06-17-10-demand-response.pdf 13 A Primer on Demand Response, Thomas Weisell Partners, 2007.
P r e p a r e d b y S t a t e w i d e E v a l u a ti o n T e a m10 | Page

ACT 129 DEMAND RESPONSE STUDY Summer 2012
dispatching high cost generators and can result in a significant price decrease in the energy market. The supply price curve is explored in more detail in Section D of this report.
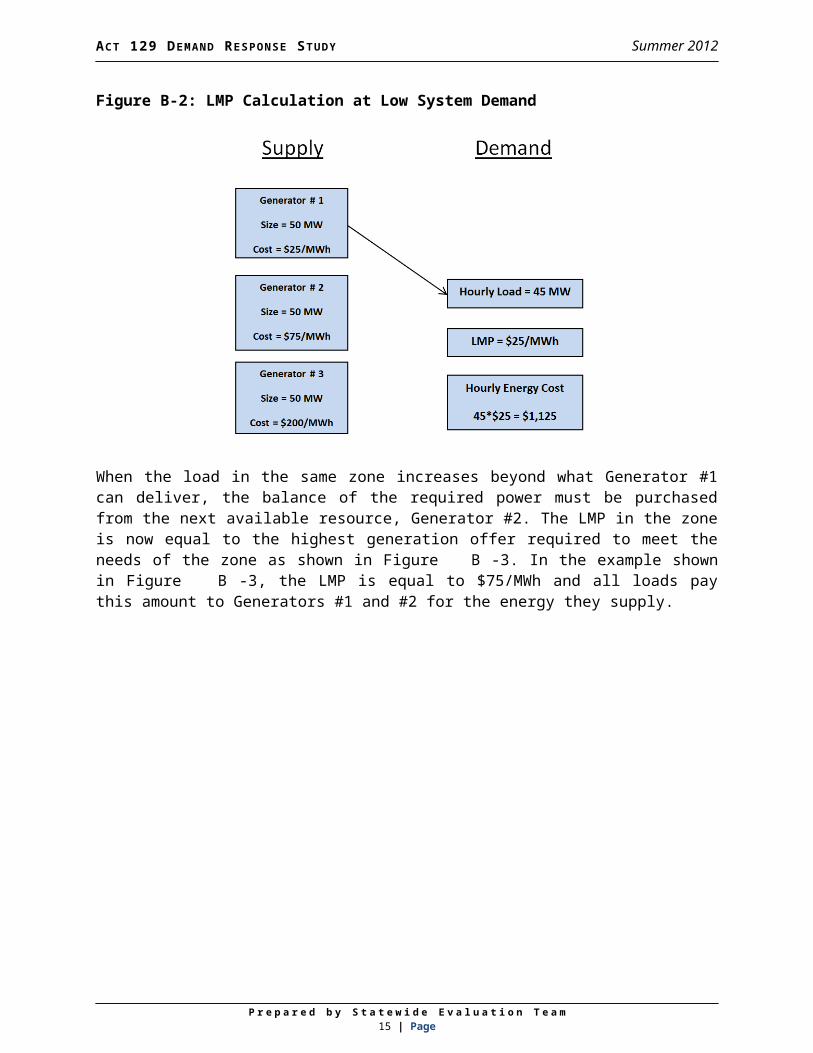
The following example illustrates a simplified LMP calculation and how DR resources can have a positive effect on wholesale energy prices. Figure B-2 depicts a scenario where three electric generators with the capacity to produce 50 MW of power are located in a given load zone. The three generators are willing to supply energy at very different prices. In Figure B-2, the demand in the zone during the hour is 45 MW. Since Generator #1 can satisfy the demand in the zone during the hour in question, all 45 MW are purchased from that plant and the LMP in the zone is equal to Generator #1’s bid of $25/MWh. The energy used in the zone is equal to the average load (45 MW) over a unit of time (1 hour in this example), or 45 MWh. The total cost of meeting the zone’s electric supply needs during the hour is calculated by multiplying the energy used in the zone by the LMP.
P r e p a r e d b y S t a t e w i d e E v a l u a ti o n T e a m11 | Page

ACT 129 DEMAND RESPONSE STUDY Summer 2012
Figure B-2: LMP Calculation at Low System Demand
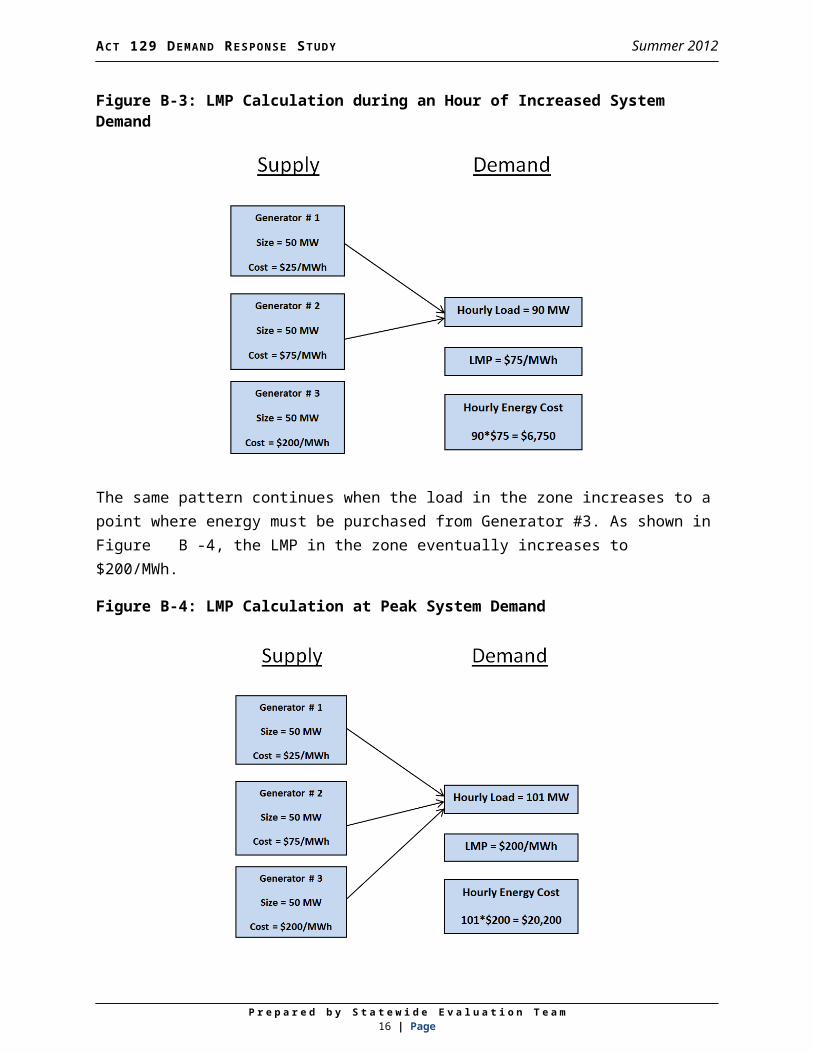
When the load in the same zone increases beyond what Generator #1 can deliver, the balance of the required power must be purchased from the next available resource, Generator #2. The LMP in the zone is now equal to the highest generation offer required to meet the needs of the zone as shown in Figure B-3. In the example shown in Figure B-3, the LMP is equal to $75/MWh and all loads pay this amount to Generators #1 and #2 for the energy they supply.
Figure B-3: LMP Calculation during an Hour of Increased System Demand
P r e p a r e d b y S t a t e w i d e E v a l u a ti o n T e a m12 | Page

ACT 129 DEMAND RESPONSE STUDY Summer 2012
The same pattern continues when the load in the zone increases to a point where energy must be purchased from Generator #3. As shown in Figure B-4, the LMP in the zone eventually increases to $200/MWh.
Figure B-4: LMP Calculation at Peak System Demand
In this example, it is important to note that when the zonal load increased from 100 MW to 101 MW, the cost of energy for all consumers in the zone increased significantly for the hour. During an hour when the average load is 100 MW (100 MWh of energy used), the LMP was $75/MWh so the total cost of meeting the zone’s power needs for the hour was 100 *$75 = $7,500. When the load reached 101 MW, the total cost of meeting the zone’s needs increased to 101*$200 = $20,200. The cost of adding 1 MW of the demand to the grid was $12,700.
In order to understand the value of demand response in this situation, consider the benefits of an industrial customer willing to accept payment to shut down its production in several facilities. This customer is able and willing to reduce load by 2 MW by curtailing its production processes. By dispatching these facilities to reduce load by 2 MW, the load in the zone stays below 100 MW and the LMP of the zone remains steady at $75/MWh as shown in Figure B-5. If the customer is paid $100/MWh for the load reduction, the total cost of retaining economical load balance in the zone is 99*$75 + 2*$100 = $7,625. This value is $12,575 less than the total cost of meeting the zone’s need for 101 MW of power via generation alone. This example illustrates how paying customers to deliver timely load reductions can have a positive effect on wholesale electric prices (LMPs) if DR resources are dispatched efficiently when they represent a cost-effective alternative to generation.
P r e p a r e d b y S t a t e w i d e E v a l u a ti o n T e a m13 | Page

ACT 129 DEMAND RESPONSE STUDY Summer 2012
Figure B-5: Effect of DR Resources on LMP
P r e p a r e d b y S t a t e w i d e E v a l u a ti o n T e a m14 | Page
ACT 129 DEMAND RESPONSE STUDY Summer 2012
C. COMPARISON OF ACT 129 DEMAND RESPONSE (DR) PROGRAMS TO OTHER JURISDICTIONS
This section of the report summarizes the types of DR programs, their associated measurement and verification (M&V) approaches, and benefit-cost methodologies of four ISOs - PJM, CAISO, NYISO, and ISO-NE.14 This section also examines the types of DR goals, programs, M&V approaches and cost-effectiveness test methodologies used by the states of California, New York, Illinois, Ohio, and Wisconsin. These programs were examined for the purpose of comparison to the DR programs that have been implemented by the EDCs pursuant to the mandates of Act 129.
1. DEMAND RESPONSE GOALS IN OTHER STATES
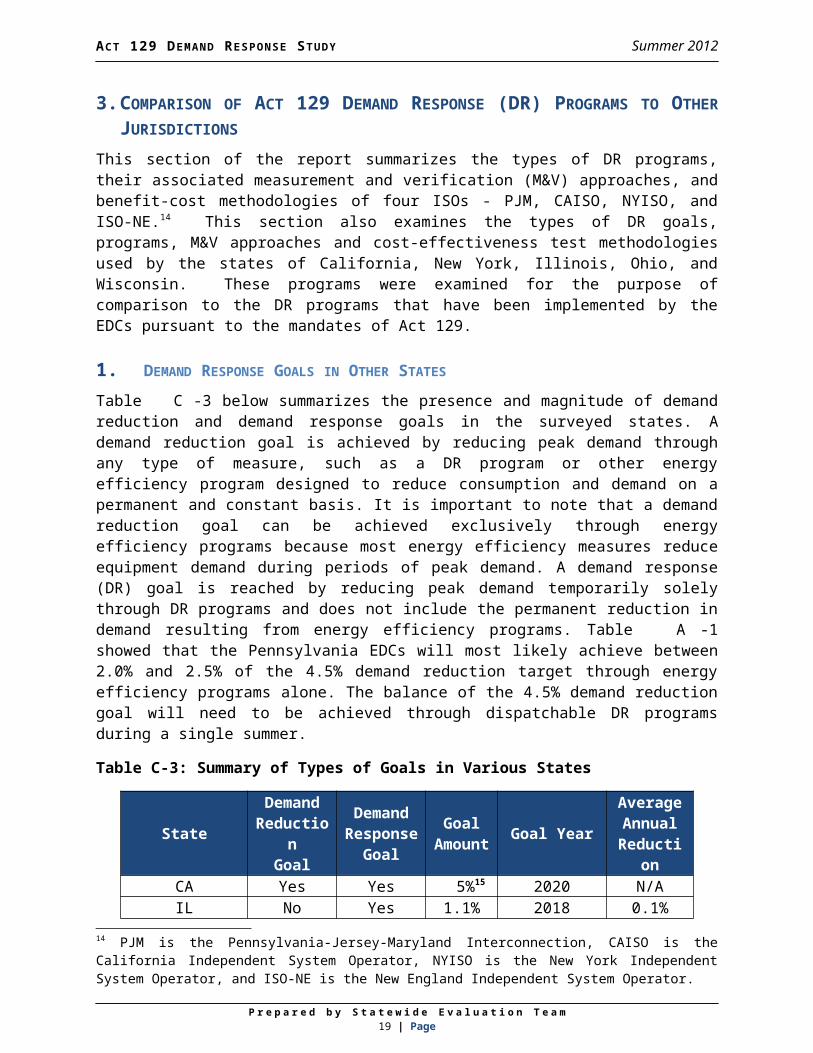
Table C-3 below summarizes the presence and magnitude of demand reduction and demand response goals in the surveyed states. A demand reduction goal is achieved by reducing peak demand through any type of measure, such as a DR program or other energy efficiency program designed to reduce consumption and demand on a permanent and constant basis. It is important to note that a demand reduction goal can be achieved exclusively through energy efficiency programs because most energy efficiency measures reduce equipment demand during periods of peak demand. A demand response (DR) goal is reached by reducing peak demand temporarily solely through DR programs and does not include the permanent reduction in demand resulting from energy efficiency programs. Table A-1 showed that the Pennsylvania EDCs will most likely achieve between 2.0% and 2.5% of the 4.5% demand reduction target through energy efficiency programs alone. The balance of the 4.5% demand reduction goal will need to be achieved through dispatchable DR programs during a single summer.
Table C-3: Summary of Types of Goals in Various States
StateDemandReducti
onGoal
DemandRespons
eGoal
Goal Amou
ntGoal Year
Average Annual Reducti
onCA Yes Yes 5%15 2020 N/AIL No Yes 1.1% 2018 0.1%OH Yes No 7% 2018 0.75%
NY – Con Edison No Yes N/A N/A N/A
PA Yes No 4.5% 2012 4.5%16
WI Yes No 1.5% 2014 0.25%
14 PJM is the Pennsylvania-Jersey-Maryland Interconnection, CAISO is the California Independent System Operator, NYISO is the New York Independent System Operator, and ISO-NE is the New England Independent System Operator.15 CA has a goal of achieving 5% of peak demand in 2020 through price-responsive demand response. CA additionally has annual demand reduction goals through 2020, stated in MW, for each of its EDCs16 The demand reduction contribution from energy efficiency measures actually occurs over several program years, but is measured over the summer of 2012.
P r e p a r e d b y S t a t e w i d e E v a l u a ti o n T e a m15 | Page
ACT 129 DEMAND RESPONSE STUDY Summer 2012
Table C-3 above shows that California is the only state examined with separately stated demand reduction and DR goals. California has separate budgeting and planning processes for DR and energy efficiency (EE). The other states examined have either demand reduction or DR goals. Of those states, only New York does not have a specified demand reduction goal amount. Additionally, the table shows that Act 129 implements more aggressive demand reduction targets in Pennsylvania compared to such targets in the other states examined in this paper. The effective single-year 2% demand response goal created by Act 129 is considerably more aggressive that the Illinois demand response goal of approximately 0.1% per year.2. MEASUREMENT AND VERIFICATION – DETERMINING BASELINES The methodology used to estimate the load reduction that a DR resource produces depends on the type of resource and also varies by jurisdiction. Residential DLC programs typically rely on a load research study where a sample of customers is selected from the population of participating homes. The air conditioning load in the sampled homes is metered and the average load on event days is compared to the average load on non-event weekdays with similar temperatures. The average load difference of the sample is used as an estimate of the per-home load reduction of the population and multiplied by the number of participating homes to calculate the impact of the program during events. In 2012, some Pennsylvania EDCs conducted their own load research study to determine DLC impacts and other EDCs elected to use deemed values calculated from a previous PJM load research study17.
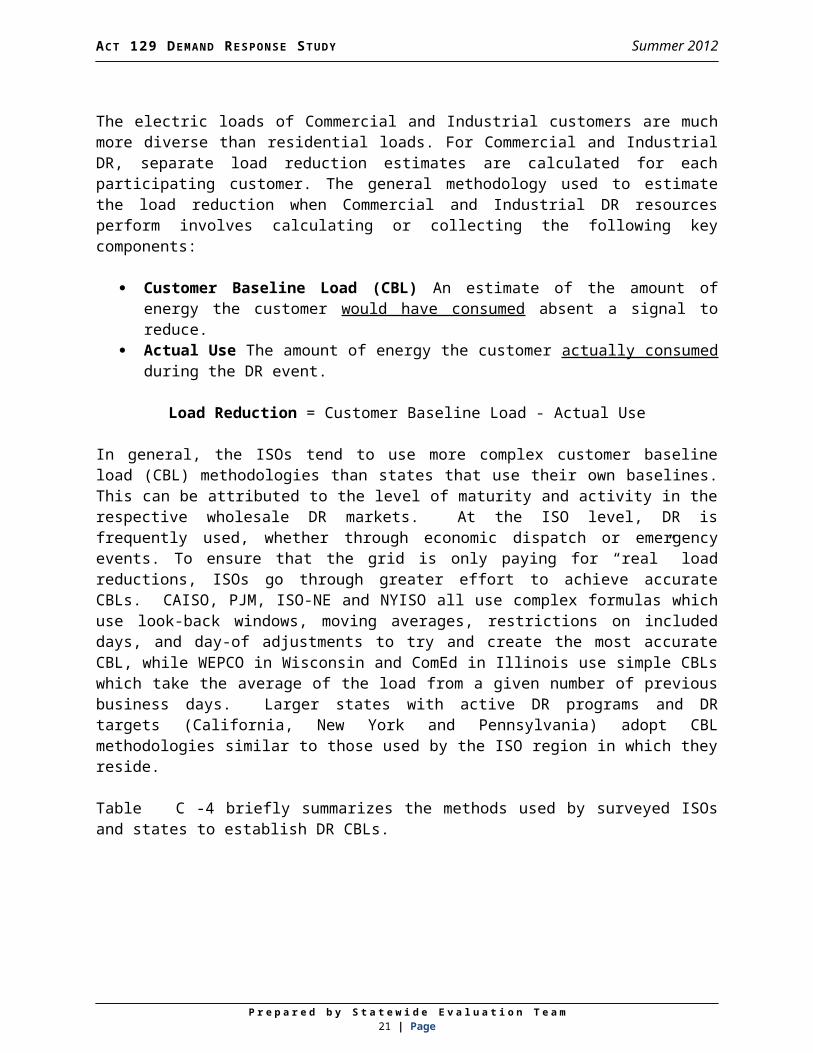
The electric loads of Commercial and Industrial customers are much more diverse than residential loads. For Commercial and Industrial DR, separate load reduction estimates are calculated for each participating customer. The general methodology used to estimate the load reduction when Commercial and Industrial DR resources perform involves calculating or collecting the following key components:
Customer Baseline Load (CBL) An estimate of the amount of energy the customer would have consumed absent a signal to reduce.
Actual Use The amount of energy the customer actually consumed during the DR event.
Load Reduction = Customer Baseline Load - Actual Use
In general, the ISOs tend to use more complex customer baseline load (CBL) methodologies than states that use their own baselines. This can be attributed to the level of maturity and activity in the respective wholesale DR markets. At the ISO level, DR is frequently used, whether through economic dispatch or emergency events. To ensure that the grid is only paying for “real” load reductions, ISOs go through greater effort to achieve accurate CBLs. CAISO, 17 Values in Table 13 of the following report were allowed to be used as Act 129 gross verified savings estimates for EDC direct load control programs. http://www.pjm.com/~/media/documents/reports/20070406-deemed-savings-report-ac-heat.ashx
P r e p a r e d b y S t a t e w i d e E v a l u a ti o n T e a m16 | Page

ACT 129 DEMAND RESPONSE STUDY Summer 2012
PJM, ISO-NE and NYISO all use complex formulas which use look-back windows, moving averages, restrictions on included days, and day-of adjustments to try and create the most accurate CBL, while WEPCO in Wisconsin and ComEd in Illinois use simple CBLs which take the average of the load from a given number of previous business days. Larger states with active DR programs and DR targets (California, New York and Pennsylvania) adopt CBL methodologies similar to those used by the ISO region in which they reside.
Table C-4 briefly summarizes the methods used by surveyed ISOs and states to establish DR CBLs.
P r e p a r e d b y S t a t e w i d e E v a l u a ti o n T e a m17 | Page

ACT 129 DEMAND RESPONSE STUDY Summer 2012
Table C-4: Summary of CBL Methodologies
Entity Baseline Methodology Adjustment
PJM
Non-Variable Loads (less than 20% Root Mean Square Error (RMSE) test)
Weekdays – highest 4 of 5 recent “like days” (excluding weekends, DR events and holidays) with a 45 calendar-days maximum. If not 4 days, use highest event days in window to reach 4.
Weekends/Holidays – highest 2 of 3 recent, 45 calendar-days look back. If not 2 days, use highest event days in window to reach 2.
Variable Loads (greater than 20% RMSE test)
Custom baseline for each customer needs approval from PJM
Additive, symmetricDifference between CBL and day-of usage over three-hour period beginning four hours before first event. Added to CBL during event hours.
CAISO
WeekdaysAverage of 10 most recent similar, non-event days. 45 calendar-days look back window. If not 10 days, use minimum of 5 days. If not 5 days, use highest event days in window to reach 5.
Weekends/HolidaysAverage of 4 most recent similar, non-event days. 45 calendar-days look back window. If not 4 days, use highest event days to reach 4.
Multiplicative, symmetric
Ratio of actual usage to baseline over three-hour period beginning four hours before first event. Multiplies baseline on event day. Cannot go below 80% or above 120%.
NYISO
WeekdaysUse a 10 previous weekday look-back window. For hours within past 10 days where no day-ahead reduction was scheduled, actual metered data is used. For hours where a day-ahead reduction was scheduled, the 10 weekday values are ranked in descending order and the baseline is the average of the 5th and 6th ranked values.
WeekendsUse a 3 previous same weekend day (i.e. Saturday or Sunday) look-back window. For hours in past 3 days with no day-ahead reduction scheduled, use actual metered load. For hours where a day-ahead reduction was scheduled, use average of the 3 previous days for that hour.
Multiplicative, symmetric
Ratio of actual usage to baseline over two-hour period beginning four hours before the first event. Cannot be below 80% or above 120%.
P r e p a r e d b y S t a t e w i d e E v a l u a ti o n T e a m18 | Page
ACT 129 DEMAND RESPONSE STUDY Summer 2012
Entity Baseline Methodology Adjustment
CA“10-in-10 baseline with day-of
adjustment.”Average for each hour of 10 previous non-events, non-holiday weekdays.
Multiplicative, symmetric. Same as CAISO but capped at 40%.
IL – ComEd
Average usage of the past 5 business days NoneOH – Duke
Energy
One complete year of hourly metered dataNone
NY – ConEd
Choice of NYISO Average CBL or Adjusted CBL
WeekdaysUses 10 days prior to an event, excluding events, weekends, holidays, or low usage days. 10 days are ordered based on average daily event period usage, and the five lowest days are eliminated. CBL is the average of the remaining five days.
WeekendsUses three like days (either Saturdays or Sundays) prior to an event, with no exclusions for Holidays or event days. The three days are ordered based on average daily event period usage, and the lowest day is eliminated. The CBL is the average of the remaining two days.
Average CBL – noneAdjusted CBL –
Ratio of customer’s demand to CBL demand during two-hour period four hours prior to beginning of event
PA Use PA Technical Reference Manual (TRM) and PJM Protocols
See PJM Manual 11 and 18
WI - WEPCO
The average measured demands occurring between 10am and 4pm on the first two weekdays preceding each day that a curtailment occurred, excluding weekends, holidays, and curtailment days
None
Measurement & Verification (M&V) of savings generated by the Pennsylvania Act 129 DR programs is based on the protocols specified in the Act 129 TRM, the current version as adopted by the Commission effective June 1, 2012.18 The following is a summary of the provisions of the 2012 TRM addressing DR:19
1. Hourly peak load reductions from direct load control (DLC) and load curtailment (LC) are determined in accordance with PJM M&V protocols, related business rules, protocol approval processes and settlement clearing due diligence practices in place during the summer of 2012.
18 Pennsylvania Public Utility Commission, Implementation of the Alternative Energy Portfolio Standards Act of 2004: Standards for the Participation of Demand Side Management Resources – Technical Reference Manual 2012 Update, Docket No. M-00051865, December 16, 2011. (2012 TRM)
19 See Section D – Demand Response – of the 2012 TRM.
P r e p a r e d b y S t a t e w i d e E v a l u a ti o n T e a m19 | Page

ACT 129 DEMAND RESPONSE STUDY Summer 2012
2. Peak load reductions from all other measures and programs, including energy efficiency, critical peak pricing (CPP) programs, and conservation voltage control are determined with the protocols specified in the TRM, or with a custom measure protocol.
3. In order to accurately account for load reductions in each of the 100 hours of highest demand, both Act 129 and PJM event days must be excluded when establishing the CBLs.
4. An EDC will sum the Total Hourly Peak Load Reduction in each hour (calculated at the customer level) to reflect transmission and distribution losses if the EDC’s peak load reduction targets were determined at the system level.
Assessing Act 129 demand reductions over 100 hours rather than a smaller subset of hours presented two challenges in the measurement and verification of DR impacts:
1. The number of days resources need to be called on to reduce load created problems establishing an accurate CBL. If the highest 4 of 5 days in the past 45 days are used to establish the CBL and Act 129 or PJM events have been called on all comparably hot days in the past 45 days, a situation arises where there are not 4 hot summer non-event weekdays in the CBL look back window. This situation can lead to heavy reliance on the symmetric additive adjustment (SAA) component of CBL algorithm or using event days in the CBL and compromise the accuracy of load reduction estimates.
2. PJM protocols that focus on capacity impacts may not be suitable for quantifying demand reduction for purposes of determining achievement of the Act 129 demand reduction goals. PJM allows the use of deemed savings values to estimate the load reductions produced by DLC programs. These deemed savings values are based on very hot outdoor air temperatures that are expected to be in place during a system emergency. To achieve demand reduction over the top 100 hours, Act 129 DLC programs were called on milder days. The use of PJM deemed savings values at these milder temperatures are likely to over-estimate the actual load reduction achieved by the Act 129 program. The SWE recommends that PJM deemed savings values be disallowed for EDC direct load control programs if the top 100 hours protocol is continued.
3. COST-EFFECTIVENESS ANALYSIS
Table C-5 below provides a comparison of how incentive payments to end-use participants in DR programs and ISO payments to EDCs for wholesale market participation are treated under cost-effectiveness tests implemented in other states and the Commonwealth of Pennsylvania.
Table C-5: Treatment of DR Payments by Various States
State Incentive Payments from ISO Payments to EDCs20
20 Includes ISO payments to CSPs acting on behalf of EDCs.
P r e p a r e d b y S t a t e w i d e E v a l u a ti o n T e a m20 | Page
ACT 129 DEMAND RESPONSE STUDY Summer 2012
EDCS to ParticipantsIn TRC?21 Where? In TRC? Where?
CA YesProxy for
Participant Costs
Yes Benefit
IL Yes N/A Yes BenefitOH Cost-effectiveness test not yet approved.NY - ConEd Yes
Proxy for Participant
CostsNo Not in TRC
PA YesProxy for
Participant Costs
No Not in TRC
WI No TRC test for DR found.
As shown in Table C-5, there is consistency between states with published TRC test methods in regard to the treatment of DR program incentive payments. In California, New York and Pennsylvania, incentive payments made by EDCs to program participants are included in the TRC test as a proxy for participant costs.22 The rationale is that a participant’s actual transaction costs cannot be readily or easily determined, but an end-user would not participate unless the incentives received are at least equal to the participant’s costs to curtail usage during peak demand periods. California includes 75% of the incentive payment to participants as the proxy for participant costs, whereas New York and Pennsylvania include the entire incentive payment to participants as the proxy for participant costs. By including 75% of the incentive as a proxy for costs, California assumes that the incentive payment given to the participant is greater than the participant’s DR program costs. Additionally, both California and Illinois include ISO payments to the EDC as a benefit so long as the payments are a result of DR being bid into the wholesale market, whereas Pennsylvania does not include such ISO payments.23 This situation is analogous to an EDC acting as an aggregator for DR resources into the PJM market. Such an arrangement makes sense for direct load control programs because residential customers are too small to go to market in PJM without aggregation. EDC aggregation of C&I load curtailment resources is unnecessary because these customers have access to the PJM markets without EDC involvement and EDC involvement would place risk on an EDC in exchange for little benefit.
Section F of this report includes a sensitivity analysis which examines the effect that these protocols have on the cost-effectiveness of EDC-sponsored DR programs in Pennsylvania in 2012.
21 TRC refers to the Total Resource Cost Test Manual for each state.22 For Pennsylvania, see 2011 TRC Order, p. 15.23 Id., pp. 12: “[W]e agree….that PJM’s economic DR programs are independent programs from Act 129 and that any charges, penalties or payments from the PJM DR programs should be ignored for purposes of Act 129, regardless of whether the charges, penalties, or payments are to/from a CSP, a customer, or an EDC.”
P r e p a r e d b y S t a t e w i d e E v a l u a ti o n T e a m21 | Page

ACT 129 DEMAND RESPONSE STUDY Summer 2012
a. Treatment of Payments from Multiple SourcesThis section of the report explores how the examined states treat payments from multiple sources, defined as a participant receiving two payment streams for the same DR event - a payment directly from the ISO or indirectly through an independent curtailment service provider (CSP), and a payment from the EDC (or a CSP acting on behalf of the EDC).24 The Commonwealth of Pennsylvania currently allows DR participants to enroll in both the PJM DR markets and the Act 129 EDC-sponsored DR programs, which creates the possibility of a customer receiving two payments for the same load reduction. Section E and Section F of this report examine the prevalence of “overlapping participation” during the summer of 2012 performance period and explore the impact it has on the cost effectiveness of the Act 129 DR programs.
CAISO and the California Public Utilities Commission (CPUC) have rules to prevent multiple payments for a single load reduction. The CPUC states that when two retail programs call an event at the same time, the participant can only receive payment under the capacity program and not the energy program. California EDCs also prohibit customers enrolled in CAISO demand response programs from participating in their programs which aggregate power for CAISO.
In New York, entities can enroll in both NYISO and Con-Edison commercial and industrial DR programs simultaneously. Con Edison’s programs are driven by the economics of supporting the distribution system whereas the NYISO programs are based on the economics of the bulk supply system. Essentially, the Con Edison programs are implemented for the transmission and distribution (T&D) benefits and the NYISO programs are implemented for the generation benefits. This separation is possible because avoided T&D costs in the New York metro area are quite high ($100/kW-year) and the Con Edison programs are cost effective based on avoided T&D costs alone. The one exception to being able to enroll in both programs is residential DLC, which Con-Edison bids into NYISO. For this program, the Company has a requirement that customers cannot bid into NYISO via other channels.25
b. Treatment of Payments in Pennsylvania Act 129Act 129 requires the use of a TRC test to evaluate the cost-effectiveness of the EDCs’ EE&C plans, inclusive of DR programs utilized to achieve the Act 129 demand reduction goals. Act 129 defines a TRC test as “a standard test that is met if, over the effective life of each plan not to exceed 15 years, the net present value of the avoided monetary cost of supplying electricity is greater than the net present value of the monetary cost of energy efficiency conservation measures.”26 The TRC test is “to be used to determine whether ratepayers, as a whole, received more benefits (in reduced capacity, energy,
24 The latter payment stream from the EDC could arise from a retail DR program, i.e., originating at the EDC level in a state-sponsored DR program, or from a wholesale DR program, i.e. The EDC bids the participant’s DR resource into the ISO market and receives payment for that resource, which it then shares with the participant.25 Email correspondence with Con-Edison DR Program Management. 9 Aug. 2012. 26 66 Pa. C.S. § 2806.1(m).
P r e p a r e d b y S t a t e w i d e E v a l u a ti o n T e a m22 | Page

ACT 129 DEMAND RESPONSE STUDY Summer 2012
transmission, and distribution costs) than the implementation cost of EE&C plans.”27
DR program costs typically include administrative and equipment costs, which should be included in the TRC test calculations. In the 2011 TRC Order, the Commission addressed the treatment of certain transaction payments and funding for purposes of the TRC test, as follows:
1. DR payments to CSPs and EDCs from PJM – the Commission ruled that “PJM’s economic DR programs are independent programs from Act 129 and that any charges, penalties, or payments from the PJM DR programs should be ignored for purposes of Act 129, regardless of whether charges, penalties, or payments are to/from a CSP, a customer or an EDC.”28 Thus, all PJM payments pursuant to DR programs, whether to CSPs, customers or EDCs, are uniformly excluded from the TRC test.
2. DR payments to CSPs and Participants from EDCs – The Commission ruled that these payments are treated as a proxy for DR program participant transaction costs.
The Act 129 TRC test guidelines are mostly consistent with other jurisdictions in the treatment of payments to C&I load curtailment program participants. None of the states surveyed allow payments from an ISO load curtailment program to participants to be included in the benefits portion of the EDC program’s TRC ratio. Each of the states considered, other than California, also include 100% of the EDC payments to CSPs and participants as a proxy for participant costs. California includes 75% of these payments in the TRC calculation as a proxy for participant costs, which results in a more favorable TRC ratio.
Payments from programs like residential DLC are treated more conservatively in Pennsylvania and New York than in California or Illinois. Under the current Act 129 TRC test guidelines, if a Pennsylvania EDC were to bid its DLC program into the PJM forward capacity market, the revenue earned would be excluded from the benefits of the TRC test. California and Illinois include this type of revenue in the TRC benefits. Inclusion of this wholesale market revenue from PJM would replace the avoided cost of generation capacity calculation in the TRC ratio of Pennsylvania DLC programs with actual revenue. Bidding these programs into the Forward Capacity Market would exert downward pressure on the capacity prices in the region. The SWE feels that bidding EDC direct load control programs into the PJM capacity market is necessary to realize the full program benefits, however ultimately this is a business decision that must be made by each EDC individually.
27 Pennsylvania Public Utility Commission, 2011 Total Resource Cost Test Order, Docket No. M-2009-2108601, August 2, 2011, (2011 TRC Order), p. 7.28 2011 TRC Order, p. 12.
P r e p a r e d b y S t a t e w i d e E v a l u a ti o n T e a m23 | Page

ACT 129 DEMAND RESPONSE STUDY Summer 2012
D. PENNSYLVANIA DEMAND RESPONSE MARKET PRICING ANALYSIS
DR programs are designed to secure resources which can be dispatched during periods when the electrical grid is constrained. Calling on these customers to reduce demand during hours of peak consumption increases the reliability of the grid by balancing supply and demand. This helps prevent blackouts or brownouts and can also have a positive effect on wholesale electric prices. The two key market components which serve as a proxy for the value of DR are the value of energy and the value of capacity. This section of the report investigates the market conditions which promote cost-effective DR and examines the cost values which were in place during the summer 2012 DR season in Pennsylvania.
Generation resources are secured to meet demand in the order of ascending price. During periods of low demand, the needs of the region can typically be met with low-cost power. As system load increases, utilities are forced to accept increasingly higher generation bids in order to meet the demand for energy. These higher price generation resources are usually inefficient natural gas turbines that can be brought online quickly during periods of peak demand. Several deregulated markets in the United States, including PJM, use Locational Marginal Pricing (LMP) to assign wholesale market prices for electricity. The LMP ($/MWh) of a zone within a region for a given time is based on an optimal dispatch of power within the system and is equal to the highest cost generation offer required to meet system demand plus adjustments for transmission constraints and line losses. A high LMP means that the grid is constrained and demand is higher than supply.
The general relationship between system demand and LMP in PJM is shown below in Figure D-6. The example shown is for the PJM Interconnection in July 2012. PJM calculates this supply curve on a monthly basis using historical generation offers and adjusting them for current fuel prices. In reality, PJM is made up of a number of zones in different states, and the exact relationship in each zone29 is somewhat varied and depends on available supply as well as demand. This example is presented to illustrate the impact of energy prices (LMP) on the cost effectiveness of a DR program. The effect of electric supply on Pennsylvania Act 129 DR programs is discussed in more detail in Section 2. Figure D-6 shows that the wholesale price of energy remains relatively constant at around $20 per megawatt-hour (MWh) until the system demand reaches about 150,000 megawatts (MW). At this point, the estimated LMP begins to increase sharply in response to increases in system load. This period of price responsiveness on the supply curve is when DR resources are generally deemed cost effective. The SWE team defines this area as the “green zone” for DR programs on the LMP curve in a given period (month).
29 A map of the PJM territory with zones can be found athttp://www.pjm.com/~/media/about-pjm/pjm-zones.ashx
P r e p a r e d b y S t a t e w i d e E v a l u a ti o n T e a m24 | Page

ACT 129 DEMAND RESPONSE STUDY Summer 2012
Figure D-6: Relationship between LMP and System Load
Understanding the volatility of the LMP is of critical importance to the design of a DR program. DR is most cost-effective when events are called during periods in the “green zone,” or when the LMP is highly responsive to system load and prices are elevated. Reducing system load during these periods can reduce the LMP by moving the system lower on the supply curve shown in Figure D-6. Consider a 1,000 MW curtailment event that is called when the system demand is 165,000 MW. Reducing load by 1,000 MW under these system conditions and moving it left along the x-axis of Figure D-6 would lower the LMP by almost $30/MWh. If the same 1,000 MW of DR resources were dispatched when the system demand was 140,000 MW, the estimated reduction in LMP would be merely $0.70/MWh. DR participants have to be incented to reduce load because of the potential discomfort or disruption to operations. Thus, DR resources should only be dispatched during periods when the grid is constrained and LMPs are high to ensure the curtailment will have a positive economic effect.As noted previously, on March 15, 2011, FERC issued Order 745 regarding Demand Response Compensation on Wholesale Energy Markets. One of the primary requirements of the order was that DR resources be compensated at the full zonal LMP for the hour during which the load reduction occurred. Since the zonal LMP is the price of adding an additional MWh of supply to the grid for a zone, it makes sense that a load reduction during the hour be valued equally. Under this protocol, a utility should choose between additional generation and DR on the basis of price. If additional supply can be procured for less than the cost of a DR resource, the utility should procure the generation resource. Comparing this protocol with the Act 129 DR structure reveals a major drawback of setting DR targets for EDCs in Pennsylvania during hours when DR is not likely to be cost-effective. In order to meet a mandated target, EDCs are forced to procure DR resources when the more cost-effective option to balance supply and demand would be additional generation. The possibility of fines being imposed for missing demand
P r e p a r e d b y S t a t e w i d e E v a l u a ti o n T e a m25 | Page

ACT 129 DEMAND RESPONSE STUDY Summer 2012
reduction targets forces EDCs to set incentive payments at levels necessary to gather enough resources to meet the target rather than at the actual value of the resources. This leads to EDCs paying customers significantly more to reduce load than the cost at which the load could have been acquired from a generation-side resource resulting in poor cost to benefit ratios for the Act 129 DR program.
Consider an EDC which decides that it will need to offer customers $500 per MWh in order to gather sufficient participation to meet its mandated DR target. If an event is called during an hour when the LMP is $100 per MWh in the EDC’s zone, the EDC is effectively paying the customer five times what the load reduction is worth and dispatching the DR resource was not a cost-effective energy purchase for the utility or its ratepayers30. The SWE’s review of Act 129 DR participation data shows that this was frequently the case during the summer 2012 DR season in Pennsylvania.
Establishing a fixed demand reduction target in the top 100 hours does not account for the complexity of the demand response market. DR programs are designed to produce temporary reductions in consumption when the grid is most constrained. The availability of DR resources during periods of peak demand reduces the need to increase the capacity of the system. Examining real-time energy prices (LMPs) reveals times when the grid is constrained and DR is needed to balance supply and demand. The next sections of this report examine historical LMPs across the Commonwealth of Pennsylvania from 2007 to 2012 and identifies three sources of variation that must be accounted for when establishing demand response goals if programs are going to be cost-effective for Pennsylvania ratepayers. Each of these findings is discussed in detail in subsequent sections.
1) The need for DR is not consistent across the state. Energy and capacity prices in the eastern part of the state have been historically higher than those in the western part of the state. Consequently, DR is likely to be more cost-effective for eastern EDCs compared to western EDCs.
2) There is significant variation in energy prices within the top 100 hours of a summer performance period for each EDC. During several hours it appears that the grid is not constrained and DR may not be cost effective. Valuing load reductions from each hour the same does not address this variation.
3) The need for DR is highly correlated with weather patterns and will be much lower in a cool summer than a hot summer for a given performance period. An EDC may experience conditions that promote cost-effective DR for 5 hours during a cool summer and 35 hours during a hot summer.
1. GEOGRAPHIC VARIANCE IN DR MARKET PRICING
The state of Pennsylvania spans both the Mid-Atlantic and West market regions of PJM and the economics of DR has been historically very different in these two regions. PECO Energy Company, PPL Electric Utilities, Metropolitan Edison Company and Pennsylvania Electric Company are part of the Mid-
30 This is a simplified example and does not consider avoided capacity benefits or effects of wholesale price suppression.
P r e p a r e d b y S t a t e w i d e E v a l u a ti o n T e a m26 | Page

ACT 129 DEMAND RESPONSE STUDY Summer 2012
Atlantic market region and West Penn Power Company, Duquesne Light Company and Pennsylvania Power Company are part of the West market region. While the cost of acquiring DR resources is somewhat consistent across the state, the value of capacity and peak energy differ significantly.
The top 100 hours peak load reduction protocol used for Phase I of Act 129 values DR resources as somewhat of a hybrid between energy and capacity. Capacity benefits only occur when the grid is constrained and the demand for power is approaching the available supply. DR events called during any of the top 100 hours when the grid is not particularly constrained save some energy but provide very little benefit compared to the cost of acquiring these resources at high incentive levels.
In PJM, capacity resources are secured to meet the region’s electric needs through an auction process. Generators and DR resources are allowed to bid the load which they can reliably produce or reduce load in the capacity market on equal footing. A resource which clears in the capacity auction must be able to produce or reduce load when called upon or else face financial penalties. A DR resource which clears in the PJM capacity auction receives a monthly payment whether or not it is actually called to curtail load. The fundamental difference between the PJM capacity market and the Act 129 DR programs is that PJM capacity resources are paid for the ability to curtail if needed and Act 129 DR resources are paid for actual curtailment, irrespective of whether that load reduction was needed to maintain system reliability or not.
In PJM, the majority of the regional capacity resources are secured during a Base Residual Auction. This auction is held in May, three years prior to the delivery year. A delivery year begins on June 1st and ends on May 31st of the following calendar year. The avoided cost of capacity values the Pennsylvania EDCs will use to assess the cost-effectiveness of their 2012 DR programs were established in May 2009 and are shown below in Table D-6 along with the zonal capacity prices for the next three delivery years.
Table D-6: Base Residual Auction Results – Pennsylvania EDC Zonal Capacity Prices
Market Region EDC
2012/2013 ($/kW-year)
2013/2014 ($/kW-year)
2014/2015 ($/kW-year)
2015/2016 ($/kW-year)
West
Duquesne $6.11 $10.12 $45.97 $49.14West Penn
Power $6.11 $10.12 $45.97 $49.14Penn
Power NA $10.12 $45.97 $107.32
Mid-Atlantic
Met-Ed $48.69 $82.54 $49.37 $60.51PECO $52.21 $89.46 $49.37 $60.51
Penelec $48.69 $82.54 $49.37 $60.51PPL $48.69 $82.54 $49.37 $60.51
P r e p a r e d b y S t a t e w i d e E v a l u a ti o n T e a m27 | Page

ACT 129 DEMAND RESPONSE STUDY Summer 2012
Table D-6 shows that there is a significant difference in the value of capacity for the 2012/2013 delivery year between the EDCs in the West market region and those in the Mid-Atlantic market region. Based on these values, a 1 MW peak load reduction in the eastern part of the state is worth almost eight times as much as the same 1 MW peak load reduction in the western part of the state. The difference is similarly pronounced for the 2013/2014 delivery year, but values across the state become more homogenous for the 2014/2015 and 2015/2016 delivery years. Low capacity prices indicate widely available generation resources and a lack of electric supply constraint in the zone. These conditions are clearly met in the West market region in the 2012/2013 and 2013/2014 delivery years and it is unlikely that any DR will be cost effective in these service territories. The SWE recommends that the Commission pay close attention to the results of the Base Residual Auction for the 2016/2017 delivery year when considering peak demand reduction goals in Phase III of Act 129. There are indications that the east/west differences may be dissipating due to the construction of new transmission lines in Pennsylvania and additional generation in New Jersey. However, historical analysis of market conditions indicates that EDCs in the West market region may warrant a lower peak demand reduction target than the companies in the Mid-Atlantic market region.
Similar to the variation in regional capacity prices, the variation in regional energy prices (LMPs) across the state can have an effect on DR cost effectiveness if the intent of a dispatch is to lower wholesale energy prices. The LMPs provide information on how constrained the grid was during previous summers and how often the grid was in the DR “green zone” defined in FigureD-6. Table D-7 shows the average LMPs for each EDC in the previous six summers over the 100 hours of highest system demand. Penn Power became part of the PJM Interconnection on June 1, 2011 so the following historical comparison only includes Penn Power for the summers of 2011 and 2012.
P r e p a r e d b y S t a t e w i d e E v a l u a ti o n T e a m28 | Page

ACT 129 DEMAND RESPONSE STUDY Summer 2012
Table D-7: Comparison of Average Top 100 LMPs by EDC and Year.
Year
Mid-Atlantic Market Region West Market RegionPECO ($/MW
h)
Met-Ed ($/MW
h)
PPL ($/MW
h)
Penelec
($/MWh)
West Penn
($/MWh)
Duquesne
($/MWh)
Penn Power ($/MW
h)2007 $160.65 $180.3
2$148.8
0 $121.62 $144.12 $118.55 NA
2008 $209.59 $201.00
$190.70 $149.73 $174.06 $134.79 NA
2009 $65.95 $66.04 $64.73 $56.66 $64.22 $62.95 NA
2010 $137.46 $128.97
$126.72 $99.69 $103.80 $84.03 NA
2011 $199.88 $194.36
$195.87 $155.07 $129.21 $118.29 $96.04
2012 $112.47 $109.38
$105.60 $102.96 $97.26 $100.98 $99.68
Six Year
Average
$147.67
$146.68
$138.74
$114.29 $118.78 $103.26 $97.86
A visual comparison of the average values in Table D-7 reveals that the EDCs in the Mid-Atlantic market region typically experience higher LMPs during peak summer hours than those in the West market region. Unlike the capacity prices, which are calculated annually, energy prices (LMPs) are calculated on an hourly basis. The number of data points and the volatility of the LMPs values meant that the analysis of variance across the state requires sophisticated techniques. The SWE used a statistical model to analyze this variance in LMPs. The goal was to determine whether these differences were statistically significant or trivial within a noise band31. If statistically significant differences in wholesale electric prices exist between EDCs during the top 100 hours of summer peak demand, the value of DR in those EDC service territories during the top 100 hours is different and should be addressed when establishing DR goals.
A one-way analysis of variance (ANOVA32) is a common statistical procedure used to test statistical variance and compare a single factor (in this case the LMP) among multiple groups (EDCs) to see if a significant difference exists between the groups. However, one of the underlying assumptions of the traditional version of the test is that the data being compared is normally
31 LMP values fluctuate because of a number of factors. This is referred to as “noisy” data. Some differences between EDCs are expected due to the noise, or random error, in the data even if a significant difference doesn’t exist. A “noise band” is a margin of error, or range of variation that is expected based on the random variations in the data.32 R.L. Ott and M. Longnecker (2001), An Introduction to Statistical Methods and Data Analysis. 384-393.
P r e p a r e d b y S t a t e w i d e E v a l u a ti o n T e a m29 | Page

ACT 129 DEMAND RESPONSE STUDY Summer 2012
distributed. Normally distributed data will produce a bell shaped distribution when plotted with most values concentrated near the mean and the remaining values scattered evenly above and below the mean. However, LMPs tend to increase in an exponential fashion as shown in Figure D-6 and violate this assumption. A quick statistical check test conducted by the SWE for normality confirmed this finding for all seven EDCs for each year and prompted the need for a non-parametric test. A non-parametric test does not require that the data be normally distributed. The test chosen by the SWE as a substitute to the ANOVA was the Kruskal-Wallis33 test. The SWE conducted a separate Kruskal-Wallis test for each year from 2007 to 2012 to determine whether there was a significant difference in the top 100 hour LMPs between the EDCs.
Mechanically, the Kruskal-Wallis test is based on a ranking system. The LMPs for each year (2007-2012) across the state (all EDCs combined) are ranked lowest to highest, for hours 1-100, producing 700 values. Next, the sum of the ranks within each EDC is calculated. The result of this step is shown in TableD-8 below using LMP data from 2011, as an example.
Table D-8: Sum of LMP Rankings by EDC - Summer 2011
EDC Sum of Ranks (SR)
West Penn Power 30,116Duquesne 27,094
Met-Ed 43,573Penn Power 20,223
PECO 44,885PENELEC 35,824
PPL 43,635Mean Value 35,050
Total 245,350
The next step is to assess the significance of the variation of the EDCs’ Sum of Ranks (SR) from the mean value (35,050 in this example). A test statistic, H, is calculated using the following formula, to assess this variance.
H=
SRWPP2
100+
SRDLC2
100+
SRMet−Ed2
100+
SRPP2
100+
SRPECO2
100+
SRPNLC2
100+
SRPPL2
100−
SRtotal2
700700(700+1)
12Using the values shown previously in Table D-8, the solution to this equation is:
H=134.78
The test statistic H follows a chi-square distribution and the statistical significance of the LMP variance can be substantiated. The probability value (p-value) of the chi-square distribution provides a framework for interpreting the observed difference in LMPs between the EDCs. The larger the test statistic H, the lower the probability that the amount of variance observed in the year was
33 Ibid. Pages 410-414.
P r e p a r e d b y S t a t e w i d e E v a l u a ti o n T e a m30 | Page

ACT 129 DEMAND RESPONSE STUDY Summer 2012
due to noise (random error) and the more likely it is that a significant difference truly exists between the EDCs. The test statistic and corresponding probability (p-value) for each year are shown below in Table D-9. The p-value is the most informative value presented in Table D-9. The p-value represents the probability that the amount of variation in LMPs observed between EDCs for that year would occur through random error instead of a statistically significant difference in the LMPs. A low p-value is strong evidence that a significant difference in top 100 hour LMPs exists between the EDCs. Notice in each year other than 2012 there is less than 0.01% probability (p-value) that the differences observed would occur due to random error.
Table D-9: Kruskal-Wallis Test Results by Year
Year H (Chi-square) P-valueSignificant
Difference Between EDCs?
2007 86.88 < 0.0001 Yes2008 93.69 < 0.0001 Yes2009 20.97 0.0008 Yes2010 112.64 < 0.0001 Yes2011 134.78 < 0.0001 Yes2012 8.46 0.2061 No
The results in Table D-9 provide compelling evidence that peak energy (LMP) has not been valued equally across the Commonwealth of Pennsylvania historically. The SWE further examined the results of the Kruskal-Wallis test to determine where these significant differences were coming from. As expected, LMPs in the easternmost zones (PECO, PPL and Met-Ed) were significantly higher than the zones in the western part of the state (Duquesne, Penn Power and West Penn). Penelec experienced the lowest LMPs in the Mid-Atlantic market region and for several years has peak LMPs lower than West Penn Power.
It is noteworthy that 2012 energy prices were not significantly different between EDCs. The SWE believes that additional research is needed to determine if the differences between companies in the eastern and western parts of the state can be expected to persist in future phases of Act 129.
2. PRICING VARIANCE WITHIN THE TOP 100 HOURS
The Act 129 Phase I TRC Order directed the Pennsylvania EDCs to average the impact of DR programs across the top 100 hours of system demand and multiply this kW reduction by an avoided cost of capacity ($ per kW/year) to calculate the benefits of the Act 129 DR program. This approach indirectly implies that load reductions in the top 100 hours for a given EDC are valued equally. On the contrary, the SWE’s review of LMPs across the state during the top 100 hours of each year revealed that there is significant variation in energy prices within the top 100 hours for each EDC in any given year. As an example, Figure D-7 shows the LMPs during the top 100 hours of system demand for the seven Pennsylvania EDCs during the Act 129 summer performance period of
P r e p a r e d b y S t a t e w i d e E v a l u a ti o n T e a m31 | Page

ACT 129 DEMAND RESPONSE STUDY Summer 2012
2012. As noted in the previous section, 2012 was the only summer when the difference in LMPs between the EDCs was not substantial.
Figure D-7: LMPs during the Top 100 Hours of 2012 by EDC
Although the difference in LMPs between EDCs was not substantial in 2012, Figure D-7 shows that considerable variation in LMPs was observed within the top 100 hours for each EDC. The LMPs for each EDC varied by a factor of 10 between Hour 1 and Hour 10034 in 2012. As explained in Section 1, the cost-effectiveness of DR is negatively impacted when events are called outside the LMP “green zone”. DR programs are cost-effective when events are called in a smaller subset of hours when the LMPs are elevated and DR benefits are more valuable than generation. In 2012, the LMPs for all EDCs were elevated (>$200 per MWh) only during 12 to 14 hours of the summer performance period. DR resources called during these hours of high price volatility may have been the only cost-effective events of summer 2012. The cost effectiveness of DR in the 2012 top 100 hours is explored in further detail in Section F. If DR continues in future phases of Act 129, it will be crucial to reduce the number of hours DR resources are called to a subset during which the resources have a greater likelihood of being cost-effective.34 The values shown in Figure D-7 are sorted by descending LMP for presentation. Hour 1 does not necessarily correspond to the hour with the highest load in megawatts.
P r e p a r e d b y S t a t e w i d e E v a l u a ti o n T e a m32 | Page

ACT 129 DEMAND RESPONSE STUDY Summer 2012
Identifying the best subset of hours over which to dispatch DR resources requires an understanding of the demand and supply economics. The “green zone” introduced in Figure D-6 illustrated the effect of extremely high demand on LMPs. However, an unexpected generation shortfall on a summer afternoon when load is moderately high can also cause the grid to become constrained and elevate LMPs and the need for DR. Figure D-8 illustrates this phenomenon by showing the LMPs in the PECO zone plotted against the system load (in megawatts) for the top 100 hours of system demand during the summer of 2007. The “green zone” illustrates the elevated LMPs when the grid is highly constrained due to high demand. However, it is noteworthy that four of the top twelve LMPs of the summer (shown on the left side of the scatter plot) occurred in the area shaded red when the load was not substantially elevated. This “red zone” occurs when demand is close to exceeding the amount of power generation available. An unplanned service outage of a large generator can cause significant grid constraint and LMPs to increase exponentially. DR resources are more valuable during these hours (the red zone) than in hours where system demand is higher but balanced with the amount of available supply (hours with load between 7,800 and 8,200 MW represent this situation in Figure D-8).
Figure D-8: LMP versus Load in PECO Zone: Summer 2007
$0
$200
$400
$600
$800
$1,000
$1,200
7400 7600 7800 8000 8200 8400 8600
LMP
($/M
Wh)
Zonal Load (MW)
If the Commission decides to establish DR goals in Phase III of Act 129, it will be important to establish how the benefits of the achieved load reductions will be determined. Multiplying the average achieved load reduction by an avoided cost of capacity is a sound approach if the number of performance hours is reduced to correspond with the LMP “green zone” and “red zone”. Capacity is typically valued over the 5 to 10 hours of system demand when the grid is constrained at a critical point. This constraint can be a product of high demand
P r e p a r e d b y S t a t e w i d e E v a l u a ti o n T e a m33 | Page

ACT 129 DEMAND RESPONSE STUDY Summer 2012
(green zone), low supply (red zone) or a combination of the two. The energy pricing data presented in Figure D-7 indicates the grid was not significantly constrained during at least 50 of the top 100 hours of 2012 for all EDCs likely because reasonably priced generation offers were available and LMPs were not elevated. The SWE believes that Act 129 DR did not produce any cost beneficial savings because these hours are not considered when assessing the capacity footprint of the region. Therefore, avoided generation capacity benefits and any wholesale capacity price suppression benefits would not be realized. Further, the SWE believes any avoided energy costs or wholesale energy price suppression benefits are likely insignificant compared to the cost of acquiring resources due to low market prices.
3. VARIANCE IN MARKET PRICING FROM YEAR TO YEAR
The previous section examined the difference in the value of DR within the top 100 hours for each EDC. Precisely estimating the number of hours during which DR is likely to be cost-effective is challenging because of the LMP variation observed in the state from year to year. In Section 1, Table D-6 showed that, in addition to the geographical differences, PJM zonal capacity values vary significantly over time for each EDC. This section will explore the variation in zonal LMP over time.
Weather patterns during a given summer have a pronounced effect on the amount of grid constraint and resulting energy prices in the EDC service territories. Similar to the variation in capacity values over time shown in TableD-6, Figure D-9 shows the average top 100 hour energy values (LMPs) for each EDC for the 2007 to 2012 performance period. Figure D-9 shows that while the general shape of the pricing distribution is similar, the LMP values are not uniform from year to year.
P r e p a r e d b y S t a t e w i d e E v a l u a ti o n T e a m34 | Page
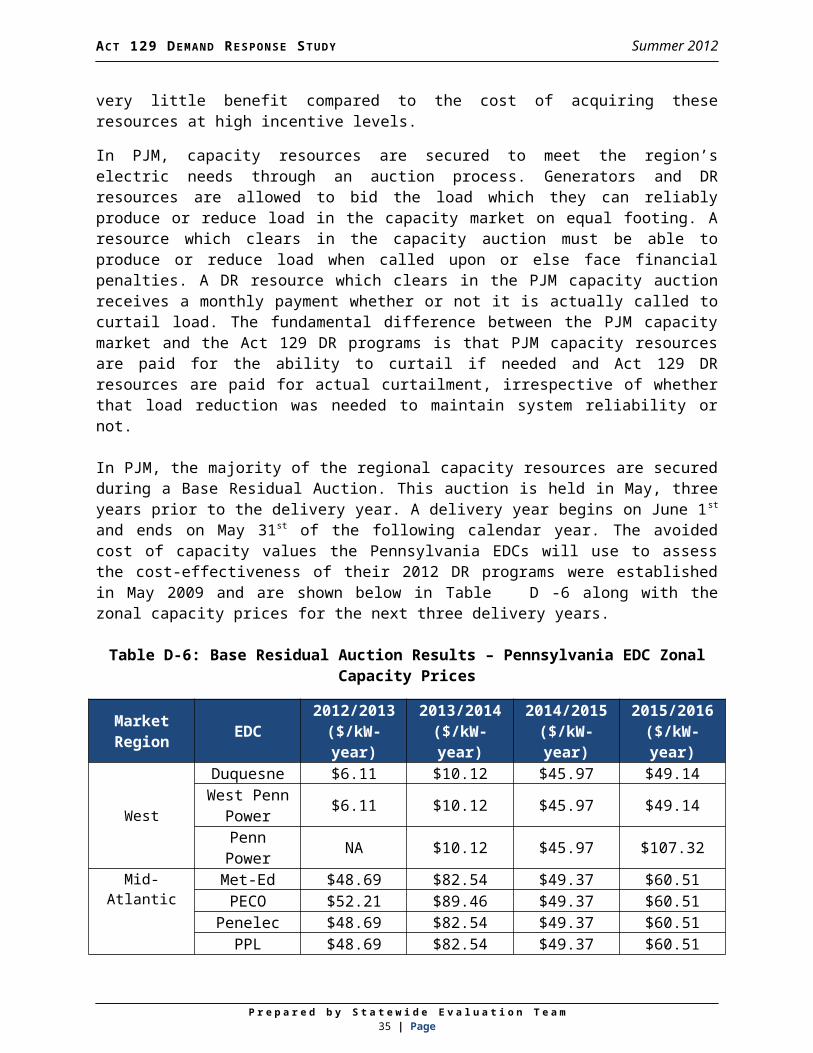
ACT 129 DEMAND RESPONSE STUDY Summer 2012
Figure D-9: Average EDC LMPs over the Top 100 Hours by Year
Energy demand was low in the Commonwealth of Pennsylvania in 2009 due to abnormally cool summer temperatures and an economic recession which reduced demand in the Commercial and Industrial sectors. The effects of these two key factors on energy prices are clearly noticeable in Figure D-9. In 2009, there were only two hours in any EDC service territory where the average LMP was above $16035. During a high temperature summer period such as 2008 or 2011, there were 20 to 30 hours when DR would have relieved grid constraint, been economically cost effective and would have had a positive effect on electric reliability. Based on this observed variance in energy pricing, the SWE recommends that any future DR targets be crafted such that the compliance metric is the average load reduction observed over a subset of hours during which DR is likely to provide a cost-effective alternative to generation. The performance period (number of hours) should be flexible and determined by load or economic conditions in place that year.
35 The LMP in Duquesne service territory was over $300/MWh during hour ending 15 and hour ending 16 on August 15, 2009
P r e p a r e d b y S t a t e w i d e E v a l u a ti o n T e a m35 | Page

ACT 129 DEMAND RESPONSE STUDY Summer 2012
E. ATTRIBUTION OF THE ACT 129 PHASE I DR PROGRAMSOne of the primary objectives of this study is to provide the Commission with information that will inform their decision on the possible inclusion of DR programs in future phases of Act 129. The cost-effectiveness of EDC-sponsored programs is the key component which will be used to determine whether DR should be included in Phase III of Act 129. If the costs of acquiring DR resources are greater than the energy and capacity benefits they produce given market conditions, the programs are not beneficial to the Commonwealth of Pennsylvania and should not be continued. Assessing the cost-effectiveness of DR programs requires that program performance records and avoided cost figures be merged to develop estimates of the benefits produced.
In 2012, each of the seven Pennsylvania EDCs sponsored a load curtailment DR program available to its non-residential customers in an effort to achieve the mandated 4.5% peak demand reduction. Many of the participants in the EDC programs also participate in similar DR programs offered by PJM. Managing the transmission grid means that PJM must balance the supply and demand for electricity at all times. PJM allows large non-residential customers to participate in both the wholesale capacity and energy markets in the same manner as generation resources. These customer offers to reduce demand during periods of high demand are treated and valued on equal footing with offers from generators to increase supply.
Because the Pennsylvania EDCs implemented programs on top of an existing PJM DR framework, the assessment of cost-effectiveness becomes more challenging. There is a large subset of customers participating in Act 129 load curtailment programs who have committed load reductions into the PJM Emergency (capacity) market. These are also customers who may have reduced their load via dispatch in the PJM Energy markets without the incentives provided through Act 129. The 2011 TRC Order directed EDCs to ignore any PJM charges, penalties or payments in the calculation of the TRC ratio for Act 129 DR programs, however, the SWE believes that, for purposes of this study, it is inappropriate to allocate all of the energy and capacity benefits to the EDC program when a customer receives payment from both the EDC and PJM for a load reduction during a given hour. The SWE believes that understanding customer motivation is necessary to estimate the incremental value of load curtailment programs in Pennsylvania because the benefits from a load reduction should be allocated to the program which motivated the action. To that end, a survey of customers participating in the Act 129 load curtailment programs was conducted by the SWE team with assistance from the EDC evaluation contractors to obtain the information needed to better determine the impacts of the Act 129 program relative to the PJM programs.
1. SURVEY HIGHLIGHTS
A total of 86 customers participated in the survey. Of this total, 60% first heard about the Act 129 load curtailment program through a curtailment service provider (CSP), either through an existing relationship or through marketing efforts of another CSP. 23% became aware of the program through their utility’s website, email, or bill insert. 67% of the Act 129 participants also
P r e p a r e d b y S t a t e w i d e E v a l u a ti o n T e a m36 | Page

ACT 129 DEMAND RESPONSE STUDY Summer 2012
participated in the PJM Economic Demand Response program, and 69% of customers participated in the PJM Emergency Demand Response Program. Approximately 42% of customers participated in both PJM programs.
With respect to curtailment activities, customer actions focus primarily on increasing the thermostat settings of HVAC equipment, turning off lights, or shutting down/rescheduling manufacturing processes. To a lesser degree, they use on-site generations. With respect to motivations for participating in load curtailment activities, receiving a financial incentive was the overwhelming response with a score of 4.3 on a scale of 0 to 5. Being viewed as a good corporate citizen, helping the EDC avoid outages, helping avoid rolling outages, and helping to improve electric reliability all scored lower, ranging from 3.5 to 3.8.
The general awareness of participants with respect to the program(s) they participated in varied. Considerable efforts were made to contact the person most familiar with their respective facility’s participation in load curtailment activities, and in most instances, respondents were knowledgeable about the various demand response markets that the facility participated in. In some instances however, there were respondents who were not able to differentiate between the Act 129 program and the PJM programs. These respondents received a slightly different battery of questions tailored to understand how likely the site would have been to participate in curtailments if the Act 129 revenue were not available.
An in-depth look at Act 129 participants reveals that participation was influenced in large part by the high incentives. When asked the likelihood of participating in curtailment activities if the financial incentive had been lower, only 5% of survey participants also participating in the PJM Economic Program indicated strongly that they would have still participated in curtailment activities. Similarly, only 13% of survey participants also participating in the PJM Emergency Program indicated strongly that they would have still participated in curtailment activities had the financial incentive been lower. This finding suggests that EDC load curtailment programs may not be able to deliver the same level of load reduction observed in 2012 if incentives are reduced in future program years to the levels needed to ensure cost effective programs.
The sample of customers participating in the survey included “PJM veterans” and “first-timers”. PJM veterans represent customers who participated in the PJM Economic and/or the PJM Emergency Program in or before 2011. First-timers represent customers that participated in one or both of the PJM programs for the first time in 2012. 45% of survey participants were veterans of the PJM Economic Program, 49% were veterans of the PJM Emergency Program, and 26% were veterans of both the Economic and Emergency programs. With respect to the PJM Economic Program, PJM veterans were impacted less by the Act 129 program than were the first-timers, as the veterans indicated that they were more likely to participate in load curtailment activities if the total financial incentive was lower (i.e., the Act 129 incentive was not offered). Likewise, with respect to the PJM Emergency Program, PJM
P r e p a r e d b y S t a t e w i d e E v a l u a ti o n T e a m37 | Page

ACT 129 DEMAND RESPONSE STUDY Summer 2012
veterans were impacted less by the Act 129 program than were the first-timers. These responses from first-timers indicate that the Act 129 programs attracted load curtailment commitments from customers who were influenced by the high incentive or may not have been willing to participate for the PJM revenue alone. Section F will show that the EDC load curtailment programs were not cost effective as offered in 2012 largely because of the EDCs overpaying customers for curtailments, so this additional participation is something that may not have benefitted the Commonwealth.
2. SURVEY DESIGN
The survey was conducted on a sample of EDC customers to obtain the information needed to develop scores which could be used to allocate benefits between the Act 129 program and PJM programs. The sample design specified providing estimates with precision of ±10% at the 90% confidence level at the statewide level, which required a sample of 70 participants. The sample was stratified by area and customer type. Area was defined by EDC service territory. Customer type was defined by the nature of a customer’s business and energy consumption. Analysis of the qualified population of customers revealed over 20 building types and various levels of energy consumption for each. The customer population for each EDC was analyzed, and each customer was assigned to one of four customer type categories: industrial-large, industrial-small, commercial-large, and commercial-small.
To ensure proper representation, and to provide a level of over sampling in efforts to achieve a final sample of 70, a minimum of 10 customers was established for each EDC. The survey was conducted via telephone interviews, which took approximately 15-20 minutes to complete. Table E-10 presents counts for the sample selected by EDC and stratum.
Table E-10: Attribution Survey Sample Design
EDC Large Commer
cial
Large Industr
ial
Small Commer
cial
Small Industr
ial
TOTAL
Duquesne 3 2 3 2 10Met-Ed 2 2 3 3 10PECO 5 4 5 4 18PENELEC 2 2 3 3 10PPL 4 4 5 6 19Penn Power
1 n/a36 4 5 10West Penn 3 2 2 3 10TOTAL 20 16 25 26 87
A total of 86 interviews were completed, which provided more responses than necessary to achieve the desired level of precision. There were instances when the populations for one or more subgroups within an EDC were not as large as originally expected, and it was not possible to achieve the sample quota for a particular EDC and customer type. In these cases, the calls were made to
36 There were no Large Industrial customer sites enrolled in the Penn Power load curtailment program in 2012
P r e p a r e d b y S t a t e w i d e E v a l u a ti o n T e a m38 | Page

ACT 129 DEMAND RESPONSE STUDY Summer 2012
customers in other subgroups in efforts to achieve the overall sample quota for each EDC. Table E-11 presents the sample achieved.
Table E-11: Attribution Survey Achieved Sample
EDC Large Commer
cial
Large Industr
ial
Small Commer
cial
Small Industr
ial
TOTAL
Duquesne 2 3 3 1 9Met-Ed 0 3 5 7 15PECO 5 3 5 4 17PENELEC 0 2 3 11 16PPL 12 0 4 1 17Penn Power
0 n/a 0 6 6West Penn 0 0 0 6 6TOTAL 19 11 20 36 86
3. SURVEY SCORING METHODOLOGY & RESULTS
The SWE requested a record for each participating customer for each hour during which an Act 129 load reduction was claimed in the Event Specific Information portion of the SWE Demand Response Data Request. Among the requested information was whether the customer was also participating in a PJM Economic or Emergency DR event during the hour. This data was used to determine the frequency of overlapping participation in the Act 129 and PJM markets. Overlapping participation for the purposes of this study means that the customer curtailed the same load during the same hour and received an incentive from both revenue streams.
Once instances of overlapping participation were identified, it was necessary to allocate benefits to the two programs which incented the customer to reduce load during the event. In efforts to obtain information needed to allocate benefits, the SWE contacted participants to gain insight into their motivation for participation and their decision-making process.
The SWE developed the concept of an Incremental Benefits Ratio to express the allocation of benefits between the two markets when overlapping participation existed. The Incremental Benefits Ratio is a number between 0 and 1 which represents the percentage of the total energy and capacity benefits that are attributable to the Act 129 program. If the Act 129 program was the primary driver of customer participation, the Incremental Benefits Ratio is close to 1. The following equations were applied to the benefits when overlapping participation was observed:
Act 129Benefits=(Total Energy∧Capacity Benefits )∗( Incremental Benefits Ratio)
PJM Benefits=(Total Energy∧Capacity Benefits )∗(1−Incremental Benefits Ratio)
P r e p a r e d b y S t a t e w i d e E v a l u a ti o n T e a m39 | Page

ACT 129 DEMAND RESPONSE STUDY Summer 2012
A survey instrument and associated scoring algorithm were developed to calculate a customer-specific Incremental Benefits Ratio based on responses to questions about motivation, intentions and level of commitment. Surveys were conducted by the EDCs’ evaluation contractors37 on a statewide sample of participants designed by the SWE. The results of these surveys were compiled, and statewide Incremental Benefits Ratio values were computed. These values were provided to SWE team staff that performed the program cost-effectiveness testing.
PJM offers customers a variety of opportunities to curtail load in exchange for incentives. The two broad classifications of these opportunities are Emergency (capacity) and Economic (energy). Because of the dissimilar nature of these two types of PJM programs, it was necessary to calculate and apply Incremental Benefits ratios separately when these markets overlapped with Act 129 events. The survey instrument was designed to capture any differences in motivation that may have existed for the two PJM markets.
The responses for each participant surveyed were subjected to single scoring system. The product of this scoring system is an estimate of the participant’s Incremental Benefits Ratio. If the customer participated in both the PJM Economic and Emergency markets, those Incremental Benefits Ratios were assessed separately. The basis of the scoring was the customer’s stated intention score. The stated intention score was determined by asking the participant the likelihood that they would have participated in the same amount of load curtailment activities during 2012 if two separate revenue streams had not been available. The question was administered by asking the participant to provide that likelihood using a scale of 0 to 10, with 0 being the least likely and 10 being the most likely. The response to this question determined the customer’s initial Incremental Benefits ratio, which could range from 0.0 to 1.0. For example, if a customer indicated that they most likely would not have participated in the same amount of load curtailment activities during 2012 had both revenues streams not been available, the expected response to the question might have been “2”. The initial Incremental Benefits ratio would be 0.8 ((10-2)/10).
The survey instrument also included questions which assessed the level of commitment, prior awareness and motivation. The scoring action associated with these questions was a function of the stated intention score. If a response was consistent with the stated intention score, no action was taken. However, if a response disagreed with the stated intention score, the Incremental Benefits Ratio was adjusted up or down. No inconsistencies were identified in the survey responses; therefore, no adjustments were made to the computed Incremental Benefits Ratios.
A subset of participants in Act 129 LC programs participate in both the PJM Economic DR market and the PJM Emergency market. Surveys conducted with this subset of customers returned two separate Incremental Benefits ratios. Customers who participated exclusively in the PJM Economic market or 37 These contractors are independent from the EDC. The contractors used specific staff trained in surveying to contact the customers to prevent any potential bias.
P r e p a r e d b y S t a t e w i d e E v a l u a ti o n T e a m40 | Page

ACT 129 DEMAND RESPONSE STUDY Summer 2012
exclusively in the PJM Emergency DR market were only relevant to one Incremental Benefits Ratio because no overlap was possible with the PJM market in which they were not enrolled. Once the survey was completed, two statewide Incremental Benefits Ratios were calculated. The Economic Incremental Benefits Ratio was applied to the Act 129 load reductions occurring during an hour for which a customer had also earned a PJM Economic settlement.
Two different applications were considered for the Emergency Incremental Benefits Ratio. The base case scenario was similar to the application of the Economic Incremental Benefits Ratio, in that the ratio was applied to the Act 129 load reductions occurring during an hour for which a customer curtailed load for the PJM Emergency program. The second scenario produces a much deeper discounting of Act 129 impacts. In 2012, Pennsylvania DR resources in the PJM Emergency program were dispatched on either one day or not all during the summer of 201238. While the observed coincidence of Act 129 and PJM Emergency events was very low in 2012, the dual enrollment of participants was commonplace. The SWE estimates that 55% of the MW enrolled in Act 129 Commercial and Industrial load curtailment programs were also enrolled in the PJM Emergency Load Response program. Because the SWE benefit/cost analysis presented in Section F values Act 129 DR programs as capacity resources, one of the sensitivities considered is to discount any demand reduction achieved by an Act 129 participant enrolled in the PJM Emergency program regardless of whether the Act 129 event actually coincided with a PJM Emergency dispatch or not. This was based on the SWE’s belief that a capacity resource can only be committed in one market.
The Incremental Benefits Ratios calculated are presented in Table E-12.
Table E-12: Incremental Benefits Ratios by PJM Program
Incremental Benefits Ratio ScoreEconomic Incremental Benefits Ratio 0.77Emergency Incremental Benefits Ratio 0.63Overall Incremental Benefits Ratio 0.73
An Economic Incremental Benefits Ratio of 0.77 means that when Pennsylvania customers participate in both an Act 129 DR event and receive a PJM Economic DR settlement during the same hour, the Act 129 program receives 77% of the benefits. This makes sense relative to the size of the incentive amounts offered by the two markets. The SWE calculated that the average LMP during the top
38 Resources were dispatched in the METED, PECO, PENELEC and PPL zones on July 18, 2012. Additional information on the PJM Load Management dispatches can be found at http://www.pjm.com/markets-and-operations/demand-response/~/media/markets-ops/demand-response/20120718-load-management-dr-event-key-times-and-hours.ashx
P r e p a r e d b y S t a t e w i d e E v a l u a ti o n T e a m41 | Page
ACT 129 DEMAND RESPONSE STUDY Summer 2012
100 hours across the state was $104.05/MWh39 during the summer of 2012. EDC program payments ranged from $150/MWh in the FirstEnergy voluntary program to nearly $900/MWh in PECO’s Demand Response Aggregator program. Since survey respondents listed financial incentives as their primary motivation for participation it follows that the program which offered the higher payment was listed as the primary driver of participation.
The Emergency Incremental Benefits Ratio of 0.63 was an interesting research finding. The mandatory nature of PJM Emergency Events along with penalties for non-compliance would indicate that these events would receive even higher attribution scores from customers. There was a significant difference in the responses of PJM veterans and first-timers so the SWE believes that this result is driven by customers who would not have signed up for the PJM ELRP in 2012 at all without the extra financial motivation provided by the EDC programs. The Overall Incremental Benefits Ratio is an average of the scores calculated among the survey sample. This factor is presented for reference only and was not used as an adjustment factor in any of the SWE benefit/cost analysis.
39 The PJM Economic DR market pays customers the LMP for each MWh curtailed provided that the LMP is greater than the value determined by the Net Benefits Test
P r e p a r e d b y S t a t e w i d e E v a l u a ti o n T e a m42 | Page

ACT 129 DEMAND RESPONSE STUDY Summer 2012
F. COST EFFECTIVENESS OF ACT 129 DEMAND RESPONSE PROGRAMS
A central question of any ratepayer funded DSM program is whether the benefits of the program outweigh the costs of implementing the program. Act 129 programs are evaluated using a Total Resource Cost (TRC) test. The analysis presented in this section of the report examines whether the DR programs implemented by the Pennsylvania EDCs were cost effective as offered in 2012. Because this study will be used to inform whether DR goals are included in Phase III of Act 129, the SWE also used the DR impacts observed in 2012 as the basis for an exploration of the TRC ratios which could be expected from Act 129 DR programs in 2016 and beyond depending on the market conditions in place at that time. These market conditions and assumptions, or sensitivities, are introduced in Section F-2. The effect of these sensitivities on direct load control programs are explored in Section F-3 and the effects on load curtailment programs are presented in Section F-4. The survey results from Section E were used in the SWE analysis of EDC load curtailment programs so the resulting TRC ratios for these programs “as offered in 2012” will likely be lower than the ratios presented by the EDCs in their Program Year 4 Annual Reports.
1. METHODOLOGY, ASSUMPTIONS, AND DATA SOURCES
In order to assess the cost effectiveness of Act 129 DR programs, the SWE performed a TRC test for each program that was active during the summer of 2012. The TRC test accumulates the benefits and costs of a DR program and presents the results as a ratio (benefits/costs). A program with a TRC ratio greater than 1.0 is considered “cost-effective” because the benefits are greater than the costs. For the base case, the SWE used a single year evaluation of benefits and costs to estimate the TRC ratio. The table below shows the benefits and costs that are identified in the SWE analysis.
Table F-13: Benefits and Costs included in the SWE TRC Test
Benefits* CostsAvoided Cost of Generation Capacity Equipment & Installation
CostsAvoided Cost of Transmission and Distribution Capacity
Program Administrative CostsMarketing CostsEvaluation CostsIncentives Paid to Participants
* Possible benefits from wholesale price suppression were not quantified in this analysis, but are discussed in Section G
Two general types of programs were offered by the EDCs to meet their Act 129 demand reduction requirement in the summer of 2012: direct load control (DLC) programs and load curtailment programs. Direct load control programs involve installation of a controllable thermostat or a control switch on an air conditioning unit. The utility can then either remotely change the temperature
P r e p a r e d b y S t a t e w i d e E v a l u a ti o n T e a m43 | Page

ACT 129 DEMAND RESPONSE STUDY Summer 2012
set point on the thermostat or cycle the air conditioner on and off during control periods. Load curtailment programs rely on price or payment incentives for customers to respond to control events however they are able in order to reduce loads. In 2012 the Pennsylvania EDCs implemented a total of six residential direct control programs, one commercial direct control program, one critical peak rebate program, and eight commercial load curtailment programs.
For any given program, the peak demand reduction was estimated from information provided by the EDCs specific to their DR programs. For direct load control programs, the number of participants and the deemed or estimated kW savings per participant in each control hour were provided. For load curtailment programs, a separate load reduction estimate was provided for each participant for each hour during which they participated in the EDC program. The program’s peak demand reduction that was used in the benefit cost analysis is the average kW reduction across the EDC’s top 100 peak hours in 2012. The top 100 hours protocol has a profound impact on the benefit cost assessment because for any of the top 100 hours in which an EDC did not call a control event, a load reduction of 0 kW is averaged into the program savings estimate.
As described in Section E, the SWE designed an attribution survey and scoring methodology to determine the discounting of the Act 129 load reductions in certain hours to account for overlapping participation in PJM Emergency or Economic demand response events. Participation in the PJM DR programs requires a demand reduction of at least 50 kW, so individual residential customers did not participate in PJM events. It was assumed that 100% of residential load reductions and resulting benefits are attributable to the Act 129 programs. For commercial load curtailment programs, the reported load reductions were reduced by the Economic and Emergency Incremental Benefits Ratios (0.77 and 0.63, respectively) when customers participated in both an Act 129 event and a PJM event during the same hour.
Across all commercial programs, the total load reductions were reduced by an average of only 8.2%, with a range of 0% to 23%. Because an EDC’s top 100 hours were not necessarily aligned with periods of need for PJM dispatch, a number of Act 129 event hours produced no overlap with either PJM program. If EDCs had limited curtailment events to a smaller number of critical peak hours, then more overlap with PJM event hours would be expected and the percent reduction in benefits from load reduction would likely increase.
For direct load control programs in which an EDC makes an investment in equipment, it makes sense to analyze the program as a multi-year program. It typically takes several years to pay back the upfront investment made in equipment, and a DR program is valued as an offset to a peaking resource and should therefore be treated like a resource – a long-term capital investment. Therefore, for direct load control programs, the SWE ran a 10-year program scenario in which initial investments are made in equipment, and then ongoing benefits and ongoing costs (marketing, incentives, and administrative costs)
P r e p a r e d b y S t a t e w i d e E v a l u a ti o n T e a m44 | Page

ACT 129 DEMAND RESPONSE STUDY Summer 2012
are captured over 10 years. The multi-year analysis assumes an attrition rate of 3% of customers lost per year.
For future avoided generation capacity costs in the 10-year view of DLC, the Base Residual Auction results for PJM for 2013-2015 were available and were used. Beyond 2015, the growth rates in avoided capacity costs that the EDCs used in their own benefit cost models for energy efficiency programs were used. Avoided T&D costs and program administration costs were simply escalated at 3% per year, to represent costs escalating at or just above the expected rate of inflation40.
Line loss adjustment factors were provided by the EDCs, and varied significantly across the state. Assumed losses during the top 100 hours ranged from 4% to 22%. Line loss adjustment factors were used to gross up demand impacts calculated at the customer level to the impact at the system level.
The benefit/cost analyses presented in this report assumes that Act 129 DR programs are operated to provide a surrogate for capacity. Accordingly, the primary value used in the monetization of program benefits is the avoided cost of generation capacity. The base case avoided cost of generation capacity was based on zonal prices from PJM’s Base Residual Auction for the 2012/2013 delivery year. In 2012, capacity was relatively inexpensive across all of PJM, but especially for the western part of Pennsylvania, as shown in the table below.
40 The most recent Congressional Budget Office evaluation of the economy indicated expected inflation rates in the range of 2.0% to 2.5%. Woods & Poole Economics, Inc. has projected inflation at 3.0% per year over the next ten years.
P r e p a r e d b y S t a t e w i d e E v a l u a ti o n T e a m45 | Page

ACT 129 DEMAND RESPONSE STUDY Summer 2012
Table F-14: Assumed Avoided Cost of Generation Capacity – PJM Zonal Prices
EDC Avoided Cost ($/kW-Year)
Duquesne $6.11West Penn $6.11
Met Ed $48.69Penelec $48.69
Penn Power $48.69PECO $52.21PPL $48.69
Estimation of avoided transmission and distribution (“T&D”) costs is typically more difficult than estimating avoided generation costs. These costs are also very specific to each utility’s service territory and distribution system. Typically, avoided transmission costs would include the value of deferral of building growth-related transmission facilities (as opposed to facilities built for something other than growth, such as reliability) for a utility that owns and operates its own transmission system. For utilities that purchase transmission services, network transmission service charges may be the avoided cost to the extent demand reductions allow for reducing those charges. Likewise, utilities must identify how reductions in system peak demands would provide a benefit to the distribution system. Delayed construction of a new substation is a common example of distribution benefits produced by DR.
Because these costs are hard to identify, the SWE has used a base case value of $25/kW-year savings for avoided T&D costs. This avoided cost is simply the mid-point in the range of costs that were selected as the low and high case in the TRC sensitivity analysis and may overstate or understate the actual benefits for a given EDC.
Program costs were obtained from the EDCs. The costs include operating expenses for the EDC to run its programs, evaluation expenses, and money paid to CSPs or demand response aggregators. The incentives paid to customers were also obtained from the EDCs.
2. SENSITIVITY ANALYSIS
A single, historical benefit cost ratio from the 2012 DR season has limited value for making a decision about whether to continue DR in Phase III of Act 129. Therefore, the SWE conducted a sensitivity analysis to demonstrate how TRC results can change based on a variety of conditions and assumptions. After establishing the “base case”, or the benefit cost model of the programs as offered in 2012, the SWE modified a single assumption at a time to determine the relative impact of each of the sensitivities on the expected cost effectiveness of the programs. When analyzing each of the scenarios described below, all other assumptions are held at the base case level, so that only one assumption is changed in the benefit cost model. The SWE also developed “best case” and “worst case” scenarios to examine the highest and lowest possible
P r e p a r e d b y S t a t e w i d e E v a l u a ti o n T e a m46 | Page

ACT 129 DEMAND RESPONSE STUDY Summer 2012
TRC ratios that could be expected from DLC and load curtailment programs based on the various sensitivities. The base case results and results of various sensitivities are provided in Section F-3 for direct load control programs and Section F-4 for load curtailment programs.
a. Generation Cost VariationThe base case values for this sensitivity were shown in Table F-14. However, the avoided cost of generation capacity changes annually in PJM and can potentially vary significantly from year to year. In PJM’s zonal capacity prices for 2012 through 2015, prices range from $6.11 to $89.46. Therefore, to capture the potential for such a wide range of avoided generation capacity costs, the SWE conducted a sensitivity analysis with avoided capacity costs of $6 per kW-year and $90 per kW-year. As capacity tightens in a given region, prices would be expected to approach the high end of this range. As coal generation resources are retired in favor of natural gas turbines, the value of generation capacity will become increasingly dependent on the market price of natural gas and the capital cost of new natural gas units.
The impact of varying the avoided cost of generation capacity on program TRC ratios are presented for DLC programs in Figure F-10 and for load curtailment programs in Figure F-16.
b. T&D Cost VariationAs described earlier, estimating avoided T&D costs can be challenging. Some utilities, in order to develop a conservative TRC analysis, might assign no additional benefit for T&D savings. On the high end, it has been SWE’s experience that avoided T&D costs typically do not exceed $50 per kW-year. Therefore, the sensitivity analysis includes a base case of $25/kW-year, a low case of $0/kW-year and a high case of $50/kW-year.
The impact of varying the value of avoided transmission and distribution benefits are presented for DLC programs in Figure F-11 and for load curtailment in Figure F-17.
c. Reduced Incentive CostIncluding incentives as a cost in the TRC test makes an implicit assumption that the incentive represents the economic value the participant puts on the discomfort or qualitative costs they incur to participate in the program. Therefore, the incentive becomes a proxy for participant costs. The base case TRC analysis presented in the report considers 100% of customer incentives as program costs as directed by the 2011 TRC Order. In California, the standard practice is to use 75% of the incentives in the TRC test. Therefore, the SWE has run such a scenario to discount the amount of incentive cost included in the TRC costs. One source of uncertainty surrounding this sensitivity is the distribution of EDC incentive payments between CSPs and program participants. The SWE considered the entire incentive amount paid to CSPs subject to this sensitivity although CSPs are assumed to have retained a percentage of these payments in exchange for their services. This sensitivity has a much greater impact on the perceived cost effectiveness of load
P r e p a r e d b y S t a t e w i d e E v a l u a ti o n T e a m47 | Page

ACT 129 DEMAND RESPONSE STUDY Summer 2012
curtailment programs compared to DLC programs because incentives represent a much larger portion of the total program costs in load curtailment.
The impact of varying the percentage of customer incentives included as costs in the TRC ratio are shown for DLC programs in Figure F-12 and for load curtailment programs in Figure F-18.
d. Line Loss ValuesAs described above, the amount of transmission and distribution losses which occurs during the top 100 hours varies significantly across the state. The base case scenario considered by the SWE was to utilize the line loss adjustment factor provided by each EDC for their top 100 hours of 2012. The SWE also considered a low-case scenario of 4% and a high-case scenario of 25%. Losses are proportionate to load, so it is important to note that if the top 100 hours protocol is abandoned and a smaller subset of hours is used to assess peak demand reductions in future phases of Act 129, line loss factors would likely increase.
The impact of varying the line loss adjustment factor on TRC ratios are shown for DLC in Figure F-13 and for load curtailment in Figure F-19.
e. Full Load ReductionTo the extent that EDCs did not call direct load control events during each of the top 100 hours, the peak demand impact of the program is reduced because a 0 kW load reduction is averaged in for those hours. To better assess the value of the amount of load the utility has under control, the SWE team ran a scenario for direct load control programs that assigned the full potential load reduction available to the EDC. This full load is simply the avoided load per switch times the number of switches installed. This approach is consistent with how DLC programs are valued in other states and ISOs and how a DLC program would likely be administered in future phases of Act 129.
This sensitivity was only considered for direct load control programs and the estimated impact on a program’s TRC ratio is shown in Figure F-12.
f. Dual Enrollment The dual enrollment sensitivity was only considered for non-residential Act 129 programs. As part of the PJM Interconnection, Pennsylvania electric customers are eligible to participate as DR resources in the PJM capacity or energy markets. A significant number of commercial and industrial participants in Act 129 DR programs were also enrolled in the PJM markets in 2012. Section E of the report introduced the concept of an Incremental Benefits Ratio and presented the methodology that the SWE used to examine dual participation of DR resources in the Act 129 and PJM programs. Overlapping curtailment in Act 129 and PJM Emergency events was infrequent in 2012 because PJM Emergency Load Response activity was only initiated on July 18th. In the base case, the Emergency Incremental Benefits Ratio was applied only to Act 129 impacts that coincided with this event. The dual enrollment sensitivity applies the Emergency Incremental Benefits Ratio to all load reductions recorded by participants enrolled in the PJM Emergency Load Response Program.
P r e p a r e d b y S t a t e w i d e E v a l u a ti o n T e a m48 | Page

ACT 129 DEMAND RESPONSE STUDY Summer 2012
Approximately half of the statewide impacts from load curtailment programs in 2012 and participant survey responses indicated that Act 129 programs should be allocated 63% of the benefits when overlapping participation is observed. As a result, the statewide DR benefits were reduced by 16.7% in the dual enrollment case compared to 8.2% in the SWE base case. The estimated impact of this sensitivity on program TRC is presented in Figure F-20.
g. Best and Worst Case ScenariosThe best case scenario models the highest benefits assumptions and the lowest cost assumptions to produce the best case TRC ratio. The benefits include the high avoided generation capacity cost and the high avoided transmission and distribution capacity cost. The lowest costs were determined to be the lowest costs incurred by any one of the EDC’s programs on a per unit basis (per kW for load curtailment and per switch for direct load control). For the best case scenario, only 75% of the customer incentive amount is included as a program cost to be consistent with the California standard practice. California adopted this protocol under the assumption that the benefits to participants must be greater than the costs or else they would not participate. The SWE’s analysis determined that an Act 129 DLC program could produce a TRC ratio as high as 1.24 and an Act 129 load curtailment program could produce a TRC ratio as high as 4.80 with the right combination of market conditions and policy decisions.
The worst case scenario models the lowest benefits assumptions and the highest cost assumptions to produce a worst case TRC ratio. The benefits include the low avoided generation capacity cost and no avoided transmission and distribution capacity cost. The highest costs were determined to be the highest costs incurred by any one of the EDC’s programs on a per unit basis per kW for load curtailment and per switch for direct load control. The worst case scenario for DLC was a TRC ratio of 0.01 and the worst case for load curtailment was a TRC ratio of 0.02. Best and worst case scenarios for direct load control programs are presented in Figure F-14. Best and worst case scenarios for load curtailment programs are presented in Figure F-21.
The above described scenarios provide a range of TRC results to help demonstrate the sensitivity of the benefit cost ratios to various assumptions. The base case results and results of various sensitivities are provided in Section F-3 for direct load control programs and Section F-4 for load curtailment programs.
3. COST EFFECTIVENESS OF DIRECT LOAD CONTROL PROGRAMS
The SWE calculated base case TRC ratios for the seven direct load control programs (six residential and one commercial). Over 165,000 participants were enrolled in direct load control programs, and these programs delivered an average load reduction of 88 MW during the top 100 hours of 2012. Table F-15 provides the per-unit (switch or thermostat) demand impact achieved by the EDC DLC programs in 2012 when events were called. EDCs called curtailment events during approximately 40-60 of the top 100 hours and the average impact of these programs during the top 100 hours are also shown in Table F-
P r e p a r e d b y S t a t e w i d e E v a l u a ti o n T e a m49 | Page

ACT 129 DEMAND RESPONSE STUDY Summer 2012
15. The difference between these two values highlights the effect of the top 100 hours protocol on the achieved peak demand impact.
Table F-15: Per Unit Impacts from Act 129 DLC Programs at the Meter Level
EDC Program Per Unit Impact During Events (kW)
Average Per Unit Impact During the Top 100 Hours (kW)
PECO Residential Smart Saver 0.84 0.48PECO Commercial Smart Saver 0.69 0.35PPL Direct Load Control 0.59 0.41Duquesne Direct Load Control 0.76 0.29Met Ed IDER 0.73 0.40Penelec Direct Load Control 0.60 0.44Penn Power Direct Load Control 0.68 0.39
Using a single-year benefit/cost model, none of the programs were cost effective in 2012, with a combined program TRC ratio of 0.12. Individual EDC program TRC ratios ranged from 0.04 for Duquesne’s DLC program to 0.14 for PECO’s Residential Smart Saver program. Differences between program TRC ratios were driven primarily by the avoided cost of generation capacity in the EDC service territory and the number of top 100 hours during which the DLC population was dispatched. Notice in Table F-15 that the difference in the achieved load reduction during events is only slightly higher in the PECO program than the Duquesne program (0.84 kW compared to 0.76 kW). The average impact, however, during the top 100 hours is much greater (0.48 kW compared to 0.29 kW) because Duquesne called fewer events during the top 100 hours. The avoided cost of generation capacity was also much lower in the Duquesne service territory than in the PECO service territory. These differences were somewhat offset by the difference in customer incentives between the two programs. PECO paid participants $120 for participating in the summer 2012 DR season, while Duquesne paid $32.
Line loss adjustments accounted for 16.8% of the 88 MW impact from Act 129 DLC. Average benefits equaled $50.58 per kW for avoided generation capacity, or a total of $4.4 million. Benefits included an additional $2.2 million in avoided T&D benefits. These $6.6 million in benefits were attained against $57.1 million in program costs and incentives in 2012.
Programmatic investments for a DLC program are typically very front-loaded. Equipment purchases and installation fees account for the majority of program spending. Once this infrastructure is in place, the program’s expenses are customer incentives and administrative costs. The typical useful life of a direct load control switch is 8 to 10 years, so the SWE considered program cost-effectiveness over a 10-year life-time, with 3% customer attrition per year and escalation of benefits and ongoing program costs. The 10-year case nearly triples the value of the TRC ratio, from 0.12 to 0.33. However, DLC is still not a cost effective program when the other base case assumptions are held constant. For each of the remaining scenarios discussed in this section of the report, the 10-year program life is held constant.
P r e p a r e d b y S t a t e w i d e E v a l u a ti o n T e a m50 | Page

ACT 129 DEMAND RESPONSE STUDY Summer 2012
The Act 129 DLC programs remain below a 1.0 TRC ratio across the spectrum of avoided generation costs tested in the Generation Cost Variation sensitivity analysis. From the left to right in Figure F-10, the blue dots represent the low-case, base-case and high-case from the SWE sensitivity analysis. Given all other base case assumptions, the average avoided cost of generation capacity would have to be $233 per kW-year for DLC program benefits to outweigh costs. This is displayed as the “Break Even Price” in Figure F-10 and represents the avoided cost of generation capacity that would be needed to result in a TRC ratio of 1.0. Increases in generation capacity costs alone are unlikely be sufficiently high to produce reasonable TRC results for direct load control.
Figure F-10: Avoided Generation Cost Scenarios – All DLC Programs Combined
-
0.20
0.40
0.60
0.80
1.00
1.20
1.40
$- $20 $40 $60 $80 $100
TRC
Avoided Capacity Rate ($/kW-Year)
Break even price = $232.54
Figure F-11 shows that varying the avoided T&D benefits assigned to DR impacts has a marginal effect on program cost effectiveness. Even at the high case of $50/kW-year the estimated statewide TRC ratio fails to reach 0.5.
P r e p a r e d b y S t a t e w i d e E v a l u a ti o n T e a m51 | Page

ACT 129 DEMAND RESPONSE STUDY Summer 2012
Figure F-11: Avoided T&D Cost Scenarios – All DLC Programs Combined
-
0.20
0.40
0.60
0.80
1.00
1.20
1.40
$- $10 $20 $30 $40 $50 $60
TRC
Avoided T&D Rate ($/kW-Year)
Two additional scenarios that produce a more favorable statewide TRC ratio are the Reduced Incentive Cost and Full Load Reduction scenarios introduced in Sections 2c and 2e. The Full Load Reduction scenario takes the number of devices times the average kW savings per device as the program demand savings, as opposed to allowing the averaging effects of non-control top 100 hours to reduce the benefit. These values were compared for each program in Table F-15. The SWE believes that the full reduction case is the correct way to view a DLC program because the value of a DR program lies in an EDC having load under control if needed. As shown in Table F-15, both of these sensitivities improve TRC ratios, but neither adjustment in isolation produces a cost effective result. The 75% incentive protocol has a limited effect on the TRC ratio for DLC because a large share of program costs is equipment purchase and installation rather than customer incentives.
P r e p a r e d b y S t a t e w i d e E v a l u a ti o n T e a m52 | Page

ACT 129 DEMAND RESPONSE STUDY Summer 2012
Figure F-12: 75% Incentive and Full Load Reduction Cases – All DLC Programs Combined
-
0.20
0.40
0.60
0.80
1.00
1.20
1.40
Base 75% of Incentives Full Load Reduction
TRC
The results of the line loss factor sensitivity that was introduced in Section 2d are presented in Figure F-13. As with the other scenarios, the line loss assumption used to gross up customer savings at the meter to the system level have a small effect on the TRC ratios, but not enough in and of themselves to produce a cost effective direct load control program.
Figure F-13: Line Loss Factor Scenarios – All DLC Programs Combined
-
0.20
0.40
0.60
0.80
1.00
1.20
1.40
0% 5% 10% 15% 20% 25% 30%
TRC
Line Loss Percentage
The best case and worst case scenarios described in Section 2g are presented in Figure F-14 for EDC direct load control programs. These scenarios represent the full range of potential TRC ratios for the direct load control programs. TRC ratios could be as low as 0.01 and as high as 1.24. These programs can be cost
P r e p a r e d b y S t a t e w i d e E v a l u a ti o n T e a m53 | Page

ACT 129 DEMAND RESPONSE STUDY Summer 2012
effective over the full program life cycle with the right combination of market conditions, policy assumptions and implementation costs.
Figure F-14: Worst & Best Case Scenarios – All DLC Programs Combined
-
0.20
0.40
0.60
0.80
1.00
1.20
1.40
Worst Case Base Case Best Case
TRC
The DLC benefit cost scenarios presented thus far in this section have considered the entire life cycle of a program and whether the lifetime program benefits will surpass the lifetime program costs. The SWE believes that a somewhat different question will be raised in Pennsylvania given the capital investment the EDCs have made in direct load control equipment during Phase I of Act 129. EDCs can consider the Phase I investment in DLC equipment as a sunk cost, in that the cost has already been incurred in order to meet the requirements of the Act 129 mandate. Therefore, the question becomes – is it cost effective to continue a direct load control program given the investment in infrastructure which has been made to date? The decision to continue to operate a program, from a cost effectiveness perspective, becomes whether or not the utility can achieve a net benefit relative to ongoing program costs in future years. Assuming the avoided generation and T&D capacity costs are $75 and $25 per kW-year, respectively, the decision to continue to run a direct control program once the switches are paid for and installed is whether the incentives and administrative costs can be kept below $100 per kW per year. If so, the program would return a net benefit and can be continued in the future. Figure F-15 presents the situation graphically.
P r e p a r e d b y S t a t e w i d e E v a l u a ti o n T e a m54 | Page

ACT 129 DEMAND RESPONSE STUDY Summer 2012
Figure F-15: 10-Year Financials of a Direct Load Control Program
For reasons discussed previously, the program costs (blue line) were significantly higher than the program benefits (red line) in 2012. However, in each subsequent year of the program the program TRC ratio is substantially above 1.0. The SWE believes that, while it was likely not cost effective to implement the Act 129 direct load control programs in the inception years, or even over the full life cycle of the program, it may be cost effective to continue them.
An important consideration in whether or not an EDC continues, or restarts, a direct load control program in future phases of Act 129 is the resource acquisition strategy that was used during Phase I of Act 129. PECO opted to purchase and keep ownership of the load control equipment installed in its service territory. Consequently, PECO’s capital cost to continue its program would be relatively low compared to an EDC such as PPL who chose to lease its direct load control equipment from a CSP for the summer of 2012. For PPL, implementing DLC in a future phase of Act 129 would require much of the same high upfront costs that were experienced in 2012.
If the Commission makes a decision to continue a DLC program, the primary program expense would be customer incentives. It is the SWE’s assessment that DLC program incentives paid by the some of the Pennsylvania EDCs were higher than what is typically seen for a DR program not designed to meet mandated demand reduction requirements. It is likely that the higher incentive amounts were driven by the sheer number of possible curtailments needed to successfully reduce demand in 100 hours and the fact that EDCs were willing to spend more to ensure avoidance of penalties for not meeting the Act 129 mandate. Incentives that the EDCs paid in order to attract enough participation in their programs were also higher than is typical for such programs, due to the extensive number of hours of control in 2012 required to meet the Act 129 requirement. Table F-16 and Table F-17 provide a comparison of the Act 129 EDC incentives for direct load control of air conditioners versus programs of other utilities in PJM. Keep in mind, the other programs are designed for
P r e p a r e d b y S t a t e w i d e E v a l u a ti o n T e a m55 | Page

ACT 129 DEMAND RESPONSE STUDY Summer 2012
somewhere between 5-10 days of control for 3-4 hours at a time. These incentives exclude the fact that for some programs, the customer also receives a free programmable thermostat, which is a secondary incentive to enroll in the program.
P r e p a r e d b y S t a t e w i d e E v a l u a ti o n T e a m56 | Page

ACT 129 DEMAND RESPONSE STUDY Summer 2012
Table F-16: Incentive Structures for Act 129 Participants
EDC Incentive Structure Effective 1-Year Incentive
PPL, Duquesne $32 per year $32Penelec, Penn Power
$40 initial payment; $20 per year.
$60
Met-Ed $50 initial payment; $40 per year.
$90
PECO $30 per month for each summer month.
$120
Table F-17: Incentive Structures for Other PJM Utilities
Utility Incentive Structure Effective 1-Year Incentive
Atlantic City Electric Co.
$50 1-time payment; not recurring $50
Baltimore Gas & Electric
$50 upfront, $50/year for 5 years $100
Delmarva Power & Light $40 per year $40Dominion Virginia Power $40 per year $40
Duke Energy Ohio$5 minimum, plus incentive/
control hour based on market price
Cannot Estimate
Jersey Central Power & Light
$50 1-time payment; not recurring $50
Commonwealth Edison50% Cycling - $5 per month $20
100% Cycling - $10 per month $40
Public Service E&G Co.Option 1 - $50 1-time
payment $50Option 2 - $11 plus
$4/month $27
From a forward-looking cost effectiveness perspective, an EDC should offer a customer incentive on the lower end of the values shown in Table F-16 and Table F-17. Some participants will choose not to participate and the overall demand reduction achieved by the program will be reduced, but the cost-effectiveness of the program will be improved.
4. COST EFFECTIVENESS OF CUSTOMER LOAD CURTAILMENT PROGRAMS
The SWE calculated base case TRC ratios for nine customer load curtailment programs. Eight of these programs were non-residential programs and the ninth was the West Penn Power Critical Peak Rebate (CPR) program for residential customers. The SWE chose to include the CPR program in the load
P r e p a r e d b y S t a t e w i d e E v a l u a ti o n T e a m57 | Page

ACT 129 DEMAND RESPONSE STUDY Summer 2012
curtailment category because West Penn Power has no equipment installed in participants’ homes and the incentive structure is “pay for performance” rather than a fixed payment in exchange for EDC control over equipment operation.
Generally, the programs were not cost effective in 2012. Using the values of generation capacity that were in place in 2012 and without the inclusion of avoided transmission and distribution costs, none of the programs are cost effective and the highest estimated TRC ratio in the state belongs to the Penelec C&I Load Curtailment program with a TRC ratio of 0.70. Under the SWE base case scenario where a $25/kW-year benefit for avoided T&D costs is attributed to program demand reductions, seven of the nine programs post TRC ratios of less than 1.0. The two EDC programs that are cost effective, Penelec and Met-Ed are just so, posting TRC ratios of 1.06 and 1.01 respectively.
The combined statewide TRC ratio for customer load curtailment programs as offered in 2012 is 0.63. The programs delivered 518 MW of demand reduction attributable directly to Act 129 across the top 100 hours, with average line losses of 11.9%. Average benefits equaled $37.18 per kW for avoided generation capacity, or a total of $19.2 million. Benefits included an additional $13.0 million in avoided T&D benefits ($25 per kW-year). These $32.2 million in benefits were attained against $51.2 million in program costs and incentives.
When higher avoided cost values were considered in the Generation Cost sensitivity introduced in Section 2a, the programs become more cost effective. At an avoided cost of generation capacity value of $90 per kw-year, six of the nine EDC programs become cost effective and the statewide TRC ratio reaches 1.16. Estimated TRC ratios under this sensitivity are shown in Table F-18. Duquesne and West Penn Power’s programs are affected drastically by this sensitivity because the base case value of generation capacity in West market region of PJM was just $6.11 per kW-year during the summer of 2012.
Table F-18: Estimated TRC Ratio with $90/kW-year Avoided Cost of Generation Capacity and $25/kW-year Avoided T&D Benefits
EDC Program Estimated TRC Ratio
Duquesne Large Curtailable DR 3.03Penelec C&I Load Curtailment 1.66Met-Ed C&I Load Curtailment 1.57West Penn Power
Customer Load Response/Customer Resources DR
1.21
PPL Load Curtailment 1.16West Penn Power
Critical Peak Rebate 0.80
PECO Demand Response Aggregators 0.65PECO Distributed Energy Resources 0.47
Figure F-16 shows the statewide results of the Generation Cost sensitivity analysis. For the combined programs, the break-even avoided cost of
P r e p a r e d b y S t a t e w i d e E v a l u a ti o n T e a m58 | Page

ACT 129 DEMAND RESPONSE STUDY Summer 2012
generation capacity is $73.27 per kW-year assuming a $25 per kW-year avoided T&D benefit. This means that if the average avoided cost of generation capacity in the state were equal to $73.27 per kW-year, we would expect a statewide TRC ratio of 1.0 with all other base case assumptions held constant. If avoided T&D benefits were equal to $0 per kW-year, the break-even generation capacity price for load curtailment programs would equal $98.27 per kW-year.
Figure F-16: Avoided Generation Cost Scenarios – All Load Curtailment Programs Combined
-
0.20
0.40
0.60
0.80
1.00
1.20
1.40
$- $20 $40 $60 $80 $100
TRC
Avoided Capacity Rate ($/kW-Year)
Break even price = $73.27
Without the inclusion of avoided T&D costs, none of the Act 129 customer load curtailment programs are cost effective. The T&D cost sensitivity introduced in Section 2b and presented in Figure F-17 demonstrates that the TRC test is sensitive to this assumption, but not as sensitive as it is to the avoided cost of generation capacity. Unfortunately, the T&D avoided costs are the assumption that is most EDC-specific and the SWE has the least information available. Although the benefit cost ratio remains below 1.0 in the combined perspective across the entire range of T&D costs, 3 programs (PPL, Penn Power and Duquesne) that are not cost effective in the base case of $25/kW-year become cost effective in the high avoided T&D case of $50/kW-year.
P r e p a r e d b y S t a t e w i d e E v a l u a ti o n T e a m59 | Page

ACT 129 DEMAND RESPONSE STUDY Summer 2012
Figure F-17: Avoided T&D Cost Scenarios – All Load Curtailment Programs Combined
-
0.20
0.40
0.60
0.80
1.00
1.20
1.40
$- $10 $20 $30 $40 $50 $60
TRC
Avoided T&D Rate ($/kW-Year)
Adopting the California protocol of reducing the amount of incentive payment included in the TRC test to 75% from 100% increases program TRC ratios. Although the combined program perspective shows an overall TRC of less than 1.0 even with 75% of incentives, 5 of the 9 individual programs analyzed by the SWE were cost effective under this scenario. Figure F-18 presents the results of the Reduced Incentive Cost sensitivity that was introduced in Section 2c for Act 129 load curtailment programs.
Figure F-18: Recognition of 75% of Incentives as Participant Cost Scenario – All Load Curtailment Programs Combined
-
0.20
0.40
0.60
0.80
1.00
1.20
1.40
Base 75% of Incentives
TRC
P r e p a r e d b y S t a t e w i d e E v a l u a ti o n T e a m60 | Page

ACT 129 DEMAND RESPONSE STUDY Summer 2012
Finally, line loss assumptions do have an impact on the TRC test. However, the TRC is less sensitive to this assumption than the other assumptions introduced in Section F-2. A wide range in line losses have been assumed by the EDCs, so the SWE has modeled a broad spectrum of loss assumptions: 4% to 25% losses. For the combined programs, no reasonable loss scenario will produce a cost effective TRC ratio. However, the Penn Power and PPL Load Curtailment programs do become marginally cost effective under the high losses case. None of the EDC programs are cost effective under the low losses case.
Figure F-19: Line Loss Factor Scenarios – All Load Curtailment Programs Combined
0% 5% 10% 15% 20% 25% 30% -
0.20
0.40
0.60
0.80
1.00
1.20
1.40
Line Loss Percentage
TRC
Table F-19 and Figure F-20 examine the results of the Dual Enrollment sensitivity that was introduced in Section 2f. In the SWE base case scenario, Incremental Benefits Ratios were only applied when a customer actually curtailed load for both an Act 129 program and a PJM program during the same hour. This approach is fundamentally sound for a DR resource which is secured as a surrogate for energy, but an alternate interpretation must be considered given that the SWE analysis values DR impacts using an avoided cost of capacity. Electrical capacity is the ability to produce energy when needed. For a DR resource, this equates to a commitment to use less capacity than you are obligated to purchase, typically assessed via a Peak Load Contribution. One of the fundamental drawbacks of the implementation of Act 129 DR programs on top of the existing PJM framework is that there is a limited amount of load any given customer can reduce. If PJM has already secured capacity from a customer, EDC enrollment of that customer offers little to no value. However, it is possible that customer would not enroll in the PJM Emergency Load Response Program at all without the added revenue promised by the EDC programs. The surveys conducted with Act 129 program participants and discussed in Section E indicate that this was frequently the case in 2012.
P r e p a r e d b y S t a t e w i d e E v a l u a ti o n T e a m61 | Page

ACT 129 DEMAND RESPONSE STUDY Summer 2012
summarizes Act 129 load curtailment enrollment information that was submitted to the SWE. The expected load reduction for each customer was listed as well as the PJM markets the site was enrolled in. The figures shown in the table are independent of the number of hours that the site committed to curtail and very few sites actually curtailed for 100 hours so the demand impacts shown in Table F-19 will be higher than the reported impact of any of these programs over the top 100 hours. These values represent the load impact an EDC would expect to observe if every customer enrolled in its load curtailment program were dispatched during the same hour.
Table F-19: Proportion of Act 129 Load Reduction Commitments in PJM ELRP
EDC MW in PJM ELRP MW not in PJM ELRP Proportion of Act 129 MW in PJM ELRP
Duquesne 19.2 17.3 0.53Met-Ed 53.7 53.5 0.50Penelec 56.0 77.9 0.42Penn Power 26.4 15.1 0.64West Penn Power 134.2 63.1 0.68PECO 98.9 91.0 0.52PPL 78.2 64.8 0.55
Total 466.5 382.6 0.55
Notice that over half of the potential load reduction capacity in EDC load curtailment programs was also enrolled in the PJM ELRP in 2012. Applying the Emergency Incremental Benefits Ratio of 0.63 to all load reductions recorded by these customers produces a less favorable TRC ratio for the programs. Figure F-20 compares the statewide TRC ratio under the dual participation case to the base case scenario. The statewide TRC ratio drops from 0.63 to 0.54 and the Met-Ed and Penelec load curtailment program TRC ratios drop below 1.0.
P r e p a r e d b y S t a t e w i d e E v a l u a ti o n T e a m62 | Page

ACT 129 DEMAND RESPONSE STUDY Summer 2012
Figure F-20: Dual Participation Interpretation Sensitivity
0
0.2
0.4
0.6
0.8
1
1.2
1.4
TRC
Base Dual Participation
The best and worse case scenarios described in Section 2g are presented in Figure F-12. These scenarios represent the full range of potential TRC ratios for the load curtailment programs. TRC ratios could be as low as 0.02 and as high as 4.80. With the higher avoided costs, and with controlling costs including incentives, the programs can be very cost effective.
Figure F-21: Worst & Best Case Scenarios – All Load Curtailment Programs Combined
-
1.00
2.00
3.00
4.00
5.00
6.00
Worst Case Base Case Best Case
TRC
The tables and figures presented in this section indicate that EDC load curtailment programs could likely achieve TRC ratios greater than 1.0 given some changes to program design and favorable market conditions. However, EDCs securing capacity outside of the PJM’s competitive market could prevent
P r e p a r e d b y S t a t e w i d e E v a l u a ti o n T e a m63 | Page

ACT 129 DEMAND RESPONSE STUDY Summer 2012
DR from realizing its full potential in the region. When a kW of demand response clears in a PJM capacity auction, one fewer kW of generation is secured to meet the region’s electric needs and downward pressure is exerted on the wholesale price of capacity. This immediate feedback is missing from an Act 129 program. If an EDC acquires a DR resource and dispatches it, the capacity requirements for the zone may eventually be reduced, but in the short-term the capacity to serve that load will still be acquired. This challenge can be avoided for a residential DLC program if an EDC bids the program into the PJM Base Residual Auction and receives payment for the avoided generation capacity.
P r e p a r e d b y S t a t e w i d e E v a l u a ti o n T e a m64 | Page
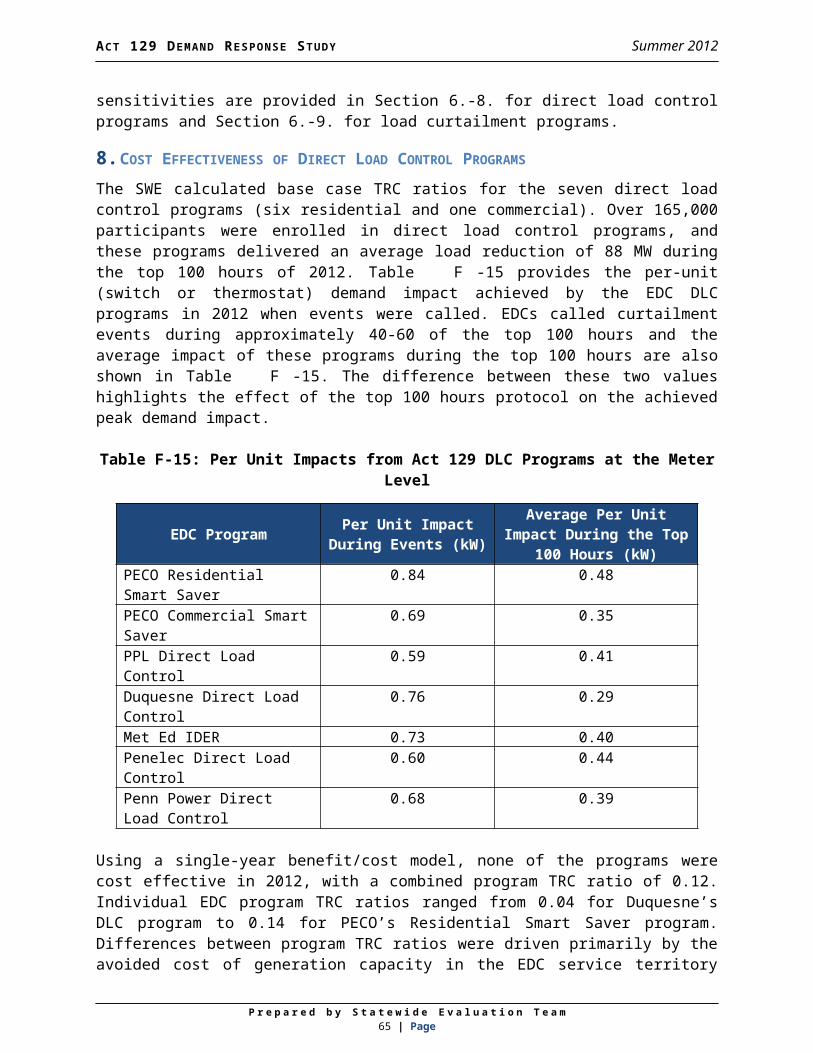
ACT 129 DEMAND RESPONSE STUDY Summer 2012
G. WHOLESALE PRICE SUPPRESSION BENEFITSAs described in Section F, the SWE has modeled demand response benefits pertaining to avoided generation, transmission, and distribution capacity costs. The SWE analysis did not attempt to quantify benefits associated with wholesale energy price (LMP) or capacity price suppression that result from DR. Although the SWE agrees that there are likely to be at least short-term benefits in the reduction of energy prices because of demand response, our analysis has excluded these impacts for several reasons. This section of the report will describe wholesale price suppression and then review the reasons the SWE feels inclusion of these benefits would not materially impact the benefit cost assessment as presented in Section F.
1. OVERVIEW OF WHOLESALE PRICE SUPPRESSION
As described in Section D, Pennsylvania LMPs vary with zonal demands and the cost of resources dispatched to meet those demands. As demand for energy increases, higher-priced generation resources are brought online to meet that demand. Typically in peaking conditions, the resources running are natural-gas fired combined cycle or combustion turbine units that can come online quickly but operate at high cost. The LMP inflates to reflect the fact that demand is beginning to constrain the available resources. Section B examined how the dispatch of DR resources during these high priced hours can have a positive effect on zonal energy prices. This suppression of wholesale energy prices creates a benefit for both the load being curtailed (avoiding high energy prices) and for non-curtailment loads (paying a reduced LMP because of demand response). The figure below demonstrates the concept. The total demand before load curtailment is shown by point Q1, which has a price of P1. With load curtailment during this high price hour, the demand is reduced to point Q2, which has an impact on prices reducing the LMP to P2.
Figure G-G-22: Wholesale Price Suppression
0
100
200
300
400
500
600
60000 80000 100000 120000 140000 160000 180000
Mar
ket S
pot P
rice
Demand
Q1Q2
P1
P2
P r e p a r e d b y S t a t e w i d e E v a l u a ti o n T e a m65 | Page

ACT 129 DEMAND RESPONSE STUDY Summer 2012
In 2007, The Brattle Group conducted a study to quantify the price suppression effects of DR in PJM41, using 2005 as a test year. Their study concluded that a 3% reduction in each zone’s “super-peak load” (the top 120-150 hours’ loads) yields an energy market price reduction of $8-$25 per MWh (5%-8%). They also identified both avoided energy and capacity benefits for DR participants at that level of demand reduction. The study estimated a $73 million benefit for avoided capacity costs and between $9 and $26 million for avoided energy costs. These benefits were estimated for demand reductions of 1,000 to 1,120 MW across five PJM zones.
2. SWE EXCLUSION OF PRICE SUPPRESSION BENEFITS
Although the SWE agrees with the premise that DR can help suppress wholesale prices and that resources should be dispatched when they have the greatest likelihood of having a positive economic impact, we did not explicitly include such benefits in the TRC analysis presented in Section F. The reasons for excluding this possible benefits stream are outlined below.
The SWE does not have the necessary data available to estimate the price suppression impacts for 2012. This analysis would require access to resource offerings which cleared as well as those that did not for each of the zones in the Commonwealth during the summer of 2012 so that a supply curve like the one shown in Figure G-G-22 could be modeled. Resource offerings which were not ultimately dispatched are necessary because price suppression analysis requires an estimate of what wholesale prices would have been at the zonal load which would have been observed in the absence of Act 129 DR programs.
Price suppression benefits are also achieved by energy efficiency measures which reduce equipment consumption during periods of peak demand. These benefits are not currently accounted for in the TRC test for energy efficiency programs in Pennsylvania. Since Act 129 has a fixed budget cap, every dollar spent on DR is a dollar that is not spent on EE. Considering wholesale price suppression benefits for DR and not EE could lead to a situation where Act 129 budgets are allocated funding for DR when energy efficiency is actually the more beneficial investment.
Use of the 2007 Brattle Group estimates would be inappropriate because their analysis was based on 2005 prices, and wholesale prices have declined significantly since 2005.
The Brattle Group study estimated the impacts for 1,000+ MW of DR curtailments across the PECO, BGE, Delmarva, PEPCO and PSEG zones. During the summer of 2012, Act 129 programs achieved approximately 600 MW of impact across top 100 hours of system demand across a different series of zones with only PECO zone included in both groups.
The SWE is of the opinion that DR should be treated as capacity-type resources, meaning avoided capacity costs are the primary avoided
41 The Brattle Group. Quantifying Demand Response Benefits in PJM. January 29, 2007.
P r e p a r e d b y S t a t e w i d e E v a l u a ti o n T e a m66 | Page

ACT 129 DEMAND RESPONSE STUDY Summer 2012
benefit of DR. This type of resource will operate fewer hours per year than an economic resource designed to affect market prices.
The mechanism by which reduced wholesale energy prices (LMPs) translate into benefits for DR non-participant ratepayers is unclear. One school of thought within the industry is that a short-term reduction in LMP actually benefits suppliers rather than ratepayers and benefits to electric generators are not considered in the TRC test.
DR participants enjoy an energy benefit from DR related to the avoidance of LMPs. However, the benefit is offset by recovery of energy in non-control hours. For many direct control applications (such as air conditioner control), some portion of the energy avoided during control is consumed in the one or two hours after the appliance is released. With voluntary curtailment programs, many customers may consume more energy just before and/or after a control event so that they can better reduce loads during control hours. For example, a beer distributor may precool his stock prior to an event so that he can change the refrigerator set point to save energy during the control hours. Therefore, the energy benefit of DR is the net effect of the additional energy consumed during pre- and post-event recovery and the energy savings during control hours42. The SWE does not have sufficient information or research about energy recovery on event days in the Act 129 programs to estimate the net energy savings for these programs.
The Brattle Group qualified its findings by stating that in the long-term, the benefits of energy price suppression would likely be offset by increasing capacity costs: “a reduction in energy margins must be expected to be offset by increases in capacity payments in the long run, assuming competitive market equilibrium. Again, these ‘long-term’ offsets may occur fairly quickly if expectations for reduced energy margins work their way quickly into bids for providing capacity”.43 Therefore, the long-term view, which is appropriate for analysis of Phase III demand response, would likely include capacity prices that have incorporated these energy price suppression impacts.
The National Action Plan on Demand Response44 notes that “If wholesale market price suppression effects are included in demand response cost-effectiveness evaluations, it is very important that they be properly estimated.” Given the challenges listed above, the SWE believes that including estimates of wholesale price suppression benefits in this study would have been 42 Indeed, the Brattle Group makes it clear in their report that these effects would also impact non-curtailing customers because prices in non-event hours on event days would actually be slightly higher because of such recovery of energy. However, they were unable to estimate these impacts in their analysis.43 The Brattle Group. Quantifying Demand Response Benefits in PJM. January 29, 2007. Page 29.44 http://www.synapse-energy.com/Downloads/SynapseReport.2013-02.LBL.DR-Cost-Effectiveness.11-106A.pdf
P r e p a r e d b y S t a t e w i d e E v a l u a ti o n T e a m67 | Page

ACT 129 DEMAND RESPONSE STUDY Summer 2012
inappropriate. Significant additional research focused on reconstructing the supply curves in each EDC zone is needed in order to properly assess whole price suppression benefits from both energy efficiency and demand response. The SWE will work with Commission staff to identify the need, timing, and scope of any continued research.
P r e p a r e d b y S t a t e w i d e E v a l u a ti o n T e a m68 | Page

ACT 129 DEMAND RESPONSE STUDY Summer 2012
H. FINDINGS AND RECOMMENDATIONSThe SWE has developed the following findings and recommendations based on a detailed review of the 2012 DR performance period, research into DR protocols in other jurisdictions, and consideration of market conditions in the Commonwealth of Pennsylvania. These findings and recommendations build upon the conclusions presented in the interim version of this study.
Act 129 demand response programs were not cost effective in 2012. However, the SWE does not believe that this finding automatically means that DR should not be included in future phases of Act 129.
Act 129 demand reduction targets in Pennsylvania are more aggressive than the other states examined in this report. Table C-3 shows that the other states surveyed have less ambitious demand reduction targets.
Most energy efficiency measures produce peak demand reductions that are comparable to the energy savings they achieve. Because the Act 129 peak demand reduction target was greater than the energy reduction target, each of the seven Pennsylvania EDCs have chosen to offer multiple dispatchable DR programs in 2012 in an effort to meet the mandated demand reduction goals. Approximately 2.5% of the 4.5% peak demand reduction goal established by Act 129 will be achieved through the coincident peak demand reduction produced by energy efficiency measures45, effectively presenting a 2.0% DR goal to be achieved in a single summer.
Aggressive reduction targets appear to have contributed to the poor benefit/cost ratios observed across the state in 2012. The punitive nature of the Act 129 legislation limited the discretion EDCs could afford to use and led to EDCs “overpaying” for DR resources to ensure the 4.5% peak demand reduction was met.
Meeting Act 129’s demand reduction target for the 100 hours of highest demand requires EDCs to predict when the highest 100 hours will occur over the course of the summer season. These predictive difficulties are less common for DR programs in the other states and in the ISOs examined, where DR programs are used only when necessary based on reliability triggers or market pricing conditions. The SWE recommends the top 100 hour definition be discontinued.
Act 129 prescribes penalties for non-compliance with aggressive peak demand reduction goals;46 EDCs therefore are more likely to rely on dispatchable DR programs to achieve the mandated peak demand reductions. Of the various dispatchable DR program types described in Table B-2, DLC and interruptible/curtailable programs are predominately employed by the EDCs in Pennsylvania. Less aggressive goals and penalties and the proliferation of Advanced Metering Infrastructure
45 Act 129 requires a 3.0% energy reduction be achieved by May 31, 201346 66 Pa. C.S. 2806.1(f) (2).
P r e p a r e d b y S t a t e w i d e E v a l u a ti o n T e a m69 | Page

ACT 129 DEMAND RESPONSE STUDY Summer 2012
(AMI) may promote more non-dispatchable DR programs in Pennsylvania which use pricing signals to stimulate peak demand reduction.
The treatment of DR incentive payments varies between the states examined in this report. California, New York, and Pennsylvania treat DR incentive payments by EDCs to DR program participants as proxies for participant costs in the TRC calculations. While Pennsylvania and New York include the entire incentive payment as the proxy for participant costs, California includes 75% of the incentive payment as a proxy for participant costs because it assumes that a customer will only participate in DR if the benefit is greater than the costs to participate. Adoption of this protocol will increase the perceived cost effectiveness of a program by 5% to 30% depending on the proportion of program costs attributable to customer incentives. Section F showed that this protocol has a greater impact on load curtailment programs because customer incentives represent a dominant share of program costs.
California and Illinois treat ISO payments to EDCs as a benefit in their respective TRC test calculations when the payments are direct revenue received for bidding retail DR into the wholesale market. The SWE believes that this is the most beneficial mechanism for the continuation of EDC direct load control programs. Rather than calculating an avoided cost of capacity, an EDC which bids its DLC program into the PJM forward capacity auction can include direct revenue in its benefit/cost calculations. Bidding DLC into PJM can reduce the capacity needs of the region that must be secured through generation and can exert downward pressure on wholesale capacity prices.
Residential customers are effectively unable to go to market in the PJM DR programs without aggregation by an EDC within a DLC program. The SWE believes there is value in EDCs acting in this role for the residential sector that does not exist for the C&I sector because those customers are able to participate in the PJM markets without EDC intervention.
A historical analysis of energy prices (LMPs) and capacity prices in Pennsylvania indicate that DR programs are less cost effective for EDCs in the western part of the state than those in the eastern part of the state. In New York, the NY Public Service Commission (NYPSC) determined that DR programs are most practical and economical in the New York City metropolitan area and only established DR goals in the Con Edison service territory. The SWE recommends that the decision to include DR targets in future phases of Act 129 be made at the EDC level rather than on a statewide basis.
Capacity prices play a significant role in the cost effectiveness of DR and can vary from year to year. The decision whether or not to include DR targets in future phases of Act 129 should be dependent on the direction of capacity prices in the region. Based on the program expenditures and
P r e p a r e d b y S t a t e w i d e E v a l u a ti o n T e a m70 | Page

ACT 129 DEMAND RESPONSE STUDY Summer 2012
impacts observed during the 2012 performance period, the avoided cost of generation capacity will need to be in excess of $70-$80 per kW-year to justify continuation of Act 129 DR programs. The SWE recommends that the Commission pay careful attention to the results of the PJM Base Residual Auction for the 2016/2017 delivery year that will be held in May 2013.
Avoided transmission and distribution (T&D) benefits are a major source of uncertainty in the benefit/cost analysis of demand response. Additional research is needed by the Pennsylvania EDCs to quantify these benefits. The benefit/cost analysis presented in Section F considers low, medium and high cases of $0, $25 and $50 per kW-year, respectively, for the monetization of transmission and distribution benefits. Without the inclusion of some T&D benefits, the SWE believes that Act 129 DR programs are unlikely to pass a TRC test.
Additional research is needed to estimate the possible benefits from wholesale price suppression. These benefits are not currently considered for Act 129 energy efficiency programs and were not quantified in the benefit/cost analysis presented in this study. Estimates of price suppression benefits from peak-shaving will allow for a more accurate assessment and comparison of demand response and energy efficiency potential and should be included in a demand response potential study. The SWE will work with Commission staff to identify the need, timing, and scope of any continued research.
The value of DR is correlated with the cost of the generation resources it is competing against. The Energy Information Administration estimates the overnight construction cost of an advanced Combustion Turbine to be $666 per kW in its 2012 Annual Energy Outlook. The SWE recommends the Commission consider the costs of generation capacity that can be avoided through demand response. Given the relatively low upfront cost of construction of a new CT, its lengthy measure life, and the cost and availability of fuel, demand response programs will have to be operated very efficiently to provide a cost effective alternative to generation.
Act 129 commercial and industrial load curtailment programs face significant challenges because of the thriving PJM DR markets available to these customers. A significant portion of the participants in Act 129 commercial and industrial programs are also enrolled as capacity resources in the PJM Emergency Load Response Program. Engaging these participants in Act 129 DR programs does not offer additional capacity into the system. When EDCs secure DR resources that are not committed in the PJM program, the capacity needs of the region are not adjusted accordingly so the benefits to wholesale capacity prices are not realized. The SWE urges the Commission to be very cautious about establishing any goals for C&I DR programs. If goals are established, we
P r e p a r e d b y S t a t e w i d e E v a l u a ti o n T e a m71 | Page

ACT 129 DEMAND RESPONSE STUDY Summer 2012
recommend carefully considering how Act 129 can offer incremental value to the competitive markets already in place.
Although direct load control programs did not prove to be cost effective in 2012, there is indication that the programs could offer value in future phases of Act 129. Equipment purchase, customer recruiting and installation costs result in high upfront costs for DLC programs. The SWE recommends the Commission view the Phase I infrastructure costs of these programs as “sunk” and consider continuing the programs if future benefits are expected to outweigh the future costs. If DLC programs are continued, the SWE believes that they should be bid into the PJM capacity market and the revenue received should count as a benefit in the TRC test.
Basing demand reduction targets on the highest 100 hours of peak demand is unique to Pennsylvania and should be discontinued because it leads to DR resources being called during hours during which they are not likely to be cost effective. If a DR target is established for an EDC in Phase III, resources should only be dispatched when they are needed for reliability or are likely to be cost effective. These conditions were explored in Section D and labeled as the DR “green” and “red” zones.
Precisely estimating the number of hours during which DR is likely to be cost-effective or needed for reliability is challenging because of the variation observed in Pennsylvania from year to year due to weather and economic conditions. Consequently, the SWE recommends that any future DR targets be crafted such that the compliance metric is the average load reduction observed over a subset of hours during which DR is likely to provide a cost-effective alternative to generation rather than a fixed number of hours.
The optimal number of MW to acquire and dispatch in each EDC service territory should be determined through a demand response potential study. Estimates of wholesale price suppression benefits and the amount of load reduction that can be achieved with less aggressive EDC spending will be important components of this assessment.
The SWE’s recommendation of a DR target based on a variable number of hours poses an important question for the Commission. How should the hours during which DR is likely to be cost-effective be identified? The SWE believes that there are two viable mechanisms by which these hours could be identified.
One possible approach is to consider any hour during which the real-time LMP for an EDC zone is above a certain threshold ($200 to $250 per MWh) to be a DR compliance hour. LMPs are estimated a day in advance and calculated at five-minute intervals based on actual grid
P r e p a r e d b y S t a t e w i d e E v a l u a ti o n T e a m72 | Page

ACT 129 DEMAND RESPONSE STUDY Summer 2012
operating conditions and posted on PJM’s website47. Compliance with DR targets should then be assessed only over the hours that meet this criterion. The actual number of compliance hours could be 5 in a cool summer or 50 in a very hot summer. This methodology would also address differences in peak energy prices between EDCs. Another advantage of this approach is that it allows EDCs to respond to generation shortfalls (the DR “red zone”) as well high demand (the DR “green zone”) explained in Section D of this report. A drawback of this approach is that it requires EDCs to forecast whether LMPs will reach the trigger point on a given day and dispatch DR resources accordingly. A forecasting error could result in resources being dispatched during an hour which will not ultimately be used to assess compliance, or in not dispatching resources during a compliance hour. There is also a potential inability of air-conditioning based load reductions such as DLC to respond to the “red zone” if outdoor temperatures are low.
An alternative approach to establish DR compliance hours would be to compare the EDC day-ahead forecasts with the EDC annual peak load forecasts. If the day-ahead forecast is above a certain threshold (97%-99%) of the summer peak demand forecast48, DR resources should be called for a logical subset of hours, such as 2:00 pm to 5:00 pm or 3:00 pm to 6:00 pm. This methodology would typically produce a different number of compliance hours between EDCs and the total number of hours over which DR is evaluated would be highly correlated to the weather conditions in the performance period. The advantage of this methodology is that it provides the EDCs and their customers sufficient advance notice of when curtailment activities will be needed. Secondly, it eliminates the possibility of EDC’s purchasing DR resources that do not ultimately count towards the compliance target. The drawback of this methodology is that it only accounts for the DR “green zone” and does not address the DR “red zone” explained in Section D of this report. The historical analysis of LMPs explained in Section D has shown that market energy prices in Pennsylvania and the need for curtailment is often highest when load is moderately high and large generators go offline unexpectedly.
It is important to recognize that there is a possibility that neither of the two options recommended by the SWE would result in an EDC reaching the 47 Real-time LMPs are available on the PJM Operational Data page at: http://oasis.pjm.com/system.htm48 PJM produces an annual load forecast report that projects the summer peak demand (MW) that will be observed in load zones across the interconnection. The 2013 report can be found at https://www.pjm.com/~/media/documents/reports/2013-load-forecast-report.ashx
P r e p a r e d b y S t a t e w i d e E v a l u a ti o n T e a m73 | Page

ACT 129 DEMAND RESPONSE STUDY Summer 2012
threshold for calling DR resources during an abnormally cool summer. If this situation were to arise, the SWE recommends that a test event be called to measure compliance for dispatchable resources available to reduce load. A one to two-hour event late in the end of the DR season would provide a reasonable estimate of the amount of curtailable load the EDC program is able to acquire. The results from weather-dependent programs, such as DLC, would need to be adjusted because temperatures during a late-summer test event would be cooler than on a true peak summer day and the observed load reductions would be smaller.
I. ADDENDUM – PRELIMINARY WHOLESALE PRICE SUPPRESSION AND PROSPECTIVE TRC ANALYSIS
The Statewide Evaluation (SWE) Team completed the Demand Response Study report presented within at the direction of the PA PUC49 to evaluate the cost effectiveness of the Act 129 demand response programs implemented during the summer of 2012 and inform the Commission’s decisions about whether future phases of Act 129 should include peak demand reduction or demand response goals. As discussed in Section G, the SWE recognized during the execution of the study that the inclusion of benefits from wholesale capacity and energy price suppression had the potential to significantly impact the observed cost-effectiveness50 ratios of Act 129 demand response and energy efficiency programs. This addendum presents preliminary estimates of the magnitude of these benefits and the effect their inclusion would have on benefit cost ratios. The input data for this analysis was supplied by PJM in the form of a sensitivity analysis around the results of the Base Residual Auction for the 2016/2017 delivery year. The work was performed for the Organization of PJM States Inc. (OPSI). Additional Act 129 spending and impact data was collected by the SWE Team to supplement the data set. The estimates presented are approximations intended to provide Commission Staff with a rough estimate of the magnitude of wholesale price suppression effects. If such effects are to be included in the TRC test moving forward a fundamentals-based modeling study would be needed to develop more accurate estimates of these benefits.
In May of 2013, PJM conducted the Base Residual Auction for the 2016/2017 delivery year to secure capacity for the region for June 1, 2016 through May 31, 2017. The capacity needs for the 2016/2017 delivery year were determined using the 5 coincident peak (5CP) weather normalized loads from 2012, zonal load forecasts and various economic growth indicators. Table I-20 shows the dates and times when the 5CP hours occurred in 2012.
Table I-20: Summer 2012 RTO Coincident Peaks (5CP)
Day Date Hour Ending (EPT) MWTuesday 7/17/2012 17:00 156,339
Wednesday 7/18/2012 15:00 153,647
49 Pennsylvania Public Utility Commission, Energy Efficiency and Conservation Program Secretarial Letter, served March 4, 2011, at Docket No. M-2008-2069887.
50 The TRC test is the cost-effectiveness metric of choice in Pennsylvania.
P r e p a r e d b y S t a t e w i d e E v a l u a ti o n T e a m74 | Page

ACT 129 DEMAND RESPONSE STUDY Summer 2012
Friday 7/6/2012 17:00 153,173
Thursday 7/5/2012 16:00 149,707
Monday 7/16/2012 17:00 148,896
Act 129 energy efficiency and demand response programs reduced both the observed 5CP loads in 2012 and the zonal forecast because Pennsylvania customers used less energy during peak summer hours in 2012 than they would have in the absence of the programs. Because energy efficiency measures reduce the coincident peak demand of equipment operation for up to 15 years, energy efficiency measures have an effect on the load forecast for many delivery years51. Demand Response (DR) measures, on the other hand, have a one-time single year effect on the load in the year DR resources are called. The clearing price for capacity for each zone is determined by supply and demand economics, so it follows that the reduced number of MWs required in the region because of Act 129 EE&C programs exerted downward pressure on resource clearing prices and lowered capacity costs for all load in Act 129 affected zones. This benefit from energy efficiency and demand response programs is often overlooked because of the challenges associated with quantifying the effects.
Table I-21 shows the peak demand reduction that was achieved by each of the seven EDCs during Phase I of Act 129 and the total TRC cost to achieve these impacts. These costs include program administration costs and participant costs, but exclude incentives because incentives cancel out of the TRC52, as the cost to the EDC is equal to the benefit to the customer.
Table I-21: Act 129 Impacts and Costs (Energy Efficiency & Demand Response)
EDC PJM LDA Phase I Total Demand Reduction (MW-year) Phase I TRC Cost53
PECO EMAAC 457 $392,333,333
PPL MAAC 374 $477,266,667
West Penn Power RTO54 196 $102,833,333
Duquesne RTO55 152 $88,520,000
51 Energy efficiency has a long-term effect compared to the Phase I demand response programs, which reduced the observed load in 2012, but will likely have no lasting impact on the observed loads in future years, unless DR resources are called in future phases of Act 129.52 For demand response programs customer incentives are considered to be a proxy for the participant cost, or sacrifice made by the customer to curtail load. Consequently, customer incentives are included as a cost in the TRC calculation for DR programs.53 The Phase I total TRC Costs were estimated using the EDC implementation costs through the end of PY4 and the participant costs through PY3 extrapolated to include PY4. For DR programs, customer incentives are included as a proxy for the participant cost.54 West Penn Power is part of the APS load zone which did not clear separately from the RTO in the 2016/2017 Base Residual Auction55 Duquesne Light is the DUQ load zone which did not clear separately from the RTO in the 2016/2017 Base Residual Auction
P r e p a r e d b y S t a t e w i d e E v a l u a ti o n T e a m75 | Page
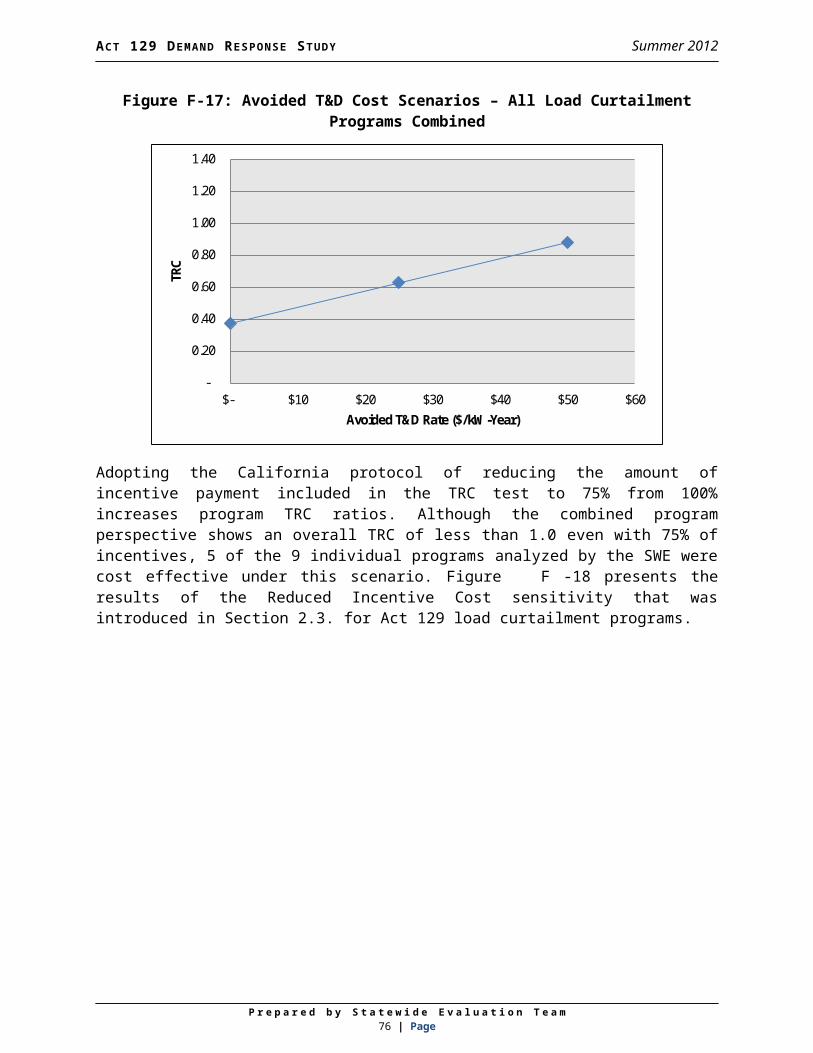
ACT 129 DEMAND RESPONSE STUDY Summer 2012
Met-Ed MAAC 130 $145,616,000
Penelec MAAC 108 $132,344,333
Penn Power ATSI 45 $36,086,333
Totals 1462 $1,375,000,000
The sensitivity analysis conducted by PJM included a number of different scenarios where the capacity supply in various Locational Deliverability Areas (LDAs) was increased or decreased. The result is a change in the Resource Clearing Price for capacity in the LDA. Because an increase in supply produces roughly the same effect as a decrease in demand, these sensitivities are believed to be a reasonable proxy for a change in demand in the region.
In the actual Base Residual Auction for the 2016/2017 delivery year, a total of 66,546 MW of capacity cleared in the MAAC Locational Deliverability Area56. The clearing price for the Annual product was $119.13/MW-day or $43,482.45/MW-year. Figure I-23 shows what the PJM sensitivity analysis presumes the clearing price would have been if the needs of the zone had been higher or lower. Table I-21 shows that the Act 129 energy efficiency and DR programs in Phase I by Met-Ed, PPL and Penelec reduced peak demand in the MAAC by 612 MW. Figure I-23 shows that the clearing price in the MAAC zone would have been approximately $129.49/MW-day if 612 MW had not been reduced by Act 129. By approximating the supply curve mathematically, the SWE was able to develop an estimate of savings to ratepayers, induced by the suppression of wholesale capacity prices.
56 A large portion of the MAAC footprint is not in Pennsylvania
P r e p a r e d b y S t a t e w i d e E v a l u a ti o n T e a m76 | Page

ACT 129 DEMAND RESPONSE STUDY Summer 2012
Figure I-23: 2017/2017 Supply Curve for the MAAC LDA
For purposes of this preliminary analysis a simple linear regression was used to determine the slope of the supply curve in the area of interest. The dark blue line in Figure I-24 is an approximation of the supply curve. . The slope of the supply curve is the expected change in the clearing price ($/MW-day) for a unit change in demand (MW).
P r e p a r e d b y S t a t e w i d e E v a l u a ti o n T e a m77 | Page
Actual BRA Results

ACT 129 DEMAND RESPONSE STUDY Summer 2012
Figure I-24: Regression Output for EMAAC LDA
Table I-22 shows the slope for each LDA relevant to Pennsylvania and the expected clearing price if none of the MWs reduced by Act 129 EE and DR had been achieved.
Table I-22: Estimated Clearing Prices in the Absence of Act 129
Zone BRA Clearing Price Act 129 MW Reduction Slope of Supply Curve Clearing Price
(without Act 129)EMAAC $119.13 457 0.0338 $134.56MAAC $119.13 612 0.0169 $129.49RTO $59.37 348 0.00948 $62.67ATSI $114.23 45 0.0153 $114.92
Using the values presented in Table I-22 and the amount of capacity cleared in the BRA for each LDA an estimate of the price suppression benefit to ratepayers was developed by the SWE. The calculation is illustrated below for the MAAC zone:
Price Suppression Estimate ( MAAC )=Total MW cleared∈MAAC∗(Clearing Price without Act 129−Actual Clearing Price )∗Number of Days∈aYear
Price Suppression Estimate=66,546MW∗($ 129.49−$119.13)∗365
Price Suppression Estimate≅ $252million
Table I-23 summarizes the estimated price suppression benefits produced by Act 129 for the MAAC, EMAAC, ATSI, and RTO Location Deliverability Areas.
P r e p a r e d b y S t a t e w i d e E v a l u a ti o n T e a m78 | Page

ACT 129 DEMAND RESPONSE STUDY Summer 2012
Table I-23: Estimates of Total Wholesale Capacity Price Suppression Benefits
LDA Member EDCs57Total Price Suppression
BenefitEMAAC PECO $177,529,587
MAAC Penelec, Met-Ed, PPL $251,613,802
RTO West Penn Power, Duquesne $203,689,831
ATSI Penn Power $2,185,275
Total $635,018,496
The total wholesale price suppression benefit estimate of $635 million presented in Table I-23 is quite large, but it is important to note that PJM load zones are not drawn along state lines. The SWE estimates that only approximately 17% of the wholesale capacity price suppression benefits produced by Act 129 EE&C plans are realized by Pennsylvania ratepayers despite the Commonwealth bearing 100% of the costs. For example, EMAAC zone in PJM is made up of Atlantic City Electric, Delmarva Power & Light, Jersey City Power & Light, Public Service Electric & Gas, Rockland Electric, and PECO. PECO only serves about 26.5% of the load in the EMAAC zone. The balance of the price suppression benefits to the EMAAC zone will be realized by New Jersey and Delaware ratepayers. Penn Power is only about 7% of the load in the ATSI LDA so most of the price suppression benefits resulting from Penn Power’s EE&C programs will be realized by Ohio ratepayers.
In Table I-24, price suppression benefits are estimated for Pennsylvania multiplying the total price suppression benefit for the zone by the percentage of the load in the zone served by member Pennsylvania EDCs. To provide context, these figures are compared to the cost at which they were achieved and an estimate of the increase in the Act 129 TRC ratios that would be observed if these benefits were included in the benefit ratios for EDC EE&C plans.
Table I-24: Estimates of PA Price Suppression Benefits and Impact to the Phase I TRC Ratios
LDA Percent of Benefits to PA
PA Price Suppression
Benefit58
Act 129 TRC Costs Increase in TRC Ratio
EMAAC 26.50% $47,045,341 $392,333,333 0.12
MAAC 21.86%59 $55,009,106 $755,227,000 0.07
RTO 3.88%60 $7,910,193 $191,353,333 0.04
ATSI 7.23% $158,088 $36,086,333 0.00
57 Benefits estimates are based on a simple regression based approach and should be assumed to contain an associated margin of error58 Benefits estimates are based on a simple regression based approach and should be assumed to contain an associated margin of error59 Met-Ed = 5.02%, Penelec = 4.81%, and PPL = 12.03%60 West Penn Power = 2.26%, and Duquesne Light = 1.63%
P r e p a r e d b y S t a t e w i d e E v a l u a ti o n T e a m79 | Page

ACT 129 DEMAND RESPONSE STUDY Summer 2012
Total 17% $110,122,727 $1,375,000,000 0.08
The values presented in Table I-21, Table I-22, Table I-23, and Table I-24 provided estimates of demand reduction, spending, and price suppression benefits at the EDC portfolio level. Each EDC portfolio in Phase I included a mix of energy efficiency and demand response programs. The following section of this addendum considers the Demand Response program type and the wholesale capacity price suppression benefits these programs produce separately. Act 129 demand response programs achieved significant peak demand reductions during the summer of 2012, but they will not achieve demand reductions in subsequent years or produce net energy savings like EE programs. Because DR programs are designed specifically to reduce peak demand, the single-year price suppression impact per dollar spent is potentially much greater than an energy efficiency program.
An additional reduction in benefits is needed for Phase I Act 129 DR programs because of the overlapping participation with PJM programs, or “double-dipping”. As discussed in Section E, many of the Commercial and Industrial customers participating in Act 129 DR programs were also active in PJM’s demand response programs. The report introduced the concept of an Incremental Benefits Ratio and found that only approximately 70% of the observed Act 129 load reductions were attributable to Act 129. According to self-report surveys conducted with participating customers, the other 30% of load reductions would have happened in the absence of the Act 129 programs.
Table I-25 estimates impacts to Act 129 DR program TRC ratios by first de-rating MW reductions from non-residential DR programs by the Emergency Incremental Benefits Ratio determined in the SWE Demand Response Study and then sub-setting the benefits to those that will be realized by Pennsylvania ratepayers using the EDC load contribution to the zone.
P r e p a r e d b y S t a t e w i d e E v a l u a ti o n T e a m80 | Page

ACT 129 DEMAND RESPONSE STUDY Summer 2012
Table I-25: Price Suppression from Act 129 DR in the 2016/2017 BRA
LDA MW Reduced from DR (De-Rated)61
PA Price Suppression
Benefit62Act 129 TRC Costs Change in TRC Ratio
EMAAC 138 $14,208,311 $70,063,000 0.20
MAAC 170 $15,249,297 $52,407,000 0.29
RTO 122 $2,769,206 $8,421,000 0.33
ATSI 17 $60,295 $3,518,000 0.02
Total63 447 $32,287,108 $134,409,000 0.24
The SWE Demand Response Study found that most of the EDC demand response programs (13 out of 15) offered in Phase I of Act 129 were not cost effective64 (TRC < 1.0) as offered. Table I-26 shows the SWE estimates of the TRC ratios by sector and program across the state for Phase I both with and without benefits from wholesale capacity price suppression. Based on the estimated changes in TRC shown in Table I-25 and Table I-26 it appears that the inclusion of capacity price suppression benefits would cause two programs to move from a TRC ratio below 1.0 to a TRC ratio above 1.0. However, 11 out of 15 DR programs would still not have passed the TRC test.
Table I-26 estimates that the statewide average TRC ratio for C&I demand response programs would increase from 0.64 to 0.88 with the inclusion of wholesale capacity price suppression benefits. The statewide average TRC ratio for Residential Direct Load Control65 programs would increase from 0.33 to 0.56 and the total demand response TRC across sectors would increase from 0.40 to 0.63.
61 De-rated by an Incremental Benefits Ratio of 0.7 to account for PJM “double-dipping”62 Benefits estimates are based on a simple regression based approach and should be assumed to contain an associated margin of error63 Duquesne Light cleared with the RTO and was thus excluded from this portion of the analysis.64 The SWE DR Study identified a number of program design issues which contributed to the poor benefit/cost ratios of Act 129 DR programs in Phase I besides the exclusion of price suppression benefits.65 The TRC ratios presented in Error: Reference source not found assume a 10-year measure life for Direct Load Control switched
P r e p a r e d b y S t a t e w i d e E v a l u a ti o n T e a m81 | Page

ACT 129 DEMAND RESPONSE STUDY Summer 2012
Table I-26: Phase I Demand Response TRC Ratios with and without Preliminary Estimates of Price Suppression Benefits
EDC PJM LDA Program *TRC without Price Suppression
**Increase in TRC from Price
Suppression
**TRC with Price Suppression
Met-Ed MAAC C&I DR 1.01 0.29 1.30Penelec MAAC C&I DR 1.06 0.29 1.35Penn Power ATSI C&I DR 0.92 0.02 0.94West Penn RTO C&I DR 0.33 0.33 0.66Duquesne RTO C&I DR 0.82 0.33 1.15PECO EMAAC DRA 0.44 0.20 0.64PECO EMAAC DER 0.32 0.20 0.52PPL MAAC C&I DR 0.88 0.29 1.17
Statewide C&I DR Total 0.64 0.24 0.88
Met-Ed MAAC Res. DLC 0.26 0.29 0.55Penelec MAAC Res. DLC 0.19 0.29 0.48Penn Power ATSI Res. DLC 0.38 0.02 0.40West Penn RTO Res. DLC 0.22 0.33 0.55Duquesne RTO Res. DLC 0.24 0.33 0.57PECO EMAAC Res. DLC 0.32 0.20 0.52PPL MAAC Res. DLC 0.58 0.29 0.87
Statewide Residential DR Total66 0.33 0.23 0.56
Statewide DR TRC Ratio Without Price Suppression 0.40
Statewide DR TRC Ratio With Price Suppression 0.63
* TRC estimates in Table I-26 include a $25/kW-year avoided T&D benefit
** Estimates of price suppression effects are preliminary and subject to change upon completion of a more sophisticated price suppression analysis
It’s important to note that the analysis presented in this addendum is a rudimentary estimate of effects within a complex capacity market of which Act 129 is only one competing factor. Additional items to consider when reviewing this addendum and considering a more in-depth analysis of wholesale price suppression benefits include:
The calculations presented in Section I have attempted to exclude wholesale price suppression benefits to Maryland, Delaware, New Jersey, and Ohio ratepayers. However, it is likely that state EE and DR programs in these states have wholesale price suppression benefits to Pennsylvania ratepayers which are at least partially offsetting.
There is certainly a market response from the downward pressure exerted on wholesale prices by EE and DR programs. In the long term,
66 The TRC ratios presented in Error: Reference source not found assume a 10-year measure life for Direct Load Control switched
P r e p a r e d b y S t a t e w i d e E v a l u a ti o n T e a m82 | Page

ACT 129 DEMAND RESPONSE STUDY Summer 2012
supply-side resources are aware of these programs and may increase their $/MW bids to counteract price suppression effects. For a multi-year program, it might be an overstatement of the benefits to have continual suppression benefits included.
This analysis does not account for locational constraints within load zones that can potentially alter the results considerably.
This analysis uses a simple linear regression to determine the slope of the supply curve in each LDA. Supply curves are widely considered to be exponential in nature and this approximation will cause increasing uncertainty as the scenario considered moves further from the actual clearing conditions. More sophisticated models would be needed before price suppression estimates could be considerable reliable for inclusion in TRC calculations.
Clearing prices vary considerably from year-to-year. The same load reductions in a different BRA could produce far different (either higher or lower) price suppression estimates.
This analysis only considers a single-year (the 2016/2017 delivery year). This could create the perception that DR programs produce more wholesale price suppression benefits than EE. If capacity price suppression benefits were considered over multiple years or if price suppression of energy prices (LMPs) were considered it is possible that the price suppression benefits from EE would outweigh those of DR.
1. PROSPECTIVE TRC ANALYSIS
Table I-26 presented estimates of the Phase I Demand Response TRC ratios by EDC and sector both with and without the inclusion of preliminary estimates of wholesale capacity price suppression benefits. Even with the inclusion of estimated price suppression benefits, only 4 of the 15 programs result in a TRC ratio of greater than 1.0. The SWE believes that a decision about whether or not to include demand response goals in Phase III should be based on a prospective TRC analysis of a revised demand response program design that provides incremental value over the PJM competitive markets. Section H of this report outlined two possible DR program designs which the SWE believes would dramatically improve the cost effectiveness of Act 129 Demand Response – regardless of whether wholesale price suppression benefits are included. This analysis is based on the second design which uses the day-ahead forecast as the trigger for dispatching DR resources. Key assumptions for the proposed program design include:
Act 129 Demand Response programs would be designed to avoid costs from purchasing generating capacity. The benefits from the programs would be calculated by multiplying the average demand reduction over the performance period by the relevant avoided cost of capacity.
Curtailment events would be called over significantly fewer hours per year compared to the Top 100 hours design. In the proposed DR program design, SWE assumes a total of 8 curtailment events, each lasting for 4 hours. Whether the program trigger is the day ahead forecast, an LMP threshold or simply targeting reduction over the 5CP hours of the
P r e p a r e d b y S t a t e w i d e E v a l u a ti o n T e a m83 | Page

ACT 129 DEMAND RESPONSE STUDY Summer 2012
summer, the SWE believes 32 hours to be the upper bound of the number of hours of curtailment that would be required to achieve program goals.
Commercial and Industrial customers enrolled in the PJM ELRP would not be eligible to participate in an Act 129 demand response program. This would prevent the need for an Incremental Benefits Ratio to discount Act 129 benefits due to dual participation. As a result all benefits are attributed to Act 129. This design would reduce DR potential for Act 129 compared to Phase I, but it would improve the cost effectiveness and focus on adding incremental benefits to the existing PJM framework. Costs and benefits in the prospective TRC model are all assigned on a per MW/MWh basis and price suppression benefits are based on a linear relationship so the reduction assumption does not affect the resulting TRC ratios.
The avoided capacity cost values are based on the results of the Base Residual Auction for the 2016/2017 delivery year rather than the 2012/2013 delivery year.
Commercial and Industrial customers would be paid roughly the same incentive per MWh curtailed as Phase I. However, the annual total revenue would be considerably lower because of the reduced number of hours of dispatch.
To mitigate the potentially low number of curtailment hours (and thus lower total incentive payments) customers would receive an upfront payment for the capacity commitment to curtail when dispatched. The use of a Commitment or Reservation payment in combination with an energy payment for the actual curtailment is modeled after similar programs in New York.
The payment structure assumed for C&I Load Curtailment programs would be unlikely to cause a customer to leave the PJM ELRP in order to participate in Act 129 DR. For example a PPL customer capable of reducing 1 MW of load at dispatch would receive ($119.13*365) = $43,482 annually for its PJM commitment. Assuming that 30 hours of events were called in a given year, the Act 129 participation would generate ($6,000 + $750*30) = $28,500 in revenue. The SWE believes it is important to avoid creating a situation where Act 129 DR programs compete with PJM over customers and instead focuses on adding incremental value.
This approach would significantly reduce the amount of savings potential available for an EDC Commercial & Industrial Demand Response program. This program design would likely appeal to customers who are interested in reducing their Peak Load Contribution (PLC) and the associated financial obligations.
As discussed in Section F, there is substantial uncertainty associated with the inclusion of avoided transmission and distribution benefits and cost effectiveness calculations for DR programs. These benefits are highly dependent on the utility service territory and have been excluded from the prospective TRC analysis.
Section F also explored the impact on TRC ratios from the adoption of the California protocol which only includes 75% of the incentive amount in the TRC calculation as cost. This is not part of the current TRC guidelines in Pennsylvania, so the prospective analysis includes 100% of
P r e p a r e d b y S t a t e w i d e E v a l u a ti o n T e a m84 | Page

ACT 129 DEMAND RESPONSE STUDY Summer 2012
customer incentives as cost. If the TRC Order were revised to adopt the California protocol, TRC ratios would improve.
EDCs invested significant resources in the purchase and installation of direct load control equipment during Phase I. This prospective TRC analysis considers those equipment costs “sunk” if the EDC purchased the equipment and excludes them from the TRC calculation. Equipment costs are included for the installation of new equipment that would need to be installed to maintain program population levels as customers leave the program or old equipment fails. If an EDC wished to use a different load control technology in Phase III, these assumptions would need to be revisited.
The measure life of direct load control equipment is assumed to be 10 years in the prospective TRC model. This requires a multi-year analysis and assumptions about the net present value of money, program attrition rates and the value of generation capacity.
Estimates of price suppression benefits become increasingly uncertain for DLC programs because of this multi-year analysis. The price suppression analysis presented earlier in Section I only considered pricing conditions for the 2016/2017 delivery year. In a 10 year model these pricing suppression estimates have to be considered for nine additional years that may or may not exhibit market conditions comparable to the 2016/2017 delivery year. A 3% annual inflation rate was assumed but the slope of the supply curve was held constant. This introduces significant uncertainty into the estimates because the capacity supply curve could actually be much flatter or steeper in subsequent years.
Table I-27 compares the SWE Phase I TRC ratios, previously shown in Table I-26, to the prospective values for the proposed DR program design. In all cases, the prospective TRC values are higher than those seen in Phase I, which is mainly a result of the top 100 hours performance period being changed to a narrower deployment period. However, the differences are also a function of revised assumptions surrounding the costs and benefits of implementing DR programs in future phases.
One important difference to note in Table I-27 between the historic and prospective TRC analyses is the effect of the inclusion of preliminary estimates of benefits from wholesale capacity price suppression within the Commonwealth. While the prospective TRC analysis does not include more benefits (in dollars) than the Phase I analysis, it should be noted that the benefits in the prospective analysis are achieved at lower cost than those in the Phase I analysis.
P r e p a r e d b y S t a t e w i d e E v a l u a ti o n T e a m85 | Page

ACT 129 DEMAND RESPONSE STUDY Summer 2012
Table I-27: Comparison of Phase I and Prospective Phase III TRC Ratios with and without Preliminary Price Suppression Estimates
TRC**Increase in TRC
from Price Suppression
**TRC with Price
SuppressionTRC
**Increase in TRC from Price
Suppression
**TRC with Price
SuppressionMet-Ed MAAC C&I DR 1.01 0.29 1.30 1.50 1.92 3.42Penelec MAAC C&I DR 1.06 0.29 1.35 1.50 1.86 3.36Penn Power ATSI C&I DR 0.92 0.02 0.94 1.44 0.17 1.61West Penn RTO C&I DR 0.33 0.33 0.66 0.80 0.68 1.48Duquesne RTO Large Curtailable DR 0.82 0.33 1.15 1.52 1.32 2.84PECO EMAAC DRA 0.44 0.2 0.64 1.25 2.54 3.79PECO EMAAC DER 0.32 0.2 0.52 *NA *NA *NAPPL MAAC Load Curtailment 0.88 0.29 1.17 1.46 3.39 4.85
0.64 0.24 0.88 1.32 2.02 3.34Met-Ed MAAC Residential DLC 0.26 0.29 0.55 1.19 1.57 2.76Penelec MAAC Residential DLC 0.19 0.29 0.48 1.19 1.52 2.71Penn Power ATSI Residential DLC 0.38 0.02 0.40 1.14 0.14 1.28West Penn RTO Residential DLC 0.22 0.33 0.55 0.59 0.52 1.11Duquesne RTO Residential DLC 0.24 0.33 0.57 0.59 0.49 1.08PECO EMAAC Residential DLC 0.32 0.2 0.52 1.19 2.39 3.58PPL MAAC Residential DLC 0.58 0.29 0.87 0.76 1.62 2.38
0.33 0.23 0.56 0.94 1.68 2.45
** Estimates of price suppression effects are preliminary and subject to change upon completion of a more sophisticated price suppression analysis
* A Distributed Energy Resources program model was not considered in the prospective analysis
Historic TRC Analysis Prospective TRC Analysis
Statewide C&I Total
Statewide Residential Total
EDC PJM LDA Program
The SWE would like to note again that its assumptions in this analysis are preliminary and that the confirmation of these assumptions would be the central focus of possible Demand Response Potential and Wholesale Price Suppression studies.
P r e p a r e d b y S t a t e w i d e E v a l u a ti o n T e a m86 | Page