act science test sample question types€¦ · questions are the equivalent of specific detail...
TRANSCRIPT
ACT Science Test_Sample Question Types
Guilford County Schools Page 1
The Questions Of the 40 questions on the Science Reasoning Test, 15 will accompany Data Representation passages,
18 will follow Research Summaries, and 7 will cover the Conflicting Viewpoints passage. The four
main kinds of questions you’ll encounter on the Data Representation and Research
Summaries passages will ask you to:
Read the Chart. These questions ask you simply to identify information given on the chart
and are perhaps the most straightforward questions on the Science Reasoning Test. These
questions are the equivalent of specific detail questions on the Reading Test.
Use the Chart. Slightly more complicated than Read the Chart questions, these questions
require that you use the information given in the chart to determine other, unstated
information. For example, some of these questions might ask you to make an informed guess
as to what would happen if one of the variables in an experiment changed.
Handle Graphs. For these questions, you will either have to translate the information in
the charts into words or translate words or numbers into a chart. Being able to manipulate
and transform data in this way indicates that you understand exactly what the given
information in the passage means.
Take the Next Step. These questions ask you what the next step should be for research
experiments. Generally, this type of question will provide you with a goal for an experiment
and the current scenario. You must decide the next step that should be taken to achieve that
goal. You can think of these questions as Big Picture questions that ask you to look at the
research or the experiment as a whole.
The questions on the Conflicting Viewpoints section are slightly different. We’ve divided them
into three main categories: detail, inference, and comparison.
Detail questions ask you to identify specific information from the arguments presented.
Inference questions ask you to draw out implied information from the arguments.
Comparison questions ask you to find and analyze similarities and differences between the
arguments.

ACT Science Test_Sample Question Types
Guilford County Schools Page 2
Data Representation The three Data Representation passages tend to be the most straightforward passages on the
Science Reasoning Test. Each Data Representation passage begins with a written introduction.
Read this introduction for a general idea of the passage, but don’t labor over it. The charts in
Data Representation are the focus of the passage’s questions. Use diagrams such as the one
below to clarify the often confusing terminology in the introduction and to see graphic
representations of the terminology.
The Sample Passage
If left at rest, a spring will hang at its equilibrium position. If a mass ( M) is attached to that spring, the
spring will grow in length by a distance known as its displacement ( x). A larger mass will create a
larger displacement than a small mass.
The force (F), in newtons (N), required to return the spring to its equilibrium position is the negative
product of the displacement (x) and a spring constant (k), where the negative indicates the direction, not
the value, of the force. The spring constant measures the elasticity of a spring: if a spring has a high k,
the spring cannot be stretched easily; if a spring has a low k, it can be stretched more easily.
Various masses were attached to two springs with different spring constants, and the force was
measured in each of these trials. The energy used (J) returning the spring to its equilibrium position, or
Potential Energy (PE), was also measured.
Table 1
Trial Spring Constant, k Displacement, x (m) Force on spring, F
(N)
Potential Energy, PE
(J)
Mass, M (g)
1 5 1 5 2.5
2 5 5 25 62.5
3 5 10 50 250
4 10 1 10 5
5 10 5 50 125

ACT Science Test_Sample Question Types
Guilford County Schools Page 3
6 10 10 100 500
Strategy for Reading the Passage Skim the introduction to the passage. Since the introductions to passages on the Science
Reasoning Test are usually full of confusing scientific terminology, you should not spend time
struggling to understand everything the introduction says. Rather, use the introduction to get a
general idea of what the subsequent chart illustrates. Also, consider circling key terms in the
introduction to make referring back to the passage easier.
When you get to the chart (our Data Representation example has only one chart, but you will
sometimes come across two), you should glance over it to make sure that you know what’s being
measured and that, in general, you feel comfortable finding information in the chart. Save
detailed exploration of the chart for when you answer specific questions.
The Questions Each Data Representation passage is accompanied by five questions. These questions fall into
one of four categories, and we’ll show you how to handle all four below. All of the following
questions refer to the sample passage above.
Read the Chart Read the Chart questions test your ability to locate and understand the information presented in
the charts provided in the passage. The answers to these questions are usually explicitly stated
within the charts. Here’s an example of a Read the Chart question:
Which of the following statements about displacement and the force on the spring is consistent with the
data in Table 1?
A. The force on the spring increases as displacement increases.
B. The force on the spring decreases as displacement increases.
C. The force on the spring does not change as displacement increases.
D. The force on the spring increases then decreases as displacement increases.
Answering this question is a simple matter of reading the chart. The question explicitly tells you
to look at two numbers—the displacement of the spring and the force on the spring—and identify
their relationship. All of the answer choices deal with what happens when the displacement
increases, so you know that your goal is to see what happens to the force on the spring. Trials 1–3
and Trials 4–6 both show displacement increasing from 1 meter to 5 meters to 10 meters. Your
next step should be to check out the corresponding numbers in the Force column. In Trial 1 (a
displacement of 1 meter), the force is equal to 5 newtons; in Trial 2 (a displacement of 5 meters),
the force is equal to 25 newtons; in Trial 3 (a displacement of 10 meters), the force is equal to 50
newtons. These numbers seem to indicate that force increases with displacement. Now check
whether the statement holds true in Trials 4–6. In Trials 4–6, the force rises from 10 newtons to
50 newtons to 100 newtons; in other words, it increases as displacement increases. You’ve just
successfully formulated an answer to the question (“when displacement increases, force
increases”), so you can complete the last step of matching your answer with the test’s. The correct
answer is A.

ACT Science Test_Sample Question Types
Guilford County Schools Page 4
Use the Chart
To answer Use the Chart questions, you must use information from the given chart or charts to
decipher additional information. For instance,
According to the information provided in the introduction and Table 1, which of the following is the
largest mass?
A.
B.
C.
D.
The question tells you to refer to both the introduction and Table 1. In the introduction, there are
two sentences that will help you solve this question. The first sentence is “A larger mass will
create a larger displacement than a small mass.” This sentence indicates that you should look at
the amount of displacement to gauge the relative size of the masses. But if you look only at the
displacement, you’re probably wondering how to choose between and which both
indicate a displacement of 10 meters. To solve this problem, look to the crucial sentence found
later in the passage: “The spring constant measures the elasticity of a spring: if a spring has a
high k, the spring cannot be stretched easily; if a spring has a low k, it can be stretched more
easily.” This sentence points to the difference between the two springs being tested (one with k =
5 and the other with k = 10). If the spring with k = 10 is the tougher to stretch of the two, you can
assume that it requires a heavier mass to stretch the tough spring 10 meters than it does to
stretch the weaker spring 10 meters. So the heaviest mass (and the correct answer) is D.
Now try this Use the Chart question:
If Trial 2 were repeated with a spring wi th k = 15, the displacement of the spring would be:
A. less than 5.
B. 5.
C. greater than 5.
D. indeterminable from the given information.
This question resembles the last one in a key way: both questions require you understand the
sentence, “The spring constant measures the elasticity of a spring; if a spring has a high k, the
spring cannot be stretched easily; if a spring has a low k, it can be stretched more easily.” This
sentence tells you that replacing the spring in Trial 2 with a spring that’s tougher to pull will
result in a smaller displacement of the spring (if the mass pulling on it remains the same). When
k = 5, Trial 2 produces a displacement of 5 meters, so with a larger k (k = 15) and the same mass,
the displacement must be less than 5 meters. Choice A is correct.
Handle Graphs
These questions will generally ask you to transform the data given in the charts into graphic
form. If you are unfamiliar with how to graph data and the differences between linear and
exponential functions, you should review this information. Briefly, straight lines indicate linear
ACT Science Test_Sample Question Types
Guilford County Schools Page 5
functions, while curved lines represent exponential functions. Straight horizontal lines indicate
that the variable remains constant. For example,
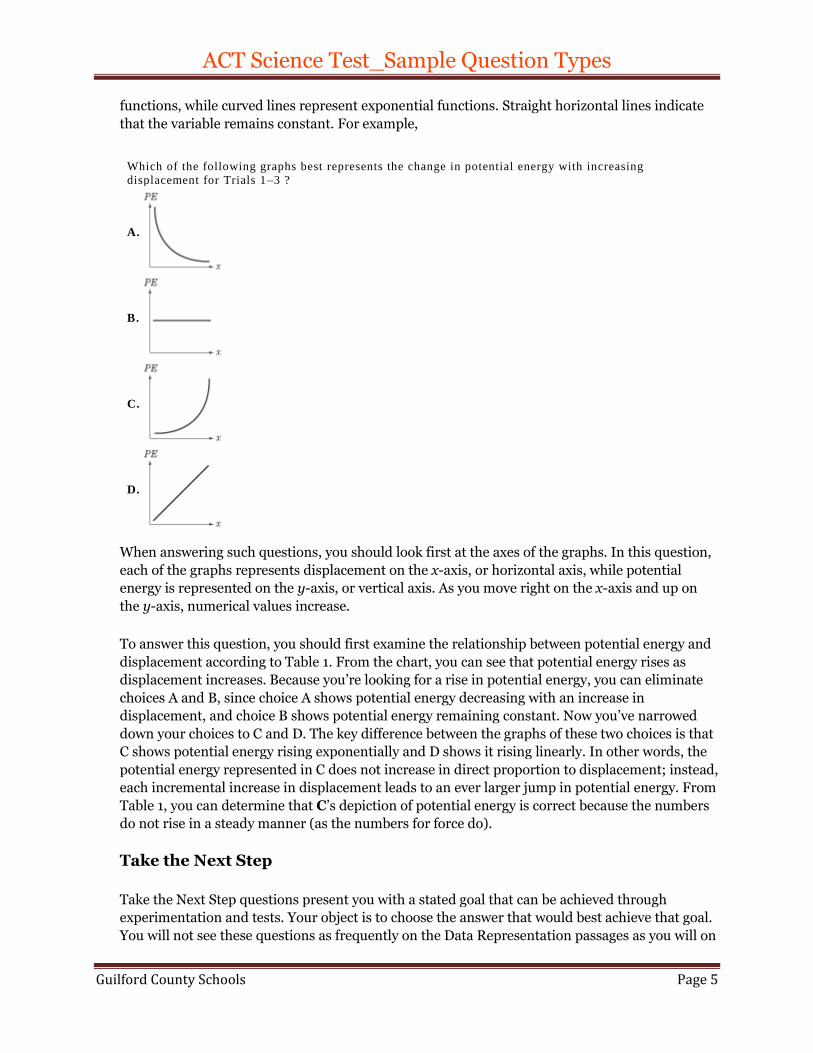
Which of the following graphs best represents the change in potential energy with increasing
displacement for Trials 1–3 ?
A.
B.
C.
D.
When answering such questions, you should look first at the axes of the graphs. In this question,
each of the graphs represents displacement on the x-axis, or horizontal axis, while potential
energy is represented on the y-axis, or vertical axis. As you move right on the x-axis and up on
the y-axis, numerical values increase.
To answer this question, you should first examine the relationship between potential energy and
displacement according to Table 1. From the chart, you can see that potential energy rises as
displacement increases. Because you’re looking for a rise in potential energy, you can eliminate
choices A and B, since choice A shows potential energy decreasing with an increase in
displacement, and choice B shows potential energy remaining constant. Now you’ve narrowed
down your choices to C and D. The key difference between the graphs of these two choices is that
C shows potential energy rising exponentially and D shows it rising linearly. In other words, the
potential energy represented in C does not increase in direct proportion to displacement; instead,
each incremental increase in displacement leads to an ever larger jump in potential energy. From
Table 1, you can determine that C’s depiction of potential energy is correct because the numbers
do not rise in a steady manner (as the numbers for force do).
Take the Next Step
Take the Next Step questions present you with a stated goal that can be achieved through
experimentation and tests. Your object is to choose the answer that would best achieve that goal.
You will not see these questions as frequently on the Data Representation passages as you will on
ACT Science Test_Sample Question Types
Guilford County Schools Page 6
Research Summaries; in fact, you may not see any of these questions on Data Representation
passages, but you should still be prepared to answer them. Here’s an example:
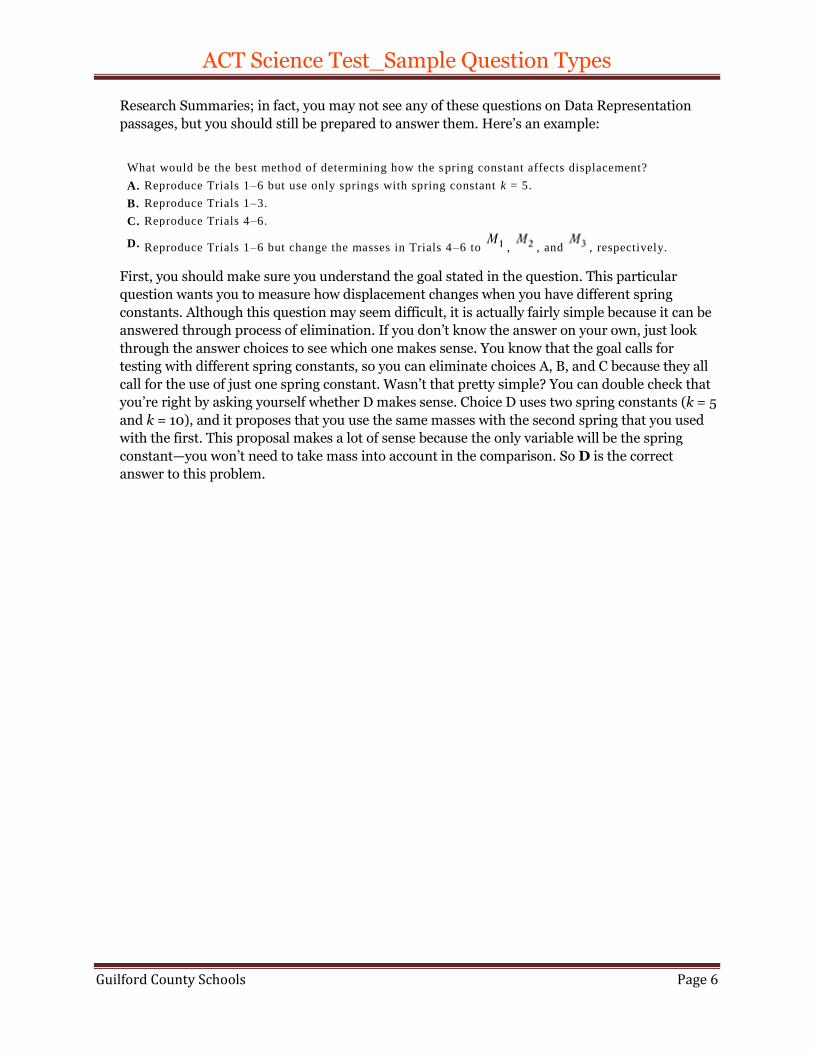
What would be the best method of determining how the spring constant affects displacement?
A. Reproduce Trials 1–6 but use only springs with spring constant k = 5.
B. Reproduce Trials 1–3.
C. Reproduce Trials 4–6.
D. Reproduce Trials 1–6 but change the masses in Trials 4–6 to , , and , respectively.
First, you should make sure you understand the goal stated in the question. This particular
question wants you to measure how displacement changes when you have different spring
constants. Although this question may seem difficult, it is actually fairly simple because it can be
answered through process of elimination. If you don’t know the answer on your own, just look
through the answer choices to see which one makes sense. You know that the goal calls for
testing with different spring constants, so you can eliminate choices A, B, and C because they all
call for the use of just one spring constant. Wasn’t that pretty simple? You can double check that
you’re right by asking yourself whether D makes sense. Choice D uses two spring constants (k = 5
and k = 10), and it proposes that you use the same masses with the second spring that you used
with the first. This proposal makes a lot of sense because the only variable will be the spring
constant—you won’t need to take mass into account in the comparison. So D is the correct
answer to this problem.
ACT Science Test_Sample Question Types
Guilford County Schools Page 7
Research Summaries
For the three Research Summaries passages, you will have to read and understand two or three
experiments and their results. The questions accompanying Research Summaries will ask you to
compare data across the experiments.
The Sample Passage
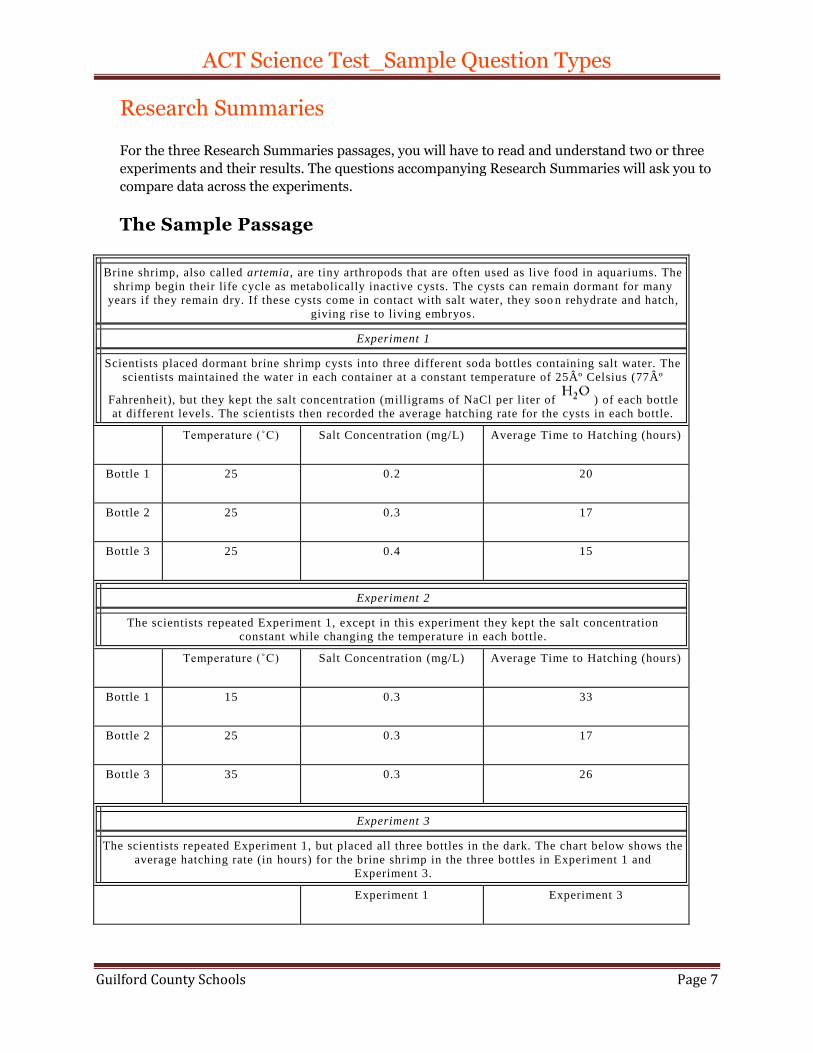
Brine shrimp, also called artemia , are tiny arthropods that are often used as live food in aquariums. The
shrimp begin their life cycle as metabolically inactive cysts. The cysts can remain dormant for many
years if they remain dry. If these cysts come in contact with salt water, they soo n rehydrate and hatch,
giving rise to living embryos.
Experiment 1
Scientists placed dormant brine shrimp cysts into three different soda bottles containing salt water. The
scientists maintained the water in each container at a constant temperature of 25º Celsius (77º
Fahrenheit), but they kept the salt concentration (milligrams of NaCl per liter of ) of each bottle
at different levels. The scientists then recorded the average hatching rate for the cysts in each bottle.
Temperature (˚C) Salt Concentration (mg/L) Average Time to Hatching (hours)
Bottle 1 25 0.2 20
Bottle 2 25 0.3 17
Bottle 3 25 0.4 15
Experiment 2
The scientists repeated Experiment 1, except in this experiment they kept the salt concentration
constant while changing the temperature in each bottle.
Temperature (˚C) Salt Concentration (mg/L) Average Time to Hatching (hours)
Bottle 1 15 0.3 33
Bottle 2 25 0.3 17
Bottle 3 35 0.3 26
Experiment 3
The scientists repeated Experiment 1, but placed all three bottles in the dark. The chart below shows the
average hatching rate (in hours) for the brine shrimp in the three bottles in Experiment 1 and
Experiment 3.
Experiment 1 Experiment 3

ACT Science Test_Sample Question Types
Guilford County Schools Page 8
Bottle 1 20 35
Bottle 2 17 28
Bottle 3 15 25
Strategy for Reading the Passage
Earlier, we advised you to take notes while reading the passage. Marginal notes and underlines
will particularly help you in reading the Research Summaries passages, which each present you
with two or three sets of data.
No matter how carefully you read, you should refer back to the passage when answering the
questions. However, if you read too quickly the first time, you run the risk of misunderstanding
the basic premise of a passage, and you’ll waste time trying to sort out the information when you
should be answering the questions.
For this particular passage, jotting down the variables in each experiment in the margins of the
passage will help you recall the differences between the experiments. For instance, you might
want to write “hatching time” at the top of the passage, so you’ll remember that all three
experiments test the effect of variables on the hatching time of brine shrimp. Next to Experiment
1, you can write something like “salt conc” to indicate that salt concentration was varied in that
experiment. Next to Experiment 2, scribble “temp” to indicate that temperature was the variable.
Write “light” or “light vs. dark” next to Experiment 3 to show that the experiment tested hatching
time with and without light.
The Questions
Each Research Summaries passage will be followed by six questions. These questions will be
similar in type to the questions on the Data Representation passages. All of the questions in this
section refer to the sample Research Summaries passage above.
Read the Chart
As on the Data Representation passage, the Read the Chart questions will ask you to identify
information that is explicitly stated in a chart in the passage. For example,
Based on the results from Experiment 1, one can conclude that:
A. brine shrimp hatch less quickly as salt concentration increases.
B. brine shrimp hatch more quickly as salt concentration increases.
C. hatching is unaffected by salt concentration.
D. salt concentration is dependent on temperature.
Since three of the answer choices deal with the hatching of brine shrimp, you should probably
look at the column “Average Time to Hatching” and see how the numbers in it change. By
ACT Science Test_Sample Question Types
Guilford County Schools Page 9
reading the chart, you can see that a 0.2 salt concentration corresponds with 20 hours to
hatching, a 0.3 salt concentration corresponds with 17 hours to hatching, and a 0.4 salt
concentration corresponds with 15 hours to hatching; thus hatching time decreases as salt
concentration increases, or brine shrimp hatch more quickly as salt concentration increases.
Choice B seems to be the correct answer. Still, it’s good policy to make sure that choices C and D
do not work before committing to your answer. You can easily eliminate choice C, which states
that salt concentration has no effect on hatching time, because Experiment 1 demonstrates the
effect of salt concentration on hatching time. Similarly, you can eliminate choice D because it
claims that salt concentration depends on temperature. From the chart, you can see that
temperature did not vary in Experiment 1, so salt concentration, which did vary, could not have
been dependent on it. You’ve already eliminated choice A by concluding that shrimp hatch more
quickly as salt concentration increases, so that leaves you with the correct answer, which is B.
Here’s another Read the Chart question:
Which of the following was studied in Experiment 3?
A. The effect of light on the time it takes for brine shrimp to hatch.
B. The effect of light on salt concentration.
C. The effect of light on temperature.
D. The effect of light on the survival rate of brine shrimp.
This question asks you about Experiment 3, and all four answer choices deal with the effect of
light on an aspect of the experiment. Your job is to figure out which aspect of the experiment
light affects. A quick look at your marginal notes will reveal that Experiment 3 deals with the
hatching time of brine shrimp in the dark, using Experiment 1 as a control. You can either look to
the chart or its written introduction to find the answer to this question. If you read the
introduction, it tells you that the following chart shows the average hatching rate of brine shrimp
under the altered circumstances. The chart presents you with no other information, so the
experiment must be testing the effect of light on the hatching time of brine shrimp, or choice A.
Use the Chart
Use the Chart questions accompanying Research Summaries passages are very similar to the
ones accompanying Data Representation passages. For example,
If the standard salt concentration used in Experiment 2 were changed from 0.3 mg/L to 0.4 mg/L, what
would likely happen to the time i t takes for the cysts to hatch?
F. The time would increase.
G. The time would decrease.
H. The time would not change.
J. The time would be reduced to zero.
Answering this question requires that you use the charts for both Experiments 1 and 2. As usual,
you should see whether you can eliminate one of the answer choices right off the bat. Choice J
seems like a prime candidate for elimination because neither experiment indicates that the brine
shrimp will hatch immediately under any circumstances. To figure out the most likely hatching
time, you should look at Experiment 1, which tests changes in salt concentration. The question

ACT Science Test_Sample Question Types
Guilford County Schools Page 10
asks you what would happen if the salt concentration were raised from 0.3 mg/L to 0.4 mg/L.
Luckily for you, Experiment 1 tells you what happens to the hatching rate at 0.4 mg/L
concentration and 25º temperature: the brine shrimp take 15 hours to hatch. Compare this to the
17 hours it takes for brine shrimp to hatch at 0.3 mg/L and 25º, and you can predict that
hatching time will decrease with increased salt concentration. So the best answer for this
question is G.
Here’s a more difficult Use the Chart question:
Under which of the following conditions would you expect a brine shrimp cyst to hatch in the least
amount of time?
A. In the light, in water with 0.2 mg/L salt concentration at 25 degrees Celsius.
B. In the dark, in water with 0.3 mg/L salt concentration at 35 degrees Celsius.
C. In the light, in water with 0.4 mg/L salt concentration at 25 degrees Celsius.
D. In the dark, in water with 0.2 mg/L salt concentration at 25 degrees Celsius.
This question requires that you use all three charts and a little intuition. Some of the answer
choices are lifted directly from information in the charts. Choice A, for instance, represents
Bottle 1 in Experiment 1, with a hatching time of 20 hours. Choice C, or Bottle 3 in Experiment 1,
has a hatching time of 15 hours. Choice D, Bottle 1 in Experiment 3, has a hatching time of 35
hours. Choice B is a little trickier than the other answer choices because you must make an
educated guess as to its hatching time. The choice states that the bottle is in the dark, so you
should keep Experiment 3 in mind. It also states that it has a 0.3 salt concentration and 35˚
temperature. Since Experiment 1 keeps the temperature constant at 25˚, you need to look to
Experiment 2, which maintains a 0.3 salt concentration but varies the temperature among 15˚,
25˚, and 35˚. The hatching time for Bottle 3 in Experiment 2, which has the same temperature
and salt concentration as choice B, is 26 hours. Since the dark only increases the hatching time
for brine shrimp, you can guess that it will take choice B much more than 26 hours to hatch. To
keep track of all these hatching times, write down the number of hours for hatching next to each
answer choice. The last step in answering the questions should be to compare these numbers and
choose the smallest one. The correct answer is C, with a hatching time of only 15 hours.
Handle Graphs
Questions that ask you to handle graphs on the Research Summaries passage will ask you to
transfer information from verbal to graphic form or the other way around. For example:
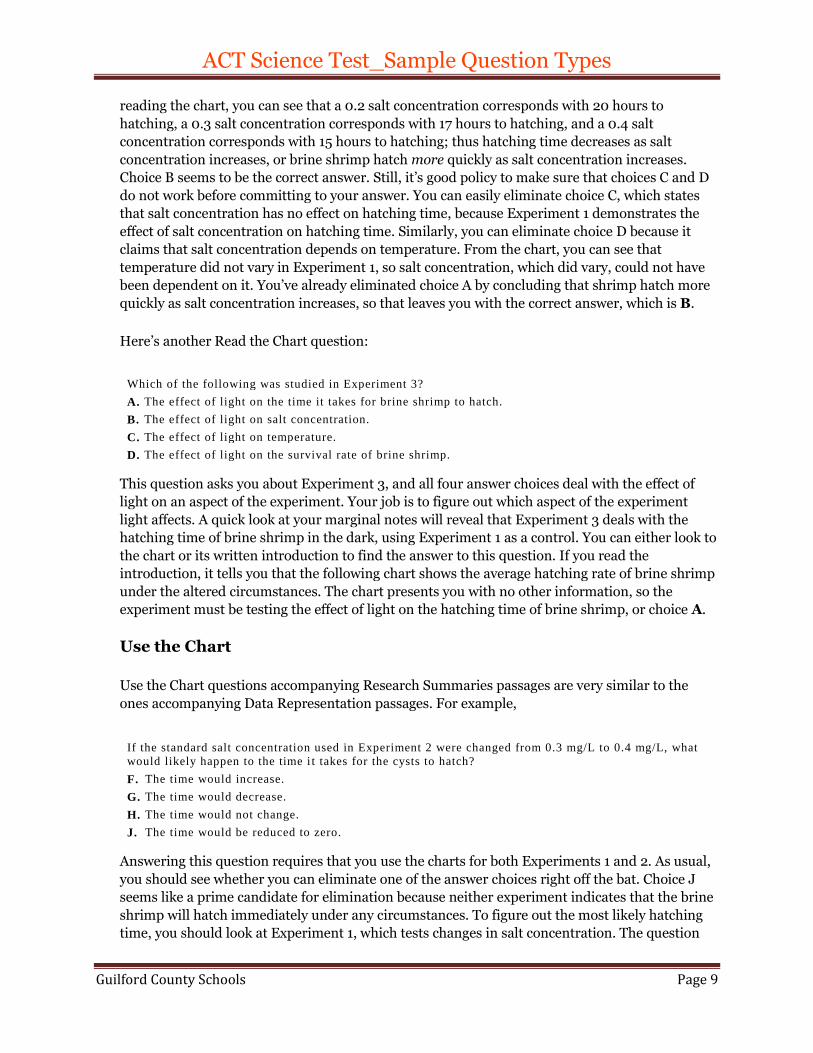
Which of the following graphs best represents the change in hatching time with increasing temperature as
shown in Experiment 2?
F.
ACT Science Test_Sample Question Types
Guilford County Schools Page 11
G.
H.
J.
From the data given with Experiment 2, you can tell that hatching time goes from high to low to
high again as temperature increases. These graphs show temperature on the x-axis, or horizontal
axis, so as you move to the right along the horizontal axis, you are increasing temperature.
Similarly, as you move up the y-axis, or vertical axis, which represents hatching time, you are
increasing the hatching time—33 hours will be higher up on the y-axis than 17 hours. Putting all
this information together, you should be able to figure out that choice J is correct. If you want
proof, you can eliminate the other choices: choice F shows a steadily increasing hatching time;
choice H shows a hatching time that doesn’t change; and choice G shows a hatching time that
goes from small to big to small again, the opposite of what occurs in Experiment 2 Again, review
the graphic representations of linear and exponential functions if you are unfamiliar with them.
Take the Next Step
These questions will be exactly like the Take the Next Step questions on the Data Representation
passages. The question will provide you with a new research goal, and you must decide how to
achieve it. For example,
What would be the best way to study the effects of changing pH (acidity) on the hatching time of brine
shrimp cysts?
A. Putting all three bottles in the light and keeping temperature constant while changing salt
concentration and pH.
B. Putting all three bottles in the dark and keeping temperature constant while changing salt
concentration and pH.
C. Putting all three bottles in the light and keeping temperature and salt concentration levels constant
while varying the pH in each bottle.
D. Putting all three bottles in the dark and varying temperature, salt concentration, and pH in all three
bottles.
This question asks you to make pH the variable in the new experiment. Since pH is the variable
in this new experiment, you want to keep the other factors as constant and as “normal” as
possible. But choices A, B, and D all ask you to change other factors, such as salt concentration or
temperature. These modifications would make it tough to tell whether a change in hatching time
was caused by a change in pH levels or by one of the other variables, and that defeats the goal of

ACT Science Test_Sample Question Types
Guilford County Schools Page 12
the experiment. C, the only choice that keeps light, salt concentration, and temperature constant,
is the correct answer.
ACT Science Test_Sample Question Types
Guilford County Schools Page 13
Conflicting Viewpoints
The Conflicting Viewpoints passage in many ways resembles the Reading Test passages.
The Sample Passage
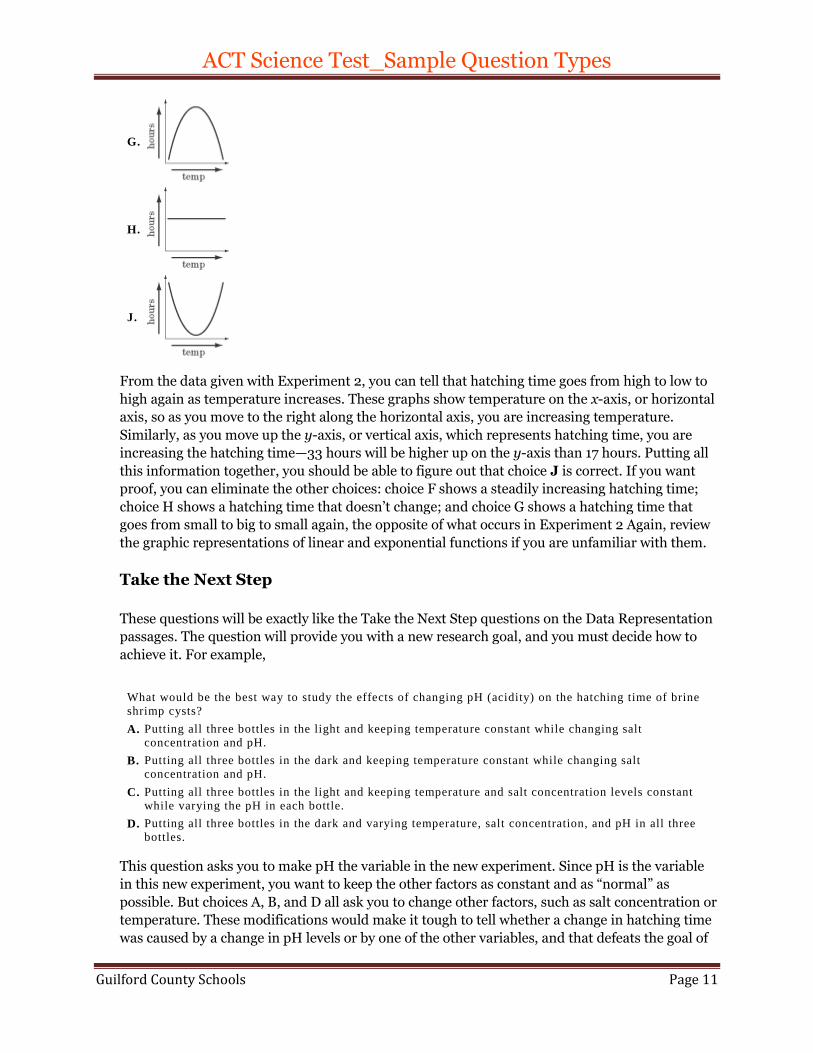
The theory of plate tectonics, which describes the shifting of the Earth’s plates (most of which contain
pieces of continents), is now widely accepted as correct. But scientists are still debating the driving
mechanism behind plate tectonics; in other words, they want to know how the sh ifting of plates happens.
Two of the most popular hypotheses for explaining this phenomenon are presented to you below.
Mantle Convection Theory
Proponents of this theory argue that tectonic plates are moved passively by convection currents in the
Earth’s mantle, which is the layer below the crust. Mantle rocks near the Earth’s core become extremely
hot, making them less dense than the cooler mantl e rocks in the upper layers. As a result, the hot rocks
rise and the (relatively) cool rocks sink, creating slow vertical convection currents within the mantle (see
Figure 1a). These convection currents in turn create convection cells, pockets of circulati on within the
mantle. Supporters of the mantle convection theory argue that these convection cells directly cause
documented seafloor spreading, which they claim is responsible for plate movement. The convection
currents push up magma, forming new crust and exerting a lateral force on the plate, pushing it apart and
“spreading” the seafloor (see Figure 1b). The scientists claim that this force, which ultimately results
from convection currents, is the driving force behind the movement of tectonic plates.

ACT Science Test_Sample Question Types
Guilford County Schools Page 14
Slab Pull Theory
This theory posits that gravity and the plates themselves are responsible for tectonic plate movement
through a process known as subduction. Subduction zones exist at the outer edges of plates where the
rock is cool and dense (as rock ages, it cools off and becomes increasingly dense) (see Figure 2a). In
these zones, the old rock is so dense that it subducts, or sinks, into the mantle below it, pulled do wn by
gravitational forces. As the slab (the subducting part of the plate) is pulled down into the mantle, it drags
the rest of the plate along with it, causing tectonic plate movement (see Figure 2b). The density of the
slab will affect the velocity of it s subduction and thus the force it applies on the plate; a very dense slab
will sink faster than a less dense slab because of gravitational pull, and it will exert a greater force on
the plate attached to it. This theory explains mantle convection as a pro duct, rather than a cause, of plate
movement. The outward movement of the plate allows hot magma to bubble up from the Earth’s mantle
at the center ridges of the plate, forming new crust where the older crust used to be.

ACT Science Test_Sample Question Types
Guilford County Schools Page 15
Strategy for Reading the Passage
Because the questions accompanying this passage almost exclusively deal with the written
material in the passage, it is particularly important that you have a strong grasp of what the
passage says and that you can refer back to the passage efficiently. For that reason, you should
underline and circle sentences and phrases that could potentially be important for answering
questions. These underlines and circles will guide you through the passage when you refer back
to it. Also try to get an overall sense of what each passage is arguing and the most important ways
in which the two arguments differ.
The heavy use of scientific terms makes this passage difficult to digest. Mantle rocks, convection
currents, subduction—what does it all mean? The figures at the end illustrate these terms, but
you may still feel confused. Don’t let the confusion bother you. You don’t need to understand
convection currents after reading this passage. Take from the passage only what it gives you: a
brief explanation of the formation of convection currents and their role in the process described.
As long as you understand that convection currents are related to the rise of hot rocks and the fall
of cooler, denser rocks, that convection currents form convection cells, and that the two theories
disagree about the cause and effect of convection currents, you’re all set.
The Questions
The seven questions on the Conflicting Viewpoints passage are different from the other questions
in the Science Reasoning Test. They are similar to the questions you would encounter on a
Reading Test passage, but they break down into only three categories: Detail, Inference, and
Comparison. As with the Reading Test questions, there aren’t great strategies that can help you
answer these Conflicting Viewpoints questions. There may be questions for which you can
immediately eliminate one of the answer choices, but elimination will not be your standard
technique for solving problems. Rather, you must develop good reading comprehension skills,
since Conflicting Viewpoints is fundamentally a reading comprehension passage. All of the
example questions in this section refer to the Conflicting Viewpoints passage above.
ACT Science Test_Sample Question Types
Guilford County Schools Page 16
Detail
There will probably be two detail questions on the Conflicting Viewpoints passage—not as many
as on the Reading Test passages, but still a significant percentage of the questions. Detail
questions ask you for specific information from the passage. They address only one viewpoint at
a time and usually deal with a key aspect of that viewpoint. To answer these questions, you need
a fundamental grasp of what each side is arguing.
Try this detail question:
According to the Mantle Convection Theory, the heating of mantle rocks near the Earth’s core directly
results in:
A. the rising of the rocks to the upper mantle because they become buoyant when hot.
B. the spreading of the seafloor as magma pushes up through the crust.
C. the creation of convection cells within the mantle.
D. the subduction of cool plate edges into the less dense mantle.
A key word in this question is “directly,” because it indicates that the answer should be a direct
and immediate result of the heating of mantle rocks. While the heating of the rocks may
eventually lead to more than one of the answer choices, only one answer choice directly results
from it. If you run down through the choices, you will see that choice D discusses subduction,
which is mentioned exclusively in the Slab Pull -Theory; thus you can eliminate D because it is
irrelevant to the Mantle Convection Theory. Elimination helps you on this sort of question, but,
as in the case of this particular question, it might not bring you all the way to the correct answer.
Now refer back to the passage and find the section on the heating of mantle rocks. Without
spending much time rereading the section, recall the sequence of events (any marks you made
will help you here), and then formulate an answer to the question. The correct answer to this
question is A because the rising is the immediate result of the heating of the mantle rocks.
According to the Mantle Convection Theory, choices B and C result from heated mantle rocks,
but they occur later in the sequence of events.
Now try this detail question on the Slab Pull Theory:
According to the Slab Pull Theory, which of the following is NOT true?
A. Subduction zones exist far from the active central ridges of plates.
B. Tectonic plate movement results from a lateral force caused by subduction.
C. Mantle convection occurs independently of subduction.
D. Gravitational forces act on dense slab.
This question differs from the previous one because it asks you to identify the answer choice that
is false according to the Slab Pull Theory. Because of the question’s phrasing, you will not be able
to come up with your own answer before matching it to the answer choices. Instead, you should
make sure you understand the theory and refer back to the passage when necessary, keeping in
mind that the time you spend on this step should be limited. Once you feel comfortable with the
passage, run down through the answer choices and ask yourself whether you found each one in
the passage. If you understood the main point of the Slab Pull Theory, choice C should jump out
at you because it describes something occurring independently of subduction, while the Slab Pull
Theory depends on subduction. Indeed, choice C is the correct answer to this question.

ACT Science Test_Sample Question Types
Guilford County Schools Page 17
Inference
You will probably see two inference questions on the Conflicting Viewpoints passage. These
questions ask you to make inferences (i.e., figure out implied information) based on the
arguments of each viewpoint.
Sometimes inference questions will present you with a hypothetical situation and ask you how
the proponents of one (and sometimes both) of the viewpoints would react to it. For instance,
If it were discovered that slabs break off from the rest of the plates once a certain degree of force is
applied, the discovery would harm:
A. the Mantle Convection Theory.
B. the Slab Pull Theory.
C. both theories.
D. neither theory.
This question asks you to decide what the consequences of this discovery would be. The terms
used in this question will help get you started. The question discusses slabs and gravitational
forces, which should immediately point you in the direction of the Slab Pull Theory. Your next
step should be to consider how the new evidence affects the Slab Pull Theory. Ask yourself,
“What does the theory say?” Well, the Slab Pull Theory maintains that subducting slabs exert a
pull on the plates to which they’re attached. If the new evidence is correct and the slabs break off
from the plate when too much force is applied, the new evidence is harmful to the Slab Pull
Theory, and B is the correct answer.
Inference questions may also ask you to identify a statement or piece of evidence that lends
support to one of the viewpoints. For example,
Scientists decide to observe the outer edges of plates. Which of the following statements about
subduction zones would support the Slab Pull Theory?
A. Not all plates have subduction zones.
B. Slab subducts at a uniform speed in all subduction zones.
C. Slab subducts at various speeds depending on the age of the slab.
D.
Where oceanic plates meet continental plates, the oceanic plates will subduct because they are more
dense than continental plates.
Answering this question will require the same skills you used to answer the previous question,
but here you have to figure out the consequences of four different discoveries instead of just one.
Because this task is potentially time-consuming, you should first run down the answer choices to
see whether you can instantly eliminate any as either absolutely incorrect or simply irrelevant to
the Slab Pull Theory. Going through this particular set, you may choose to eliminate choices A
and D right away. If scientists declared that choice A were true, they would definitely not be
supporting the Slab Pull Theory, as the theory hinges on the widespread existence of subduction
zones. Choice D, you might decide, is irrelevant to the theory because the theory never mentions
oceanic or continental plates. So you are left with two choices: B and C. Interestingly, they both
deal with the speed at which plates subduct. Does either the Slab Pull Theory or the Mantle
Convection Theory talk about speed? According to the Slab Pull Theory, “the density of the slab
will affect the velocity of its subduction . . . a very dense slab will sink faster than a less dense

ACT Science Test_Sample Question Types
Guilford County Schools Page 18
slab.” In other words, the Slab Pull Theory expects the velocity (or speed) of subduction to vary
depending on the density of the slab. Choice C says that slabs subduct at different speeds
depending on the age of the slab, so can it still be the correct answer? Yes, because the summary
of the Slab Pull Theory also tells you that the older the rock is, the denser it will be. So choice C
would support the Slab Pull Theory.
You may encounter other types of inference questions on the test. For instance, an inference
question might ask you to identify a necessary assumption made by one of the viewpoints, but
you shouldn’t panic if you see a question like that. All inference questions, regardless of their
phrasing, can be handled similarly. As with detail questions, getting inference questions right on
this test depends almost entirely on your ability to comprehend and use the information
provided in the passage.
Comparison
These questions generally account for three of the seven questions accompanying the Conflicting
Viewpoints passage, so you should make sure you feel comfortable with them. They require you
to compare the viewpoints in the passage in terms of specific details presented in each argument
or inferences you must draw about the viewpoints.
Comparison questions frequently ask you to identify points on which the viewpoints would agree
or disagree. For example,
About which of the following points do the two theories differ?
A. Movement of tectonic plates across the Earth’s surface
B. Density of hot mantle rocks
C. Existence of convection currents in the Earth’s mantle
D. Role of mantle convection in tectonic plate movement
This question requires that you use both your ability to compare viewpoints and your ability to
identify specific detail; answering it correctly involves no inference work. To start, you should
read through the answer choices, eliminating anything you know is uncontroversial to the
viewpoints. Choice A, for instance, is uncontroversial because both of the viewpoints
acknowledge that the plates move; in fact, their goal is to explain this movement. (The theories
disagree on the mechanism behind this movement, not on the movement itself.) Ideally, you
should be able to get the right answer to this question without referring back to the passage, as
this question deals with the fundamental difference between the two theories. If you can’t answer
this question on your own, you should refer back to the passage quickly, but do not waste a lot of
time reading through it again. The correct answer to this problem is D. The Mantle Convection
Theory argues that mantle convection is the driving force behind plate movement, while the Slab
Pull Theory maintains that mantle convection merely results from plate movement. Choice B is
wrong because only the Slab Pull Theory deals with the density of mantle rocks, and choice C is
wrong because neither theory denies the existence of convection currents.

ACT Science Test_Sample Question Types
Guilford County Schools Page 19
Comparison questions may also ask you to infer how one theory would address the other. For
instance,
How would supporters of the Slab Pull Theory explain the documentation of seafloor spreading cited in
the Mantle Convection Theory?
A. Seafloor spreading directly causes tectonic plate movement and slab subduction.
B. Seafloor spreading does not exist.
C. Seafloor spreading and slab subduction simultaneously exert moving forces on tectonic plates.
D. Seafloor spreading exists, but only as a result of slab subduction.
You could call this an inference-comparison question because it asks you to figure out something
that is not explicitly stated in the passage: the response of one theory to the other. The question
points you to a specific issue under debate: seafloor spreading. Ask yourself whether you
understand the position of the Slab Pull Theory on seafloor spreading. The passage explicitly
states that Slab Pull theorists consider mantle convection and seafloor spreading to be products,
not causes, of slab subduction. Which of the answer choices captures that position? Choice A says
that seafloor spreading directly causes slab subduction (the opposite of what the Slab Pull Theory
says), so it is incorrect. Choice B is also incorrect because the Slab Pull Theory does not deny that
the seafloor spreads. Choice C is incorrect as well because it says that both seafloor spreading
and slab subduction are responsible for plate movement, whereas the Slab Pull Theory argues
that only slab subduction is responsible. Choice D, then, must be correct, but you should always
double-check. In accordance with the Slab Pull Theory, it says that seafloor spreading is a result
of slab subduction, so D is indeed the correct answer to the question.
You may encounter additional types of comparison questions on the actual ACT, but they will all
follow the basic idea of comparing the presented arguments in terms of specific details or
inferences. If you encounter a comparison question that seems unlike the examples given above,
the difference is usually a matter of phrasing. A comparison question worded, “Which of the
following statements about the factors that affect tectonic plate movement would be consistent
with the Mantle Convection and Slab Pull theories?” really just asks you to identify specific
details from both theories that agree. You shouldn’t have any problem with this question if you
understand how to answer the first example in this section.
If you get a Conflicting Viewpoints passage that presents three arguments, you may see other
variations on the types of questions asked. For instance, a question may ask you to identify how
one theory is better than the other two in a specific regard. That question would also be a detail-
comparison question because it asks you about a specific aspect addressed by the three
arguments. Again, you won’t have a problem if you understand the examples above.
The key to avoid being intimidated by comparison questions is to remember that they are detail
and inference questions that simply deal with multiple viewpoints. If you can answer detail and
inference questions, you’re well on your way to mastering comparison questions as well.
http://www.sparknotes.com/testprep/books/act/chapter2.rhtml