acta acta board meeting.pdf · new mow agreement the term of the new maintenance agreement is...
TRANSCRIPT

ACTAMeeting of the
Governing Board
April 11, 2019

Item 3
New MOW Agreement

New MOW Agreement
The Operating Agreement provides that the Ports and Railroads select the Corridor Maintenance Contractor.
ACTA then endeavors to enter into an agreement with the selected Contractor on the business terms specified by the Ports and Railroads.
In April 2019, the Ports and Railroads unanimously approved the Contractor selection, business terms of the Agreement, and the first year scope and budget.
The ACTA Board is requested to approve the execution of the Agreement with RailWorks Track Services.

New MOW Agreement
Selection Process:
August 15, 2018, ACTA issued an RFP
October 3, 2018, four proposals were received by this deadline
Proposals were evaluated by a 4-member panel, consisting of rep from each port and each railroad.
November 7, 2018, panel conducted interviews of the 4 proposers
Panel unanimously scored RailWorks Track Services Inc. as the highest ranked firm.

New MOW Agreement The term of the new Maintenance Agreement is approximately 5 years (on or
about May 1, 2019 through April 14, 2024) with an additional 5-year option.
The contract value increases each year based on the Approval Annual Budget negotiated and approved by the Ports and Railroads.
For CY 2019, per completed negotiations, the existing Contractor will perform services ($3.3M) through on or about May 31, 2019 including a 30-day transition.
New Contractor will perform services from on or about May 1 through December 31, 2019 (First Contract Year - $5.4M).
Any uncompleted scope and unused budget by the existing Contractor on or about May 31, 2019 will be transferred to the new Contractor for CY 2019.


Item 4 & 5
Dispatching Amendmentand
Police & Security Services Amendment
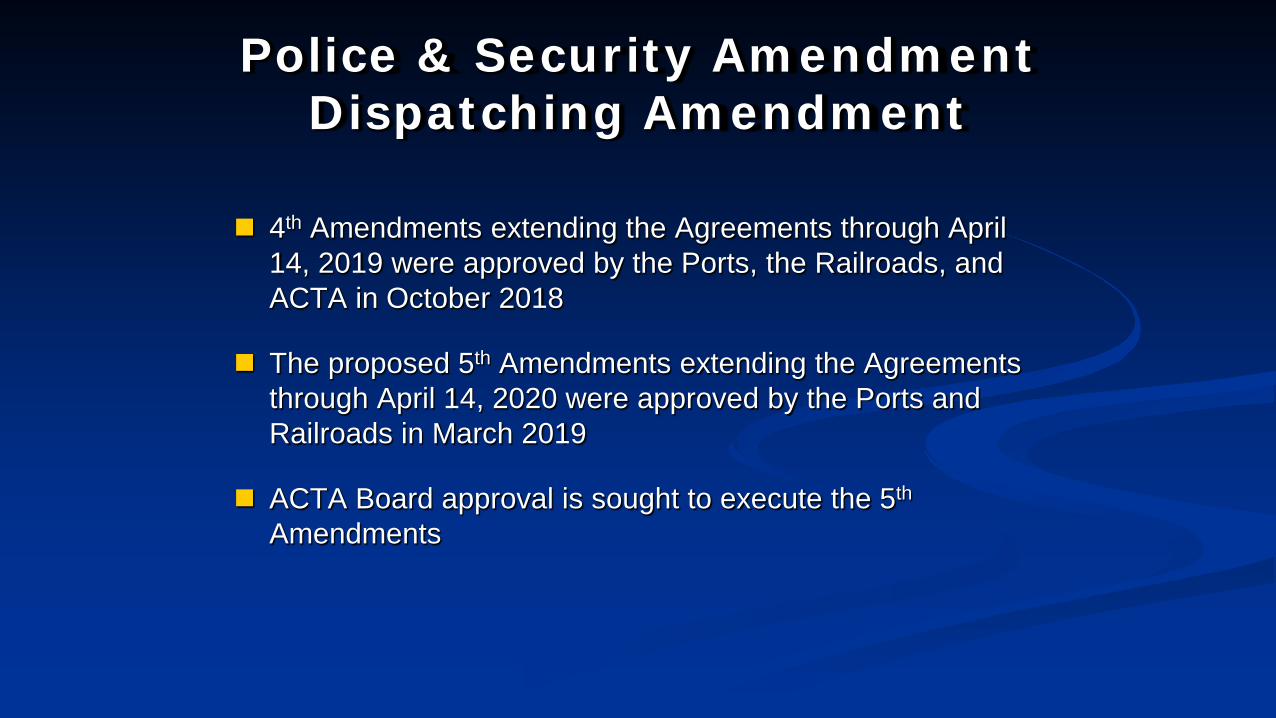
Police & Security AmendmentDispatching Amendment
4th Amendments extending the Agreements through April 14, 2019 were approved by the Ports, the Railroads, and ACTA in October 2018
The proposed 5th Amendments extending the Agreements through April 14, 2020 were approved by the Ports and Railroads in March 2019
ACTA Board approval is sought to execute the 5th
Amendments


Item 06
FY20 Preliminary Budget

Budget Assumptions
Projected revenues based on:• 2.5% CPI fee increase• Modest but stabilizing decline in historical ratios for
loads/empties and import/export reflecting diversion of discretionary TEUs
Compensation adjustment (3.0%) CPI and merit included
ACTA staffing level increasing by 1 (A/P Technician) to 10 full-time, 1 part-time
ACET staffing provided to meet needs of operations and field support– 6 full-time, 1 part-time; plus miscellaneous specialty support as needed

Budget Assumptions Core ACTA functions include corridor maintenance,
revenue collection, payment of obligations, and servicing of debt
New professional service contracts result from recent RFPs and pending RFPs may result in new providers and minor budget changes – scope of professional service contracts has not changed or grown
M&O budget figures based upon 2019 calendar year budget approved through the Notice of Mutual Agreement process in early March adjusted for new MOW contractor

San Pedro Bay Port TEUsCompared to ACTA Revenue

Operating Budget SummaryRevenue
(x1000)
FY 2020 FY 2019 FY 2019Budget Estimated Actual Budget
San Pedro Bay TEUs
ACTA TEUs
18,084
4,466
17,643
4,404
17,536
4,913
Operating Revenue
Use Fees and Container Charges $ 115,288 $ 110,107 $ 112,204
Maintenance-of-Way Charges 6,380 5,343 5,541
Total Operating Revenue $ 121,668 $ 115,450 $ 117,745
Other Revenue 8,020 4,930 8,391
Total Revenue $ 129,688 $ 120,380 $ 126,136

Net Administrative Expense Comparison
$0
$1
$2
$3
$4
$5
$6
$7
$8
FY10Actual
FY11Actual
FY12Actual
FY13Actual
FY14Actual
FY15Actual
FY16Actual
FY17Actual
FY18Actual
FY19Estimated
Actual
FY20Budget
$7.9
$5.9 $5.7
$5.0
$4.1 $4.4 $4.5
$5.5 $5.3
$5.5
$6.7
Millions
-26.1% -3.3% 8.2%-18.7% 22.2% -4.0%
Draft 04//11/19 Page 5
-12.0% 2.3%
$7.1 $6.0 $4.8$4.4 $5.9 $6.3$5.9 $5.2Budget $9.0 $6.1
4.6% 20.7%

Administrative Spendingby Expense Type
FY 2020 FY 2019 FY 2019Budget Estimated Actual Budget
Salaries $ 1,701,298 $ 1,543,829 $ 1,530,728 Benefits 898,232 642,013 695,084 Office Expenses 450,476 406,093 435,625 Other Management Expenses 80,995 48,523 73,550 Information Technologies 311,794 298,962 313,299 Bank and Investment 172,500 147,769 151,000 ACET Administrative Support 1,434,664 1,341,404 1,418,026 Audit 179,872 157,330 158,290 Legal 900,000 657,887 850,000 Governmental Affairs 76,385 72,000 144,160
Professional Services 476,253 221,458 331,283 Total Administrative Expenses $ 6,682,468 $ 5,537,268 $ 6,101,045

Professional Services Budget(x1000)
FY 2020Budget
FY 2019Estimated
Actual
FY 2019Budget
Revenue Assessment Valuation System (RAVS) System Maintenance & System Upgrade $ 359.7 $ 153.6 $ 169.7
Annual Rating Agency Reviews 43.7 25.2 44.0
Financial Advisor 40.0 29.8 50.0
Actuarial Services for Retirement Benefits 20.0 3.9 8.5
Emergency Field Exercises Planning, Coordination, & Oversight 12.5 8.8 8.8
Accounting System 0.0 0.0 50.0
Miscellaneous 0.3 0.2 0.3
Total Professional Services $ 476.2 $ 221.5 $ 331.3


Item 7
PCH Encampment

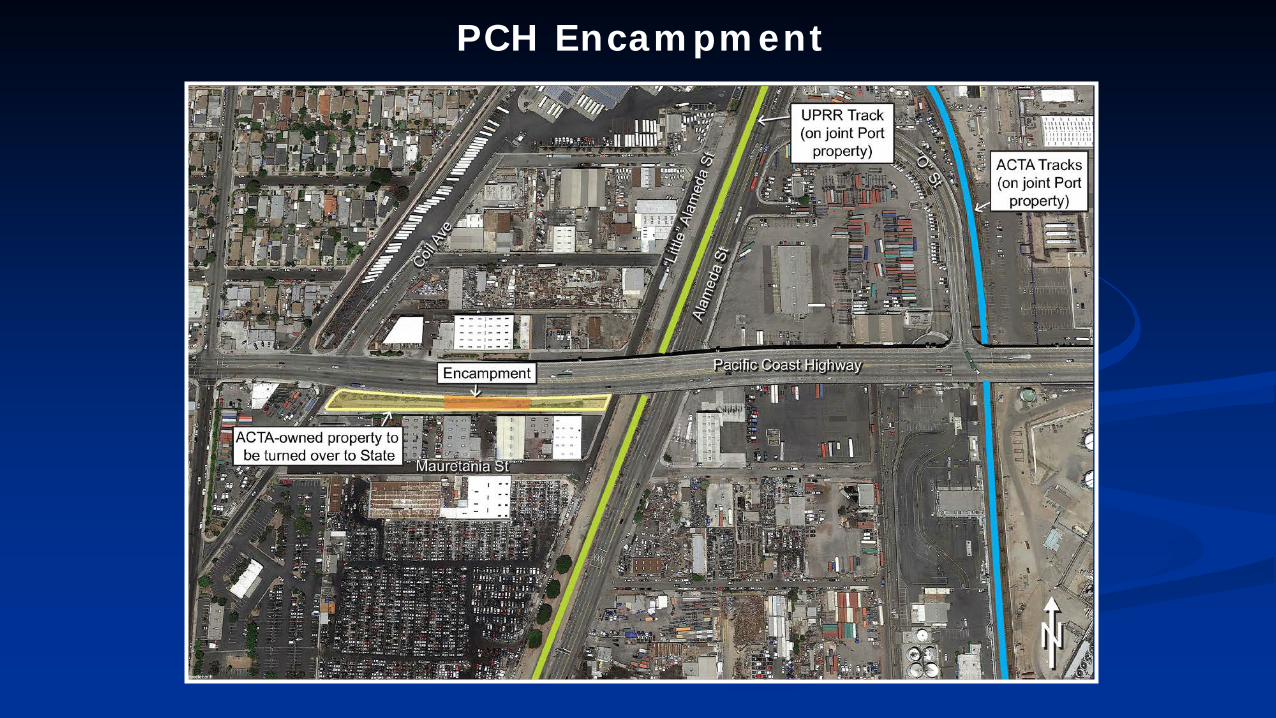
PCH Encampment
Through a Caltrans Co-op Agreement, ACTA acquired multiple properties in Wilmington for the PCH Project.
These properties will be turned over to the State in the next several months.
A 400’ x 70’ encampment exists on a cluster of these properties on the southwest side of the bridge.
Encampment occupants have removed some fencing and broken the main gate for access to the property.
Several mobile homes, dismantled cars, and functioning cars are parked on the property.

PCH Encampment
Encampment occupants apparently are using the site for commercial purposes including the dismantling of vehicles and stockpiling of parts.
Complaints have been made by local business along the adjacent alleyway concerning encampment activities.
LA Council District 15 has requested ACTA’s assistance in this matter.
With the Board’s direction, staff can arrange activities to clean up and remove the encampment with security assistance from local law enforcement.
PCH Encampment

PCH Encampment


Item 8
Performance Update

9.3%
6.1%
12.7%
4.2%
-4.4%
-15.9%
15.7%
1.9%0.3%
3.0% 2.4%
-3.2%
3.4%
5.4%3.7%
-5.7%
-20.0%
-15.0%
-10.0%
-5.0%
0.0%
5.0%
10.0%
15.0%
20.0%
2004 2005 2006 2007 2008 2009 2010 2011 2012 2013 2014 2015 2016 2017 2018 2019**
Gai
n/ L
oss
San Pedro Bay Ports Loaded Container TEU Volumes (yr/yr)2003-2019
* San Pedro Bay Ports Loaded TEUs ** 2019 - CYD through February 2019
9.07M* 9.62M 10.84M 11.30M 11.06M 11.32M 10.97M 11.34M10.80M 9.08M 10.51M 10.71M 10.74M 12.40M11.95M
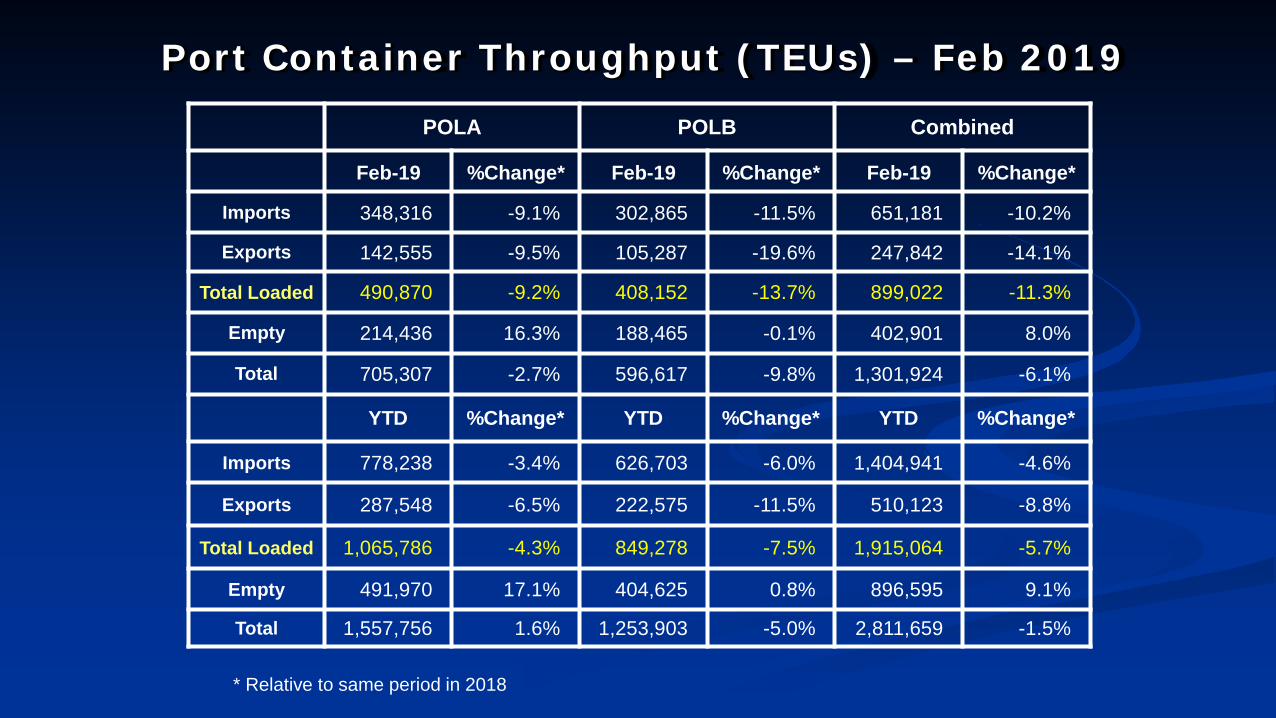
Port Container Throughput (TEUs) – Feb 2019
POLA POLB Combined
Feb-19 %Change* Feb-19 %Change* Feb-19 %Change*
Imports 348,316 -9.1% 302,865 -11.5% 651,181 -10.2%
Exports 142,555 -9.5% 105,287 -19.6% 247,842 -14.1%
Total Loaded 490,870 -9.2% 408,152 -13.7% 899,022 -11.3%
Empty 214,436 16.3% 188,465 -0.1% 402,901 8.0%
Total 705,307 -2.7% 596,617 -9.8% 1,301,924 -6.1%
YTD %Change* YTD %Change* YTD %Change*
Imports 778,238 -3.4% 626,703 -6.0% 1,404,941 -4.6%
Exports 287,548 -6.5% 222,575 -11.5% 510,123 -8.8%
Total Loaded 1,065,786 -4.3% 849,278 -7.5% 1,915,064 -5.7%
Empty 491,970 17.1% 404,625 0.8% 896,595 9.1%
Total 1,557,756 1.6% 1,253,903 -5.0% 2,811,659 -1.5%
* Relative to same period in 2018

Performance ComparisonFebruary ’19 vs. ’18, CY19 & FY19 Year to Date
Railroad Self-Assessment Revenue
’19 ’18 Change
Revenue $8.8 M $9.0 M - 2.2 %
Calendar Year to Date $18.5 M $18.3 M 1.2 %
Fiscal Year to Date * $73.7 M $71.9 M 2.6 %
Operations
’19 ’18 Change
Trains (Daily) 1,036 (37.0) 1,058 (37.8) - 2.1 %
Calendar Year to Date 2,269 (38.5) 2,232 (37.8) 1.7 %
Fiscal Year to Date 9,266 (38.1) 9,089 (37.4) 1.9 %
* Note: Does not include reconciliations / adjustments for fiscal year-end.

Performance Use Fees & Container ChargesFebruary ‘19 vs. ‘18, CY19 & FY19 Year to Date
Operations – On Corridor (Use Fees)
’19 ’18 Change
TEU’s * 397,024 (7,974) 380,561 (7,643) 4.3 %
Calendar Year to Date 842,250 (8,028) 781,305 (7,447) 7.8 %
Fiscal Year to Date 3,377,757 (7,817) 3,158,763 (7,310) 6.9 %
Operations – Around Corridor (Container Charges)
’19 ’18 Change
TEU’s * 18,775 (377) 28,503 (572) - 34.1 %
Calendar Year to Date 39,306 (375) 60,120 (573) - 34.6 %
Fiscal Year to Date 170,214 (394) 252,259 (584) - 32.5 %
Operations – Combined
’19 ’18 Change
TEU’s * 415,799 (8,351) 409,063 (8,215) 1.7 %
Calendar Year to Date 881,556 (8,402) 841,426 (8,020) 4.8 %
Fiscal Year to Date 3,547,971 (8,210) 3,411,022 (7,894) 4.0 %
* Note: Numbers in ( ) are the Average Daily Containers, Daily TEU’s ÷ 1.78 = Containers.

2002 2003 2004 2005 2006 2007 2008 2009 201039 40 44 47 55 49 44 36 39
2011 2012 2013 2014 2015 2016 2017 2018 201942 42 45 47 38 34 37 38 38
Num
ber o
f Tra
ins
Alameda Corridor Train Counts
* Corridor Capacity 150 Trains per Day
Average Daily Trains*:

112.2
Use Fees & Container Chargesas of February 28, 2019
ActualBudget
54.7 62.0 65.580.5
95.2 94.085.3 80.5
93.2 97.3 99.4109.0 105.5 103.6 102.8 112.9
75.3
0
20
40
60
80
100
120
FY03 FY04 FY05 FY06 FY07 FY08 FY09 FY10 FY11 FY12 FY13 FY14 FY15 FY16 FY17 FY18 FY19
Mill
ions
Fiscal Year

Annual Performance ComparisonACTA Revenue * Containers *
(Containers = TEUs/1.77)
5.4% 3.3%
35.6
22.9
12.7
64.3
71.3
56.2
51.2
20.1
37.8
18.4
42.7
21.6
72.3
91.296.1
89.8
18.9
69.0
20.8
74.2
21.9
75.6
63.6
12.0
71.8
15.4
87.2
80.0
13.2
93.2
84.0
13.3
97.3
91.2
12.3
103.5
Millions
(1,53
8)(6
,627)
(1,85
1)(7
,213)
(1,89
9)(5
,712)(1,84
2)(1
,832)
(4,15
6)(2
,090)
(4,72
6)
(3,66
5)
(7,52
7)(1
,885)
1.43M
2.19M
2.49M
2.78M
3.44M 3.31M
2.99M
(949
)(5
,438)
2.33M (1,24
2)(6
,307)
2.76M
(1,04
3)(6
,810)
2.87M
(6,59
2)2.7
7M(9
66) (873
)(6
,931)
2.85M
Rev. 2-6-2019
Thousands
96.6
11.9
108.5
(7,37
3)(8
22)
2.99M
92.1
10.2
102.4
(701
)(7
,203)
2.89M
88.8
99.2
10.4
(6,52
2)(7
06)
2.65M
95.9
105.6
9.6
(7,17
8)(6
39)2
.85M
Note: - #s in ( ) = Daily Average for Year- #s above line trucked around Corridor subject to Container Charge- #s below line travels on the Corridor subject to Use Fee
* Railroad Self Assessed
104.0
111.3
7.2
(7,61
8)
(459)
2.95M

ACTA Percentage of the Ports’ Containerized Volume Imports Exports Loaded Empties Total
2004 41.8% 43.5% 42.2% 14.2% 33.6%
2005 40.3 47.4 42.0 17.6 34.2
2006 44.1 51.3 45.9 20.7 38.0
2007 42.3 51.0 45.0 16.3 36.8
2008 41.1 47.2 43.1 14.3 36.0
2009 37.9 49.0 41.6 9.9 34.2
2010 36.8 49.0 40.1 10.0 32.9
2011 38.6 48.8 42.0 10.6 34.6
2012 36.9 47.6 40.5 9.8 33.1
2013 37.3 47.5 40.6 9.7 33.1
2014 38.0 46.3 40.6 13.2 33.6
2015 36.5 43.8 38.6 15.6 32.0
2016 33.3 43.1 36.2 9.3 28.8
2017 31.9 43.9 35.3 10.4 28.0
2018 30.6 44.4 34.4 9.5 27.1
‘06-’18 Change - 13.5 - 6.9 - 11.5 - 11.2 - 10.9Source: Alameda Corridor Transportation Authority

-100.0
0.0
100.0
200.0
300.0
400.0
500.0
600.0
2017
2018
2019
2020
2021
2022
2023
2024
2025
2026
2027
2028
2029
2030
2031
2032
2033
2034
2035
2036
2037
2038
Debt Service Comparison
Before Refunding After Refunding Delta
4.75% Increase 5.75% Increase 7.75% Increase
$ in
Mill
ions
Fiscal Years
Debt Service Comparison
(with 1.75% Average CPI Increase)
ACTA projected revenue curves for 3, 4, & 6% port loaded container growth, plus 1.75% CPI fee increase.
