acta polytechnica scandinavica - klemola...
TRANSCRIPT

Ch 257
ACTA POLYTECHNICA SCANDINAVICA
CHEMICAL TECHNOLOGY SERIES No. 257
Efficiencies in Distillation and Reactive Distillation KIMMO T. KLEMOLA Helsinki University of Technology Department of Chemical Engineering Kemistintie 1 PL 6100 02015 TKK Finland Dissertation for the degree of Doctor of Technology to be presented with due permission for public examination and debate in Auditorium KE 2 at Helsinki University of Technology (Espoo, Finland) on the 2nd of October, 1998, at 12 o’clock. ESPOO 1998

Klemola, K.T., Efficiencies in Distillation and Reactive Distillation. Acta Polytechnica Scandinavica, Chemical Technology Series No. 257, Espoo 1998, 36 pp. Published by the Finnish Academy of Technology. ISBN 952-5148-60-2. ISSN 1239-0518. Keywords: distillation, distillation efficiency, tray efficiency, reactive distillation, catalytic distillation. ABSTRACT This thesis is based on seven publications concerning efficiencies in distillation and reactive distillation. A new model for the prediction of the numbers of the vapor and liquid phase transfer units, which are used in efficiency calculation, has been developed. The model has been tested together with several other efficiency prediction methods against performance data of an industrial-scale i-butane/n-butane fractionator. The effect of the liquid flowpath length on efficiencies is studied. The Murphree tray efficiencies are calculated for one-pass and two-pass trays in order to assess the effect of varying liquid flowpath lengths. Industrial data from the i-butane/n-butane fractionator and from the MTBE purification column have been used. Calculation methods for the numbers of transfer units (NTUs) on a distillation tray are reviewed and compared. The methods consist of a group of empirical or theoretical correlations for calculating clear liquid height, froth height, and residence times. Experiments have been carried out with a laboratory reactive distillation column using two types of catalyst packings, one with low and one with high separation efficiency. The systems that were studied were the equilibrium controlled decomposition of tert-amyl methyl ether (TAME) and the kinetically controlled TAME formation. The results are compared with rigorous simulations, and the catalytic efficiencies are determined. A method for optimizing the catalyst placement in the column is presented and tested for the production of TAME. In principle, the method determines the separation efficiency of the catalyst packing for each column section. A rate-based reactive distillation simulation model is used to assess the feasibility of five different catalyst packing arrangements for the production of TAME. Catalytic distillation as a potential process design for the production of TAME and higher methanol ethers from the olefin rich FCC light gasoline stream is presented and compared to two other process designs. High- and low-separation-efficiency catalyst packing arrangements are compared too. The feasibility of the processes is assessed both technically and economically. © All rights reserved. No part of the publication may be reproduced, stored in a retrieval system, or transmitted, in any form or by any means, electronic, mechanical, photocopying, recording, or otherwise, without the prior written permission of the author.
PREFACE The work for this thesis was done at the Helsinki University of Technology in the Laboratory of Chemical Engineering and Plant Design during the years 1993–1997. I want to thank the coauthors and my friends Jarno Ilme, Kaj Jakobsson, and Antti Pyhälahti. Also I want to thank professors Markku Hurme and Harry Nordén, the late professor Martti Järveläinen and all the staff in the laboratory, especially Dr. Martti Pekkanen. I am grateful for the financial support for the Neste Educational Foundation and for the Ella and Georg Ehrnrooth Foundation. Lappeenranta, 3rd of September 1998 Kimmo Klemola

CONTENTS List of publications ...................................................................................................................................... 5 The author's contribution............................................................................................................................. 5 List of symbols............................................................................................................................................. 6 1 Introduction................................................................................................................................... 9 2 Distillation efficiencies ............................................................................................................... 10 2.1 Binary distillation efficiencies.................................................................................................... 10 2.2 Factors affecting efficiencies...................................................................................................... 11 2.3 Prediction methods for efficiencies............................................................................................ 11 2.3.1 Experimental data ....................................................................................................................... 11 2.3.2 Empirical methods ...................................................................................................................... 11 2.3.3 Theoretical methods.................................................................................................................... 12 2.4 Multicomponent distillation efficiencies ................................................................................... 14 3 Distillation efficiencies of an industrial-scale i-butane/n-butane fractionator.......................... 15 3.1 Observed efficiencies, numbers of transfer units, and liquid phase resistances....................... 16 3.2 New method for determining the numbers of vapor and liquid phase transfer units ............... 18 3.3 Comparison of different efficiency prediction methods............................................................ 18 4 Effect of two-pass trays on distillation efficiencies................................................................... 20 4.1 i-Butane/n-butane column .......................................................................................................... 20 4.2 MTBE column ............................................................................................................................ 21 5 Calculation methods for the numbers of transfer units on sieve trays ...................................... 22 6 Bench-scale experiments with TAME for the comparison of two catalytic
distillation packing arrangements............................................................................................... 24 6.1 The packings tested..................................................................................................................... 24 6.2 Experimental results ................................................................................................................... 25 6.3 Catalyst efficiencies .................................................................................................................... 26 7 Optimal catalytic distillation packing arrangement for the production of ethers –
structure and design .................................................................................................................... 28 8 Combined production of tert-amyl methyl ether and higher ethers using catalytic
distillation.................................................................................................................................... 31 References................................................................................................................................................... 34
5
LIST OF PUBLICATIONS The thesis consists of the following seven publications: 1. Klemola, K.T., Tray Efficiency Prediction of an Industrial Distillation Column, Acta
Polytechnica Scandinavica, Chemical Technology Series, No. 250, Espoo 1997. 2. Klemola, K.T., Ilme, J., Distillation Efficiencies of an Industrial-Scale i-Butane/n-Butane
Fractionator, Industrial and Engineering Chemistry Research, Vol. 35 (1996), No. 12, 4579–4586.
3. Klemola, K.T., Ilme, J., Effect of Two-Pass Trays on Distillation Efficiencies, Chemical Engineering Technology, Vol. 20 (1997), No. 7, 478–484.
4. Ilme, J., Klemola, K., Calculation Methods for the Numbers of Transfer Units on Sieve Trays, Proceedings of the AIChE Annual Meeting, Los Angeles 1997, Session 34, 140–145.
5. Pyhälahti, A., Klemola, K., Bench Scale Experiments with TAME for the Comparison of Two Catalytic Distillation Packing Arrangements, Proceedings of the 2nd Nordic Symposium on Reactive Separation Systems June 6–7, Helsinki University of Technology, Espoo 1996, 101–111.
6. Jakobsson, K.E., Pyhälahti, A.J., Klemola, K.T., Optimal Catalytic Distillation Packing Arrangement for the Production of Ethers – Structure and Design, Proceedings of the 2nd Nordic Symposium on Reactive Separation Systems June 6–7, Helsinki University of Technology, Espoo 1996, 112–122.
7. Klemola, K.T., Combined Production of tert-Amyl Methyl Ether and Higher Ethers Using Catalytic Distillation, Proceedings of the 5th World Congress of Chemical Engineering Vol III, AIChE, New York 1996, 1071–1076.
THE AUTHOR'S CONTRIBUTION The work for Paper 2 was mostly done by the author. The paper was in major parts written by the author, and excluding the multicomponent part the calculations were carried out by the author. The work for Paper 3 was mostly done by the author except the MTBE calculations. The author acted as a co-writer for Paper 4. In Paper 5 the role of the author was to carry out the experiments together with Antti Pyhälahti and to do some of the calculations. The author acted also as a co-writer. Paper 6 was mostly written by the author. The division of the reactive distillation column into different sections was done by the author.
6
LIST OF SYMBOLS a effective mass-transfer area, m2m–3 contact zone (m–1) b intercept of equilibrium line Cv constant Cl constant Dl liquid phase diffusion coefficient, m2s–1 Dv vapor phase diffusion coefficient, m2s–1 De eddy diffusivity, m2s–1 Emv Murphree vapor phase tray efficiency Emv
e Murphree vapor phase tray efficiency corrected with recycle effect of liquid entrainment
Eoc overall column efficiency Eos column section efficiency Eov point efficiency for a tray hcl clear liquid height, m hf froth height, m Kov overall vapor phase mass-transfer coefficient, ms–1 kl liquid phase mass-transfer coefficient, ms–1 kv vapor phase mass-transfer coefficient, ms–1 L liquid flow rate, mol s–1 LPR liquid phase resistance of mass transfer m slope of equilibrium curve M molecular weight n number of perfectly mixed pools on the tray Pe Peclet number Nrc number of real trays in the column Nrs number of real trays in the column section Ntc number of theoretical trays in the column Nts number of theoretical trays in the column section NTUl number of liquid phase transfer units NTUv number of vapor phase transfer units NTUov number of overall vapor phase transfer units Ql liquid flow rate, m3s–1 p parameter in Equations (18) and (19) q parameter in Equations (18) and (19) S stripping factor tl liquid residence time on the tray, s tv vapor residence time in the two-phase dispersion, s V vapor flow rate, mol s–1

7
W outlet weir length, m x liquid composition xn average composition of liquid leaving tray n XLK liquid composition of light key component in pseudo binary mixture YLK vapor composition of light key component in pseudo binary mixture y vapor composition y* composition of vapor in equilibrium with the liquid at a point on the tray y composition of vapor in equilibrium with the liquid leaving tray n yn composition of vapor leaving a point on tray n yn–1 composition of vapor leaving a point on tray n–1 yn average composition of vapor leaving tray n Greek symbols ρl liquid density, kg m–3 ρv vapor density, kg m–3 σ surface tension, Nm–1 Subscripts l liquid phase v vapor phase HK heavy key component LK light key component

8

9
1. INTRODUCTION Distillation is the most important separation method in the refinery and chemical industry. In terms of installed capacity and energy usage, the commitment of the process industry to this unit operation is enormous. In the USA, for example, the energy consumed by distillation is equivalent to about 7.5% of the total U.S. oil consumption. In designing an industrial distillation column, the knowledge of the theory of the distillation efficiencies and the ability to estimate efficiencies are of paramount importance, since the savings in the capital and operation costs may be remarkable. At first the number of theoretical trays and the energy required for distillation are determined, and then the efficiencies are introduced to design a real column with a real number of trays. Depending on the accuracy and reliability of the efficiencies, a certain number of additional trays are used in practice. Although the theory of distillation is well known, the estimation methods for efficiencies are still relatively inaccurate. Reactive distillation is a combination of a unit process, chemical reaction, and a unit operation, distillation. It especially suits those chemical reactions in which the reaction equilibrium limits the conversion. The reaction products are removed continuously from the reaction section allowing the reaction to proceed to a higher level of conversion than otherwise possible. Another reason for using reactive distillation is to suppress unwanted side reactions by removing the desired product that would otherwise react to an undesired product. The most important application of reactive distillation is the production of fuel ethers. In reactive distillation the catalytic efficiency of the catalyst packing can be defined as the ratio of the actual catalytic performance to the ideal catalytic performance. The separation efficiency is a measure of the distillation function of the catalyst packing. For the equilibrium limited systems, a high-separation-efficiency catalyst packing is advantageous. However, if the system is strongly kinetically controlled, i.e. reactions are slow and equilibrium is not easily reached, it is not reasonable to use high-separation-efficiency catalyst packings.

10
2 DISTILLATION EFFICIENCIES A comprehensive survey of distillation efficiencies is presented in Paper 1. All distillation efficiency fundamentals are considered in some detail. The binary distillation efficiency definitions, the factors affecting binary efficiencies, and the binary efficiency prediction and scale-up methods are presented and discussed. Multicomponent distillation efficiency fundamentals are also presented. Due to diffusional interactions of unlike molecules in a multicomponent mixture, the individual component efficiencies can be unequal and unbounded. This brings further complexity to the efficiency prediction methods. 2.1 Binary distillation efficiencies The overall column efficiency is the ratio of the number of theoretical trays to the number of real trays in the column.
NN= E
rc
tcoc (1)
Usually efficiencies differ from one column section to another. There may be several feed or product streams, different type of trays may be used, or the column diameter may vary in the same column. Therefore it may be reasonable to calculate different efficiency for each column section. The column section efficiency is the ratio of the number of theoretical trays to the number of real trays in a given column section.
NN= E
rs
tsos (2)
The Murphree tray efficiency is the ratio of the actual change in the average vapor composition to the change that would occur, if the vapor leaving the tray was in equilibrium with the liquid leaving the tray. The Murphree vapor phase tray efficiency is the most commonly used efficiency definition, and it is the only one with practical importance. The Murphree tray efficiency is defined as follows in terms of vapor composition.
y -yy -y
= E1-n
*n
1-nnmv (3)
where
b + x m= y n*n (4)
Point efficiency describes the approach to equilibrium at a point on the tray. Because there are concentration gradients in the liquid flowing on the tray, point efficiency is not constant on the tray.

11
Point efficiency is defined as follows.
y -yy -y
= E1-n
*n
1-nnov (5)
where y* = mx+b, and x is the local liquid concentration at the point on the tray. 2.2 Factors affecting efficiencies The factors that affect efficiencies can be divided into three groups: the structural factors, the functional factors, and the system factors and physical properties. Structural factors that affect efficiencies are for example flow patterns, tray types, outlet weirs, downcomers, and tray spacing. Functional factors are for example flow regimes, pressure drop, liquid entrainment, liquid weeping and channelling, flooding, capacity and turndown ratio, and eddy diffusivity. System factors and physical properties are for example surface tension, liquid and vapor density, diffusion coefficients, concentration, viscosity, relative volatility, pressure, and temperature. 2.3 Prediction methods for efficiencies There are many factors that affect efficiencies, and the phenomena taking place inside a distillation column are complicated. A small change in some parameter value may have a considerable effect on other parameter values and column functioning. Consequently the prediction of efficiencies is very difficult. 2.3.1 Experimental data Experimental data from the laboratory or pilot distillation experiments or from industrial distillation columns provide the most reliable way to estimate distillation efficiencies. Whenever available, such data should be preferably used in the efficiency prediction of the distillation column to be constructed or designed. Fair et al. [8] found out that the efficiencies obtained from the laboratory measurements in the Oldershaw columns are good approximates to the point efficiencies of the industrial columns. In a small-diameter Oldershaw column, the point efficiencies can be determined directly, since it can be assumed that the liquid phase is completely mixed, and consequently point efficiency is equal to the Murphree tray efficiency. 2.3.2 Empirical methods Drickamer and Bradford [9], O'Connell [10], and Bakowski [11] have presented empirical correlations for estimating the overall column efficiency. MacFarland et al. [12] have presented two empirical correlations for predicting the Murphree tray efficiency.

12
2.3.3 Theoretical methods The derivation of the overall column efficiency Eoc from the point efficiency Eov and the effect of different factors on different efficiencies are shown in Fig.1.
Figure 1. Order of prediction of the efficiencies and the effect of different factors on efficiencies [13]. Point efficiency The basis for the theoretical prediction methods for point efficiencies is in the two-film or two-resistance theory of mass transfer. Point efficiency can be calculated from the number of overall vapor phase transfer units as follows.
(6) e -1= E NTU-ov
ov
The number of overall vapor phase transfer units can be expressed as a function of the number of vapor phase transfer units, the number of liquid phase transfer units, and the stripping factor. Eq.(7) is based on the two-resistance theory of mass transfer.
NTUS +
NTU1
1= NTU
lv
ov (7)

13
Stripping factor S is defined as follows.
L
mV= S (8)
NTUov, NTUv, and NTUl, are defined as follows.
(9) ta K= NTU vovov
(10) ta k= NTU vvv
(11) ta k= NTU lll
There is a number of correlations for calculating the numbers of vapor and liquid phase transfer units. Murphree tray efficiency Because point efficiencies Eov are not very useful in practice, they are converted to the Murphree tray efficiencies Emv. If the liquid on the tray is perfectly mixed and there are no concentration gradients on the tray, the Murphree tray efficiency is equal to the point efficiency Eov that is measured from any point of the tray. However, in practice liquid is never perfectly mixed on the tray, and concentration gradients exist. For example on the cross-flow tray with a large diameter and correspondingly a long liquid flowpath, concentration gradients increase the Murphree tray efficiency. The extreme of incomplete liquid mixing on the tray is plug flow of liquid with no lateral liquid mixing on the tray. Gautreaux and O’Connell [14] used the idea of Kirschbaum [15] to divide a tray into n perfectly mixed liquid pools. They derived the following relation between the Murphree tray efficiency and the point efficiency.
1 -
nSE + 1 1/S= E ov
n
mv (12)
The number of perfectly mixed pools can be calculated using Eq.(13) of Williams et al. [16].
2
2+Pe = n (13)
Peclet number Pe describes the ratio of liquid transport and longitudinal liquid mixing. Hence it is a measure of the degree of liquid mixing on the tray. Column section and overall efficiency When the Murphree tray efficiency has been calculated, it is used for the calculation of the apparent
14
Murphree tray efficiency , which takes into account the recycle effect of the liquid entrainment.
Now the column section efficiencies can be estimated using Eq.(14) [17]. After the section efficiencies have been calculated, the column overall efficiency can be calculated from Eq.(1).
E mve
[ ]S ln
1) -(S E + 1 ln= Eemv
os (14)
2.4 Multicomponent distillation efficiencies The theory and prediction of binary distillation efficiencies and the factors affecting them apply generally to multicomponent efficiencies too. In binary distillation the point efficiencies of each of the two components are identical and in the range of 0–100%. In multicomponent distillation, the individual component efficiencies may be different and in the range [–∞,+∞]. The calculation methods for the multicomponent mass-transfer equations of Maxwell [18] and Stefan [19] and for the heat-transfer equations [20, 21, 22, 23, 24] have been developed since the beginning of 1960’s. At that time the methods were not useful, since they require a lot of calculation effort. Today the modern computers have made the use of these calculation methods possible, but since there is lack of experimental multicomponent distillation data, the methods have not been reliably tested. The application of the Maxwell-Stefan mass-transfer theory to the multicomponent mixtures leads to some interesting observations. In a multicomponent mixture, the diffusion rate of the component depends not only on its own concentration in the mixture, but also on the concentrations of other components. This may lead to coupling and interaction of the mass transfer among various components. Some examples are [25]: 1. Reverse diffusion – mass transfer opposite to the concentration gradient. 2. Diffusion barrier – no net mass transfer even though a concentration gradient exists. 3. Osmotic diffusion – mass transfer in the absence of a concentration gradient. The interactions between the chemically different species in the multicomponent mixtures result in different component efficiencies and unboundedness of the component point efficiencies. This means that the component point efficiencies can be in the range [–∞,+∞]. The multicomponent efficiency prediction methods are based on the theoretical binary efficiency prediction methods.

15
3 DISTILLATION EFFICIENCIES OF AN INDUSTRIAL-SCALE i-BUTANE/n-BUTANE FRACTIONATOR In Paper 2 performance testing of an industrial-scale i-butane/n-butane fractionator was carried out. The column specifications are given in Table 1 and the column performance data in Table 2. Various methods were applied to predict the efficiencies of this column, and the results were compared with the observed (experimental) efficiencies. The aim was to compare different efficiency prediction and efficiency scale-up methods against industrial data, and thus find reliable methods for practical design purposes. The scale-down of efficiencies and the calculation of the numbers of vapor and liquid phase transfer units from the performance data were also important parts of Paper 2. Table 1. Column specifications [2].
column height, m 51.8column diameter, m 2.900number of trays 74type of trays 2-pass Ballast V-1 valveweir length (side), m 1.859weir length (center), m 2.885liquid flow path length, m 0.967 per passactive area, m2 4.9downcomer area (side), m2 0.86downcomer area (center), m2 0.86tray spacing, m 0.600hole diameter, mm 39total hole area, m2 0.922outlet weir height, mm 51tray thickness, mm 2number of valves per tray 772free fractional hole area, % 18.82
Table 2. Performance data (product flow rates are adjusted) [2].

16
Efficiency prediction methods can be divided into four groups [26]. Methods from all of these groups were tested . 1. Field performance data from a similar column or system. This is the preferred route to predict
efficiencies but, unfortunately, such data are only seldom available from open literature. 2. Empirical correlations which usually calculate the column overall efficiency. These correlations
are usually conservative and have not been validated against large-scale data. 3. Theoretical mass-transfer models are used to predict point efficiencies, which are then related to
the Murphree tray efficiencies using theoretical or empirical methods. 4. Point efficiencies are predicted using laboratory or pilot plant efficiency data. Small laboratory
Oldershaw columns have been found to give point efficiencies almost equal to point efficiencies on large industrial trays. The point efficiencies from the small-diameter column are related to the Murphree tray efficiencies of a large industrial column by using theoretical or empirical models, which take into account tray dimensions and hydraulics.
The number of ideal trays for the i-butane/n-butane column was found to be 88 plus the total condenser and reboiler. The number of actual trays was 74, and consequently the overall column efficiency is 118.9%. In the simulations liquid phase activity coefficients were calculated using the UNIFAC group contribution method. Antoine equation for vapor pressures was used. Vapor phase fugacity coefficients were computed using the original Soave modification of Redlich–Kwong equation (SRK). The column composition profiles and temperatures, physical properties, and some column performance and structural data from each tray were used to predict efficiencies using different prediction methods. Equations (15) and (16) were used to calculate the composition of the light key component i-butane in the pseudobinary i-butane/n-butane mixture.
y + y
y= Y
HKLK
LKLK (15)
x + x
x= XHKLK
LKLK (16)
Pseudobinary i-butane composition is needed in the calculation of the slope of the equilibrium curve m from Eq.(17).
X -XY -Y= m
nLK,1+nLK,
nLK,1+nLK, (17)
3.1 Observed efficiencies, numbers of transfer units, and liquid phase resistances The observed Murphree tray efficiencies, point efficiencies, and numbers of overall vapor phase transfer units for each tray were determined using the following procedure. 1. The number of overall vapor phase transfer units NTUov for each tray is calculated using the

17
AIChE [27, 28] correlations for NTUv, and NTUl and Eq.(7). 2. The NTUov values are multiplied with a constant, which is the same for each tray. 3. Eq.(6) is used to calculate point efficiency for each tray. Here it is assumed that point efficiency
is constant on the tray. 4. The method of AIChE [27, 28] is used to calculate the Murphree tray efficiency for each tray.
Molnar's [29] correlation is used for the eddy diffusivity De, which is needed in the AIChE method.
5. Entrainment effects are taken into account by using the method of Colburn [30] to calculate the apparent Murphree tray efficiency for each tray.
6. The apparent Murphree tray efficiencies for each tray are used in rigorous column simulation. 7. If the calculated and observed product compositions are not equal, the multiplication constant in
step 2 is changed and the calculations are repeated. This procedure is continued until the calculated and observed product compositions are equal. The observed NTUov, Eov, and Emv are those which are used in the final iteration round. For the i-butane/n-butane fractionator the average observed NTUov, Eov, and Emv values were found to be 1.71, 81.9%, and 119.1%, respectively. The numbers of vapor and liquid phase transfer units (NTUv and NTUl) were determined using a method based on the dispersion theory. The method of Chen and Chuang [31] for determining the numbers of vapor and liquid phase transfer units from experimental distillation data was developed for total reflux conditions. Therefore the method was modified in order to make it applicable to practical distillation conditions, and the following correlations were obtained for NTUv and NTUl.
DD
M qM p m
+ 1 NTU= NTUl
v0.5
vl
lvovv ρ
ρ (18)
DD
M pM q
+ m LV NTU= NTU
v
l0.5
lv
vlovl ρ
ρ (19)
The equations are almost the same as in the method of Chen and Chuang. The only difference is that the NTUl equation now contains the factor V/L, the ratio of the molar vapor flow rate to the molar liquid flow rate. NTUv, NTUl, and LPR for each tray were calculated using the respective Equations (18), (19), and (20). The average value for NTUv was 2.22, for NTUl 7.39, and for LPR 23.46%.
S +
NTUNTU
S= LPR
v
l (20)

18
3.2 New method for determining the numbers of vapor and liquid phase transfer units A new semiempirical method for the prediction of the numbers of vapor and liquid phase transfer units was developed. In the model development the contributions of the mass-transfer coefficients kv and kl, the interfacial area a, and the vapor and liquid residence times tv and tl were taken into account. The NTU correlations are based on the fundamental Equations (10) and (11). The mass-transfer coefficients kv and kl were determined using Higbie's [32] penetration theory, and the vapor and liquid residence times were determined in the same way as Chen and Chuang [33]. Zuiderweg's [34] correlation for the interfacial area a in the emulsion regime was used in the model development. Zuiderweg used surface tension and the vapor and liquid momentum fluxes as the main variables. His interfacial area correlation was derived using the FRI data [35, 36] for the systems cyclohexane/n-heptane and i-butane/n-butane. Finally the following correlations for NTUv and NTUl were obtained.
σρρ
W h Q D C= NTU
cl
0.5l
0.5vlv
0.5
vv (21)
ρσρ
0.5vcl
l1.5ll
0.5
l
vll
W h
Q D L MV M C= NTU (22)
Combining Equations (7), (21), and (22) gives the following equation for the overall number of vapor phase transfer units.
) D( M C
) D( M C m + 1
W h
Q D C= NTU 0.5llvl
0.5vvlv
-1
cl
0.5l
0.5vlv
0.5
vovρρ
σρρ
(23)
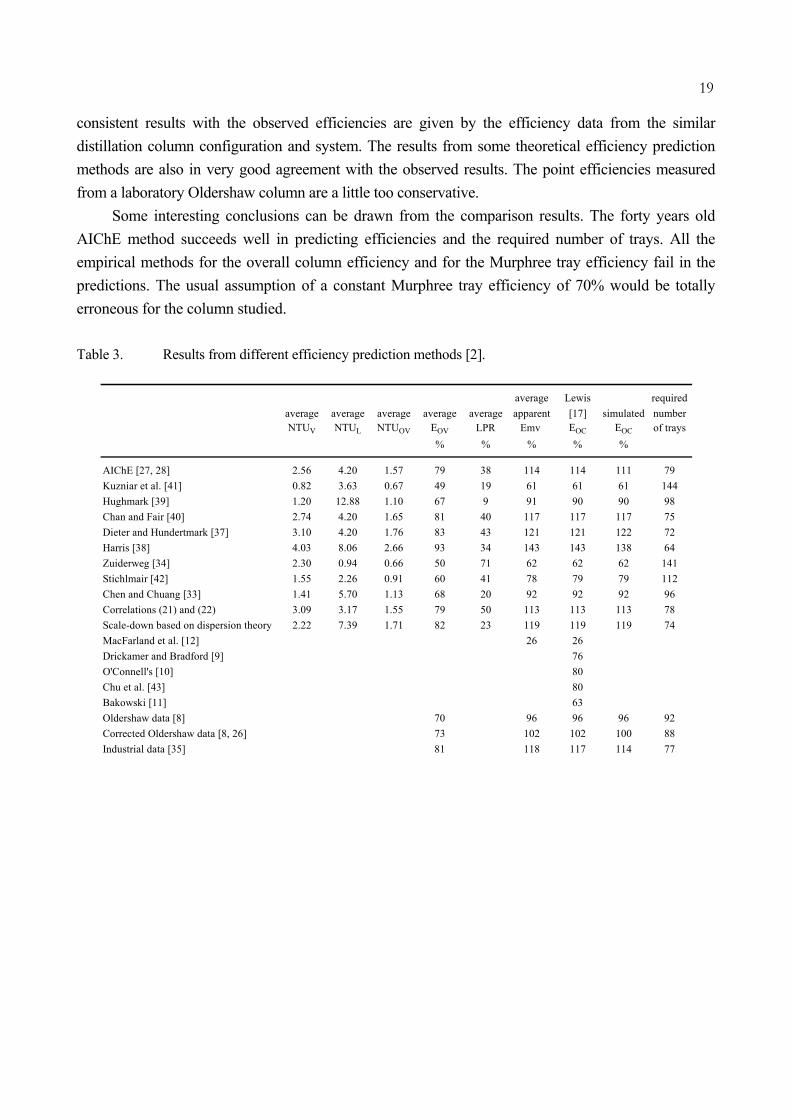
The two constants Cv and Cl are obtained by fitting Eq.(23) to the experimental tray efficiency data. The method can be applied to hydrocarbon mixtures operating in the froth regime. 3.3 Comparison of different efficiency prediction methods Results from different efficiency prediction methods are given in Table 3. The methods of AIChE [27, 28], Dieter and Hundertmark [37], Harris [38], Hughmark [39], Chan and Fair [40], Kuzniar et al. [41], Chen and Chuang [33], Zuiderweg [34], Stichlmair [42], and the method presented in this study are based on the calculation of the numbers of transfer units, i.e. they are theoretical methods. The methods of MacFarland et al. [12], Drickamer and Bradford [9], O'Connell [10], Chu et al. [43], and Bakowski [11] are empirical. The Oldershaw data [8] are obtained from the experiments carried out using a laboratory-scale distillation column. Industrial data are from the pilot plant experiments of Sakata and Yanagi [35] for the same system. As can be seen, different methods give widely differing results. Some methods are a lot too conservative and some are too optimistic. It is not a surprise that the most
19
consistent results with the observed efficiencies are given by the efficiency data from the similar distillation column configuration and system. The results from some theoretical efficiency prediction methods are also in very good agreement with the observed results. The point efficiencies measured from a laboratory Oldershaw column are a little too conservative. Some interesting conclusions can be drawn from the comparison results. The forty years old AIChE method succeeds well in predicting efficiencies and the required number of trays. All the empirical methods for the overall column efficiency and for the Murphree tray efficiency fail in the predictions. The usual assumption of a constant Murphree tray efficiency of 70% would be totally erroneous for the column studied. Table 3. Results from different efficiency prediction methods [2].
average Lewis requiredaverage average average average average apparent [17] simulated numberNTUV NTUL NTUOV EOV LPR Emv EOC EOC of trays
% % % % %
AIChE [27, 28] 2.56 4.20 1.57 79 38 114 114 111 79Kuzniar et al. [41] 0.82 3.63 0.67 49 19 61 61 61 144Hughmark [39] 1.20 12.88 1.10 67 9 91 90 90 98Chan and Fair [40] 2.74 4.20 1.65 81 40 117 117 117 75Dieter and Hundertmark [37] 3.10 4.20 1.76 83 43 121 121 122 72Harris [38] 4.03 8.06 2.66 93 34 143 143 138 64Zuiderweg [34] 2.30 0.94 0.66 50 71 62 62 62 141Stichlmair [42] 1.55 2.26 0.91 60 41 78 79 79 112Chen and Chuang [33] 1.41 5.70 1.13 68 20 92 92 92 96Correlations (21) and (22) 3.09 3.17 1.55 79 50 113 113 113 78Scale-down based on dispersion theory 2.22 7.39 1.71 82 23 119 119 119 74MacFarland et al. [12] 26 26Drickamer and Bradford [9] 76O'Connell's [10] 80Chu et al. [43] 80Bakowski [11] 63Oldershaw data [8] 70 96 96 96 92Corrected Oldershaw data [8, 26] 73 102 102 100 88Industrial data [35] 81 118 117 114 77
20
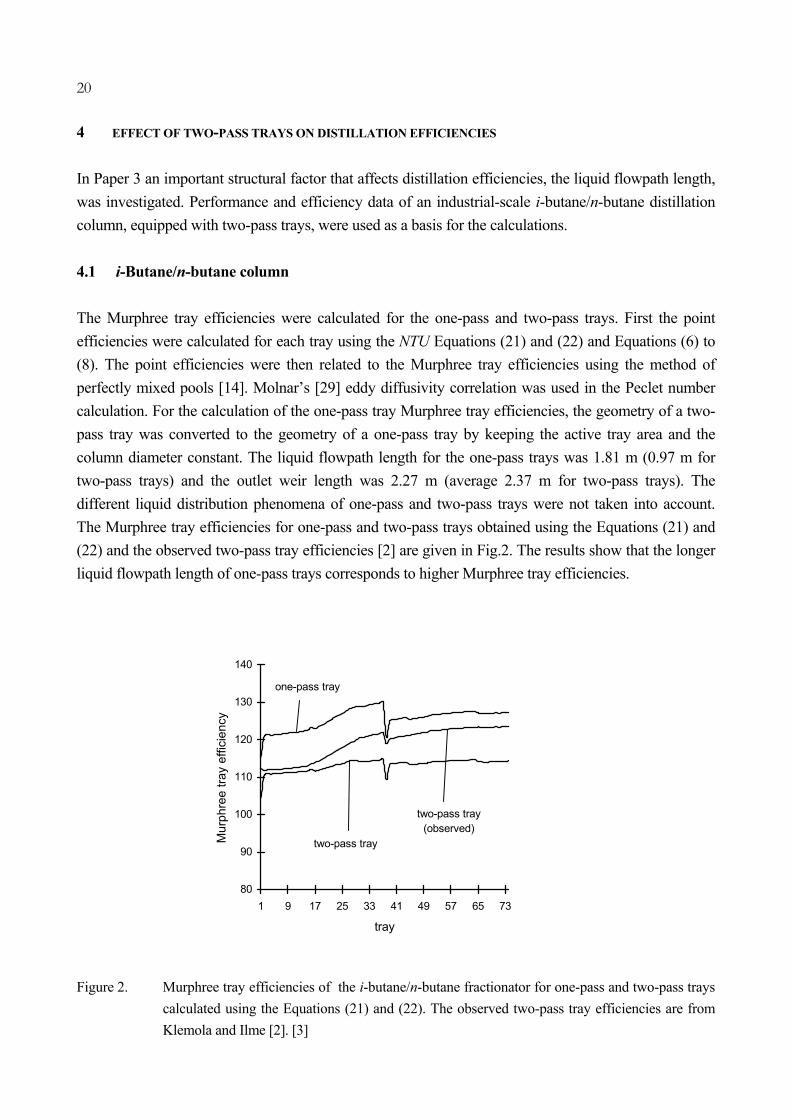
4 EFFECT OF TWO-PASS TRAYS ON DISTILLATION EFFICIENCIES In Paper 3 an important structural factor that affects distillation efficiencies, the liquid flowpath length, was investigated. Performance and efficiency data of an industrial-scale i-butane/n-butane distillation column, equipped with two-pass trays, were used as a basis for the calculations. 4.1 i-Butane/n-butane column The Murphree tray efficiencies were calculated for the one-pass and two-pass trays. First the point efficiencies were calculated for each tray using the NTU Equations (21) and (22) and Equations (6) to (8). The point efficiencies were then related to the Murphree tray efficiencies using the method of perfectly mixed pools [14]. Molnar’s [29] eddy diffusivity correlation was used in the Peclet number calculation. For the calculation of the one-pass tray Murphree tray efficiencies, the geometry of a two-pass tray was converted to the geometry of a one-pass tray by keeping the active tray area and the column diameter constant. The liquid flowpath length for the one-pass trays was 1.81 m (0.97 m for two-pass trays) and the outlet weir length was 2.27 m (average 2.37 m for two-pass trays). The different liquid distribution phenomena of one-pass and two-pass trays were not taken into account. The Murphree tray efficiencies for one-pass and two-pass trays obtained using the Equations (21) and (22) and the observed two-pass tray efficiencies [2] are given in Fig.2. The results show that the longer liquid flowpath length of one-pass trays corresponds to higher Murphree tray efficiencies.
80
90
100
110
120
130
140
1 9 17 25 33 41 49 57 65 73
tray
Mur
phre
e tra
y ef
ficie
ncy
one-pass tray
two-pass tray
two-pass tray (observed)
Figure 2. Murphree tray efficiencies of the i-butane/n-butane fractionator for one-pass and two-pass trays
calculated using the Equations (21) and (22). The observed two-pass tray efficiencies are from Klemola and Ilme [2]. [3]

21
4.2 MTBE column The performance testing of an industrial-scale MTBE purification column was carried out. The column was equipped with 14 two-pass trays in the stripping section and with 14 one-pass trays in the rectifying section. The liquid flowpath length for the one-pass trays was 1.350 m and for the two-pass trays 0.567 m. The simulations were carried out for real trays using a simulator which can update efficiencies while solving the column model. Point efficiencies were calculated using the NTU correlations of Chan and Fair [40], and the point efficiencies were related to the Murphree tray efficiencies using the mixed pool model of Gautreaux and O’Connell [14]. The eddy diffusivities were calculated using the method of Welch et al. [44]. The individual component Murphree tray efficiencies for each tray are given in Fig.3. The simulated composition profiles were in good agreement with the measured composition profiles, which indicates that the calculated Murphree tray efficiencies are correct. The efficiencies for one-pass trays (trays 1–14) are considerably higher than the efficiencies for two-pass trays (trays 15–28).
0
50
100
150
200
250
300
350
400
0 10 20 30
tray number
Mur
phre
e tra
y ef
ficie
ncy,
%
water methanol
MTBE
trans-2-butene
water
i-butane
Figure 3. Murphree tray efficiencies of the MTBE column with one-pass trays above the feed and two-
pass trays below the feed [3].
22
5 CALCULATION METHODS FOR THE NUMBERS OF TRANSFER UNITS ON SIEVE TRAYS In paper 4 calculation methods for the numbers of transfer units (NTUs) on a distillation tray were reviewed and compared. The methods consist of a group of empirical or theoretical correlations for calculating clear liquid height, froth height, and residence times. The correlations were collected to a Fortran subprogram compatible with the process simulator Flowbat. The simulator was used to calculate the numbers of transfer units, clear liquid heights, froth heights, compositions of liquid phase, and the point and the Murphree tray efficiencies for the systems i-butane/n-butane, cyclohexane/n-heptane and ethanol/water. The calculated compositions and efficiencies were compared with experimental values. There are various calculation methods for estimating the numbers of transfer units for sieve and bubble cap trays, but only little information is available about how useful these models are, and how accurately the methods will predict efficiencies in different systems. The methods are based either on empirical, theoretical, or semi-theoretical correlations. The calculation methods were tested simulating distillation columns for the systems i-butane/n-butane, cyclohexane/n-heptane, and ethanol/water using point and Murphree tray efficiency calculation, and by comparing the measured and calculated compositions and Murphree tray efficiencies. The experimental data for i-butane/n-butane and cyclohexane/n-heptane columns are from Sakata and Yanagi [35]. The diameter of the column was 1.2 m, and there were 10 sieve trays. Experimental data of the ethanol/water system have been determined by Halmu [45]. The column diameter was 0.25 m, and it had 12 sieve trays. Table 4 gives the calculated numbers of vapor and liquid phase transfer units, the calculated numbers of overall vapor phase transfer units, the point efficiencies, the Murphree tray efficiencies, the clear liquid heights, and the froth heights for the systems studied. In view of the comparison, it is recommend that the NTU calculation methods should only be employed to the same chemical systems and to the same type of trays for which the methods were originally developed. Large columns were used in the development of the methods of Dieter and Hundertmark [37], Zuiderweg [34], Chan and Fair [40], Koziol and Mackowiak [49], and Chen and Chuang [33]. The methods of Weiss and John [47], Kuzniar et al [41], and Koziol and Mackowiak [49] are suitable for valve trays. The method of Koch and Koziol [48] was developed for sieve trays with a hole size larger than the hole sizes of the trays tested here. The method of Zuiderweg [34] was derived from a small database, and it should be used only for hydrocarbon systems. The results show that the method of Chan and Fair [40] is the most suitable method for different systems. It is not the most accurate method for all systems, but it gives reasonable results, which are accurate enough for design purposes. The method is developed for sieve, bubble, and valve trays.

23
Table 4. Calculated numbers of transfer units, calculated point efficiencies and Murphree tray efficiencies, observed Murphree tray efficiencies, calculated clear liquid heights, and froth heights.
Method NTUl NTUv Eov Emv Emv hcl hf
calculated calculated calculated calculated observed calculated calculated- - - - - cm cm
AIChE [27] 5.75 1.97 0.76 0.91 1.08 5.87 0.00Dieter and Hundertmark [37] 5.74 2.51 0.81 0.99 1.08 5.87 0.00Hughmark -65 [46] 6.58 2.58 0.83 1.02 1.08 5.87 15.11Hughmark -71 [39] 0.92 1.58 0.41 0.46 1.08 0.00 0.00Weiss and John [47] 2.62 2.48 0.69 0.83 1.08 8.85 8.85Stichlmair [42] 3.38 1.45 0.62 0.73 1.08 2.58 11.54Kuzniar et al. [41] 3.98 2.04 0.72 0.87 1.08 5.04 14.66Koch and Koziol [48] 2.26 1.13 0.51 0.58 1.08 2.02 1.79Zuiderweg [34] 2.74 3.22 0.74 0.89 1.08 4.87 0.00Chan and Fair [40] 4.42 2.57 0.79 0.96 1.08 4.51 0.00Koziol and Mackowiak [49] 3.03 0.88 0.48 0.55 1.08 2.57 11.60Chen and Chuang [33] 2.34 3.25 0.71 0.85 1.08 4.21 0.00
Method NTUl NTUv Eov Emv Emv hcl hf
calculated calculated calculated calculated observed calculated calculated- - - - - cm cm
AIChE [27] 10.35 1.20 0.67 0.75 0.78 4.54 0.00Dieter and Hundertmark [37] 10.44 1.65 0.76 0.88 0.78 4.54 0.00Hughmark -65 [46] 7.24 1.54 0.73 0.83 0.78 4.54 14.30Hughmark -71 [39] 2.27 1.62 0.58 0.65 0.78 0.00 0.00Weiss and John [47] 2.52 2.37 0.68 0.78 0.78 4.54 9.17Stichlmair [42] 7.29 1.00 0.59 0.65 0.78 1.89 8.99Kuzniar et al. [41] 6.35 1.18 0.64 0.72 0.78 3.94 15.41Koch and Koziol [48] 3.20 0.33 0.26 0.27 0.78 1.15 0.00Zuiderweg [34] 2.46 2.51 0.69 0.79 0.78 3.73 0.00Chan and Fair [40] 8.13 1.52 0.73 0.83 0.78 3.54 0.00Koziol and Mackowiak [49] 5.05 0.83 0.51 0.56 0.78 1.88 9.07Chen and Chuang [33] 1.60 2.03 0.58 0.65 0.78 3.23 0.00
Method NTUl NTUv Eov Emv Emv hcl hf
calculated calculated calculated calculated observed calculated calculated- - - - - cm cm
AIChE [27] 18.36 0.85 0.55 0.56 0.68 3.11 0.00Dieter and Hundertmark [37] 18.20 1.42 0.72 0.73 0.68 3.11 0.00Hughmark -65 [46] 6.98 1.37 0.67 0.68 0.68 3.11 14.15Hughmark -71 [39] 6.26 1.59 0.66 0.67 0.68 0.00 0.00Weiss and John [47] 2.60 3.03 0.65 0.67 0.68 1.53 11.61Stichlmair [42] 12.89 0.77 0.54 0.55 0.68 2.24 8.64Kuzniar et al. [41] 7.02 1.35 0.61 0.62 0.68 1.80 16.97Koch and Koziol [48] 7.05 0.35 0.28 0.28 0.68 1.04 0.39Zuiderweg [34] 2.16 0.75 0.40 0.40 0.68 1.63 0.00Chan and Fair [40] 10.82 1.55 0.70 0.71 0.68 1.85 0.00Koziol and Mackowiak [49] 14.74 1.98 0.81 0.83 0.68 2.23 8.70Chen and Chuang [33] 0.69 0.86 0.25 0.26 0.68 1.00 0.00
i-Butane/n-butane column
Cyclohexane/n-heptane column
Ethanol/water column

24
6 BENCH-SCALE EXPERIMENTS WITH TAME FOR THE COMPARISON OF TWO CATALYTIC
DISTILLATION PACKING ARRANGEMENTS In the open literature there is only very little information available about the performance of the catalytic distillation column internals. However, such information would be highly desirable for the modeling and design purposes. It is also very important to have information about the significance of the simultaneous separation and reaction in the catalyst section. Some experimental studies have been carried out to determine the mass-transfer characteristics of a bale catalytic distillation packing (Smith [50]). Zheng and Xu [51] measured the gas and liquid film and liquid–solid mass-transfer coefficients for the bale packing using inorganic reagents. Recently the hydrodynamics and efficiency of a catalytic distillation bale packing were studied using the tertiary amyl alcohol preparation as an example system (Subawalla et al. [52], González and Fair [53] and González et al. [54]). In Paper 5 two types of catalyst packing arrangements for a catalytic distillation column were tested. The first of the arrangements was a fixed catalyst bed through which liquid flowed downwards and reacted simultaneously. The bed was made of small Amberlyst 15 ion-exchange resin pellets. The second catalyst packing was a structured packing made of a carpet-like ion-exchange resin. The catalytic activity in both of the catalysts comes from the sulfonate groups attached to the polymer matrix. In the fixed bed packing arrangement there was no significant vapor–liquid contact (the separation efficiency of the catalyst packing was negligible). The structured carpet catalyst packing had some separation function (reasonable separation efficiency). The performance of these catalyst arrangements was tested for the decomposition and production of tert-amyl methyl ether (TAME). In this way the performance of two packing types, one with no distillation function and one with relatively good distillation function, was tested under both equilibrium limited and kinetically limited conditions. The height equivalent of a theoretical plate (HETP) for the structured carpet packing was measured in order to determine the separation efficiency of the packing. The results from the experiments with the reactive TAME system were compared with the reaction rates predicted by a model developed in a CSTR reactor under ideal mixing conditions. A mass-transfer model for the structured carpet catalyst was developed and used in the simulation of the test results. The catalytic efficiencies for both packing types were determined by comparing the experimental results and the results from the calculations under ideal conditions. 6.1 The packings tested Arrangement 1 is a simple fixed bed through which liquid is flowing downwards. In this catalyst arrangement there is no significant vapor–liquid contact, because vapor bypasses the catalyst bed by flowing upwards through the vapor chimney. However, the structure is extremely simple, and because the vapor chimney is a straight pipe, its pressure drop is low and its diameter can be kept small. Thus in this arrangement it is possible to pack a larger amount of catalyst to a given column section than in the structured catalyst packing arrangements, which provide efficient vapor–liquid contact but require
25
more free cross section for the vapor channels. Arrangement 1 may be assumed to be suitable for a system with a relatively slow reaction and with the equilibrium preferably on the product side. Under such circumstances long contact time with catalyst is needed in order to approach the reaction equilibrium. It is also not necessary to separate reaction products continuously from the mixture. It is sufficient to make the product separation every now and then in separate inert column sections between the catalyst beds. Arrangement 2 is a structured catalytic distillation packing, which provides vapor–liquid contact inside the catalyst section. The packing was made of a carpet-like ion-exchange resin supported by a stainless steel wire mesh. The carpet is made of very thin polymer fibers, and the sulfonate groups are on the surface of these fibers. Geometrically the catalyst section was composed of concentric catalyst carpet cylinders separated by spacers, which provided approximately 3–5 mm wide annular space between the cylinders for the vapor passage. If the reaction involved is very fast and severely equilibrium limited, the use of the carpet catalyst may be justified. In such a system, the amount of catalyst needed is not big, but the reaction products should be constantly removed from the reaction section. 6.2 Experimental results Three properties of the catalyst arrangements were tested: – Reaction rates in TAME decomposition as a function of the liquid flow rate through the catalyst
packing. – Reaction rates in TAME formation as a function of the liquid flow rate through the catalyst
packing. – Height equivalent of a theoretical plate (HETP) in ordinary distillation (n-hexane/cyclohexane) as
a function of the liquid flow rate through the catalyst packing (this test was performed only for the carpet catalyst).
Fig.4 shows the most important result of the experiments, the TAME decomposition rate as a function of the column internal flow rate. The catalytic efficiency of the carpet catalyst in the decomposition of TAME is quite high on the reaction rate per mass of catalyst basis (Fig.4b). Probably this resulted from better mass and heat transfer between gas and liquid phases in the carpet catalyst bed than in the fixed catalyst bed. Because the density of the carpet catalyst is low, the volume of the column section packed with the carpet catalyst becomes quite high, and thus the reaction rate per unit volume is lower for the carpet catalyst bed than for the pellet catalyst bed (Fig.4c). The purpose of the experiments with a binary mixture n-hexane/cyclohexane was to find out the vapor–liquid mass-transfer performance of the packing. This system was selected, because it is very nearly ideal, the heat of vaporization is almost constant, and all necessary data were available. The HETP values of the carpet catalyst packing varied between 0.38 and 0.51 m. The TAME production rate in the fixed bed is much lower than the TAME decomposition rate, but the difference is considerably smaller than in the case of the carpet catalyst. Because of the low

26
reaction rates in the TAME production experiments, these results are less reliable than the results from the decomposition of TAME.
a b c Figure 4. TAME decomposition rates in different experiments: a) absolute rates, b) rates per kg of
catalyst, c) rates per m3 of catalyst [5]. 6.3 Catalyst efficiencies The catalyst efficiency can be defined as follows [5].
catalyst of amount actual
systemideal in needed catalyst of amount = catη (24)
The efficiency of the pellet type catalyst varied between 55% and 90% in the TAME decomposition experiments. The highest efficiencies were achieved with the highest liquid flow rates. This is not a surprise, because the catalyst section is more completely wetted when the liquid flow rates are high. The variation was larger for the TAME production experiments, but this may be due to larger errors in the experimental results. For the carpet catalyst the simulation of the bed is not as easy as for the pellet type catalyst because of the countercurrent vapor–liquid mass transfer, which takes place in the packing. A mass-transfer model was developed for the carpet catalyst packing with the following assumptions. – The carpet is only partially wetted, and thus both vapor and liquid phases are present in every part
of the carpet layer. – The vapor–liquid and liquid–solid mass-transfer areas inside the carpet are very large due to the
large total surface area of the fibers. Hence in any tiny area inside the carpet, the vapor and liquid are in vapor–liquid and thermal equilibrium.
– The distance from the outer surface of the carpet to the inner parts of the carpet is sufficient to cause a significant mass-transfer resistance. The mass transfer from the surface of the carpet to the inner layers of the carpet takes place in parallel through gas and liquid phases. This is a

27
difference to the standard film model in which the mass-transfer resistances are in series. Vapor is assumed to flow relatively little inside the carpet, at least in the horizontal direction. Vapor movement inside the carpet takes place only due to diffusional mass-transfer and thermal effects.
– There is an additional mass-transfer resistance in the boundary layer of the vapor channels and the outer surface of the carpet.
This rather complicated model was simplified by assuming that the mass-transfer resistances at the vapor–liquid and liquid–solid interfaces are negligible inside the carpet. Then the model was implemented to the Flowbat simulator. The catalyst efficiencies in the TAME production experiments for the structured carpet catalyst varied between 30% and 100%.

28
7 OPTIMAL CATALYTIC DISTILLATION PACKING ARRANGEMENT FOR THE PRODUCTION OF
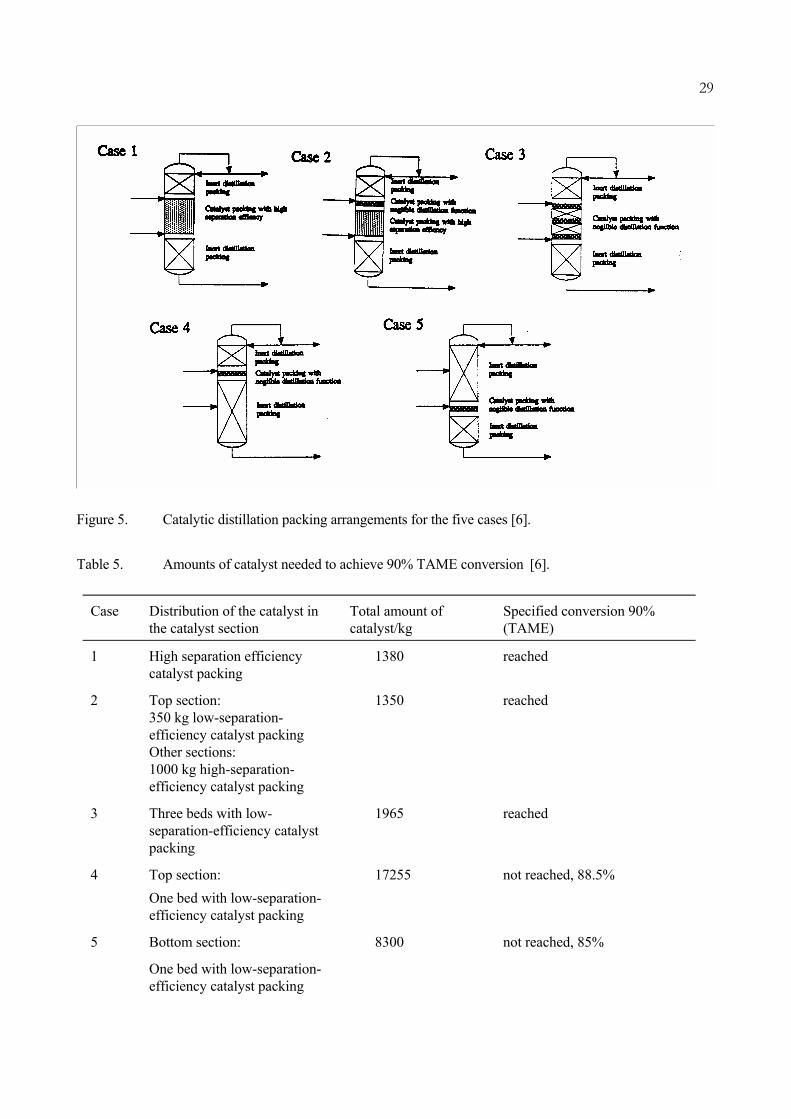
ETHERS - STRUCTURE AND DESIGN In Paper 6 catalytic distillation in general and the applications for the production of gasoline octane enhancer ethers were discussed. Existing commercial catalytic distillation packing structures were presented. The properties of a good catalytic distillation packing and some practical aspects and problems related to catalytic distillation packings were discussed. A simple method to optimize the catalyst amount and placement in the column and to select a proper catalyst packing for a catalytic distillation column was presented. The qualitative expressions such as a catalytic distillation packing with high, medium, or low separation efficiency may all have their counterparts among the existing packings having such properties. Economic optimization may be carried out keeping in mind that the high-separation-efficiency catalytic distillation packings are more expensive than the low-separation-efficiency catalyst packings. Five catalyst packing arrangements for the production of TAME were used in the testing. All the packing arrangements can be realized in practice. The second generation non-equilibrium model of Taylor et al. presented in Taylor and Krishna [55] was used in the simulations. The feed goes through a relatively efficient prereactor before entering the column, and thus the feed of the column contains a significant amount of TAME. This mixture of hydrocarbons, TAME, and methanol is fed to the lower part of the column. Additional methanol is fed to the upper part of the column. The column is operated in such a way that the bottom product is almost pure TAME, and the inert hydrocarbons and the excess of reactants go to the top of the column. The packing arrangements are depicted in Fig.5. The target was to produce almost pure TAME with a isoamylenes to TAME conversion of 90%, with no methanol in the bottoms product, and no TAME in the overhead product. By trial and error, the catalyst amount needed to meet the desired specifications was minimized by altering the catalyst amount on a column section, and by keeping the bottom product purity constant. The required catalyst amounts obtained from the simulations are shown in Table 5.
29
Figure 5. Catalytic distillation packing arrangements for the five cases [6]. Table 5. Amounts of catalyst needed to achieve 90% TAME conversion [6].
Case Distribution of the catalyst in the catalyst section
Total amount of catalyst/kg
Specified conversion 90% (TAME)
1 High separation efficiency catalyst packing
1380 reached
2 Top section: 350 kg low-separation-efficiency catalyst packing Other sections: 1000 kg high-separation-efficiency catalyst packing
1350 reached
3 Three beds with low-separation-efficiency catalyst packing
1965 reached
4 Top section: One bed with low-separation-efficiency catalyst packing
17255 not reached, 88.5%
5 Bottom section:
One bed with low-separation-efficiency catalyst packing
8300 not reached, 85%

30
An optimization algorithm was combined directly to the reactive distillation module of Flowbat. The condition for optimum was such that the change of conversion per amount of catalyst added to the stage is the same for all separation stages containing catalyst. This condition is reasonable, when the costs of adding catalyst to any of the separation stages are the same. In reality, however, the structure of the catalyst packing is different for different ratios of separation efficiency and catalytic efficiency. Hence the costs of adding catalyst to the different column sections may vary. When the amount of catalyst in different column sections has been solved, the result is converted to the actual design by selecting a suitable catalytic or inert packing for each section. The result of the optimization shows that the minimum amount of catalyst needed in the test case is 1260 kg, and the amount of catalyst on each ideal stage varies between 50 and 70 kg (Fig.6). This variation is so small that in practice it is certainly reasonable to use the same amount of catalyst on each stage instead of trying to follow the optimal distribution exactly.
Figure 6. Optimal catalyst distribution [6].

31
8 COMBINED PRODUCTION OF tert-AMYL METHYL ETHER AND HIGHER ETHERS USING CATALYTIC
DISTILLATION In Paper 7 the combined production of TAME and higher ethers in industrial scale is used as an example case to test the applicability of high- and low-separation-efficiency catalyst packings both technically and economically. In addition to catalytic distillation, the technical and economical evaluations were also done to two other process designs, the conventional fixed bed reactor and distillation design and the side reactor design. The combined production of TAME and higher ethers is a new way to fulfill the oxygenate demand in reformulated gasoline. FCC light gasoline containing high amounts of C5 to C7 reactive olefins is combined with methanol in the presence of acidic ion-exchange resin to produce TAME and higher ethers. In the future there is a strong incentive to convert higher olefins together with isoamylenes to ethers in order to reduce the gasoline vapor pressure, increase the oxygen content, and further increase gasoline octane number. The etherification reactions are equilibrium limited. In order to achieve higher conversions, separation of ethers from unreacted olefins and methanol has to be carried out, and the catalyst contact for the unreacted mixture must be rearranged. Three such process designs were compared: the conventional fixed bed reactor and distillation design, the catalytic distillation design, and the side reactor design. These designs were simulated, and their technical and economical feasibilities were assessed. The primary reactor stage will give isoamylenes to TAME conversion of about 70 %, THEXME (ether from reactive C6 and methanol) conversion of about 35 %, and THEPME (ether from reactive C7 and methanol) conversion of about 25 %. To achieve higher conversions of the reactive olefins, a conventional multiple stage reactor plus separation design or some special reactor design is used. Two such special reactor designs were presented, the reactive distillation design and the side reactor design. The three designs are presented schematically in Figures 7 to 9.
Figure 7. Fixed bed reactor and distillation process [7].

32
Figure 8. Catalytic distillation process [7].
Figure 9. Side reactor process [7]. Technically all the three process designs were feasible giving about 130% equivalent TAME conversion (in catalytic distillation the case of high-separation-efficiency catalyst packing was used). The annual profit for the refinery producing 2.25⋅106 tons a year reformulated gasoline was calculated for each arrangement. The basis for the calculations was the case where all the oxygen content is achieved by adding purchased MTBE. The annual profit for this case was set to 0 dollars/year. The best profit (0.8 million dollars/year) was given by the side reactor arrangement. The profit for the catalytic distillation arrangement was also positive. The conventional fixed bed reactor and distillation design was economically not feasible. However, the profitability is very sensitive to the bulk chemical prices. Some important aspects were not taken into account in the economic evaluation. For example the vapor pressures for TAME and higher ethers are much lower than the vapor pressure of MTBE, which is a significant advantage.

33
The performance of high-separation-efficiency catalyst packing was simulated by placing 10400 kg of catalyst evenly on 13 ideal stages. In the case of low-separation-efficiency catalyst packing, 10400 kg of catalyst was placed on one ideal stage. As a result the equivalent TAME conversions for the high- and low-separation-efficiency catalyst packings were 130% and 120%, respectively. The profitability of the high-separation-efficiency catalyst packing was also better. The conversions of TAME, THEXME, and THEPME, and the resulting equivalent TAME conversions based on the oxygen content for the seven cases are given in Fig.10. The annual profit for each case is given in Fig.11.
Figure 10. Conversions of TAME, THEXME, and THEPME, and the resulting equivalent TAME
conversions (based on the oxygen content) [7]. The cases were: Catalytic distillation with high-separation-efficiency catalyst packing and no methanol recovery (CD1); Catalytic distillation with high-separation-efficiency catalyst packing and with methanol recovery (CD2); Catalytic distillation with high-separation-efficiency catalyst packing and no methanol recovery (CD3); Fixed bed reactor and distillation process with three secondary reactors (FB1); Fixed bed reactor and distillation process with two secondary reactors (FB2); Fixed bed reactor and distillation process with two secondary reactors but with higher amount of methanol recycled than in case FB2 (FB3); Side reactor process (SR1).
Figure 11. Annual profit for each case (prices June 1996) [7].

34
REFERENCES 1. Klemola, K.T., Tray Efficiency Prediction of an Industrial Distillation Column, Acta
Polytechnica Scandinavica, Chemical Technology Series, No. 250, Espoo 1997. 2. Klemola, K.T., Ilme, J., Distillation Efficiencies of an Industrial-Scale i-Butane/n-Butane
Fractionator, Industrial and Engineering Chemistry Research, Vol. 35 (1996), No. 12, 4579–4586.
3. Klemola, K.T., Ilme, J., Effect of Two-Pass Trays on Distillation Efficiencies, Chemical Engineering Technology, Vol. 20 (1997), No. 7, 478–484.
4. Ilme, J., Klemola, K., Calculation Methods for the Numbers of Transfer Units on Sieve Trays, Proceedings of the AIChE Annual Meeting, Los Angeles 1997, Session 34, 140–145.
5. Pyhälahti, A., Klemola, K., Bench Scale Experiments with TAME for the Comparison of Two Catalytic Distillation Packing Arrangements, Proceedings of the 2nd Nordic Symposium on Reactive Separation Systems June 6–7, Helsinki University of Technology, Espoo 1996, 101–111.
6. Jakobsson, K.E., Pyhälahti, A.J., Klemola, K.T., Optimal Catalytic Distillation Packing Arrangement for the Production of Ethers – Structure and Design, Proceedings of the 2nd Nordic Symposium on Reactive Separation Systems June 6–7, Helsinki University of Technology, Espoo 1996, 112–122.
7. Klemola, K.T., Combined Production of tert-Amyl Methyl Ether and Higher Ethers Using Catalytic Distillation, Proceedings of the 5th World Congress of Chemical Engineering Vol III, AIChE, New York 1996, 1071–1076.
––––––––––––––––––––––––––––––––––––––––––––––––––––––––––––––––––––––––––––––––– 8. Fair, J.R., Null, H.R., Bolles, W.L., Scale-up of Plate Efficiency from Laboratory Oldershaw
Data, Ind. Eng. Chem. Proc. Des. Dev. Vol. 22 (1983) No.1, 53–58. 9. Drickamer, H.G., Bradford, J.R., Overall Plate Efficiency of Commercial Hydrocarbon
Fractionating Columns as a Function of Viscosity, Trans. Am. IChemE Vol. 39 (1943), 319–360. 10. O’Connell, H.E., Plate Efficiency of Fractionating Columns and Absorbers, Trans. Am. IChemE
Vol. 42 (1946), 741–755. 11. Bakowski, S., Efficiency of Sieve-Tray Columns, Br. Chem. Eng. Vol. 14 (1969) No.7, 945–949. 12. MacFarland, S.A., Sigmund, P.M., Van Winkle, M., Predict Distillation Efficiency, Hydrocarbon
Processing Vol. 51 (1972), 111–114. 13. Rousseau, R.W., Handbook of Separation Process Technology, John Wiley & Sons, New York
1987. 14. Gautreaux, M.E., O’Connell, H.E., Effect of Length of Liquid Path on Plate Efficiency, Chem.
Eng. Prog. Vol. 51 (1955) No. 5, 232–237. 15. Kirschbaum, E., Distillation and Rectification, Chemical Publishing Co., New York 1948. 16. Williams, B., Begley, J.W., Wu, C., Tray Efficiencies in Distillation Columns, Final Report from
the University of Michigan, AIChE, New York 1960. 17. Lewis, W.K., Rectification of Binary Mixtures, Ind. Eng. Chem. Vol. 28 (1936), 399–402.
35
18. Maxwell, J.C., On the Dynamical Theory of Gases, Phil. Trans. R. Soc. Vol. 157 (1866), 49-88. 19. Stefan, J., Über das Gleichgewicht und die Bewegung insbesondere die Diffusion von
Gasgemengen, Sitzber. Akad. Wiss. Wien Vol. 63 (1871), 63. 20. Toor, H.L., Solution of the Linearized Equations of Multicomponent Mass Transfer, AIChE J.
Vol. 10 (1964) No. 4, 448–455. 21. Stewart, W.E., Prober, R., Matrix Calculation of Multicomponent Mass Transfer in Isothermal
Systems, Ind. Eng. Chem. Fundam. Vol. 3 (1964), 224–235. 22. Krishna, R., A Film Model Analysis of Non-Equimolar Distillation of Multicomponent Mixtures,
Chem. Engng Sci. Vol. 32 (1977), 1197–1203. 23. Krishna, R., Martinez, H.F., Sreedhar, R., Standart, G.L., Murphree Point Efficiencies in
Multicomponent Systems, Trans. IChemE Vol. 55 (1977), 178–183. 24. Krishnamurthy, R., Taylor, R., A Nonequilibrium Stage Model of Multicomponent Separation
Processes, AIChE J. Vol. 31 (1985), 449–465. 25. Toor, H.L., Diffusion in Three-component Gas Mixtures, AIChE J. Vol. 3 (1957) No.2, 198–207. 26. Dribika, M.M., Biddulph, M.W., Scaling-up Distillation Efficiencies, AIChE J. Vol. 32 (1986)
No. 11, 1864–1875. 27. AIChE Bubble Tray Design Manual, AIChE, New York 1958. 28. Gerster, J.A., Hill, A.B., Hochgraf, N.N., Robinson, D.G., Tray Efficiencies in Distillation
Columns, Final Report from the University of Delaware, AIChE, New York 1958. 29. Molnar, K., Eddy Diffusion Coefficient in Valve Tray Distillation Columns, Periodica
Polytechnica Mechanical Engineering Vol. 18 (1974) No. 2-3, 157. 30. Colburn, A.P., Effect of Entrainment on Plate Efficiency in Distillation, Ind. Eng. Chem. Vol. 28
(1936) No. 5, 526-530. 31. Chen, G.X., Chuang, K.T., Determining the Number of Gas-Phase and Liquid-Phase Transfer
Units from Point Efficiencies in Distillation, Ind. Eng. Chem. Res. Vol. 33 (1994), 907–913. 32. Higbie, R., The Rate of Absorption of a Pure Gas into a Still Liquid During Short Periods of
Exposure, Trans. Am. IChemE Vol. 31 (1935), 365–389. 33. Chen, G.X., Chuang, K.T., Prediction of Point Efficiency for Sieve Trays in Distillation, Ind.
Eng. Chem. Res. Vol. 32 (1993), 701–708. 34. Zuiderweg, F.J., Sieve Trays – A View on the State of Art, Chem. Engng. Sci. Vol. 37 (1982) No.
10, 1441–1464. 35. Sakata, M., Yanagi, T., Performance of a Commercial Scale Sieve Tray, IChemE Symp. Ser. Vol.
56 (1979), 3.2/21–34. 36. Yanagi, T., Sakata, M., Performance of a Commercial Scale 14% Hole Area Sieve Tray, Ind.
Eng. Chem. Proc. Des. Dev. Vol. 21 (1982), 712-717. 37. Dieter, K., Hundertmark, F.G., Zur Berechnung des Verstärkungsverhältnisses von
Rektifizierböden, Chem. Ing. Techn. Vol. 35 (1963), 620–627. 38. Harris, I.J., Optimum Design of Sieve Trays, Brit. Chem. Engng Vol. 10 (1965) No. 6, 377-381. 39. Hughmark, G.A., Models for Vapor Phase and Liquid Phase Mass Transfer on Distillation Trays,
AIChE J. Vol. 17 (1971) No. 6, 1295–1299.

36
40. Chan, H., Fair, J.R., Prediction of Point Efficiencies on Sieve Trays. 1. Binary Systems, Ind. Eng. Chem. Proc. Des. Dev. Vol. 23 (1984), 814–819.
41. Kuzniar, J., Kubisa, R., Pasko, Z., Stoffübertragung bei der Zweikomponentendestillation auf Ventilböden unter Berücksichtigung der Flüssigkeitsdurchmischung, Chem. Tech. (Leipzig) Vol. 29 (1977), 374–377.
42. Stichlmair, J., Die Grundlagen des Gas-Flussig-Kontaktapparates Bodenkolonne, Verlag Chemie, Weinheim 1978.
43. Chu, J.C., Donovan, J.R., Bosewell, B.C., Furmeister, L.C., Plate Efficiency Correlation in Distilling Columns and Gas Absorbers, J. Appl. Chem. Vol. 1 (1951), 529-541.
44. Welch, N.E., Durbin, L.D., Holland, C.D, Mixing on Valve Trays and in Downcomers of a Distillation Column, AIChE J. Vol. 10 (1964) No. 3, 373–379.
45. Halmu, A., Tislauksen prosessidynamiikka, Report No. 13, Kemian laitetekniikan laboratorio, Helsinki University of Technology, Helsinki (1976).
46. Hughmark, G. A., Point Efficiencies for Tray Distillations, Chem. Eng. Progr., Vol. 61 (1965), 97.
47. Weiss, S., John, L., Zur Stoffübertragung bei der Destillation in Bodenkolonnen, Chem. Tech. (Leipzig), Vol. 25 (1973), 658.
48. Koch, R., Koziol, A., Hydraulik und Stoffaustausch auf Siebböden mit Grossen Bohrungen, Chem. Tech. (Leipzig), Vol. 30 (1978), 449.
49. Koziol, A., Mackowiak, J., A New Method for Determining the Efficiency of Tray Columns with Downcomers, Chem. Eng. Technol., Vol. 15 (1992), 103.
50. Smith, L.A., Catalyst System for Separating Isobutene from C4 Streams, U.S. Patent No. 4,215,011, 1980.
51. Zheng, Y., Xu, X., Study on Catalytic Distillation Processes, Part I. Mass Transfer Characteristics in Catalyst Bed within the Column, Trans. IChEmE, Vol. 70 Part A (1992), 459-464.
52. Subawalla, H., González, J.C., Seibert, A.F., Fair, J.R., Capacity and Efficiency of Reactive Distillation Packing: Modeling and Experimental Validation, Ind. Eng. Chem. Res., Vol. 36, (1997), 3821–3832.
53. González, J.C., Fair, J.R., Preparation of Tertiary Amyl Alcohol in a Reactive Distillation Column. 1. Reaction Kinetics, Chemical Equilibrium, and Mass-Transfer Issues, Ind. Eng. Chem. Res., Vol. 36 (1997), 3833–3844.
54. González, J.C., Subawalla, H., Fair, J.R., Preparation of Tertiary Amyl Alcohol in a Reactive Distillation Column. 2. Experimental Demonstration and Simulation of Column Characteristics, Ind. Eng. Chem. Res., Vol. 36 (1997), 3845–3853.
55. Taylor, R., Krishna, R., Multicomponent Mass Transfer, John Wiley & Sons, New York 1978.