action pack v7 - european commission · 2017-05-16 · report documentation title ... project is a...
TRANSCRIPT

D5.2 ACTION PACK - ADDRESSING URBAN PTW ACCIDENTS
Principal Author: DGT & Altran

Report documentation
Title: Action Pack – Addressing Urban PTW accidents
Authors: Fernando Ruiz & Candelaria Medeiros (DGT), Fèlix Arnal (Barcelona Municipality), Steve Connolly & Andy Mayo (Transport for London), Marion Maestracci, & Julien Flageul (Mairie de Paris), Marco Surace (ARSM), Simon Hayes and Susana Serrano (Altran España), Veneta Vassileva, and Antonio Perlot ACEM), Marco Pierini, (University of Florence), Evi Germeni & Eleni Petridou (University of Athens)
Keywords: Road safety, local plans and planning, policy, traffic, injury, fatality, motorcyclist, powered two-wheeler, collision, statistics, urban road network, urban road accident, guidance for practitioners
Number of pages: 4+84
Version v7
Published by: DGT
Observatorio Nacional de la Seguridad Vial (ONSV), Dirección General de Tráfico C. Josefa Valcarcel, 44, Madrid, Spain
I
Foreword
The European Safer Urban Motorcycling (eSUM) project is a collaborative venture involving four of Europe’s principal motorcycling cities, industry and academic and research organisations. The purpose of the project is to contribute towards reducing injuries to powered two wheeler (PTW) users on urban roads.
PTWs, whilst providing flexible and economic personal transport, are vulnerable and carry a comparatively high risk of collision and injury. It is important that crowded urban roads are safe for PTWs to allow the maximum benefits of this mode of transport to be fully realised.
This Action Pack is intended to provide an easy-to-use template to help municipalities better understand their own PTW road safety problems, and to develop and implement remedial measures in a practical way, exploiting the Good Practice Guide that the eSUM project has assembled (TfL, 2009).
This Action Pack has been developed by eSUM partners that include the cities of Barcelona, London, Paris and Rome. It draws on their experiences in benchmarking urban PTW road safety, as well as their collective experiences in demonstrating effective counter-measures to common PTW collision types. Valuable contributions have been incorporated from other partners of the eSUM consortium – not only for specialist knowledge (on vehicle developments, on evaluation methods, etc.) but also in developing transfer relationships in Athens (University of Athens), in Florence (University of Florence) and incorporating PTW manufacturers’ views (ACEM).
The DGT participates in eSUM as a stakeholder representing national road administrations that – amongst others – carry the responsibility for coordinating local authority initiatives. In leading this work, the DGT would like to express its special thanks to the Municipalities of Athens, Florence and Malaga for their valuable feedback in verifying the utility of the guide.
On behalf of all those who have contributed to its development, I take this opportunity to invite all local authorities across Europe – and elsewhere where PTW urban safety is an issue – to use this guide and help to contribute to a safer and more sustainable urban mobility.
Signature
Anna Ferrer
Head of ONSV, the Spanish Road Safety Observatory, DGT.

II
Table of Contents
Foreword .................................................................................................................... I
Table of Contents ..................................................................................................... II
Executive summary.................................................................................................IV
1. Introduction................................................................................................... 1 1.1. EU PTW road safety situation......................................................................... 2 1.2. What is needed............................................................................................... 4
1.2.1. The process ...................................................................................... 5 1.2.2. Organization...................................................................................... 7
2. Necessary data sets ..................................................................................... 9 2.1. Data ................................................................................................................ 9 2.2. Sources......................................................................................................... 10 3. Analyzing the PTW casualty problem....................................................... 12 3.1. Contextual data............................................................................................. 12 3.2. Accident data ................................................................................................ 14 3.3. Evolution tables and graphs ......................................................................... 16 4. Identifying problems and causes and defining objectives..................... 18 4.1. Identifying problems...................................................................................... 18 4.2. Identifying frequent accident black spots...................................................... 19
4.2.1. Identification method-system .......................................................... 19 4.2.2. Studying black spots ....................................................................... 24
4.3. Defining objectives........................................................................................ 24 5. Selecting and planning interventions....................................................... 26 5.1. Selecting interventions.................................................................................. 26 5.2. Planning interventions .................................................................................. 33 5.3. Elaborating a plan......................................................................................... 35 5.4. Giving priority................................................................................................ 35 6. Implementing interventions and monitoring............................................ 38
7. Evaluating the actions................................................................................ 41 7.1. Evaluation criteria ......................................................................................... 42 7.2. Types of evaluation....................................................................................... 43
7.2.1. Formative evaluation....................................................................... 44 7.2.2. Summative evaluation..................................................................... 45
7.3. Evaluation methods ...................................................................................... 46
III
8. Conclusions ................................................................................................ 48
References .............................................................................................................. 49
Annex A: Analyzing data: examples ..................................................................... 50 A.1 Contextual data: examples ........................................................................... 50 A.2 Accident data: examples............................................................................... 54 A.3 Evolution tables and graphs: examples ........................................................ 59 A.4 Reporting example: Current Knowledge about Urban PTW Safety (report
based on MAIDS) ......................................................................................... 63 Annex B: CARE Glossary (Extract) ....................................................................... 65 B.1 Main definitions used .................................................................................... 65 Annex C: eSUM Action Pack Summary version .................................................. 75

IV
Executive summary
The European Safer Urban Motorcycling (eSUM) Action Pack is a guide to help politicians and municipal technicians responsible for road safety to organise their work for promoting Powered Two Wheeler (PTW) urban road safety. This document provides guidance to assist those municipalities interested in learning from eSUM when developing their own PTW Road Safety Action Plans.
If you are reading this document for the first time you are invited to read the 8-page summary (attached at Annex C) which has been written as an abridged version to allow practitioners to gain a first overview of the contents of these guidelines.
Chapters 2 to 7 identify the actions required to analyse PTW safety issues, decide upon suitable safety interventions and evaluate actions. This document will assist you in the following two areas:
As a guide; it presents a toolkit designed to be used independently by road safety practitioners. This can be used to identify the actions required to analyse PTW safety issues, and decide upon suitable safety interventions and
The use of this guide could result in the formulation of a PTW urban road safety action plan.
The guide provides practical examples of how PTW problems have been analyzed by the eSUM partners. Many of the examples are attached as annexes to facilitate the reading of the guideline concepts – these include analysis from the participating local authorities (of Barcelona, Paris, London and Rome) as well as findings from analysis of EU-level data. Examples relating to the definition of accident concentrations are reported within the main text.
The guide also references the Good Practice Guide and other documents developed by the eSUM project. The guide shows how the eSUM knowledge base can be used to elaborate an Action Pack by helping city practitioners to define the local context and to select and apply those good practices most appropriate to their own specific conditions.

1
1. Introduction
For many EU citizens the Powered Two Wheeler (PTW) offers affordable personal mobility and an alternative to cars for many urban trips. Figures provided by the Association des Constructeurs Europeens de Motocycles (ACEM) show an increase in the number of motorcycles on the roads over the last decade and indicate the potential for greater PTW use in the future: the PTW vehicle stock is estimated to comprise 33M vehicles, and is expected to reach 37M in 2020. Motorcycles are expected to grow by 29%, while mopeds will decline by 14% reaching 11 million units.
It is important to take account of growth in numbers and use when examining road accident trends. Compared to other modes of transport, PTWs have shown a slower progress with a - 14% fatalities reduction (for all types of PTWs) in a context of a +17 % fleet increase over the period 2001-2008 (IRTAD – EU-20 data). Indeed, it is the share of PTW fatalities that has increased in overall transport due to the better results achieved by cars. Motorcycle and moped riders, typically comprise 21% of the fatalities on urban roads.
No matter how much public transport is improved, there is likely to remain a demand for individual mobility which can be satisfied in many cases by the PTW.
It should be noted that the motorcycle offers advantages over the car when used in built-up areas. For example cars will never be able to compete with the motorcycles regarding manoeuvrability in congested traffic and the ability to park in small spaces.
In London, motorcycles are exempt from the City’s Congestion Charge controlling access to the city centre, adding to their attraction and recent allowance of PTW use of bus lanes will further promote PTW use.
In Paris, citizens discovered the usefulness of motorcycles during a public transport strike. French authorities explain that whenever there is a similar situation the sale of motorcycles rises.
In Madrid, the increase in the number of motorcycles during the last few years has been very significant.
Rome and Barcelona have the highest concentrations of motorcycles in EU cities, with a dense urban structure. The climate and the culture foster their increasing use.
Beyond Europe, there is a notable increase in PTW usage in cities – and this has generally been accompanied by a rise in PTW accidents. Motorcycles and mopeds are an integral element of transport strategy in the city of the 21st century. This has beneficial aspects but also barriers that need to be overcome, if the city is to fully realise the potential of the PTW.
The benefits offered by the motorcycle and moped in the urban environment are many:
economical use of the roadway;

2
minimising traffic congestion;
reduced use of parking space;
reduced gas emissions;
less cost per trip (against the car); and
speed of delivery.
Not everything is beneficial, however, with respect to the use of the PTW. The most important disadvantage is the high risk of injury of PTW riders and passengers when compared to other road users. Another issue is security as motorcycles and mopeds are more vulnerable to theft and vandalism.
1.1. EU PTW road safety situation
Among all modes of transport, road transport is the most dangerous, and Powered-Two Wheelers (PTWs) have the highest casualty rate of all modes.
Back in 2000, 1,300,000 collisions on EU 15 roads caused over 40,000 deaths and 1,700,000 injuries1. The direct and indirect cost, estimated at 160 billion euro, was equivalent to 2% of GNP of the European Union (EU 15)2.
For this reason, the 3rd Road Safety Action Programme was launched by the European Commission (in 2000), with the objective of halving the number of deaths on EU roads by the year 2010.
Certain population groups and some specific user groups are particularly affected and thus considered as vulnerable road users. Key groups are:
young people aged between 15 and 24 years (10,000 deaths a year);
pedestrians (7,000 deaths);
cyclists (1,800 deaths); and
PTW users with 5,500 lives lost per year.
1 European Commission/Directorate General Energy and Transport: “CARE - European Road Accident Database”, (1991-2007);
2 Report by Ewa Hedkvist Petersen on the Communication from the Commission to the Council, the European Parliament, the Economic and Social Committee and the Committee of the Region on “Priorities road safety – Progress report and raking of actions” (COM(2000)125 – C5-0248/2000-2002/2136(COS)), adopted by Parliament on 18 January 2001.02/2136(COS)), adopted by Parliament on 18 January 2001.

3
At the Pan-European level, PTW riders are twice as likely to be killed as the next most-vulnerable road-user (pedestrians), and their risk of being killed is twenty times that of car users.
The overall conclusion is that a serious problem exists, to which technology has yet to be fully adapted, and for which society needs urgent solutions.
EU DEATHS PER 100 MILLION PERSON KILOMETRES
Ferry 0,250
Air (civil aviation) 0,035
Rail 0,035
Road (Total) 0,950
Motorcycle/moped 13,80
Foot 6,40
Cycle 5,40
Car 0,70
Bus and coach 0,07
Table 1.1 Number of deaths per 100 million person kilometres in the EU (Source: European Transport Safety Council Transport Safety Performance in the EU a statistical overview. 2003)
Figure 1.1 Evolution of total fatalities and of motorcycle fatalities in EU20, 2001-2008. (Source: IRTAD)

4
For EU-20, up to 2008,
Figure 1.1 compares the consistent downward trend for all road users with the trends for PTW riders and for its component parts: motorcyclists and moped riders. Moped fatalities have been reduced – both in urban and rural areas - while motorcycle fatalities do not show the downward trend of the other road users.
Moped safety has improved. Between 2001 and 2008, there have been 41% less moped fatalities, an important reduction during years with little change in vehicle numbers. Moped riders have made the greatest achievements in terms of safety in comparison to all road users. Motorcycle rider fatalities have experienced a -1% decrease, however it must be highlighted that the MC fleet raised by +37% for the period 2001-2008.
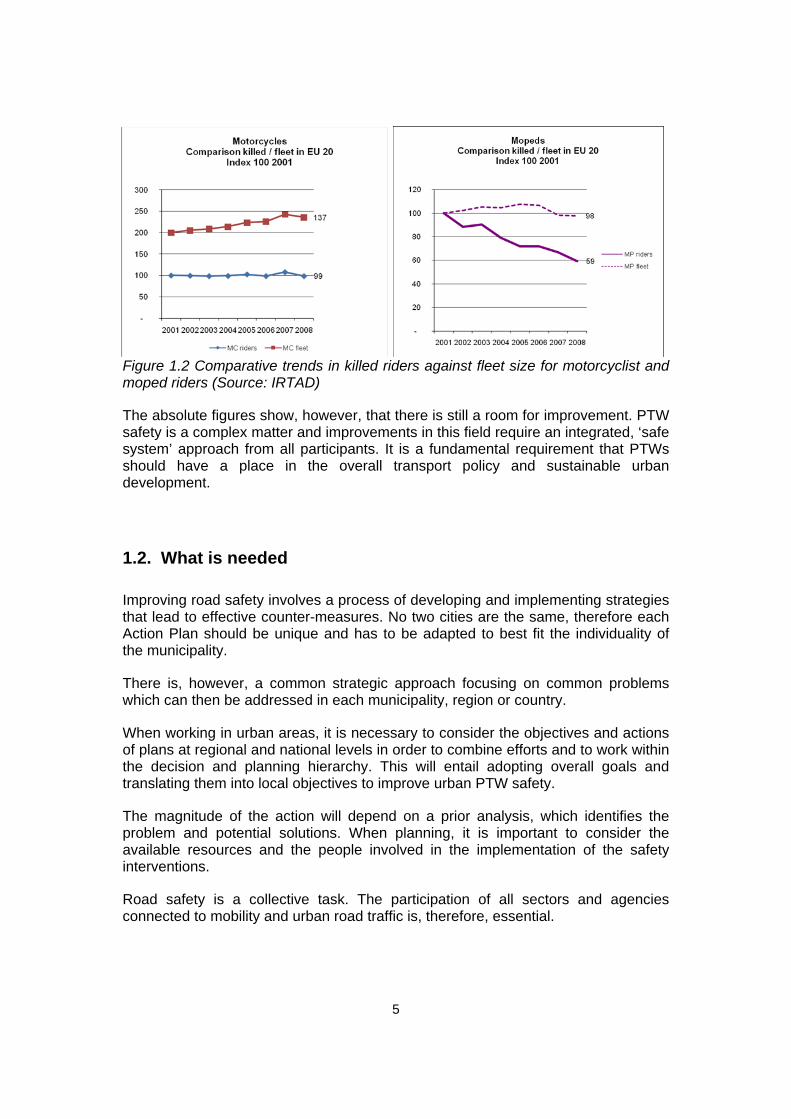
Considering the PTW situation in more detail it is seen that there is a significant increase in the motorcycle fleet (see Figure 1.2 ) whereas the moped fleet shows little change from 2001. When the fleet evolution is taken into account a relative improvement in motorcycle safety can be seen over the last decade.
5
Figure 1.2 Comparative trends in killed riders against fleet size for motorcyclist and moped riders (Source: IRTAD)
The absolute figures show, however, that there is still a room for improvement. PTW safety is a complex matter and improvements in this field require an integrated, ‘safe system’ approach from all participants. It is a fundamental requirement that PTWs should have a place in the overall transport policy and sustainable urban development.
1.2. What is needed
Improving road safety involves a process of developing and implementing strategies that lead to effective counter-measures. No two cities are the same, therefore each Action Plan should be unique and has to be adapted to best fit the individuality of the municipality.
There is, however, a common strategic approach focusing on common problems which can then be addressed in each municipality, region or country.
When working in urban areas, it is necessary to consider the objectives and actions of plans at regional and national levels in order to combine efforts and to work within the decision and planning hierarchy. This will entail adopting overall goals and translating them into local objectives to improve urban PTW safety.
The magnitude of the action will depend on a prior analysis, which identifies the problem and potential solutions. When planning, it is important to consider the available resources and the people involved in the implementation of the safety interventions.
Road safety is a collective task. The participation of all sectors and agencies connected to mobility and urban road traffic is, therefore, essential.

6
1.2.1. The process
The process begins with a strategic vision and local objectives, which must be aligned with national policies.
The transfer of resources of all types (information, knowledge, technological resources and finance) is fundamental to support the development of road safety policies at the local level.
The creation of working groups with representatives of the various levels of government is a practical tool to carry out this transfer of ideas, knowledge and priorities.
The process then requires an analysis of the scale and nature of the PTW casualty problem using accident data and other data sources that can identify risk exposure. The next step, with the strategic vision and local objectives in mind, is to define PTW objectives including casualty reduction targets.
For each problem or objective identified, a relevant intervention should be selected and, if the magnitude of the problem requires, a PTW Safety Action Plan should be developed.
It is important not only to monitor the effectiveness of the actions but also to learn from the process of developing the Action Plan. Monitoring allows decisions to be taken based on previous evidence and helps to finalise proposed new interventions.
Once the overall plan is implemented, it should be evaluated to assess its effectiveness and provide data for future planning. The process is cyclical with results from previous initiatives informing the development of future ones.
Figure 1.3 summarises the process of developing and implementing a PTW Safety Action Plan.

7
Local strategy and objectives
Identify problem
areas and define
objectives
Select interventions
and / or develop a
PTW safety plan
Implement interventions and monitor
Evaluate the interventions
or the plan
Analysis PTW problem
Figure 1.3 Planning process

8
1.2.2. Organization
The level of success of the measures largely depends upon the success in establishing a process for their initiation and development. The execution of a well-organised plan is crucial. The development of measures is, in itself, a project and as such, needs to be managed carefully.
One of the key factors is the involvement of the city’s political decision-makers. The support and leadership of political representatives is essential, as it is they who ultimately approve the actions within the strategy and the assignment of resources.
The collaboration and coordination of all the involved parties is crucial to successful intervention. As with most road safety issues, PTW problems are multi-faceted and many diverse organizations need to be involved.
Within each municipal administration, there are various departments such as infrastructures (town planning), mobility (or transportation), education, communication, etc. It is also important that the municipal informatics department be involved in the Action Pack development; at the least, they can help to centralise data sources, but almost certainly they can do more to improve the quality and quantity of data available. There are also external bodies who could be involved such as police and the health authority as well as associations representing the interests of users, citizens, victims of road accidents and professionals from the motor industry.
Key stakeholders could include:
The Emergency Services (Police, Fire, Ambulance);
Hospital Authorities;
Local Elected Representatives;
Motorcycle Rider Groups (National and Local);
Highway Engineers;
Education Providers;
City Planners;
Informatics services, and
Support groups for victims of road collisions.
Once the “stakeholders” have been identified, it is necessary to contact them to collect information, develop a consensus regarding the problems to be addressed and to interest them in participating in the project.
Through stakeholder meetings and, if the magnitude so merits, the creation of working groups, a consensus can be developed regarding problem diagnosis – as

9
well as for the formulation of strategies and their valuation. Consensus-building is a key aspect for the success of developing a PTW Action Plan.
In order to develop the work topics, the Project Team needs to be defined and it needs to be assigned resources in terms of materials and skilled and committed individuals.
A project that is under-resourced has little chance of being successful. When a project is planned with assigned resources, a clearer vision is achieved, and this helps to guarantee the correct development of the work.
The consensus effort aims to establish stakeholders’ commitments, and the effort expended should be more than offset by the accumulation of resources resulting from the negotiated commitments.

10
2. Necessary data sets
It is important to identify the ‘problem’ before deciding on the ‘solution’. To achieve this, it is necessary to ensure the reliability of the starting data and the applied methodological procedure. In the end, the evaluation of the final effect of the intervention will depend on the quality of this initial phase.
Each situation is unique, because all cities are different. Shape and size, demographic make-up, compactness or spread, social and economic activities distribution, road design and layout, vehicle fleet, transport habits, climate and recreational activities are all issues to consider. However, a common methodology is required to correctly identify the context, facilitate the correct selection of transferable good practice, and hence support comparative benchmarking studies that support the measures evaluation and the monitoring process.
The information listed above should allow the municipality to be described, to identify trends and to determine strengths and weaknesses from the viewpoint of PTW safety.
In this chapter we will present a data list and suggest possible sources. When developing its analysis, each city will need to identify what information is accessible and the source.
2.1. Data
There are two types of information required to assess the scale of the PTW casualty problem: Contextual data (giving the background to PTW use in the city) and Accident data (describing the collision issues). This is summarised below.
Contextual data:
General data: demographic data, social-economic data, town model (degree of compactness or spread), distribution of public space and road network (road design, road hierarchy, signposting and road markings);
Vehicles and mobility: vehicle fleet, mobility distribution by mode, driving habits, transport trends, available public transport, available parking; and
Safety actions: legislation, campaigns, legal changes and regulatory measures, enforcement.
Accident data:
Road accident data: location, data, time, weather, factors;
Vehicle data: type of vehicle, vehicle characteristics, vehicle state, vehicle manoeuvre leading to collision;

11
Casualty data: age, gender, severity of injury, injuries location and description; and
PTW user data: age, licence, experience.
2.2. Sources
There are several potential sources of data depending on national processes and responsibilities. Here we describe some of them:
Local administration
Local administration databases can provide a lot of data (demographic distribution, social-economic factors, distribution of space, road network, vehicle fleet, mobility...) but it is less common to find information about the road accidents.
Local Police information
In general, this is the primary source about the circumstances of the accident. In some countries the data includes fatalities which occur up to 30 days after the accident. In order to maximise comparability (avoiding factoring), it is the deaths which occur within 24 hours after the accident that are analysed.
The definitions for serious injury accidents are less standardised; whilst police data often considers any injury accident involving hospitalisation for more than 24 hours, the sources of hospital data can provide more extensive casualty classifications.
The coverage of less serious cases is very uneven and not all cases are registered, resulting in an under-reporting of casualties with slight injuries.
Death register
It is a good source for identification of road traffic accident fatalities but, in most cases, it does not have data about the accident (location, vehicles, circumstances...) and is difficult to link with a specific collision.
Emergency hospital information
This allows the seriousness and type of injuries to be known but does not provide information about the circumstances or the date of the accident. Data may be not computerized, and the link with vehicle data is problematic.
Hospital admissions
Information about the seriousness, type and progress of injuries can be found out from hospital admissions but, similar to emergency information, it does not provide information about the accident. In some cases, it could be very difficult to link admissions with road accidents.
Mobility and travel surveys

12
This provides information about risk exposure factors and associated indices. These types of surveys, when representative, have a high financial cost.

13
3. Analyzing the PTW casualty problem
Not all the figures have the same relevance or availability. For each type of data defined before (Chapter 2), there are differences in availability and in level of utility. So we can distinguish between essential (Basic data) and other that, whilst useful, is not so easy (or may be useful but very expensive) to obtain (Advanced data).
The basis of the initial analysis should be data for at least 5 years. With 10 years data, two 5-year periods could be analysed.
Available information is organised into 8 categories:
Three contextual sheets: General data, Vehicles stock and mobility, and Safety actions;
Four accident sheets: accidents, vehicles, riders and casualties; and
One sheet presenting trends.
Annex: A.1, A.2 and A.3 present some examples for data reporting.
Annex A.4 provides an example of improved knowledge generated by the urban analysis of the MAIDS database, which is further reported in eSUM Deliverable (ATAC, 2010).
3.1. Contextual data
Sheet1 General data Basic data:
• Surface (km2) • Population. • Road network length (km) • Number of junctions • Number of signalled controlled junctions
Advanced data: • City space distribution (km2): buildings, road space dedicated to vehicles, road space
dedicated to pedestrians, Green space • Population by age: 0-14, 15-19, 20-24, 25-29, 30-39,40- 49, 50-59, 60 or more • Road network distribution (km):
o Hierarchy: primary roads and secondary roads (km) o By use: bus lanes, bicycle lanes, pedestrian, other o By speed limit: high speed roads (+50km/h), zone 30 km/h, other
General data indicators Basic indicators:
• Density: Population / Surface • Kilometre road length per area (Km/SqKm) • Kilometre bus lane per area (Km/SqKm)
Advanced indicators: • Kilometre bus lane per area (Km/SqKm) • Kilometre bicycle lane per area (Km/SqKm)

14
Sheet 2 Vehicles stock and mobility Basic data:
• Motor vehicles • Motor vehicles-kilometres • Daily trips (internal + external)
Advanced data: • Motor vehicles by type: cars, lorry, van, motorcycles, mopeds and other • Motor vehicles-kilometres by mode: cars, lorry, van, motorcycles, mopeds and other • Daily trips (internal + external) by mode • Average age by type of vehicle.
Vehicles stock and mobility indicators Basic indicators:
• Motor vehicles per inhabitant (‘000) • Motor vehicle km per inhabitant (Km/person) • Motor vehicle km per motor vehicle (veh-km/vehicle) • Daily Trips per inhabitant (trips/person)
Advanced indicators: • Motorcycles per inhabitant (‘000) • Mopeds per inhabitant (‘000) • % Motorcycles and % Mopeds of motor vehicles • % Motorcycles trips and % Mopeds trips of all trips
Sheet 3 Safety actions Basic data:
• Communication campaigns (yes or no) • Training campaigns (yes or no) • Offences (number) • Controls: Alcohol controls (yes or no), Drugs controls (yes or no), Speed controls (yes or no),
Helmet controls (yes or no), Red light jumping controls (yes or no) and Other traffic controls • Red light jumping cameras (number) • Speed cameras (number)
Advanced data: • Communication campaigns: number and subject • Training campaigns (number of people) • Offences by type: alcohol, drugs, speed, helmet, red light jumping and others (like parking,
mobile phone, driving without licence or refusal to give way to a pedestrian) • Paid fines (number) • Alcohol controls: number and results • PTW alcohol controls: number and results • Drugs controls: number and results • PTW drugs controls: number and results • Speed controls: number and results • PTW speed controls: number and results • Helmet controls: number and results • Other offences3: number and results
Safety actions indicators
3 For example eSUM D5.1 investigates the problem of unlicenced riding.

15
Advanced indicators: • Speed controls per inhabitant • Speed controls per vehicle • Alcohol control per inhabitant • Alcohol controls per vehicle
3.2. Accident data
Sheet 4 Accident data Basic data:
• Injury accidents: total • Accidents by month of the year • Accidents by type of day: working day or weekend. • Accidents by hour: morning, afternoon or night. • Accidents by vehicle involved: car, lorry, van, cycle, motorcycle, moped and other • Accidents by type of road: primary road network or secondary network. • Accidents by type of accident: collision with vehicle, collision with fixed object, rear-end
collision, running over, overturned, fallen from moped, fallen inside the vehicle, other. • Location, including plan of site and description of layout • Injury accidents by factors: road in bad condition, alcohol, drugs, road sign in bad condition,
excessive speed.
Advanced data: • Accidents with at least one motorcycle involved:
o by type of day. o by hour. o by type of road. o by type of accident. o by factors: road in bad condition, alcohol, drugs, road sign in bad condition,
excessive speed. • Accidents with at least one moped involved:
o by type of day. o by hour. o by type of road. o by type of accident. o by factors: road in bad condition, alcohol, drugs, road sign in bad condition,
excessive speed.
Accident indicators Basic indicators:
• Number of injury accidents/ number of inhabitants (1.000 inhabitants). • Number of injury accidents / number of motor vehicles. • Number of injury accidents / number of vehicles – km.
Advanced indicators: • Number of PTW injury accidents/ number of drivers. • Number of PTW injury accidents / number of PTW vehicles. • Number of PTW injury accidents / number of PTW vehicles – km. • Risk zones. • Conflict zones (black spots).

16
Sheet 5 Vehicle data Basic data:
• Vehicles involved in an injury accident • Vehicles involved in an injury accident by type: car, lorry, van, cycle, motorcycle, moped and
other
Advanced data: • Motorcycles and moped involved in an injury accident by vehicle age • Motorcycles and moped involved in an injury accident by vehicle cc • Motorcycles and moped involved in an injury accident by vehicle manoeuvre leading to
collision: improper overtaking, changing lane without caution, disobeying traffic lights, disobeying other traffic sign, improper turn or without caution, undue care & attention, following too closely, disobeying pedestrian crossing facility, illegal turn or direction of travel, no give way on the right, mechanical problems, others and unknown
Sheet 6 PTW rider data Basic data:
• PTW riders/users involved in an injury accident.
Advanced data: • PTW riders involved in an injury accident by type of licence. • PTW riders involved in an injury accident by expertise (number of years with PTW licence). • Number of PTW riders. • Number of PTW riders by (years of driving) experience.
Riders indicators Advanced indicators:
• PTW riders involved in an injury accident / PTW riders. • PTW riders involved in an injury accident by years of driving experience/ PTW riders by
years of driving experience.

17
Sheet 7 Casualty data Basic data:
• Casualties: killed, seriously injured and slightly injured. • PTW casualties: killed, seriously injured and slightly injured. • Motorcycles casualties by injury level and:
o age group: : 0-14, 15-19, 20-24, 25-29, 30-39, 40- 49, 50-59, 60 or more. o gender. o by type of day. o by hour. o by type of road. o by type of accident. o by use of helmet
• Moped casualties by injury level and: o age group: : 0-14, 15-19, 20-24, 25-29, 30-39, 40- 49, 50-59, 60 or more. o gender. o by type of day. o by hour. o by type of road. o by type of accident. o by use of helmet.
Advanced data:
• Accidents with at least one motorcycle involved, number of casualties: killed, seriously injured and slightly injured.
• Accidents with at least one moped involved, number of casualties: killed, seriously injured and slightly injured.
Casualty Indicators Basic indicators:
• Mortality rate or personal safety: number of fatalities / number of inhabitants. • Fatality rate or traffic safety rates: number of fatalities / number of motor vehicles. • Fatality risk or traffic safety risk: number of fatalities / number of vehicles – kilometres. • Death rates: number of fatalities / number of injury accidents.
Advanced indicators:
• PTW Mortality rate or personal safety: number of PTW fatalities / number of riders.
3.3. Evolution tables and graphs
Sheet 8 Trends
Examples of tables and graphs

18
Year 2005 2006 2007 2008 2009
Basic data:
Population
Number of motorcycles
Number of mopeds
PTW fatalities
PTW seriously injured
PTW slightly injured
Motor vehicle km (million)
% PTW fatalities of all fatalities
% PTW seriously injured of all seriously injured
% PTW slightly injured of all slightly injured
% PTW of motor vehicles
Advanced data:
PTW Motor vehicle km (million)
PTW trips (internal+external) (million)
% PTW trips of all trips
Rates
Basic data:
PTW fatalities per million inhabitants
PTW fatalities per 100,000 vehicles
Advanced data:
PTW fatalities per million veh-km
PTW fatalities per million trips
Table 3.1 PTWs trends indicators

19
4. Identifying problems and causes and defining objectives
4.1. Identifying problems
If identifying road safety problems is the basis for defining objectives, then systematic information request and analysis is the fundamental starting point for identifying these problems. Only if the problem identification is based on a good-quality diagnosis, can the correct local objectives be defined – and hence ensure that the proposed actions are headed in the right direction.
The identification process is not only to detect safety problems, but also to recognise the underlining causes. The problems which affect urban road safety are normally of many different types and may have their origins in:
urban planning and design issues;
regulation;
road design;
police enforcement; or
cultural issues.
From the analysis of the PTW casualty data, it should be possible to identify common causation factors to assist in developing objectives and targets for the city strategy and to assist in selecting appropriate interventions. The data should identify:
Overall casualty trend, used to determine if PTW and all road user casualty rates are falling or rising;
Locations of clusters of PTW collisions (junctions, routes or areas), which can be identified using standard criteria and investigated to identify common factors which may be rectified by remedial action;
An assessment of time/day/date, weather or surface related causes, which can be undertaken on a city wide and location basis;
High risk groups, which can be identified by age, gender or vehicle type; and,
Other vehicle involvement, which can be assessed to provide an indication of collision causes and potential targeting data for any interventions.
This information is crucial to allow a city strategy to be developed and appropriate interventions to be selected. It is important to have an objective basis for the development of strategic objectives, together with the selection and evaluation of actions implemented to achieve these objectives.

20
Whilst it is impossible to make a complete list of problems and causes, some of the more common issues that are likely to be identified are:
Low rate of helmet use;
High number of PTW speed offences or high number of speed related accidents;
High number of PTW accidents related to red-light jumping;
Lack of riding abilities as a cause of high percentage of accidents;
Irresponsible riding present in a large number of accidents;
Young / inexperience riders casualties;
Older rider casualties;
Lack of visibility as a main factor;
Road surface condition;
Collisions with road furniture;
PTW and car collisions due to filtering between vehicles; and
Collisions between PTW and bus due to a lack of visibility.
4.2. Identifying frequent accident black spots
Increased road user safety could be made possible by identifying the most frequent accident black spots and introducing suitable safety interventions. Black spots are clusters of PTW collisions defined by national or local criteria (intersections or road-sections), where the most numerous accidents occur.
Identifying and analysing these areas is a priority, in order to achieve a global aim of reducing in number of casualties and their severity.
4.2.1. Identification method-system
Step 1- Quantitative and Spatial Analysis
A table should be elaborated with a classification of accidents at intersections and road-sections in descending order (all users included) and over a minimum time period of three years.

21
Location Period Number of accidents
Number of PTW accidents
Exterior ring road Passy-Molitor 2004-2006 57 33
Interior ring road Molitor-Passy 2004-2006 56 45
Place de la bataille de Stalingrad 2004-2006 47 32
Rd-Pt des Champs-Elysées 2004-2006 47 42
Interior ring road Orléans-Gentilly 2003-2005 46 39
junction Royale-Concorde 2003-2005 42 36
junction Carroussel-Tuilerie 2003-2005 38 19
Bd St-Michel 2004-2006 36 19
junction Concorde/Champs-Elysées 2003-2005 33 21
Avenue du Gal Leclerc 2004-2006 32 20
Avenue Frantz-Listz 2004-2006 31 28
Quai St Bernard 2004-2006 29 19
Quai de Bercy 2003-2005 28 17
Bd Bessières 2005-2007 24 13
junction Cours de vincennes-rue Dr A. Netter 2004-2006 24 12
junction Champs-Elysées / Lincoln 2004-2006 21 14
Faubourg St-Martin 2004-2006 20 14
junction Davout-Montreuil 2003-2005 20 12
Place de la porte de Passy 2004-2006 20 13
junction Av Pte Clignancourt / Bd Ney 2005-2007 18 9
junction Tolbiac-Italie 2004-2006 16 15
junction Convention-Vaugirard 2004-2006 16 11
Bd Voltaire 2004-2006 15 10
junction Longchamp-Dauphine 2003-2005 14 10
junction Rivoli-Marengo 2004-2006 14 13
junction Artois-Berri 2004-2006 13 4
TOTAL 757 520
Table 4.1 Example of table of accidents at intersections
22
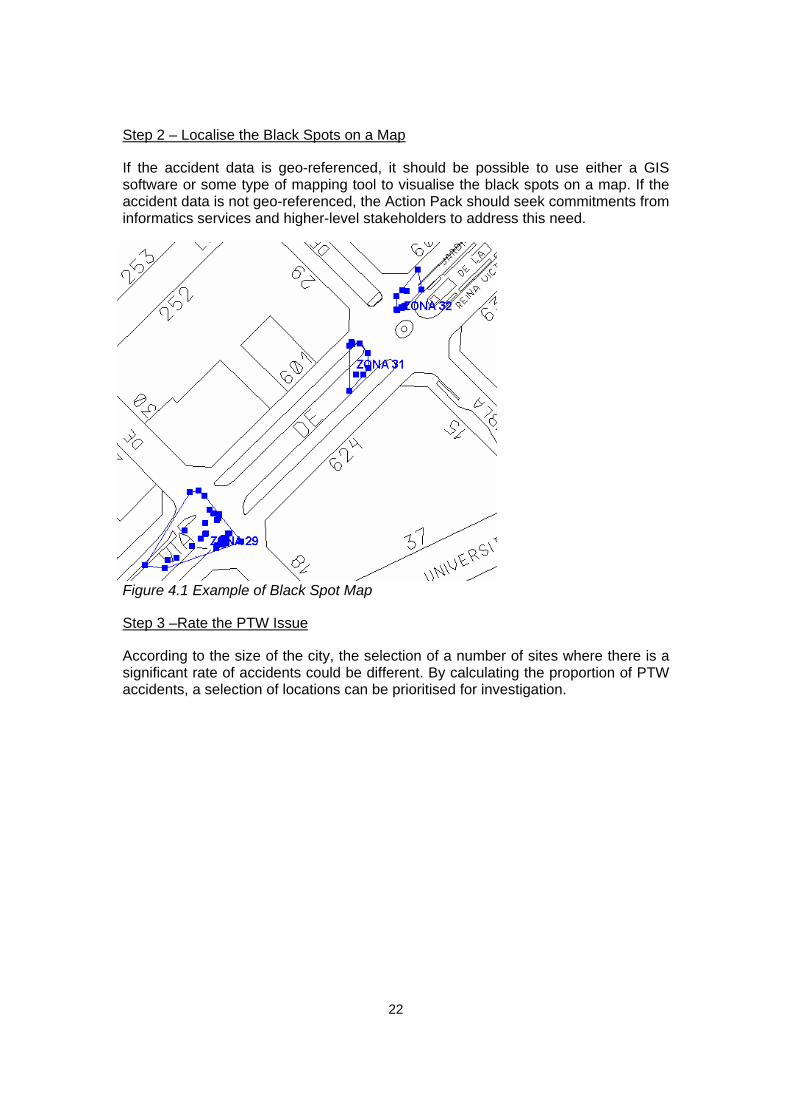
Step 2 – Localise the Black Spots on a Map
If the accident data is geo-referenced, it should be possible to use either a GIS software or some type of mapping tool to visualise the black spots on a map. If the accident data is not geo-referenced, the Action Pack should seek commitments from informatics services and higher-level stakeholders to address this need.
Figure 4.1 Example of Black Spot Map
Step 3 –Rate the PTW Issue
According to the size of the city, the selection of a number of sites where there is a significant rate of accidents could be different. By calculating the proportion of PTW accidents, a selection of locations can be prioritised for investigation.

23
0
10
20
30
40
50
60
0 20 40 60 80 100
Num
ber
of ro
ad a
ccid
ents
(al
l use
rs
incl
uded
)
Proportion of PTW’s involved
Sites of priority treatmentSites of priority treatment
Figure 4.2 Study for the Prioritisation of Black Spot Treatment

24
Location Period Number of accidents
Number of PTW
accidents
%PTW accidents
%PTW victims of all victims
junction Tolbiac-Italie 2004-06 16 15 93,8 77,8
junction Rivoli-Marengo 2004-06 14 13 92,9 85,7
Avenue Frantz-Listz 2004-06 31 28 90,3 85,4
Rd-Pt des Champs-Elysées 2004-06 47 42 89,4 78,8
junction Royale-Concorde 2003-05 42 36 85,7 79,6
Interior ring road Orléans-Gentilly 2003-05 46 39 84,8 84,9
Interior ring road Molitor-Passy 2004-06 56 45 80,4 79,1
junction Longchamp-Dauphine 2003-05 14 10 71,4 63,2
Faubourg St-Martin 2004-06 20 14 70 66,7
junction Convention-Vaugirard 2004-06 16 11 68,8 50
Place de la bataille de Stalingrad 2004-06 47 32 68,1 57,6
junction Champs-Elysées / Lincoln 2004-06 21 14 66,7 38,5
Bd Voltaire 2004-06 15 10 66,7 58,8
Quai St Bernard 2004-06 29 19 65,5 50
Place de la porte de Passy 2004-06 20 13 65 52
junction Concorde/Champs-Elysées 2003-05 33 21 63,6 52,4
Avenue du Gal Leclerc 2004-06 32 20 62,5 38,5
Quai de Bercy 2003-05 28 17 60,7 60,6
junction Davout-Montreuil 2003-05 20 12 60 56
Exterior ring road Passy-Molitor 2004-06 57 33 57,9 46,8
Bd Bessières 2005-07 24 13 54,2 50
Bd St-Michel 2004-06 36 19 52,8 37,8
junction Carroussel-Tuilerie 2003-05 38 19 50 29,5
junction Av Pte Clignancourt / Bd Ney 2005-07 18 9 50 33,3
junction Cours de vincennes-rue Dr A. Netter 2004-06 24 12 50 33,3
junction Artois-Berri 2004-06 13 4 30,8 23,8
Table 4.2 Example of table of accidents at intersections

25
Figure 4.3 Example of PTW Black Spot Map
4.2.2. Studying black spots
The different steps for studying each black spot are explained below:
Reading of road accident transcripts;
Step by step analysis: What are the main stages of the road accident?
Grouping of road-users involved and scenarios;
Identification of accident causes, and aggravating factors;
Identification of target road-users; and
Organisation of a technical visit of the site to observe behaviour and understand what happens in real-life.
The synthesis of all these steps leads to the definition of local safety aims.
4.3. Defining objectives
The primary objective of a local road safety strategy is to decrease the number and severity of road accidents for all road-users by remedying recurrent scenarios - and to do this without creating new problems. It must be noted, however, that it may not be possible to remedy all the problems.

26
When the problems and their causes have been identified, the local objectives will identify which aspects require a special treatment. Along this process, the national policy has to be considered. In so doing, a target user-group and/or a recurrent scenario have to be identified to prioritise local aims.
It is very important to use targets to focus effort towards key issues. It is better to select a few well-chosen groups of targets, rather than a large number of unachievable objectives. A few targets will focus the objectives, collect support and allow evaluation of the implementation compared to the original plan.
When setting the local targets, take care of some considerations:
Decide the period for the target. About five years in the future, allows the impact of local measures to be appreciated. If you chose a ten-year target, then you will need intermediate reviews (for example: three and six years);
Each target needs a leader, someone responsible to follow the target evolution and the associated measures ;
Identify the protagonists (organizations, persons, sectors,…) that may contribute to the target and involve them;
Decide the target value (the percentage change or the rate level) and monitor it. Progress should be monitored at least once a year. This will allow a review, if necessary; and
Develop a desired tendency to achieve the target. These may be in terms of three-year rolling averages, where possible. The comparison of real figures with the projections may give extra information.
Objectives could be qualitative or quantitative, but must be clearly defined and should look like:
Improve rate or percentage from baseline level to target level, by year, to achieve benefit and/or to improve upon objective.
For example:
Improve the helmet wearing level from 85% to 95% by 2010.

27
5. Selecting and planning interventions
5.1. Selecting interventions
Focusing on the casualty issues identified from the data, appropriate interventions should be devised. The eSUM Good Practice Guide (GPG) can help practitioners to select measures since it is a comprehensive database of case studies covering the full range of possible interventions. When selecting interventions, the following guidance should be borne in mind:
The interventions selected should be based on the identification of collision causation factors from the data and the objectives defined. It is important to distinguish between perceived problems and evident problems. Selections based on perceived problems are less likely to significantly contribute to targets;
Careful consideration of the potential interventions is required to ensure that they are both appropriate to the municipality and to the casualty problems identified. Review the effectiveness of past programmes or similar municipalities’ programmes, and check that the local context is similar to that of the good practice case example;
Selection will also be governed by the availability of resources and the consensus of the city’s working group with support from municipal authorities;
Prioritisation of measures will require development of a list of potential interventions followed by the completion of a cost-benefit analysis to identify those most likely to provide significant casualty reduction within the available budget. For the cost-benefit analysis
o Use casualties of five years, unless there have been major changes;
o Assume the national average savings for built-up areas, not those for interurban roads, nor the national average;
o Check other local similar savings and take them into account;
o Consider whole life cost (include maintenance); and
o Evaluate how long savings are likely to be sustained.
At the end, the list of measures / actions has to be checked in order to be:
well oriented to objectives;
well balanced: a mix of measures (training, awareness, enforcement, road design); and
28
evaluated by cost-benefit and time development.
The eSUM Consortium has agreed to maintain the GPG as a web-based resource beyond the termination of WP3. Additions have already been made to the English version, and translated versions are also available (links to these can be found via the project web-site (at www.esum.eu)). Further revision is being made to include the results of those demonstration actions realised in WP4 (Barcelona Municipality, 2010) that the Consortium consider to be further contributions to defined good practice.
The GPG has a search facility which can help the user to investigate the potential of different measures. Not all the cases give estimates of casualty reduction, but the aim is to incorporate as much information about casualty-reduction potential as possible. Together, these GPG functions can help practitioners make realistic estimates of the savings that need to input to the Cost-Benefit assessment described above.
The GPG initially set out to provide guidance on potentially successful casualty reduction projects based on 6 main themes:
Rider Training and Awareness;
Highway Features and Policy;
Targeted Enforcement;
Highway Remedial Measures;
PTW Design and Protective Equipment Design; and,
‘Softening’ the Highway Infrastructure.

29
Figure 5.1 Entry-page of the Good Practice Guide (www.esum.eu)
Table 5.1 presents the original 6 GPG themes re-ordered into 8 areas – Policy and Remedial Measures (blackspot programmes) are added in recognition of their importance for local plan development – and the “BP” (Best Practice) cases are assigned to each area.
At least one action should be drawn up and defined for the area of Policy. This should identify how the PTW Action Pack fits within the city’s overall Road Safety Action Plan. Within this context the practitioner needs to set out the specific objectives of the PTW Action Pack.
It is highly likely that overall Road Safety Action Plan contains an action area concerning Remedial Measures. In terms of the Action Pack, the practitioner needs to check that the procedures comply with the guidance set out in Chapter 4, and that Remedial Measures monitoring provides disaggregated results for PTWs (both motorcycles and mopeds).

30
Area Type Good Practice Guide
Initial training BP1: 2, 6, 18
Advanced training BP1: 1, 11
Simulation training BP1: 3
Rider Training
On-line training
Helmet campaign BP1: 5, 36
On-line campaign BP1: 4, 7, 8, 9
Young drivers campaigns BP1: 4, 9, 12
Car drivers campaigns BP1: 10, 21
Awareness
Other campaigns BP1: 8
Road design BP2: 3,7,11,12,13,16, 21
Mobility management BP2: 1, 2, 6
Highway Features
Marking design BP2: 20
Strategic Plan BP2: 9, 10, 17, 18, 21
Safety publications BP2: 4, 14, 15, 18, 19, 22
Policy
Other policy issues BP2: 8
Helmet BP3: 1, 5, 6, 11
Speed & Red light cameras BP3: 10, 12
General enforcement BP3: 2, 3, 4
Anti-social behaviour BP3: 4
Weekend enforcement BP3: 7, 8
Targeted Enforcement
Other BP3: 9
Black spots programme BP4: 1, 4, 8, 9, 10, 11
Black spot signing BP4: 3, 5, 7
Highway Remedial Measures
Other BP4: 6
PTW systems BP5: 1, 3, 4, 5, 7, 15, 17
ITS4 measures BP5: 6, 8, 9, 10, 11
ITS development BP5: 16,18, 19, 20, 21
Helmet BP5: 13, 14,
PTW design and Protective equipment
Equipment BP5: 2, 12
Street furniture BP6: 1, 2
Shared space BP6: 3
‘Softening’ the Highway Infrastructure
Barriers BP6: 4, 5
Table 5.1 Cases of the Good Practice Guide (v1) by areas of intervention
4 ITS: Intelligent Transport Systems

31
The number of actions that an urban authority will include in its plan will be limited by a number of factors (budget, availability of trained staff, etc.) such that the task of matching the possible solutions to the diagnosed problem can be expected to result in a design exercise where up to around ten measures are selected: the issue being how much of any one action is then “traded-off” against a possibly less-intensive implementation of another one.
Based on the experience of realising over 20 interventions across the four cities of the eSUM project, some further advice can be offered as to how practitioners might develop the matching between the diagnosed problem and the selection of actions from the comprehensive listing contained within the GPG.
The eSUM work on demonstrations was organised within four areas of action:
‘Infrastructure;
Enforcement;
Rider Training and Driver Awareness and
Vehicles & Protective Equipment.
With this approach actions to de-clutter / soften infrastructure (see also commentary in Chapter 6) are considered within the Infrastructure area, and the definition of infrastructure actions is taken to be the starting point. Infrastructure interventions are devised with respect to the defined hierarchy of roads and a systems approach to traffic management. The areas of Enforcement and User Awareness and then considered at two levels:
At the city-wide level
As complementary actions focussed upon specific elements of the highway infrastructure, supporting the respective highway measure.
The eSUM demonstration actions included the retrospective analysis of automated safety cameras (it was discovered that London had implemented far more of these than the other cities that were demonstrating this measure in the project – but had not evaluated the specific impacts of this measure upon PTW user involvement in accidents). All cities developing Action Packs are invited to consider making a retrospective analysis of actions undertaken over the previous five years that may have significantly influenced the trends in PTW accidents.
Some on-going actions may similarly be important for PTW safety, and the Action Pack measures should take full account of the efforts that the city is making in develop its overall transportation system. In the case of the eSUM demonstrations, the action to evaluate the impact of 30 zones on PTW safety was part of an implementation action initiated some years before eSUM – enabling appraisal work to start sooner than would have been the case had the measure been planned in isolation.
32
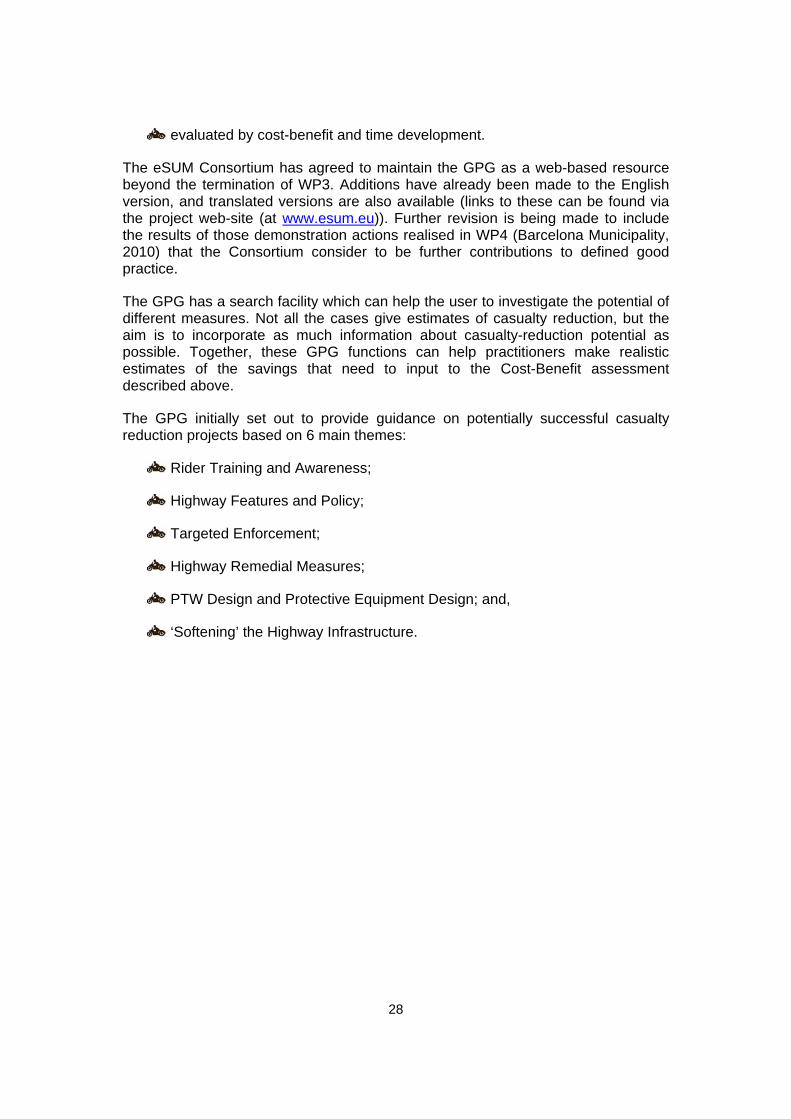
The following table provides some preliminary findings from the actions demonstrated in the eSUM project. With respect to selecting actions, it is the framework of the table – based on the hierarchical structure of the road network that is as important as the findings within the table. It has to be stressed that the figures presented are often from demonstration actions for which only limited After data is available: they are therefore still subject to change within their own context, Elsewhere in this document it has been stated that the results obtained in a given case report may not necessarily transfer to your city context - checks on transferability – lengths of types of road, motorisation levels, etc. should be made.
Nevertheless, the diagnosis (Chapters 2 to 4) will have identified whether the problems lie on local or primary roads, whether it is confined to a specific type of primary road or whether they are spread across the primary road types, etc. It is proposed that the practitioner then search for highway infrastructure solutions using the road type to search the GPG.
% reduction in Persons Injured
Local roads
Primary roads in general (with signalled junctions)
Primary roads with commercial activity ("High Streets")
Measure 30 zonesroundabouts (if space allows)
de‐cluttered road design
Allow PTW use
Ban PTW use
All modes ‐12% ‐80%PTWs ‐40% ‐ 20 to ‐40%Measure Exclusive ASLs
All modes ‐10%PTWs ‐4%
Measure speed cameras
All modesPTWs ‐30%Measure
MeasurePTWsMeasure
Primary roads with bus lanes
enforcement & awareness campaigns focussed on problematic conflicts
perceived 15% reduction by trained riders
see WP 2 report D2.2
(city‐wide) enforcement see D5.1
safer PTWs
rider training / driver awareness
Table 5.2 Accident reduction potential of some high-performing eSUM demonstrations (adapted from Barcelona Municipality, 2010)

33
The eSUM findings (Barcelona Municipality, 2010) suggest that cities often have a problem of PTW accidents in bus lanes – even if the regulations do not permit the use of such facilities by these vehicles. The GPG contains case studies covering both situations. If a city has a PTW problem in bus lanes, the practitioner needs to consider using complementary enforcement and awareness campaigns targeted to this infrastructure – possibly after making a more detailed study of the specific problems.
The accident reduction potential of infrastructure measures for signalled junctions on primary roads may be big – if there is space to convert to a roundabout – or maybe achieved at low-cost – if the PTW levels are high enough to justify PTW-only ASLs (Advanced Stop Lines). However, automated enforcement - based on speed cameras - appears to offer a more-generally applicable solution.
The selected infrastructure improvements need to be applied to the road network to determine how many roads / junctions are to be treated, and to come up with a first estimate of what the savings potential of these measures could be.
The diagnosis will also have determined what the level of helmet use is, and what other rider-related risk factors might be addressed by enforcement-based actions. In designing counter-measures, the practitioner will do well to remember that the road users’ perceived threat of being enforced is the key determinant to reducing risk – such that levels of control need to be combined with marketing campaigns, and the rotation of enforcement equipment and controls. For further information about how to estimate the savings potential of different types of enforcement action please refer to Deliverable 5.1 (University of Athens, 2010).
It has already been recommended that the Action Pack mix highway improvements with actions addressing enforcement, rider training and the promotion of safer makes and models of PTWs. Local authorities should consult and develop the Action Pack taking into account the support that can be obtained from higher-level authorities. The following example is given for enforcement – but support can also be found for other actions – such as awareness campaigns.
The package-approach is important because measures have to address the interaction between users of vehicles on roads infrastructure in a cycle of Education, Engineering and Enforcement – “the 3 Es”. Since highway improvements will be tied
CASE EXAMPLE: Helmet enforcement across Municipalities of the Southern regions of Spain
Smaller authorities may be tempted to discard options for strict helmet enforcement due to a lack of police resources – or to logistics difficulties associated with confiscating the vehicle – there are economies of scale if the higher‐level authority coordinates these actions over a region, and this can also lead to a more robust monitoring of the measure.

34
to specific locations the practitioner is also relying on the other measures to improve conditions over the rest of the road network. Furthermore, the Package has to be developed in collaboration with a range of stakeholders – and the activities of vehicle manufacturers, equipment suppliers and experts in communication are all part of harnessing local resources to resolve local problems.
5.2. Planning interventions
Once the objectives are defined and the actions selected to achieve them, it is time to detail the measures in order to assure the resources and to plan the action with a realistic timescale.
The resources have to guarantee not only the financing but also the appointment of the right staff; people who have the experience, the knowledge and the authority to implement, to monitor and to evaluate the action. Time for all this process should be assigned to staff. When considering the people involved, external agents should also be considered and their commitment is essential.
Under a single action name there should be as many activities or tasks as need to be done in order to achieve the main action. Each task needs a complete description, a person in charge (the one who coordinates the group), a list of groups or people involved (participants), a material list with schedule plan and an implementation period.
To determine the evolution of the actions undertaken as well as to monitor that the targets are being achieved, it is necessary to create a list of indexes or indicators which translate the trends into quantitative numeric values. Indicators allow the actions to be reviewed and evaluated and, if necessary, the opportunity to overhaul the plan.

35
Action Number Action name
Objectives • Objective from the target list • Objective from the target list • ...
Description General description with the task list. • Task 1: description • Task 2: description • Task 3: description • ...
Leader The leader is the person who has the overall responsibility for the success of the action, and encourages the group to achieve the targets.
Budget Cost analysis, done at the selection process
Benefits Savings analysis, done at the selection process
Indicator Initial value Target
Indicator 1
Indicator 2
Indicator 3
Indicators
Indicator 4
Task Person in charge Actors Implementation period Material resources
Table 5.32 Control action sheet
The indicators should be easy to calculate, provide real information and should be able to be compared with other municipalities. Their design must facilitate the action evaluation; otherwise, they will become figures without real significance and the measure could be out of control. A list of indicators for the analysis of the PTW casualty problem, are described in chapter 3.
As part of the planning process, an initial value should be calculated, as well as defining a target value.
For each action, a control sheet should be made. It should include the objectives addressed, the cost-benefit analysis, the description, the detailed planning, the indicators and, for each task, the personnel involved and their role, the schedule and the material resources needed.

36
5.3. Elaborating a plan
Until now, this document presents a general process. If a municipality does not want to elaborate a Safety Plan, it could work just one phase (analysis, definition, selecting or planning). In this section, the document structure and contents of a PTW Urban Safety Plan, are described.
A PTW Urban Safety Plan is a document that collects the all current outputs described, but also contains the method of monitoring and evaluating the interventions - this will be described in subsequent chapters.
When developing such a Plan, it is essential to prioritise activities - resources, economical and human time, are limited. It is imperative, therefore, to rationalise resources in order to deliver the Safety Plan.
The chapters of a Plan are:
Introduction: describes the motivation and presents the document structure;
Present situation: includes the contextual data, the accident data and the conclusions (identification problems and causes);
Objectives of the plan: presents the action areas and the objectives of each one. The objectives should be fully defined WHAT RATE, WHICH LEVEL, TIME TO ACHIEVE, BENEFITS;
Measures of the plan: for each action area the list of actions with all action sheets; and
Monitor and evaluation methodology: describe the process to be used, in order to monitor and evaluate the actions and the plan - specific key indicators must be considered, when monitoring interventions and evaluating the plan.
5.4. Giving priority
After planning each action, a general calendar should be developed in terms of financial resources and human efforts. It is not always advisable to start all measures at the beginning of the proposed actions, or even at the same time. It is better to focus efforts and resources in a few actions and, when they are implemented or at an advanced stage, start another group. So, it is necessary to prioritize the measures.
The process to give priority could be done with a simple criterion or based on a multi-criteria analysis. The second option provides a more complete process, but it is not usual. The main tasks being:
Define the criteria set;

37
Give weight to each criteria, the sum of all weighs has to be 100%;
Order each measure, for each criterion. That is, the most relevant action will be numbered “one”, the second numbered “two”, etc.. You will have as many lists as criteria;
Calculate the priority of each action: multiply the order number by the criteria weight;
Select 30-40% of the actions and balance the selected list in order to address all of the action areas. Some actions, therefore, may not be included on the list, and new ones could be added. This balance should be reached by consensus of all relevant stakeholders.

38
Action Target oriented
(30%)
Feasibility (30%)
Resources (20%)
Consensus (20%)
Total score
Order
Road Safety. in motorcycle. Test 4 5 4 5 4.5 1
Progressivity 1 4 2 13 4.5 2
Motorcycling with Car licence 7 6 5 1 5.1 3
Driver’s minimum age 3 3 1 22 6.4 4
Use of the helmet 2 8 8 12 7.0 5
Driver Awareness campaigns 21 2 12 9 11.1 6
Courses for professionals 11 10 14 15 12.1 7
Rider Behaviour campaigns 27 1 11 8 12.2 8
Recidivist drivers 22 13 6 10 13.7 9
Control of equipment 20 14 20 7 15.6 10
PTW Enforcement 24 9 10 21 16.1 11
Motorbike visibility 9 11 26 27 16.6 12
Mobility vs. Sports 17 17 9 24 16.8 13
Safety fences 28 16 16 3 17.0 14
Traffic segregation 5 23 27 17 17.2 15
Road Sections with Accident Concentrations 6 18 33 19 17.6 16
Incentives for courses 14 19 25 14 17.7 17
Better road preservation 8 25 35 4 17.7 18
Better adherence to road 18 20 30 2 17.8 19
Sanctioning scheme 25 15 3 26 17.8 20
Road safety education 23 7 22 23 18.0 21
Insurance premiums 19 24 15 11 18.1 22
Labour risk plans 26 12 18 16 18.2 23
Intersections 12 22 34 6 18.2 24
Road safety audits 15 21 19 18 18.2 25
Safety systems 13 26 21 32 22.3 26
Fostering research 10 27 23 33 22.3 27
Media 34 29 7 20 24.3 28
Course follow-up 31 30 13 25 25.9 29
Time for assistance 16 32 32 28 26.4 30
EuroNCAP for motorbikes 29 28 24 34 28.7 31
Additional equipment 33 34 17 30 29.5 32
Vertical signposting 30 31 31 35 31.5 33
E-Call 35 33 28 29 31.8 34
Research on equipment 36 35 29 31 33.3 35
Vehicle acquisition incentives 32 36 36 36 34.8 36
Table 5.43 Example: Spanish Strategic Plan for the Road Safety of Motorcycles and Mopeds priorities.

39
6. Implementing interventions and monitoring
It is important that interventions are effectively and consistently managed with a continuing focus on monitoring the results. To facilitate this, a named individual should be responsible for the project management of implementation of each action. The individual selected should have appropriate skills and experience, together with access to sufficient resources to enable the intervention to be fully implemented.
There should be support from the municipal authorities, including elected representatives and the working group. Stakeholder organisations, should provide advice and support during implementation.
Interventions selected from the Good Practice Guide should be suitably modified to ensure that they are appropriate to national conditions. Cultural, infrastructure, climatic and regulatory issues should be considered. The eSUM Demonstrations report (Barcelona Municipality, 2010) identifies various actions where important variations are observed (examples include different casualty impacts with red-light cameras in London, Barcelona and Rome, different regulatory starting points for trialling Advanced Stop Lines, cost variations for rider training courses with/without the involvement of police trainers, etc.).
Casualty data may be available at monthly or quarterly intervals to allow regular monitoring of the effects of the action. The identification of a ‘control’ should be considered to assess comparative performance and allow for other variables such as weather, changes in the infrastructure or regulations that should be taken into account.
Sufficient resources should be in place to ensure that implementation can be completed as intended and monitoring completed over the following 3 years, to allow a robust, accurate evaluation of the interventions to be made. As a minimum a ‘baseline’ should be established based on at least 3 years’ data. The effectiveness of the intervention will be assessed through a comparison of the baseline with data for 3 years following implementation. This ‘before’ and ‘after’ data should provide the basis for final evaluation. As described in Chapter 5, there is benefit to be gained from including implementation actions already in progress that are relevant to the improvement of PTW safety.
For highway engineering schemes, this should be a relatively simple process which can be adjusted to reflect changes in PTW use over the period. This can be achieved by expressing the casualty data as a rate per unit of time and applying indices to account for changes in the number of vehicles in the fleet or by using average kilometres ridden (if available).
For enforcement, awareness or training projects, monitoring may be enhanced by attitude surveys amongst the target group or by an assessment of the retention of skills taught during the training. For enforcement, counts from control equipment should be included in the action assessment. Observations of risk can also be important for new highway improvements – for early assessment before sufficient accident data becomes available, in order to progress from a pilot stage to larger-

40
scale implementation. Evaluation will, however, primarily rest on changes in casualty rate for the intended audience.
Practitioners who use the GPG as a tool to select potential interventions will quickly gain an appreciation of the extent to which the effectiveness of different types of measures have been documented. eSUM has been able to centralise a significant amount of information about measure effectiveness – and has enlarged the knowledge base as a result of demonstration activities within the project. It was originally anticipated that guidance would also cover cost-effectiveness of the different measures. Whilst the GPG includes cost information wherever possible, it is not possible to offer guidance regarding the comparative value-for-money of different measures. In principal it is interesting to compare highway infrastructure interventions that are very costly (eg. street re-furbishment) with those that are low-cost (e.g. those based on lane marking changes). At this stage of development, however, it is intended that the safety effectiveness of different schemes is comparable, and that the clarification of costings be a subject that the tool user investigates for him/herself (possibly using other EU project sources such as ROSEBUD5).
Based upon the demonstration activity carried out within the eSUM project some additional considerations can be presented to guide implementation work:
• Urban re-development schemes: The positive results achieved with de-cluttered designs of High Streets (see Table 5.2) are obtained with by interventions that radically alter the street design; these interventions involve complete street refurbishment and are very costly. The practitioner responsible for developing the PTW Action Pack is not going to have at his/her disposal the kind of budget for such schemes. What need to be checked is whether developers’ proposals for urban re-development coincide with corridors having a high concentration of PTW accidents – so that this type of solution could be introduced as part of the re-development proposal.
5 See http://ec.europa.eu/transport/road_safety/specialist/projects/index_en.htm
CASE EXAMPLE: Monitoring movements of risk can facilitate implementation decisions when only limited accident data has been accumulated
The report evaluating the original 3 Advanced Stop-line sites in Barcelona was assessed in terms of observations of movements involving risk – together with accident data available for the 6 months of the trial. Additional sites were implemented on the basis of these preliminary results – generating a larger action that could be subject to a more robust evaluation within the timescale of the eSUM project.
Source: eSUM Good Practice Guide

41
• Removing physical obstacles: The concept of de-cluttering the road space can also be applied at other levels. Rome’s demonstration included the removal of 35km of bus lane separators (physical barriers that had caused 6 PTW accidents in the four-year Before period); these were substituted by discs (known within the project as “frisbees”) that mark the bus lane and advise the motorcyclist of the separation without impeding the vehicle from changing lane. Checking for, and devising actions to remove, physical obstructions is something that practitioners are encouraged to do – even before considering infrastructure solutions with respect to the road network hierarchy (see Chapter 5).
• Implementing automated safety cameras: It takes a long time to implement red-light enforcement cameras. So, although this measure shows substantial effectiveness for the limited sites implemented, practitioners may find it easier to convince their police colleagues (and other actors) to implement speed cameras on those approaches identified from the analysis of the accident collisions.
• Rider training: Whilst the GPG provides a classification based upon rider entry level, the demonstration activities have addressed the issue of ensuring a high levl of course participation. It was found to be beneficial to develop training courses as part of the mobility management plans of large workplaces (classified in the GPG area of Highway Features).
Annual assessments of accidents should be made and, should any intervention appear to be failing, the action should be reviewed and modified if necessary. Conversely, any action that is proving highly successful should be examined to see if the implementation can be finalised more quickly (and/or applied more extensively). Monitoring of indicators describing the implementation of the measures should be realised on a quarterly basis – especially for those measures involving the collaboration of various participants / departments.

42
7. Evaluating the actions
The effectiveness of the programme of measures implemented should be assessed using the monitoring framework described in Chapter 6. This will provide a comparison with ‘before’ and ‘after’ data and indicate probable effectiveness of the action.
The casualty data can be expressed as a rate against the number of PTWs in the fleet (see Figure 7.1) or the distance ridden – so as to allow for changes in the vehicle stock and/or usage.
Figure 7.1 Evolution of the ratio of PTW fatalities / numbers of PTW vehicles, EU-20 (IRTAD)
A brief report should be completed detailing the process of data gathering and analysis, the identification of casualty problems, together with the selection and implementation of interventions. This report should include a summary of the implementation process and formative monitoring results.
The quantitative results should be reported to indicate how the casualty data has evolved since implementation. A qualitative assessment of the intervention should also be included outlining any problems with implementation or evaluation and also highlighting any lessons learned.
In general, evaluation refers to the process of determining ‘significance’ or ‘worth’, usually by careful appraisal and study.
The term ‘programme evaluation’, refers to the systematic application of research procedures to assess the conceptualization, design, implementation and utility of a

43
programme6. Basically, it is used to determine whether a programme was successful in meeting the goals and objectives for which it was developed, as well as to identify aspects of the programme that worked and others that did not, in order to inform policy and guide future planning.
Evaluation is an important process and should be included as an integral component of the programme planning, since it improves the probability of creating a successful program -by prompting to set specific goals and measurable objectives- and enables to understand the impact of the programme.
5 Important Reasons to Evaluate: 1) To determine the effect of measures taken 2) To determine their impact 3) To guide future planning 4) To inform policy 5) To compare benefit to cost
Table 7.1 Important reasons to evaluate
7.1. Evaluation criteria
Establishment of clear and concrete evaluation criteria allows to determine exactly which aspect(s) of programme functioning we want to evaluate. Principal evaluation criteria include:
Effectiveness: The extent to which programme objectives were achieved, taking into account their relative importance.
Impact: Positive and negative, intended or unintended long-term results produced by the programme, either directly or indirectly.
Relevance: The extent to which programme objectives are consistent with target group needs, organisational priorities and/or countrypolicies.
Efficiency: A measure of how economically inputs (funds, expertise, time,etc.) are converted to outputs.
Sustainability: The continuation of programme benefits after the completion of the program.
Adequacy: An assessment of the adequacy and timeliness of inputs inrelation to carrying out the activities.
6 Valente TW (2002). Evaluating Health Promotion Programs. New York; Oxford University Press.

44
Appropriateness: The extent to which the programme is tailored to the needs of the target population.
Preparation and design:
An assessment of the process by which the programme was identified and formulated, and the logic and completeness ofthe resultant programme design.
Partnerships and coordination:
The appropriateness of the partnerships which have been established with governments, NGOs7 and agencies, the effectiveness with which these partnerships have beenmanaged to support achievement of objectives.
7.2. Types of evaluation
There are many different types of evaluation depending on the action being evaluated and the purpose of the evaluation.
The formative/summative dichotomy is probably one of the simplest and most useful ways for classifying evaluation activities. Based on this, an evaluation can either be formative or summative, notably it can either assess a programme while its activities are still on-going (or even before its activities begin) or focus on the worth of a program based on its outcomes. In Table 7.12, we have used the formative/summative dichotomy in order to present the most common types of evaluation:
Evaluation Category
Implementation Phase
Evaluation Type
Comments
Pre-programme planning phase
1. Needs assessment
It determines who needs the program, how great the need is and what might work to meet the need. Formative
Implementation phase 2. Process evaluation
It assesses the design and implementation of the programme.
3. Impact evaluation
It investigates the short-term effects or benefits of a programme (e.g. changes in attitudes).
4. Outcome evaluation
It assesses whether the long-term goals of the programme were met (e.g. changes in mortality).
Summative Post-implementation phase
5. Economic evaluation
It determines whether the programme was a cost-effective investment as compared to other programmes.
Table 7.1 Common types of evaluation
7 NGOs: Non-Governmental Organisations

45
7.2.1. Formative evaluation
Needs assessment
As explained earlier, needs assessment is typically a stand-alone procedure, preceding the process of program planning and aiming to identify and address needs. It commonly asks these sorts of questions:
What are the main problems/weaknesses/deficiencies?
What are the advantages/strengths/opportunities?
How can we bridge the gap between a current situation and a desired condition?
In short, needs assessment identifies who needs the programme and how great the need is. Yet, in a broader context, it could prove useful for learning more about our target population and inventing possible ways to meet its needs.
Process evaluation
Process evaluation takes place during the implementation phase of a programme and is used to determine whether all programme activities are being carried out as planned. The great advantage of this type of evaluation is that it helps to identify
CASE STUDY: Exploration of perceived barriers to helmet use among adolescents in Greece
A qualitative study was conducted consisting of 12 focus groups with 70 PTW users, aged 15‐18 years. The objective was to explore perceived benefits and barriers to helmet use, in order to guide the development of a school‐based helmet promotion program. Results of the study suggested that students reporting frequent helmet use were characterized by a high perceived threat of a road traffic injury, which was associated with both prior experience of an injury and receiving information on helmet wearing from “significant others” (e.g. family, friends). On the contrary, students reporting helmet non use were characterized by a low threat perception, possibly attributed to adolescent egocentrism and accompanying feelings of invulnerability or to lack of knowledge and experience in risk identification. A sharp contrast was noted regarding the most important perceived benefit of helmet use, expressed among users as “protection in case of a road crash”, whereas among non‐users as “avoiding tickets from Traffic Police”. Main barriers to helmet use, as identified by non‐users, included: low perceived efficacy of helmets; peer pressure; lack of appropriate information on helmet use; high helmet cost; lack of convenience; vision and hearing disturbance; as well as beauty and style reasons.
Source: Germeni E, Lionis C, Davou B, Petridou E. Understanding reasons for non‐compliance in motorcycle helmet use among adolescents in Greece. Injury Prevention 2009;15:19‐23.

46
problems in the early phases of the programme and, thus, it allows necessary revisions before the complete effort goes forward. It involves seeking answers to questions such as:
Has the programme reached the target population?
Are all activities going as planned?
Are the participants and other key persons satisfied?
Are all materials produced of good quality?
What means of communication were used?
What kind of supportive activities were carried out?
Are revisions to the initial planning required? If yes, what kind of revisions?
7.2.2. Summative evaluation
Impact evaluation
CASE STUDY: Process evaluation of a rider training intervention in Australia
A process evaluation was undertaken to inform further refinement of the Three Steps to Safer Riding programme, which was developed to address risk taking behavior by riders as an adjunct to existing skills‐based rider training. The intervention was piloted over a three month period with 518 learner riders. Two forms of qualitative data were utilized: a) individual interviews with four riding instructors and the Chief Instructor that were all involved in the delivery of the intervention; and b) three focus groups and one semi‐structured interview with participants of the intervention (n=18). Results of the process evaluation revealed that, although absolute novices embraced and internalized many of the intervention concepts, riders who had previous riding experience stated that these issues were common sense and expressed riding styles that were contrary to some of the key intervention messages. Moreover, the instructors appeared to have embraced the intervention concepts and were supportive of the need to introduce new training content to address risk taking.
Source: Rowden P, Watson B, Wishart D, Schonfeld C. Changing motorcycle rider safety attitudes and motives for risk taking: process evaluation of a rider training intervention. In: Proceedings of the 2009 Australasian Road Safety Research, Policing and Education Conference: Smarter, Safer Directions, 10‐12 November 2009, Sydney Convention and Exhibition Centre, Sydney, New South Wales.

47
Unlike process evaluation, impact (or intermediate) evaluation takes place at the end of the programme and focuses on the programme outcomes. Its purpose is to investigate the short-term effects or benefits of the programme, whereas it commonly addresses factors which are considered to be linked to longer-term outcomes. For instance, impact evaluation for a programme aiming to increase helmet wearing rates could investigate changes in riders’ attitudes towards helmet use, improvements in knowledge or even expressed intentions of the target population.
Outcome evaluation
Outcome (or long-term) evaluation is probably the most desirable type of evaluation, since it investigates whether the long-term goals of the programme were met. It usually focuses on health status, injury (morbidity), death (mortality) and/or systems changes: Have traumatic brain injuries been reduced? Have helmet wearing rates been increased? Unfortunately, outcome evaluations are often impossible because they are costly and involve extended commitment.
Economic evaluation
Economic evaluation is often necessary to demonstrate ‘value for money’ and determine whether a programme was a cost-effective investment as compared to other programmes. The most common forms of economic evaluation are cost-effectiveness analysis (CEA) and cost-benefit analysis (CBA).
7.3. Evaluation methods
After clarifying what should be evaluated and why, the next step would be to decide on how the necessary data for the evaluation can be collected and analyzed. When referring to the term ‘data’, most people think about numerical information and statistical tables. Yet, data may also include words and descriptive narratives. In order to depict the differences between types of data and methods used for data collection, the terms ‘quantitative’ and ‘qualitative’ are used.
Quantitative data are observations that can easily be represented numerically, such as answers to structured questionnaires. Quantitative approaches to evaluation
CASE STUDY: Cost‐benefit analysis of the California motorcycle helmet law
Researchers from US analyzed the effect of California’s motorcycle helmet law on injury costs. An economic evaluation was performed using state hospital discharge data, county‐level cost data and statewide crash reports to estimate the costs, charges and lost productivity from motorcycle injuries. The mandatory helmet law that took effect in 1992 resulted in net savings to society of $258 million in 1992 and $292 million in 1993.
Source: Max W, Stark B, Root S. Putting a lid on injury costs: the economic impact of the California motorcycle helmet law. Journal of Trauma 1998;45:550‐556.

48
focus primarily on measuring a finite number of specified outcomes, on aggregating and comparing measurements. Techniques often used in quantitative approaches are experimental designs and employment of control groups. For instance, if the objective is to investigate the impact of a motorcycle safety programme on novice riders’ attitudes and practices, a randomized controlled trial could be conducted to measure changes in the intervention and the control group after the intervention, as well as between the two groups.
Qualitative research, on the other hand, seeks answers to questions about the ‘what’, ‘how’, and ‘why’ of a phenomenon; its primary aim is to explore, rather than measure. Specific techniques include: in-depth interviews, focus groups and participant observation. Although qualitative data cannot easily be summarized in numerical terms, they are extremely helpful as they can provide an in-depth understanding of an issue (e.g. why the intervention failed to meet its objectives). Qualitative methods are mainly used for formative evaluations. If, for example, the objective is to ensure clarity and appropriateness of messages among the target population, focus groups would be the most appropriate method. Table 7.3 summarizes main differences between quantitative and qualitative research methodology.
Quantitative Qualitative
Numerical data
Generic results
Strict design
Large samples
Sometimes expensive
More appropriate for summative evaluations
Textual data
In-depth information
Flexible design
Small samples
Possibly cheaper
More appropriate for formative evaluations
Table 7.3 Comparing quantitative and qualitative methodology

49
8. Conclusions
Compared to other modes of transport, PTWs have shown a slower progress with a - 14% fatalities reduction (for all types of PTWs) in a context of a +17 % fleet increase over the period 2001-2008 (IRTAD – EU-20 data). Indeed, it is the share of PTW fatalities that has increased in overall transport due to the better results achieved by cars. In 2006, motorcycle and moped riders, comprised 21% of the fatalities on urban roads.
Faced with these trends, several urban authorities have collaborated within the eSUM Consortium both to centralise knowledge about the problems and to formulate ways of addressing them. The idea of a PTW Action Pack has been developed as a guide to assist practitioners in cities to access the knowledge base developed within eSUM.
The PTW Road Safety Action Pack presented in this document is probably of most use if it is applied within the frame of a general Road Safety Action Plan. Nevertheless the guidance is set out without assuming prior knowledge of developing road safety plans, and provides insights regarding the detailed consideration that ought to be given to PTWs within general plan development.
The Action Pack describes a data-driven process. It first requires an understanding of the casualty problems present. Without a thorough analysis of the available data it would be difficult, if not impossible, to identify clear objectives and targets and assess performance.
The data should lead to the development of strategy and the selection of appropriate counter-measures which will contribute to achieving the overall targets. The process is cyclical, using results from previous interventions to inform the development of future actions and improve effectiveness.
The stages in the development of the Action Pack are summarised below.
Stage Action
1 Gather data required for analysis of PTW casualty problems. Involve stakeholders.
2 Analyse data
3 Identification of casualty issues
4 Develop targets and select interventions
5 Implementation of interventions and monitoring
6 Evaluation of effectiveness Table 8.1 Summary of the stages involved in developing a PTW Action Pack

50
References
ACEM, 2009, “Motorcycle Collisions In Depth Study (MAIDS): In depth investigation of urban collisions involving powered two wheelers”, (Apr 2009);
ATAC, 2009, “eSUM: Diagnosis of Urban motorcycling safety Task 2.1: Benchmarking PTW collisions in urban areas“, ATAC, Mobility Agency for the City of Rome, 2009 - 107 p.
Barcelona Municipality, 2010, “eSUM: D4.1 Demonstrations for Improving PTW urban safety”, v5 Oct., 2010 – 51p.
DGET, 2004. “EU energy and transport in figures: Statistical pocketbook 2003 “ Directorate-General Energy and Transport Luxembourg: Eur-OP, 2003 - 208 p. Catalogue no KO-AB-03-001-EN-C.
European Commission/Directorate General Energy and Transport: “CARE - European Road Collision Database”, (1991-2007);
European Commission/Directorate General for Energy and Transport: “CARE – Glossary”, (Aug 2006);
European Commission/Directorate General for Energy and Transport: “Energy and Transport in figures”, 1990-2007 year;
TfL, 2009. “eSUM: Reducing Urban Powered Two Wheeler Casualties. Work Package 3: The Identification and Dissemination of Good Practice“, Transport for London, 2009 - 215 p.
UniFIr, 2009, “eSUM Task T2.2 report: Researching safer PTW features and vehicle design”. University of Firenze, 2009, - 46p
University of Athens, 2010, “eSUM: D5.1 Potential Impacts for Improving PTW urban safety”, Nov., 2010 – p.

51
Annex A: Analyzing data: examples
A.1 Contextual data: examples
Background London
Year 2007 Note
Population 7,557,000
Area (SqKm) 1,579
Density 4,813
Road network length (Km) 14,926
Primary roads (Km) 1,720
Secondary roads (Km) 13,146
Bus lanes (Km) 292
Bicycle lanes (Km) 1,343
Zone 30 (Km) or 20mph Zones 2,000
Red-light jumper cameras 2,551
Speed control cameras 515
Number of motor vehicles 3,010,000
Lorry / Van 265,000
Cars 2,497,000
Motorcycles
Mopeds 116,000
Other vehicles 132,000
Motor vehicle km (million) 334.52
Travels (internal+external) (million) 27.6 (2006)
PTW travels (internal+external) (million) 0.2
Population density per area (persons/SqKm) 4,813.38
Kilometre road length per area (Km/SqKm) 9.51
Kilometre bus lane per area (Km/SqKm) 0.19
Motor vehicles per inhabitant (‘000) 398.31
Car per inhabitant (*1,000) 330.4
Motor vehicle km per inhabitant (Km/person) 44.27
Motor vehicle km per motor vehicle (veh-km/vehicle) 111.14
Daily Trips per inhabitant (trips/person) 3.65
Table 0.1 Example of basic data.

52
Paris space distribution
Green area: urban5%
Green area: forest18%
Square&streets: pedestrians
11%
Square&streets: vehicles
13%
Buildings53%
Paris vehicles space distribution
bus lanes2%
bicycle lanes11%
zone 3013%
other local roads68%
bus and bicylce lanes6%
Figure 0.1 Example of space and vehicles space distribution
Evolution of Barcelona vehicles fleet distribution
7% 7%
67%61%
20%
9% 9%
1% 3%
15%
0%
10%
20%
30%
40%
50%
60%
70%
80%
1998 2008Lorry / Van Cars Motorcycles Mopeds Other vehicles
Figure 0.2 Examples of vehicle fleet distribution
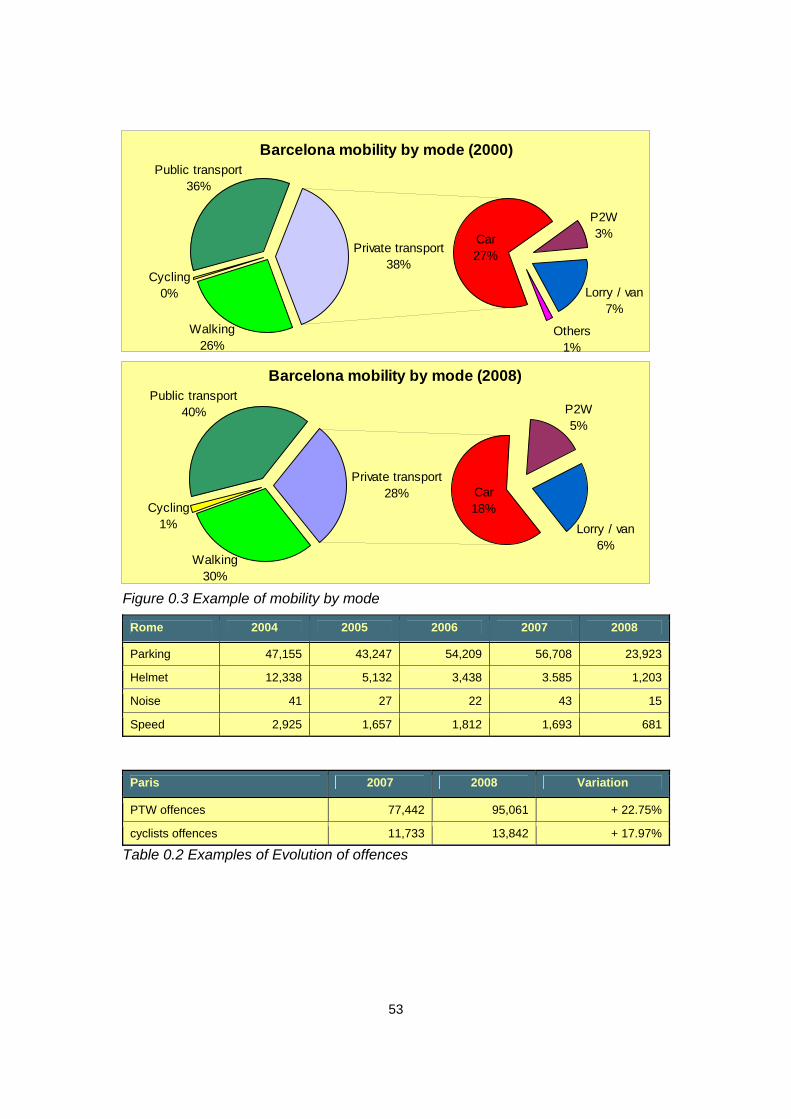
53
Barcelona mobility by mode (2000)
Cycling0%
P2W3%
Lorry / van7%
Others1%
Car27%Private transport
38%
Walking26%
Public transport36%
Barcelona mobility by mode (2008)
Cycling1%
Car18%
Private transport28%
Walking30%
Public transport40% P2W
5%
Lorry / van6%
Figure 0.3 Example of mobility by mode
Rome 2004 2005 2006 2007 2008
Parking 47,155 43,247 54,209 56,708 23,923
Helmet 12,338 5,132 3,438 3.585 1,203
Noise 41 27 22 43 15
Speed 2,925 1,657 1,812 1,693 681
Paris 2007 2008 Variation
PTW offences 77,442 95,061 + 22.75%
cyclists offences 11,733 13,842 + 17.97%
Table 0.2 Examples of Evolution of offences

54
Developement in the number of P2W casualties on traffic accidents and main road safety measures in London.
0
1.000
2.000
3.000
4.000
5.000
6.000
7.000
8.000
9.000
2000 2001 2002 2003 2004 2005 2006 20070
10
20
30
40
50
60
70
80
InjuredKilled
1 Unless they are on the road riding element of an approved CBT course Sources: Bikesafe London, DfT, DSA, DVLA, Bikermag, BMF, Sportsbike.org, Scottish Executive Figure 0.4 Example of communication campaigns
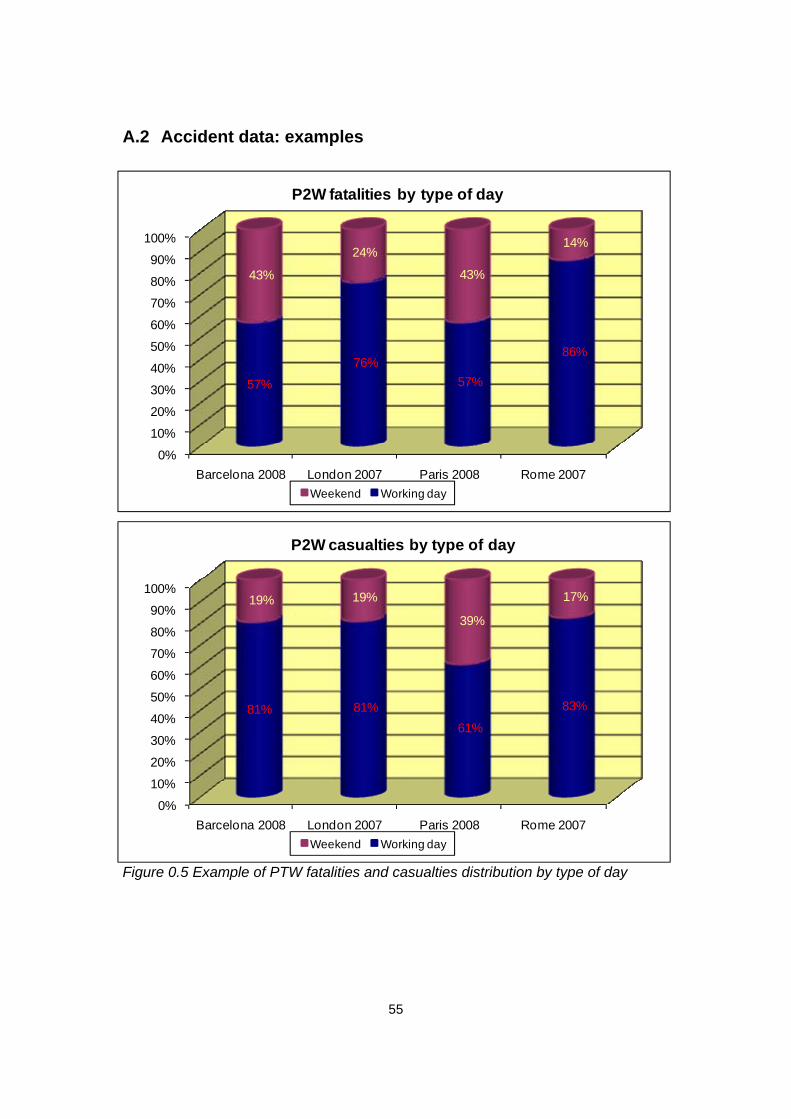
55
A.2 Accident data: examples
0%
10%
20%
30%
40%
50%
60%
70%
80%
90%
100%
Barcelona 2008 London 2007 Paris 2008 Rome 2007
57%
76%57%
86%
43%
24%
43%
14%
P2W fatalities by type of day
Weekend Working day
0%
10%
20%
30%
40%
50%
60%
70%
80%
90%
100%
Barcelona 2008 London 2007 Paris 2008 Rome 2007
81% 81%61%
83%
19% 19%
39%
17%
P2W casualties by type of day
Weekend Working day
Figure 0.5 Example of PTW fatalities and casualties distribution by type of day

56
0%2%4%6%8%
10%12%14%16%
January
February
March
April
May
June
July
August
September
October
November
December
P2W Rome fatalities (2007)
0%2%4%6%8%
10%12%
January
February
March
April
May
June
July
August
September
October
November
December
P2W Rome casualties (2007)
Figure 0.6 Example of PTW fatalities and casualties distribution by month

57
0%
10%
20%
30%
40%
50%
60%
70%
Barcelona (2008) London (2007) Paris (2008) Rome (2007)
P2W fatalalities by hour
0:00-6:00 6:00-12:00 12:00-18:00 18:00-24:00
Figure 0.7 Example of PTW fatalities distribution by hour
0%
2%
4%
6%
8%1
23
4
5
6
7
8
9
1011
1213
1415
16
17
18
19
20
21
2223
24
London'07 P2W Fatalities
0%
2%
4%
6%
8%
10%1
23
4
5
6
7
8
9
1011
1213
1415
16
17
18
19
20
21
2223
24
London'07 P2W Casualties
Figure 0.8 PTW fatalities and casualties distribution by hour
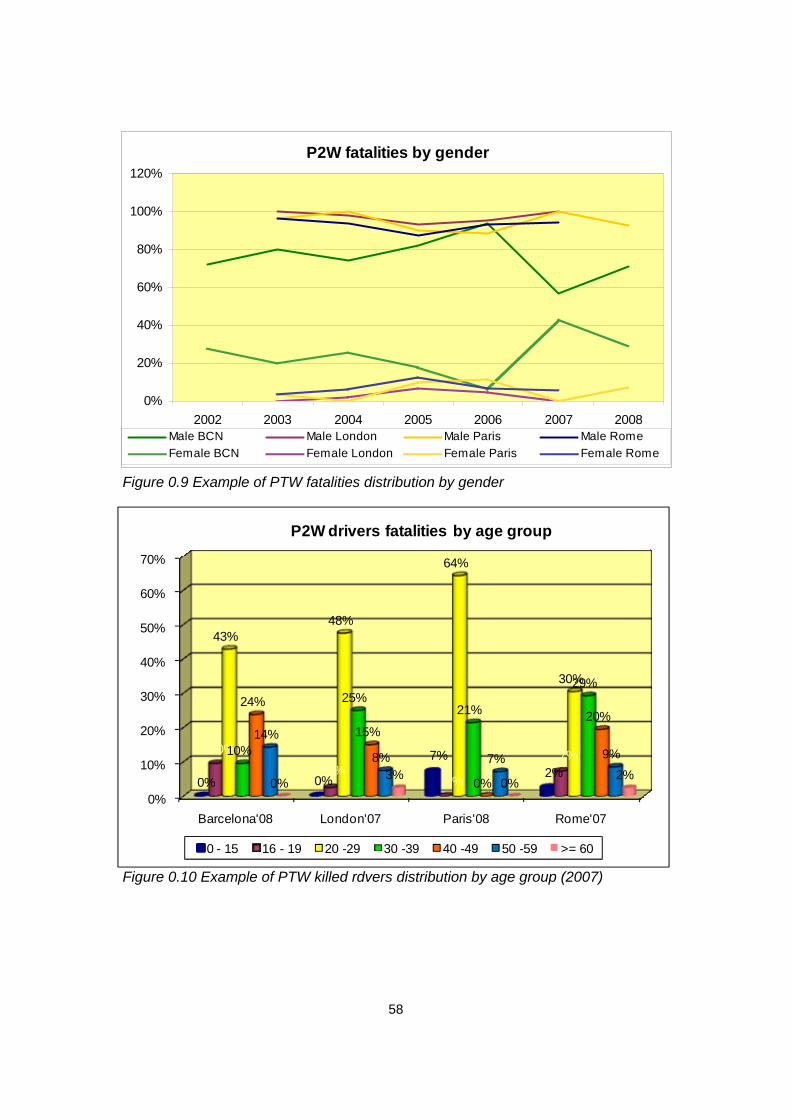
58
P2W fatalities by gender
0%
20%
40%
60%
80%
100%
120%
2002 2003 2004 2005 2006 2007 2008Male BCN Male London Male Paris Male RomeFemale BCN Female London Female Paris Female Rome
Figure 0.9 Example of PTW fatalities distribution by gender
0%
10%
20%
30%
40%
50%
60%
70%
Barcelona'08 London'07 Paris'08 Rome'07
0% 0%
7%2%
10%
3%0%
7%
43%48%
64%
30%
10%
25%21%
29%24%
15%
0%
20%14%
8% 7% 9%
0%3%
0% 2%
P2W drivers fatalities by age group
0 - 15 16 - 19 20 -29 30 -39 40 -49 50 -59 >= 60
Figure 0.10 Example of PTW killed rdvers distribution by age group (2007)

59
Barcelona Motorcyclist helmet use evolution
0%
10%
20%
30%
40%
50%
60%
70%
80%
90%
100%
Killed 03 Killed 07 Seriously 03 Seriously 07 Slightly 03 Slightly 07
With Helmet Without helmet Unknow
Paris Motorcyclist helmet use evolution
0%
10%
20%
30%
40%
50%
60%
70%
80%
90%
100%
Killed 03 Killed 07 Seriously 03 Seriously 07 Slightly 03 Slightly 07
With Helmet Without helmet Unknow
Figure 0.11 The percentage of motorcyclist fatalities by helmet usage
Paris 2000 2001 2002 2003 2004 2005 2006 2007 2008
Collisions with alcohol from PTW users 112 122 102 91 104 112 157 189 242
Collisions with speed from PTW users 640 628 667 438 524 517 587 697 727
Table 0.3 Example of trend of collisions caused by alcohol and speed
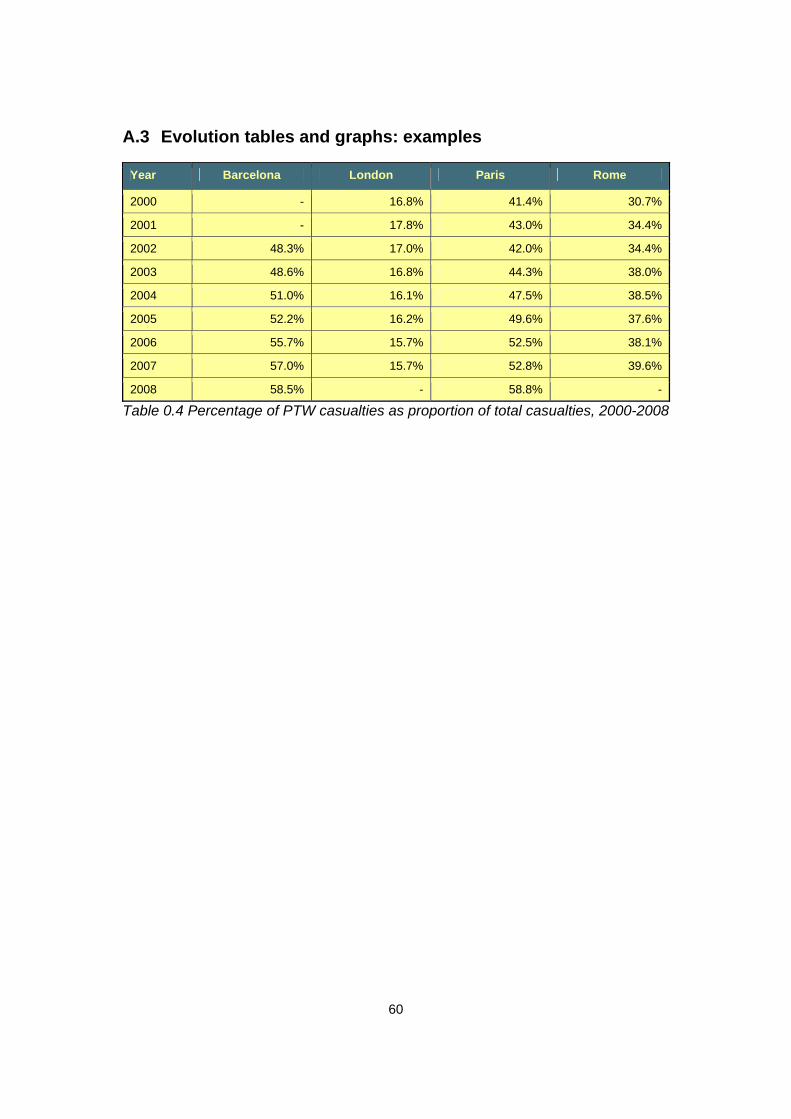
60
A.3 Evolution tables and graphs: examples
Year Barcelona London Paris Rome
2000 - 16.8% 41.4% 30.7%
2001 - 17.8% 43.0% 34.4%
2002 48.3% 17.0% 42.0% 34.4%
2003 48.6% 16.8% 44.3% 38.0%
2004 51.0% 16.1% 47.5% 38.5%
2005 52.2% 16.2% 49.6% 37.6%
2006 55.7% 15.7% 52.5% 38.1%
2007 57.0% 15.7% 52.8% 39.6%
2008 58.5% - 58.8% -
Table 0.4 Percentage of PTW casualties as proportion of total casualties, 2000-2008

61
P2W fatalities & stock evolution
0
10
20
30
40
50
60
70
80
90
100
2000 2001 2002 2003 2004 2005 2006 2007 2008
P2W
Fat
aliti
es
0
50
100
150
200
250
300
350
400
P2W
sto
ck (1
.000
)
P2W fat. BCN P2W fat. London P2W fat. Paris P2W fat. RomeP2W stock BCN P2W stock London P2W stock Paris P2W stock Rome
P2W fatalities and stock share of all modes
0%
10%
20%
30%
40%
50%
60%
70%
80%
1996 1997 1998 1999 2000 2001 2002 2003 2004 2005 2006 2007 2008
P2W fat. BCN P2W fat. London P2W fat. Paris P2W fat. Rome
P2W stock BCN P2W stock London P2W stock Paris P2W stock Rome
Figure 0.12 PTW fatalities & stock evolution

62
P2W Personal Safety
0
5
10
15
20
25
30
35
40
1996 1997 1998 1999 2000 2001 2002 2003 2004 2005 2006 2007 2008
Fata
litie
s pe
r m
illio
n in
habi
tant
s
Barcelona London Paris Rome
P2W Traffic Safety Rate
0
10
20
30
40
50
60
70
80
1996 1997 1998 1999 2000 2001 2002 2003 2004 2005 2006 2007 2008
Fata
litie
s pe
r 100
,000
veh
icle
s
Barcelona London Paris Rome
Figure 0.13 PTW Personal Safety and PTW Traffic safety evolution 1996-2008 (PTW fatalities / million inhabitants and fatalities per 100,000 vehicles)

63
P2W Traffic Safety Risk
0,00
0,05
0,10
0,15
0,20
0,25
1996 1997 1998 1999 2000 2001 2002 2003 2004 2005 2006 2007 2008
Fata
litie
s pe
r mill
ion
veh-
km
London
0
50
100
150
200
250
300
350
400
1996 1997 1998 1999 2000 2001 2002 2003 2004 2005 2006 2007 2008
Fata
litie
s pe
r m
illio
n tr
avel
s
P2W Traffic Safety Risk
Barcelona London
Figure 0.14 PTW Traffic Safety risk (veh-hm and travels) evolution 1996-2008 (PTW fatalities / million PTW veh-km and PTW fatalities / million PTW trips)

64
A.4 Reporting example: Current Knowledge about Urban PTW Safety (report based on MAIDS)
MAIDS: Motorcycle Accidents In Depth Study - MAIDS is the most comprehensive in-depth data currently available for Powered Two-Wheelers (PTWs) accidents in Europe. The investigation was conducted during 3 years on 921 accidents from 5 countries using the OECD common research methodology. This method of classifying injury severity uses the internationally-recognised Abbreviated Injury Scale (AIS) - an anatomical scoring system first introduced in 1969. Since this time it has been revised and updated against survival so that it now provides a reasonably accurate way of ranking the severity of injury. A casualty in a road traffic collision may have a range of injuries but the Maximum Abbreviated Injury Scale (MAIS) uses the highest of the AIS variables. MAIDS is based on the CARE conclusion - that the variation in classification for slight injuries was extremely difficult to reconcile but that for serious injury “the most robust definition internationally is of a non-fatal casualty with MAIS>=3” (inclusive).
Out of the 921 accidents of the MAIDS database, a sub-database of 666 urban accidents was selected and analyzed within the frame of the eSUM project (ACEM, 2009)..
This study confirms that the major cause of accident was due to a human error, although the environmental factor was found to be of bigger relevance in the urban accident causation, especially when view obstructions along both rider’s and other vehicle driver’s line of sight were present, and roadway surface was affected by maintenance defects.
PTW riders involved in urban accidents were found to be less trained and skilled than other riders, having less official training and more control unfamiliarity and skill deficiencies.
A different pattern was found when single and fatal urban accidents were analyzed separately. These accidents showed to be less commuting related and more connected to some recreational activities: they occurred more during the evening and night hours and PTW rider was more prone to take risks, such as speeding over the posted speed limit, wearing helmets improperly or being alcohol impaired.
The complete report is available on: www.esum.eu.
Main conclusions of MAIDS Urban accidents report
Although the analysis of the MAIDS urban sub-database confirmed the major findings described in the MAIDS Report, it was possible to underline some traits typical of the urban context.
While in the total database the distribution of PTW legal category was more shifted towards motorcycles (56.8%), in urban settings mopeds were found to be more involved in accidents (51.4%). The distribution of the time the accident occurred, the day of the week and of the trip origin and destination suggests that nowadays power two wheelers are more frequently used for commuting purposes.

65
Urban accidents are more concentrated towards the end of a working day, when higher frequencies of vehicles are travelling on roads and the concentration level of people involved may be decreased. In fact, a lower attention was noted in 35% of riders – contributing to 11.3% of accidents (and in 32.8% of other vehicle drivers) contributing to 15.5% of accidents. The MAIDS Report showed that 10.6% of rider attention failure and 18.4% of other vehicle driver attention failure had a contribution in accident causation.
A failure by the other vehicle driver is still the most frequent reason for urban accidents, mostly due to a perception or decision failure. Comparing results with the major MAIDS finding, it was found that environmental factors played a more important role in urban context. In fact 9.6% of urban cases were caused by an element of the environment (vs. 7.7%), mainly a temporary traffic obstruction or a stationary or mobile view obstacle. Roadway design defects and roadway maintenance were found to contribute to 6.3% of accidents. Whenever an obstacle was present, both riders and other vehicle riders were found to underestimate the possible danger of having their view obstructed, and this contributed to cause the accident in 19.2% (riders) and 23.6% (driver) of cases. Riders involved in urban accidents were also found to be less trained and less skilled than the total number of MAIDS riders. In fact, 47.6% of urban riders did not have an official training (vs. 40.1%) and 9.2% were found to have control unfamiliarity (vs. 3.7%) on their vehicles and 14.4% to have some skill deficiency (vs. 10%).
When single vehicle urban accidents and fatal urban accidents are analyzed separately, different characteristics were found. Both fatal and single accidents have a less commuting pattern, occur more during the evening and night hours and are most likely caused by a PTW rider failure. Riders of these two accident typologies are more prone to take risks, such as speeding over the posted speed limit, wearing helmets improperly, and alcohol impairment. These riders were also found to have less riding skills and to lose control of their vehicles, especially when negotiating a bend.
In conclusion, an increased awareness of possible urban dangers, better maintenance of roads and roadside environment, more severe traffic law enforcements, together with high quality PTW training programmes could be considered valuable countermeasures for reducing accidents within urban areas.

66
Annex B: CARE Glossary (Extract)
B.1 Main definitions used
1. Collision
Definition: Occurs on a public road or on a private road to which the public has right of access (except B, NL, P). Involves at least one moving vehicle (except P, UK). Involves at least one injured or killed person. Is reported by the police. Self reporting possible (B, EL, IRL, I, UK). Self reporting not possible (DK, D, NL, A, P, FIN). Confirmed suicides excluded (B, D, DK, IRL, NL, A, P, UK). Confirmed suicides included (E, I, L).
Note : The variation in the types of road and the coverage of the injury categories included in injury collisions, together with differences in the level of self reported collisions, will lead to significant variations in the number of injury collisions reported, and their reporting rate, between Member States.
2. Collision Severity
Definition: The highest level of injury affecting one person involved in the collision. Injury severity from slightly injured, seriously injured up to killed. Values defined: fatal collision - injury collision - serious injury collision - slight injury collision - unknown.
Fatal collision
Definition: Collision with at least one killed person regardless the injury severity from any other involved persons.
Note: See 'killed' definition from Injury Severity defined in Person type item.
Data availability: All countries.
Injury collision
Definition: Collision with at least one injured person among the person(s) involved without specification of type of injury.
Note: See 'injured' definition from Injury Severity defined in Person type item.
Data availability: FI, IT, NL.
Serious injury collision
Definition: Collision with at least one or more seriously injured person stated among the person(s) involved and wherein no other killed person was reported.

67
Note: See 'seriously injured' definition from Injury Severity defined in Person type item.
Data availability: All countries except FI, IT, NL.
Slight injury collision
Definition: Collision with at least one or more slight injured person stated among the person(s) involved and wherein no other seriously injured or killed person was reported.
Note: See 'seriously injured' definition from Injury Severity defined in Person type item.
Data availability: All countries except FI, IT, NL.
Unknown
Definition: Collision for which no injury severity was reported among the person(s) involved.
Note: See 'unknown' definition from Injury Severity defined in Person type item.
Data availability: BE, DK, SE.
3. Collision Type
Angle collision
Definition: Collision between two moving vehicles. First vehicle has a side collision. point, other vehicle has a frontal collision point (ES 1993 onwards, GR, IT, IE).
Data availability: AT, DK, ES 1993 onwards, GR, IT, IE,EE
Value included in another value: lateral collision.
Chain collision
Definition: Collision between more than two moving vehicles (BE, ES, FR). First. vehicle has a rear collision point, other vehicle has a frontal collision point (ES, FR).
Data availability: BE, ES, FR,EE.
Value included in another value: chain or rear collision.
Chain or rear collision
Definition: Collision between two or more vehicles travelling in the same direction on the same road. First vehicle has a rear collision point,

68
other vehicle has a frontal collision point (ES, FR, GR, IT, IE, NL, PT).
Data availability: All countries (except GB, LU, NI, SE 2003 onwards).
Collision with animal
Definition: Collision between vehicle and animal.
Data availability: All countries (except , GB, IE 1996 onwards, IT, NI).
Collision with obstacle
Definition: Collision between moving vehicle and obstacle. On or off the road. Fixed or moving obstacle. Includes trees, posts, crash barriers.
Data availability: All countries (except GB, NI, SE 2003 onwards).
Collision with parked vehicle
Definition: Collision between moving vehicle and parked vehicle. Includes vehicle moving off (DK).
Data availability: All countries (except B, GB, NI, P).
4. Road Surface Conditions
Dry
Definition: Dry road surface.
Data availability: All countries.
Frost,ice
Definition: frost or ice on the road.
Data availability: All countries except BE, DK, LU,NL, PT
Other, unknown
Definition: none of these above.
Data availability: All countries.
Slippery
Definition: Slippery road surface. Includes gravel, mud, leaves on the road, snow or ice are not included in this value..
Data availability: All countries excepted GB,IE,SE.

69
Snow
Definition: Snow on the road.
Data availability: AT,IT,FI,GB,GR,SE,IE,ES,FR,NI,EE.
Snow, frost or ice
Definition: Snow, frost or ice on the road. .
Data availability: DK 2003 onwards,LU,SE,NL,BE,PT
Wet, damp, flood
Definition: Wet road surface. Includes flood and damp.
Data availability: All countries.
5. Area Type
Inside urban area
Definition: Area inside urban area boundary signs (except GB, IE, NI). Includes dual carriageways and national roads. Can include motorways (except DK, GR, IT). Opinion of the police (DK, SE).
Note:Data approximated from speed limit of 40 mph or less (GB, IE, Note NI).
Data availability: All countries.
Outside urban area
Definition: Area outside urban area boundary signs. Opinion of the police (DK, SE). Includes motorways.
Note:Data approximated from speed limit of over 40 mph (GB, IE, NI).
Data availability: All countries.
6. Number Of Vehicles
Definition: The number of vehicles involved in the collision. Not counting a pedestrian as a vehicle.
Data availability: All countries
7. Number Of Persons
Definition: The number of persons involved in the collision.
Data availability: All countries

70
8. Number Of Pedestrians
Definition: The number of pedestrians involved in the collision.
Data availability: All countries
9. Age
Definition: Length of life of person. Rounded down to whole number of years (except GR, IT, NI : rounded to nearest year).
Note: Age 0 to 1 is exceptionally rounded up (FR, IT, IE, LU, NI, PT). Age over 99 only available for ES, FR (1993 on), NL.
Data availability: All countries.
10. Gender
Female
Definition: Determined by the police (except AT, ES, IT, LU, PT : on the basis of identity documents ; DK, FI, SE : on the basis of personal id number).
Data availability: All countries.
Male
Definition: Determined by the police (except AT, ES, IT, LU, PT : on the (basis of identity documents ; DK, FI, SE : on the basis of personal id number).
Data availability: All countries.
Unknown
Definition: Sex could not be determined (hit and run collision, police unable to trace person, not specified).
Data availability: Data availability: All countries (except FR before 1993).
11. Person Class
Driver
Definition: Person driving or riding any motorised vehicle or pedal cycle. Person herding animals is not a driver (except AT, BE). Learner driver is a driver (except ES, PT). Learner driver is a driver during a driving test, but not in a driving lesson (DK). Driving instructor is not a driver (except ES, PT). Driving instructor is a driver during a driving lesson, but not during a driving test (DK).
Note: Uninjured drivers are included in the database (except GB, NI,NL: implicitly included in vehicle records only).

71
Data on driving instructors and learner drivers collected separately from 1993 onwards (SE).
Data availability: All countries.
Passenger
Definition: Person on or in a vehicle, who is not the driver. Includes person in the act of boarding or alighting from a vehicle (except DK). Learner driver is not a passenger (except ES, PT). Learner driver is a passenger during a driving lesson, but not during a driving test (DK). Driving instructor is a passenger (except ES, PT). Driving instructor is a passenger during a driving test, but not in a driving lesson (DK).
Note: Uninjured passengers not included in the database (except FR, IE, LU; AT, ES, FI in some cases).
Data availability: All countries.
Pedestrian
Definition: Person on foot. Person pushing or holding bicycle (except DK). Person pushing a pram or pushchair. Person leading or herding an animal (except AT, DK). Person riding a toy cycle on the footway (except AT). Person on roller skates, skateboard or skis (except AT). Does not include person in the act of boarding or alighting from a vehicle (except DK, ES).
Note: Uninjured pedestrians not included in the database (except BE, IE, LU; NL implicitly included in element records ; AT, DK, FR, FI, SE if they caused the collision ; ES not consistently).
Data availability: All countries.
12. Person Injury
Injured
Definition: Injured in a road collision. Hospitalisation or medical treatment not necessarily required (except FR). Self declaration of injury (DK if slight ; FI, GB, IT, IE, NI). Opinion of the police.
Note: see ‘seriously injured’, ‘slightly injured’ definitions.
Data availability: FI,IE 1996 onwards,IT,EE
Killed
Definition: Death within 30 days of a road collision (UN/ECE Geneva 1995 Statistics of Road Traffic Collisions in Europe and North America, annex 1), except AT (3 days before 1992), ES (24 hours in CARE ; 24 hours before 1993 in publication), FR (6 days), GR (24 hours), IT (7

72
days), PT (24 hours). Suicide not included (except DK, ES, FR). Natural death not included (except LU, SE).
Data availability: All countries.
Not injured
Definition: Not injured in an collision. Person does not require medical treatment (AT, DK, ES, FR, FI, IE, LU). Opinion of the police (AT, BE, DK, IE, SE).
Note: Uninjured drivers are included. Uninjured passengers may be included (AT, ES, FR, FI, IE, LU). Uninjured pedestrians may be included (except GR, IT, PT).
Data availability: All countries (except GB, IE 1996 onwards, NI, NL: not injured availability: drivers implicitly included in vehicle record).
Seriously injured
Definition: Injured in a road collision. Hospitalised at least 6 days (FR). Hospitalised at least 24 hours (BE, DK, ES from 1993 onwards, GR, LU, PT). Hospitalised as in-patient (DK, NL). Not hospitalised, hospitalised for observation or as in-patient (GB, IE, NI). No reference to hospitalisation (AT, SE). Opinion of the police (except BE, ES from 1993 onwards, FR, LU, NL, PT). Police guidance provided (DK, ES before 1993, GB, IE, NI). Persons died 30 days after collision included (except FR, LU, PT).
Data availability: All countries (except FI, IT,EE).
Slightly injured
Definition: Injured in a road collision. Hospitalised 6 days or less (FR). Hospitalised less than 24 hours (BE, DK, ES, GR, PT). Not hospitalised (DK, GB, IE, NI, NL). Medical treatment required (DK, FR, LU, PT). Police guidance provided (DK, ES before 1993, GB, IE, NI). Opinion of the police.
Data availability: All countries (except FI, IT,EE).
13. Day Of Week
Definition: 24 hour day within 7 day week.
Note: Data calculated by the CARE system from the date of collision, where data is not available in national files (AT from 1992 onwards, BE, FR prior to 1993, PT, SE).
Data availability: All countries.
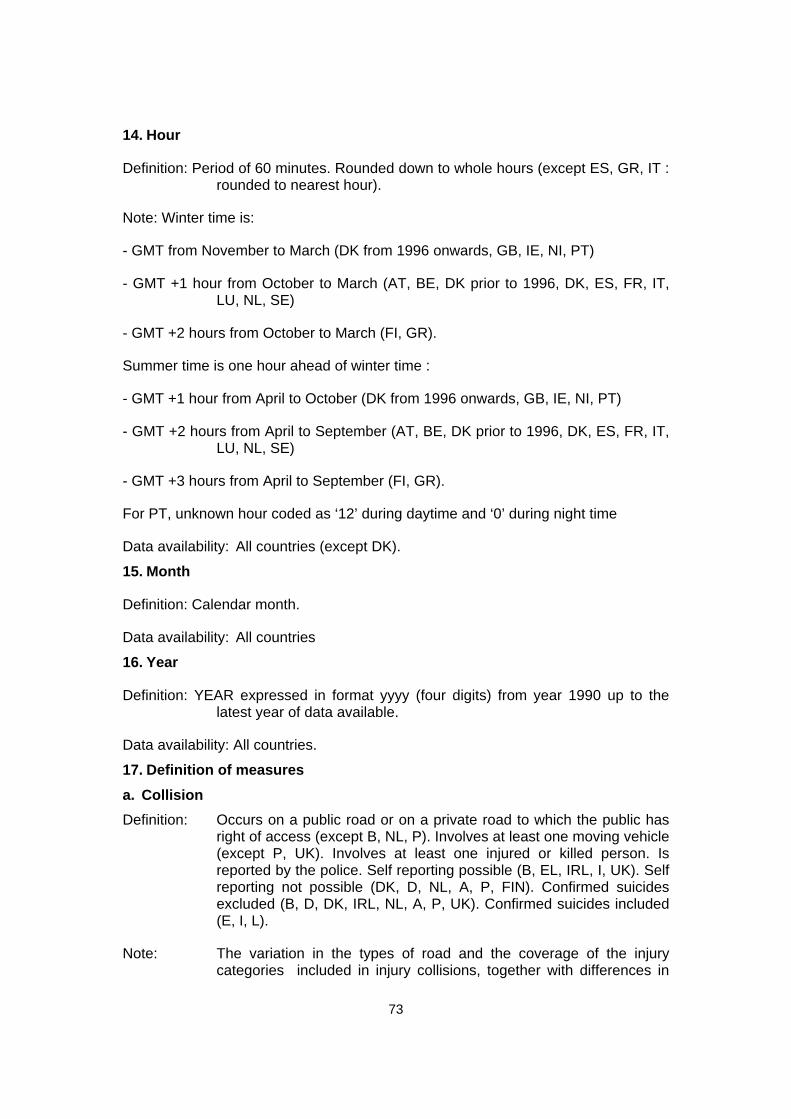
73
14. Hour
Definition: Period of 60 minutes. Rounded down to whole hours (except ES, GR, IT : rounded to nearest hour).
Note: Winter time is:
- GMT from November to March (DK from 1996 onwards, GB, IE, NI, PT)
- GMT +1 hour from October to March (AT, BE, DK prior to 1996, DK, ES, FR, IT, LU, NL, SE)
- GMT +2 hours from October to March (FI, GR).
Summer time is one hour ahead of winter time :
- GMT +1 hour from April to October (DK from 1996 onwards, GB, IE, NI, PT)
- GMT +2 hours from April to September (AT, BE, DK prior to 1996, DK, ES, FR, IT, LU, NL, SE)
- GMT +3 hours from April to September (FI, GR).
For PT, unknown hour coded as ‘12’ during daytime and ‘0’ during night time
Data availability: All countries (except DK).
15. Month
Definition: Calendar month.
Data availability: All countries
16. Year
Definition: YEAR expressed in format yyyy (four digits) from year 1990 up to the latest year of data available.
Data availability: All countries.
17. Definition of measures a. Collision Definition: Occurs on a public road or on a private road to which the public has
right of access (except B, NL, P). Involves at least one moving vehicle (except P, UK). Involves at least one injured or killed person. Is reported by the police. Self reporting possible (B, EL, IRL, I, UK). Self reporting not possible (DK, D, NL, A, P, FIN). Confirmed suicides excluded (B, D, DK, IRL, NL, A, P, UK). Confirmed suicides included (E, I, L).
Note: The variation in the types of road and the coverage of the injury categories included in injury collisions, together with differences in
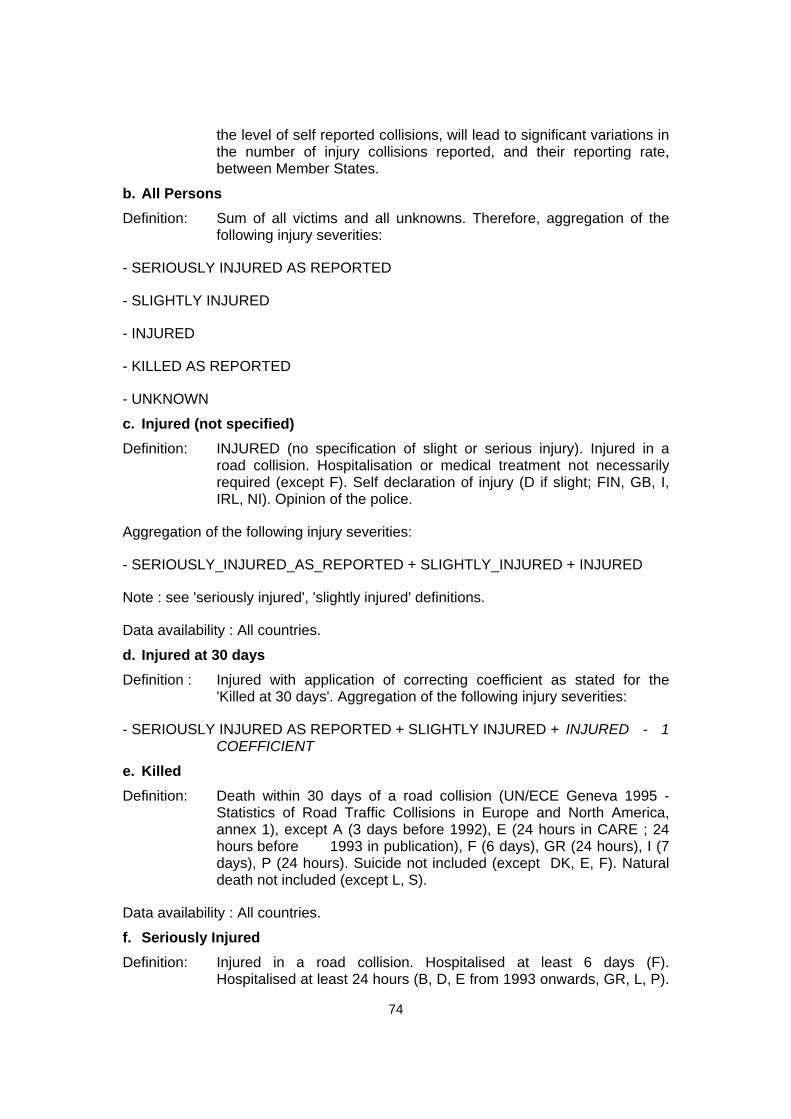
74
the level of self reported collisions, will lead to significant variations in the number of injury collisions reported, and their reporting rate, between Member States.
b. All Persons Definition: Sum of all victims and all unknowns. Therefore, aggregation of the
following injury severities:
- SERIOUSLY INJURED AS REPORTED
- SLIGHTLY INJURED
- INJURED
- KILLED AS REPORTED
- UNKNOWN
c. Injured (not specified) Definition: INJURED (no specification of slight or serious injury). Injured in a
road collision. Hospitalisation or medical treatment not necessarily required (except F). Self declaration of injury (D if slight; FIN, GB, I, IRL, NI). Opinion of the police.
Aggregation of the following injury severities:
- SERIOUSLY_INJURED_AS_REPORTED + SLIGHTLY_INJURED + INJURED
Note : see 'seriously injured', 'slightly injured' definitions.
Data availability : All countries.
d. Injured at 30 days Definition : Injured with application of correcting coefficient as stated for the
'Killed at 30 days'. Aggregation of the following injury severities:
- SERIOUSLY INJURED AS REPORTED + SLIGHTLY INJURED + INJURED - 1 COEFFICIENT
e. Killed Definition: Death within 30 days of a road collision (UN/ECE Geneva 1995 -
Statistics of Road Traffic Collisions in Europe and North America, annex 1), except A (3 days before 1992), E (24 hours in CARE ; 24 hours before 1993 in publication), F (6 days), GR (24 hours), I (7 days), P (24 hours). Suicide not included (except DK, E, F). Natural death not included (except L, S).
Data availability : All countries.
f. Seriously Injured Definition: Injured in a road collision. Hospitalised at least 6 days (F).
Hospitalised at least 24 hours (B, D, E from 1993 onwards, GR, L, P).

75
Hospitalised as in-patient (DK, NL). Not hospitalised, hospitalised for observation or as in-patient (GB, IRL, NI). No reference to hospitalisation (A, S). Opinion of the police (except B, E from 1993 onwards, F, L, NL, P). Police guidance provided (DK, E before 1993, GB, IRL, NI). Persons died 30 days after collision included (except F, L, P).
Data availability : All countries (except FIN, I)
g. Seriously Injured at 30 days Definition: Seriously injured with application of correcting coefficient as stated for
the 'Killed at 30 days'.
Aggregation of the following injury severities:
- SERIOUSLY_INJURED_AS_REPORTED + 1 COEFFICIENT
h. Slightly Injured Definition: Injured in a road collision. Hospitalised 6 days or less (F).
Hospitalised less than 24 hours (B, D, E, GR, P). Not hospitalised (DK, GB, IRL, NI, NL). Medical treatment required (DK, F, L, P). Police guidance provided (DK, E before 1993, GB, IRL, NI). Opinion of the police.
Data availability : All countries (except FI, IT,EE).
i. Unknown Definition: Sum of the cases for which no injury severities were reported.
j. Vehicles Definition: Number of vehicles reported regardless its type.
k. Victims Definition: Aggregation of the following injury severities:
- SERIOUSLY INJURED AS REPORTED
- SLIGHTLY INJURED
- INJURED
- KILLED AS REPORTED

76
Annex C: eSUM Action Pack Summary version
Contents
Introduction The eSUM project and how to use this document
Section1 Data required for analysis of powered two wheeler (PTW) casualty problems
Section 2 Data analysis
Section 3 Identification of casualty issues
Section 4 Using the eSUM Good Practice Guide and Demonstration Projects to select interventions
Section 5 Setting up a monitoring framework for interventions
Section 6 Implementation of interventions
Section 7 Evaluation of effectiveness and reporting

77
Introduction
For many EU citizens the Powered Two Wheeler (PTW) offers affordable personal mobility and an alternative to cars for many urban trips. Figures provided by the Association des Constructeurs Europeens de Motocycles (ACEM) show an increase in the number of motorcycles on the roads in many European cities over the last decade and indicate the potential for greater PTW use in the future.
Compared to other modes of transport, PTWs have shown a slower progress with a reduction of 14% in fatalities (for all types of PTWs), in a context of a 17 % increase in fleet over the period 2001-2008 (IRTAD – EU-20 data, see Figure 1). The proportion of PTW fatalities in the overall EU total has increased due to the better results achieved by other groups. In 2006, motorcycle and moped riders, comprised 21% of the fatalities on urban roads.

78
Figure 1: Evolution of total fatalities and of motorcycle fatalities in EU20, 2001-2008. (Source: IRTAD)
The European Safer Urban Motorcycling Project (eSUM) was initiated to identify interventions to help reduce this risk, whilst maintaining the mobility advantages offered by PTWs in urban areas.
The (eSUM) Action Pack is a guide to help politicians and professionals responsible for road safety to develop effective PTW casualty reduction programmes. This document summarises the full report, available on the eSUM website (www.esum.eu), and provides guidance to assist those municipalities interested in building on the knowledge gained from eSUM when developing their own PTW Road Safety Action Plans. The process is summarised in Figure 2.

79
Figure 2: Planning Process
The PTW Road Safety Action Pack summarised in this document is probably of most use if it is applied within the structure of a general Road Safety Action Plan. Nevertheless the guidance is set out without assuming prior knowledge of developing road safety plans, and provides insights regarding the detailed consideration that should be given to PTWs within overall strategy.
The Action Pack sets out a simple methodology for designing and implementing a PTW casualty reduction programme. Essentially there are 6 stages:
Local strategy and objectives
Identify problem
areas and define
objectives
Select interventions
and / or develop a
PTW safety plan
Implement interventions and monitor
Evaluate the interventions
or the plan
Re-assess PTW problem

80
Stage Action
1 Gather data required for analysis of PTW casualty problems
2 Analyse data
3 Identify casualty issues
4 Develop targets and select interventions
5 Implement interventions and monitor
6 Evaluate effectiveness
Sections 1 to 7 describe how this methodology might be applied.
Section 1: Data Required As a minimum the data required to assess the scale of the PTW casualty problem will be: Collision Data for PTW casualties killed or seriously injured (KSI) as defined using the Maximum Abbreviated Injury Scale (MAIS) [Score 3 or greater] for at least 5 years. (CARE Database) Location, including plan of site and description
of layout;
Date/Time;
Weather/surface conditions;
Age/gender of casualty;
Type of vehicle involved;

81
Vehicle manoeuvre leading to collision;
Text description of collision.
Contextual Data giving the background to the use of PTWs in the area. Number of PTWs registered in the city area;
Kilometres (km) ridden by PTWs;
Trends of PTW use over at least 5 years.
Sources: There are several potential sources depending on national process and responsibilities. The primary source of collision data is likely to be the Police, with supplementary data possibly available from local hospitals. Contextual data should be available from municipal authorities and/or national government transport administrators.
Section 2: Data Analysis Analysis of the casualty data should focus on: Overall collision rate trends over the last 5 years (KSI/vehicles registered
and KSI/km ridden);
Locations of Collision clusters;
Distribution by time/day/date;
Weather/surface factors;
Collision rates for age/gender groups;
Key causation factors/manoeuvres/locations;

82
Other vehicle involvement.
Section 3: Identification of Casualty Issues From the analysis it should be possible to identify common causation factors to assist in selecting appropriate interventions: Overall casualty trend for the city area to determine if casualty rates are
falling or rising; Locations of clusters of PTW collisions can be
identified using local criteria and investigated to identify common factors which may be rectified by remedial action at the site;
An assessment of time/day/date, weather or
surface related causes can be undertaken on a city wide and location basis;
High risk groups can be identified by age, gender or vehicle type;
Other vehicle involvement can be assessed to provide an indication of
cause and potential targeting data for any interventions.
Section 4: Selection of Interventions Appropriate interventions may be identified using the eSUM project. The Good Practice Guide (GPG), already set up as a searchable tool on the eSUM website. The Action Pack (complete-version) provides further guidance on how to apply this and other knowledge bases developed in the project (www.esum.eu) to help match interventions to the problems defined by the analysis of data. It is emphasised that selection should be based on the identification of collision causation factors from the data.

83
The GPG is set out to provide guidance on potentially successful casualty reduction projects based on 6 themes: Rider Training and Awareness;
Highway Features and Policy;
Targeted Enforcement;
Specific Highway Remedial Measures;
PTW Design and Protective Equipment;
‘Softening’ the Highway Infrastructure.
Careful consideration of the potential interventions is required to ensure that they are both appropriate to the local city area and to the casualty problems identified.
Section 5: Setting up a Monitoring Framework for Interventions A robust monitoring framework should be established in order to accurately evaluate the effectiveness of any interventions implemented. As a minimum a ‘baseline’ should be established based on at least 3 years’ data. The effectiveness of the intervention should be assessed through a comparison of the baseline with data for 3 years following the implementation of the intervention. For highway engineering schemes this should be a relatively simple process which can be adjusted to reflect changes in PTW use over the period. For awareness/training and targeted enforcement projects, monitoring may be enhanced by incorporating other indicators,

84
for example from attitude surveys or observed behavioural change but evaluation will primarily rest on changes in casualty rates.
Section 6: Implementation of Interventions A named individual should be responsible for the project management of implementation. Interventions selected from the GPG should be suitably modified to ensure that they are appropriate to national/city conditions. Sufficient resources should be in place to ensure that implementation can be completed as intended and monitoring undertaken over the following 3 years.
Section 7: Evaluation and Reporting The effectiveness of the intervention implemented should be assessed using the monitoring framework described in Section 5. A brief report should be completed detailing the process of data gathering and analysis, the identification of casualty problems and the selection and implementation of interventions. The quantitative results should be reported to indicate how the casualty data has evolved since implementation. A qualitative assessment of the intervention should also be included outlining any problems with implementation or evaluation. This report should be shared with other road safety professionals by publishing on the web to help others learn from your experience. Measures that achieve outstanding results may well be “good practice” and you are invited to share these examples by presenting them for inclusion in future updates of the eSUM Good Practice Guide (www.esum.eu).

85
-------------------------------------------- Note to readers: If you have not been able to find this document in your native language but you would be willing to translate it so as to help to disseminate its contents, please contact us via the www.esum.eu.