action plan 2015-2018 - calgary
TRANSCRIPT
ATTACH 1 - FINAL ACCOUNTABILITY REPORT FOR ACTION PLAN - PFC2018-0988 1 of 52 ISC: UNRESTRICTED
Action Plan 2015-2018 Final Accountability Report for Action Plan
PFC2018-0988
ATTACHMENT
ATTACH 1 - FINAL ACCOUNTABILITY REPORT FOR ACTION PLAN - PFC2018-0988 2 of 52 ISC: UNRESTRICTED
Accountability Reports
Action Plan 2015-2018 is The City of Calgary’s (The
City) business plan and budget and describes how The
City will respond to the needs and aspirations of the
citizens of Calgary over the four-year period.
Accountability Reports inform Council of The City’s
progress towards achieving the approved business
plans and budgets. The reports provide an update on
the status of all Council Priorities, major service
initiatives, key accomplishments, challenges, and
department budget performance.
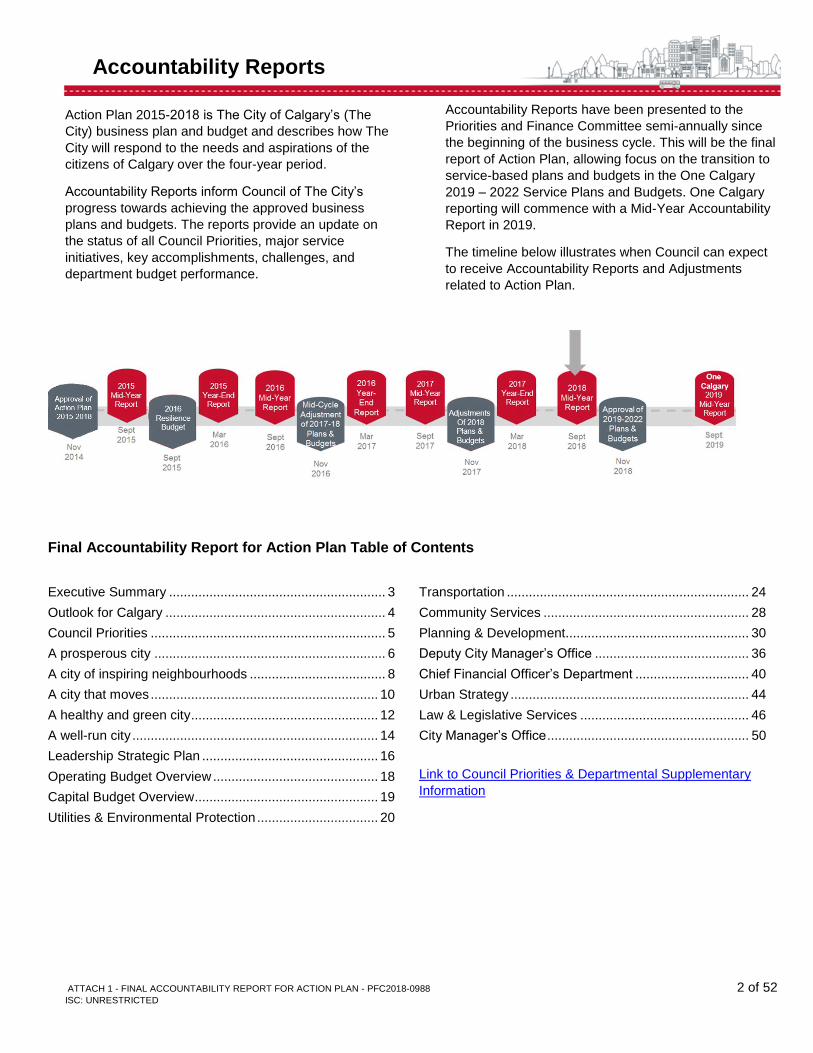
Accountability Reports have been presented to the
Priorities and Finance Committee semi-annually since
the beginning of the business cycle. This will be the final
report of Action Plan, allowing focus on the transition to
service-based plans and budgets in the One Calgary
2019 – 2022 Service Plans and Budgets. One Calgary
reporting will commence with a Mid-Year Accountability
Report in 2019.
The timeline below illustrates when Council can expect
to receive Accountability Reports and Adjustments
related to Action Plan.
Final Accountability Report for Action Plan Table of Contents
Check page numbers
Executive Summary ........................................................... 3
Outlook for Calgary ............................................................ 4
Council Priorities ................................................................ 5
A prosperous city ............................................................... 6
A city of inspiring neighbourhoods ..................................... 8
A city that moves .............................................................. 10
A healthy and green city ................................................... 12
A well-run city ................................................................... 14
Leadership Strategic Plan ................................................ 16
Operating Budget Overview ............................................. 18
Capital Budget Overview .................................................. 19
Utilities & Environmental Protection ................................. 20
Transportation .................................................................. 24
Community Services ........................................................ 28
Planning & Development.................................................. 30
Deputy City Manager’s Office .......................................... 36
Chief Financial Officer’s Department ............................... 40
Urban Strategy ................................................................. 44
Law & Legislative Services .............................................. 46
City Manager’s Office ....................................................... 50
Link to Council Priorities & Departmental Supplementary
Information
ATTACH 1 - FINAL ACCOUNTABILITY REPORT FOR ACTION PLAN - PFC2018-0988 3 of 52 ISC: UNRESTRICTED
Executive Summary
The Action Plan is in its fourth and final year. At the start,
the Calgary economy was in expansion with a record
number of migrants to the city. A long and deep recession
followed. Today, several economic indicators confirm
economic improvement is underway. The unemployment
rate averaged 7.5 per cent in the first half of 2018
compared to 9.1 per cent in the first half of 2017. Net
migration to the city has increased from 976 persons (2017
census year) to 11,588 persons (2018 census year)
For the first half of 2018, The City has continued to make
steady progress on Council Priorities. A few key
achievements for the year thus far are:
• The City of Calgary Charter, 2018 Regulation came
into force on April 5, providing expanded authority in
recognition of distinct local challenges and
opportunities. The City continues to work with the
Government of Alberta to deliver on commitments to
further regulatory change, as well as a new fiscal
framework, by the fall of 2018.
• The establishment, in partnership with Calgary
Economic Development, of a new wholly-owned
subsidiary to oversee the $100 million Opportunity
Calgary Investment Fund. This subsidiary will
distribute funds to qualified private sector companies
or public institutions for investments that will help
diversify Calgary’s economic growth and create
employment.
• Support for the creation of new affordable housing,
through the sale of six parcels of land to three non-
profit organizations for future development. This is
the biggest non-commercial land sale in The City’s
history and will significantly advance the Corporate
Affordable Housing Strategy.
The City continues to look for efficiencies within its
operations and for ways to cut red tape for both
businesses and citizens. Land use bylaw amendments
were approved allowing secondary suites in all
residential areas, making the application process more
efficient by eliminating the need to re-designate to a
different land use, requiring council approval. Other land
use bylaw amendments were passed that will
allow cannabis retail and production facilities to open for
business as soon as cannabis is legalized.
Promoting healthy lifestyles by providing Calgarians with
opportunities for recreation remained a priority. The
Rocky Ridge YMCA celebrated its grand opening in
January and has sold more than 16,000 memberships. A
number of upgrades to increase accessibility have been
completed on existing City facilities including Village
Square Leisure Centre, Southland Leisure Centre,
Foothills Aquatic Centre and Calgary Soccer Centre.
Much progress has been made to prepare for the change
to service-based plans and budgets for the 2019-2022
business cycle. This approach will enable Council to
make more informed investment decisions based on
service value. Service lines have been finalized with
service owners, and operating and capital budgets are
being identified for each. Indicative property tax rates and
indicative rates for water, wastewater, stormwater and
waste and recycling services were approved as well as
indicative tax rates for further capital investments and
direct incremental operating costs for new and actively
developing communities.
The City achieved total savings of $30.2 million in our tax
supported programs. These savings were a combined
effort of:
Business units’ operating savings of $14.4 million due in
part from:
• Savings from the management of the workforce and
staff vacancies.
• Lower than budgeted salary and wages cost, and
contract & general services cost.
• Higher street use permits and plant sales, partially
offset by lower excavation permit fees and higher
vehicle and equipment expenses for street repairs.
Corporate programs’ savings of $15.8 million due in part
from:
• Lower pension and retirement benefits, lower
actuarial valuations on pensions and retirement
benefits, lower recovery on the Corporate Workforce
Strategy program and savings in other health
benefits.
• Investment income in the form of realized capital
gains on both bond and equity portfolios.
$9.5 million of the business units’ operating savings to
date were added to the Operating Budget Savings
Account (BSA) bringing the cumulative balance to $57.5
million.
The first part of this report provides updates on each
Council priority, followed by selected performance
measures by Department. Supplementary information
with greater detail can be found online.
ATTACH 1 - FINAL ACCOUNTABILITY REPORT FOR ACTION PLAN - PFC2018-0988 4 of 52 ISC: UNRESTRICTED
Outlook for Calgary
To inform the creation of Action Plan 2015-2018,
Administration completed an environmental scan and
analysis of key trends affecting Calgary. This page
provides a synopsis of more recent conditions – including
changes in the economy and intergovernmental affairs –
and their impact on The City of Calgary.
Economic activity in the Calgary Economic Region
contracted in 2016 (-1.2 per cent) in response to lower oil
prices and a resulting drop in business investments. After
two years of contraction in 2015 and 2016, the Calgary
economy improved by an estimated 3.0 per cent in 2017.
The local economy is gradually emerging from these two
consecutive years of recession. During the recession,
employment levels dropped and vacancy rates rose in
various segments of the real estate market. The
improving economic condition of Alberta and the Calgary
Economic Region is connected to new capacity to export
energy out of Alberta, and increasing global oil prices.
WTI crude oil prices in the first half of 2018 averaged
$US 65.50 per barrel, higher than in 2017 ($US 50.80
per barrel over the first half of 2017). Lately WTI seems
to have stabilized above $US 65 per barrel range,
however, Canadian producers are not fully benefiting
from this. A barrel of West Canadian Select is trading for
roughly US$25 less than WTI due to transportation
bottlenecks.
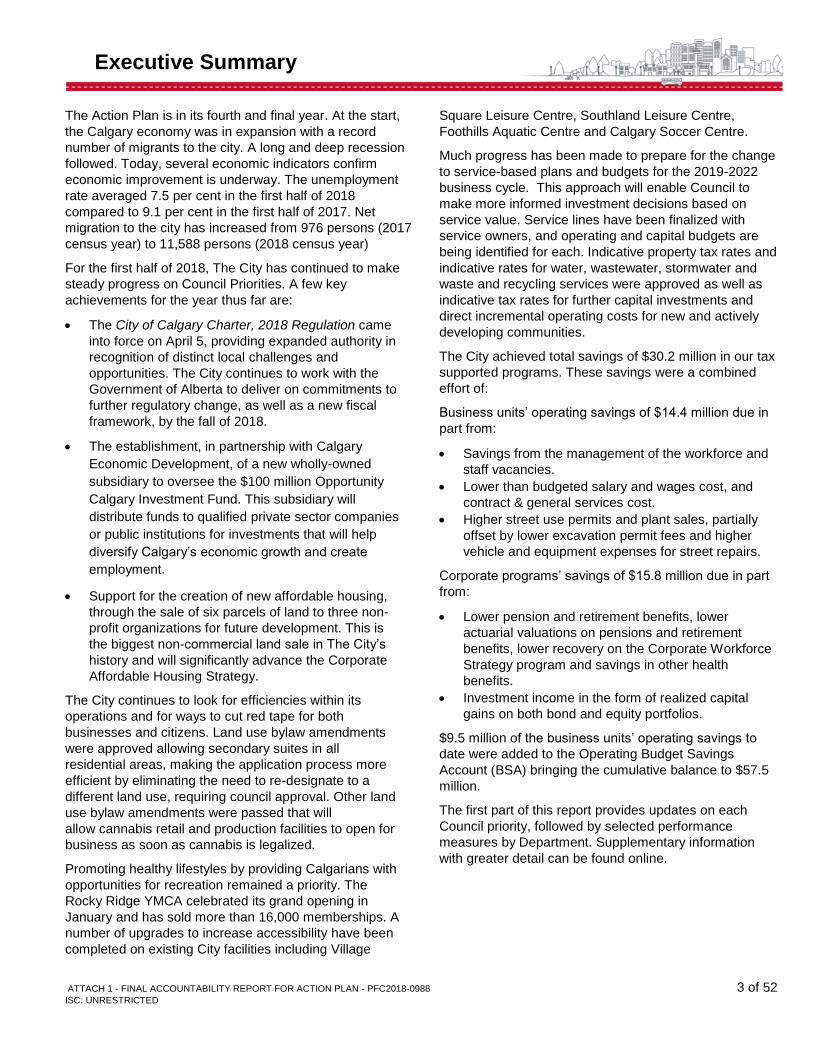
The 2018 civic census placed the city’s population at
1,267,334 up 21,007 people from 2017. Natural increase
contributed 9,419 to population growth, while net
migration was estimated at 11,588 persons, a significant
increase over 2017 when Calgary saw a net in migration
of only 976 persons.
Housing stock continues to increase with an addition of
8,999 dwelling units, bringing the total number of
dwellings in Calgary to 515,391, an increase of 1.77 per
cent. The overall vacancy rate is down almost a full
percent from last year to 3.86 per cent though vacancies
in apartments and high-rise condos remain elevated at
just under 8 per cent in 2018. The vacancy rate among
single family homes dropped slightly to 1.86 per cent
from 2.0 per cent last year.
The unemployment rate in the first half of 2018 averaged
7.5 per cent compared to 9.1 per cent in the first half of
2017. The unemployment rate is expected to taper down
to the 5 to 6 per cent range by mid-2020. The slow
improvement in the unemployment rate is the result of
multiple factors. First, at the end of a recession jobs tend
to become available and people who exited the labour
force tend to return and as a result unemployment rates
tend to remain high even as the number of employed
people increase. Secondly, this recession saw the
elimination of thousands of high paying jobs. The service
economy that is responsible for most new jobs today
does not pay as well and so people are reluctant to take
those positions.
The wage inflation rate for the first 5 months of 2018
averaged 2.7 per cent compared to the first 5 months of
2017. Comparatively, there was no wage inflation in
Alberta between the first 5 months of 2016 and the first 5
months of 2017. Significant wage increases occurred in
service industries like; utilities, finance, insurance, health
care accounting and legal services. Wages did not
increase significantly in goods producing industries like
energy.
The City continues to collaborate with regional partners
and the Government of Alberta to establish a Growth
Management Board in 2018. Once established, The City
will need to be active partners in the development of a
legislated Metropolitan Regional Growth Plan and a
Metropolitan Regional Servicing Plan as these plans will
have significant implications on The City.
To support the expanded authorities being provided
through the City Charter and the Modernized Municipal
Governance Act, The City continues to work with the
Government of Alberta and The City of Edmonton to
adopt a new fiscal framework that better reflects the roles
and responsibilities of Alberta’s two big cities.
1
1.05
1.1
1.15
1.2
1.25
1.3
2012 2013 2014 2015 2016 2017 2018
City of Calgary Population(millions)
Action Plan Forecast (2014) Actual (2018)
ATTACH 1 - FINAL ACCOUNTABILITY REPORT FOR ACTION PLAN - PFC2018-0988 5 of 52 ISC: UNRESTRICTED
Council Priorities 2015-2018
These five Priorities set the direction for 2015 to 2018,
describing the outcomes that are most important for the
City of Calgary.
Council Priorities are founded on the 100-year
community vision, long-term goals and aspirations
articulated by Calgarians through imagineCalgary. They
were also influenced by information on key trends and
emerging issues anticipated in the next four years, the
views of Calgarians as expressed through extensive
citizen engagement and Council-approved long-term
plans (specifically the Municipal Development Plan and
the Calgary Transportation Plan). Council also took into
account The City’s financial projections, and funding
opportunities and constraints.
Council Priorities include 48 strategic actions to provide
direction to Administration on what is important for
moving Calgary forward. To achieve these, Action Plan
identifies over 1000 actions, including capital
investments, during 2015-2018.
Reporting on the Council Priorities
For each of the first four Council Priorities, there are two
pages. The first page describes desired community
outcomes (or results) related to the Council Priority.
These outcomes are bigger than any one program,
service, department or level of government. The whole
community including public and private partners are
needed in order to make a difference. The role and
contribution of The City is important, but equally
important is the story behind the data and the critical
role of partners in achieving results.
This first page for each of the first four Council Priorities
includes:
• A description of the priority;
• Selected quality of life indicators with
explanations;
• Identification of some key partners; and
• Identification of The City’s role and contribution
to overall community well-being.
The second of the two pages is a performance page
that shows the status of The City’s performance on each
of the Strategic Actions under the priority. It also
includes highlights of noteworthy achievements and
challenges that were experienced in the first half of
2018.
For the ‘well-run city’ Council Priority, the first page
includes City-wide performance measures rather than
quality of life indicators with the focus being The City of
Calgary’s performance. The second page provides a
status update on each of the Strategic Actions under
this priority as well as highlights of noteworthy
accomplishments and challenges that were experienced
in the first half of 2018.
ATTACH 1 - FINAL ACCOUNTABILITY REPORT FOR ACTION PLAN - PFC2018-0988 6 of 52 ISC: UNRESTRICTED
A prosperous city
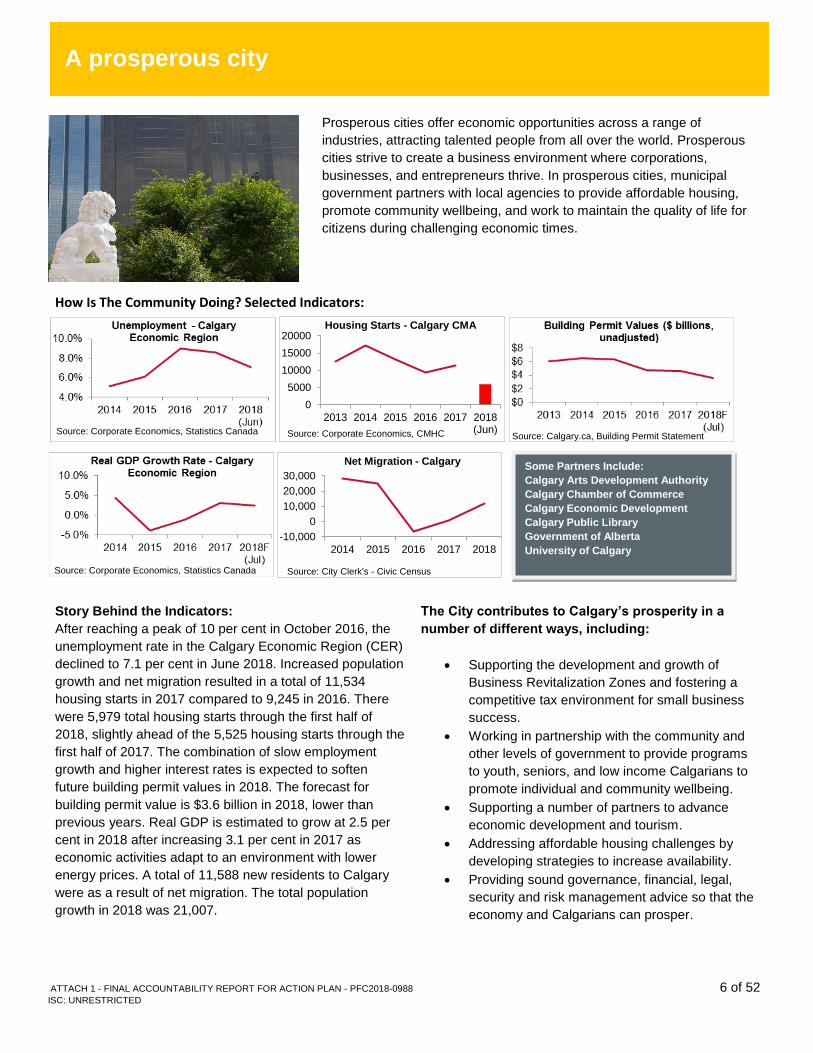
Prosperous cities offer economic opportunities across a range of
industries, attracting talented people from all over the world. Prosperous
cities strive to create a business environment where corporations,
businesses, and entrepreneurs thrive. In prosperous cities, municipal
government partners with local agencies to provide affordable housing,
promote community wellbeing, and work to maintain the quality of life for
citizens during challenging economic times.
How Is The Community Doing? Selected Indicators:
Story Behind the Indicators:
After reaching a peak of 10 per cent in October 2016, the
unemployment rate in the Calgary Economic Region (CER)
declined to 7.1 per cent in June 2018. Increased population
growth and net migration resulted in a total of 11,534
housing starts in 2017 compared to 9,245 in 2016. There
were 5,979 total housing starts through the first half of
2018, slightly ahead of the 5,525 housing starts through the
first half of 2017. The combination of slow employment
growth and higher interest rates is expected to soften
future building permit values in 2018. The forecast for
building permit value is $3.6 billion in 2018, lower than
previous years. Real GDP is estimated to grow at 2.5 per
cent in 2018 after increasing 3.1 per cent in 2017 as
economic activities adapt to an environment with lower
energy prices. A total of 11,588 new residents to Calgary
were as a result of net migration. The total population
growth in 2018 was 21,007.
The City contributes to Calgary’s prosperity in a
number of different ways, including:
• Supporting the development and growth of
Business Revitalization Zones and fostering a
competitive tax environment for small business
success.
• Working in partnership with the community and
other levels of government to provide programs
to youth, seniors, and low income Calgarians to
promote individual and community wellbeing.
• Supporting a number of partners to advance
economic development and tourism.
• Addressing affordable housing challenges by
developing strategies to increase availability.
• Providing sound governance, financial, legal,
security and risk management advice so that the
economy and Calgarians can prosper.
Source: Calgary.ca, Building Permit Statement
Source: Corporate Economics, Statistics Canada
Some Partners Include:
Calgary Arts Development Authority
Calgary Chamber of Commerce
Calgary Economic Development
Calgary Public Library
Government of Alberta
University of Calgary
-10,000
0
10,000
20,000
30,000
2014 2015 2016 2017 2018
Net Migration - Calgary
Source: City Clerk's - Civic Census
0
5000
10000
15000
20000
2013 2014 2015 2016 2017 2018(Jun)
Housing Starts - Calgary CMA
Source: Corporate Economics, CMHC Source: Corporate Economics, Statistics Canada
ATTACH 1 - FINAL ACCOUNTABILITY REPORT FOR ACTION PLAN - PFC2018-0988 7 of 52 ISC: UNRESTRICTED
A prosperous city Calgary continues to grow as a magnet for talent, a place where
there is opportunity for all, and the best place in Canada to start
and grow a business.
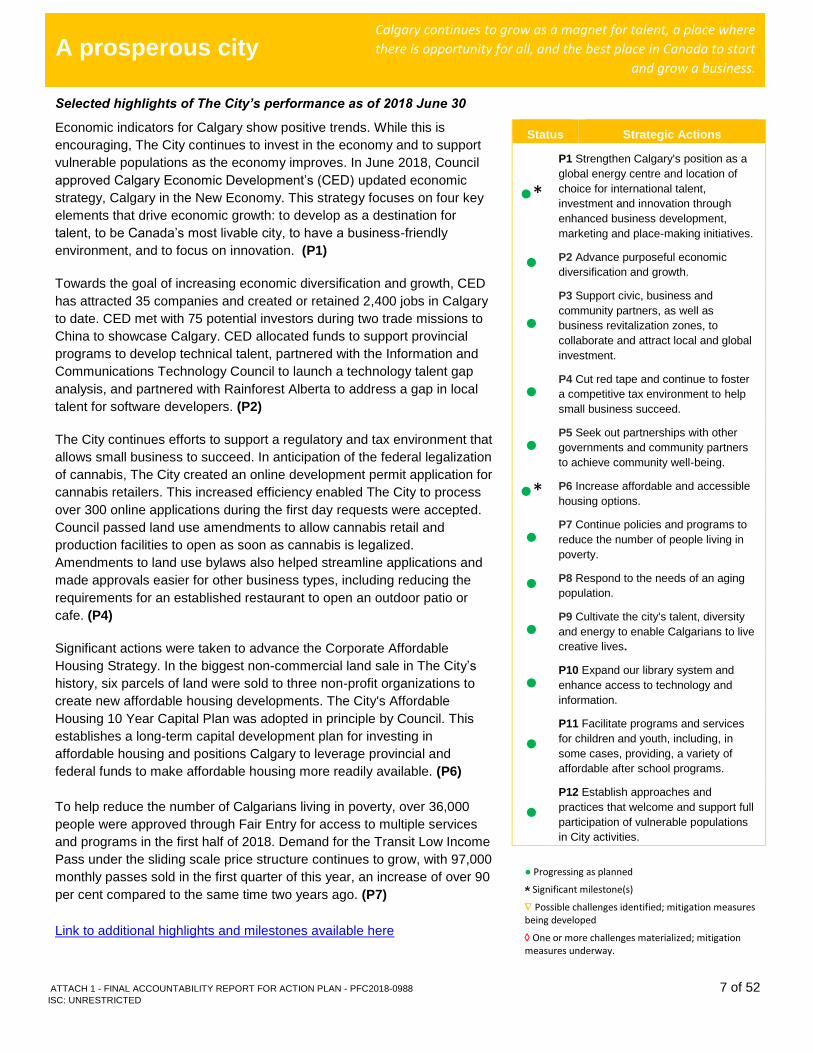
Selected highlights of The City’s performance as of 2018 June 30
Economic indicators for Calgary show positive trends. While this is
encouraging, The City continues to invest in the economy and to support
vulnerable populations as the economy improves. In June 2018, Council
approved Calgary Economic Development’s (CED) updated economic
strategy, Calgary in the New Economy. This strategy focuses on four key
elements that drive economic growth: to develop as a destination for
talent, to be Canada’s most livable city, to have a business-friendly
environment, and to focus on innovation. (P1)
Towards the goal of increasing economic diversification and growth, CED
has attracted 35 companies and created or retained 2,400 jobs in Calgary
to date. CED met with 75 potential investors during two trade missions to
China to showcase Calgary. CED allocated funds to support provincial
programs to develop technical talent, partnered with the Information and
Communications Technology Council to launch a technology talent gap
analysis, and partnered with Rainforest Alberta to address a gap in local
talent for software developers. (P2)
The City continues efforts to support a regulatory and tax environment that
allows small business to succeed. In anticipation of the federal legalization
of cannabis, The City created an online development permit application for
cannabis retailers. This increased efficiency enabled The City to process
over 300 online applications during the first day requests were accepted.
Council passed land use amendments to allow cannabis retail and
production facilities to open as soon as cannabis is legalized.
Amendments to land use bylaws also helped streamline applications and
made approvals easier for other business types, including reducing the
requirements for an established restaurant to open an outdoor patio or
cafe. (P4)
Significant actions were taken to advance the Corporate Affordable
Housing Strategy. In the biggest non-commercial land sale in The City’s
history, six parcels of land were sold to three non-profit organizations to
create new affordable housing developments. The City's Affordable
Housing 10 Year Capital Plan was adopted in principle by Council. This
establishes a long-term capital development plan for investing in
affordable housing and positions Calgary to leverage provincial and
federal funds to make affordable housing more readily available. (P6)
To help reduce the number of Calgarians living in poverty, over 36,000
people were approved through Fair Entry for access to multiple services
and programs in the first half of 2018. Demand for the Transit Low Income
Pass under the sliding scale price structure continues to grow, with 97,000
monthly passes sold in the first quarter of this year, an increase of over 90
per cent compared to the same time two years ago. (P7)
Status Strategic Actions
●*
P1 Strengthen Calgary's position as a
global energy centre and location of
choice for international talent,
investment and innovation through
enhanced business development,
marketing and place-making initiatives.
● P2 Advance purposeful economic
diversification and growth.
●
P3 Support civic, business and
community partners, as well as
business revitalization zones, to
collaborate and attract local and global
investment.
● P4 Cut red tape and continue to foster
a competitive tax environment to help
small business succeed.
● P5 Seek out partnerships with other
governments and community partners
to achieve community well-being.
●* P6 Increase affordable and accessible
housing options.
● P7 Continue policies and programs to
reduce the number of people living in
poverty.
● P8 Respond to the needs of an aging
population.
● P9 Cultivate the city's talent, diversity
and energy to enable Calgarians to live
creative lives.
● P10 Expand our library system and
enhance access to technology and
information.
● P11 Facilitate programs and services
for children and youth, including, in
some cases, providing, a variety of
affordable after school programs.
● P12 Establish approaches and
practices that welcome and support full
participation of vulnerable populations
in City activities.
● Progressing as planned
* Significant milestone(s)
Possible challenges identified; mitigation measures being developed
One or more challenges materialized; mitigation measures underway.
Link to additional highlights and milestones available here
ATTACH 1 - FINAL ACCOUNTABILITY REPORT FOR ACTION PLAN - PFC2018-0988 8 of 52 ISC: UNRESTRICTED
A prosperous city A city of inspiring neighbourhoods
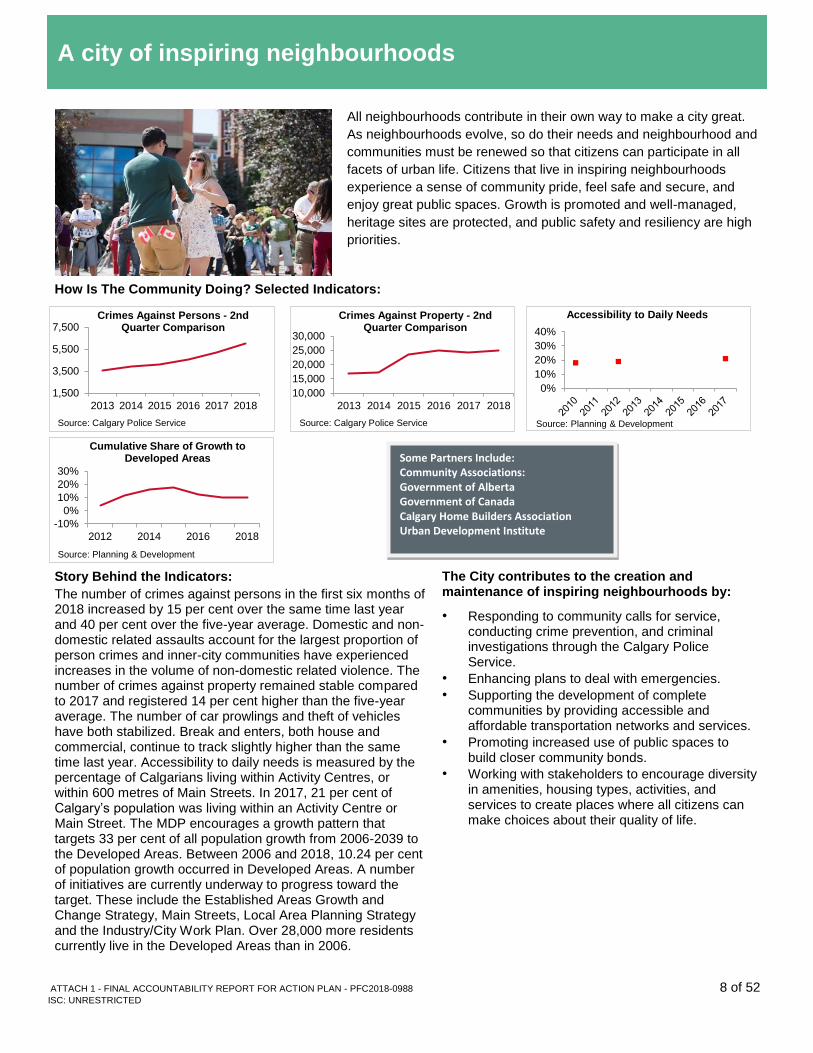
All neighbourhoods contribute in their own way to make a city great.
As neighbourhoods evolve, so do their needs and neighbourhood and
communities must be renewed so that citizens can participate in all
facets of urban life. Citizens that live in inspiring neighbourhoods
experience a sense of community pride, feel safe and secure, and
enjoy great public spaces. Growth is promoted and well-managed,
heritage sites are protected, and public safety and resiliency are high
priorities.
How Is The Community Doing? Selected Indicators:
Story Behind the Indicators:
The number of crimes against persons in the first six months of 2018 increased by 15 per cent over the same time last year and 40 per cent over the five-year average. Domestic and non-domestic related assaults account for the largest proportion of person crimes and inner-city communities have experienced increases in the volume of non-domestic related violence. The number of crimes against property remained stable compared to 2017 and registered 14 per cent higher than the five-year average. The number of car prowlings and theft of vehicles have both stabilized. Break and enters, both house and commercial, continue to track slightly higher than the same time last year. Accessibility to daily needs is measured by the percentage of Calgarians living within Activity Centres, or within 600 metres of Main Streets. In 2017, 21 per cent of Calgary’s population was living within an Activity Centre or Main Street. The MDP encourages a growth pattern that targets 33 per cent of all population growth from 2006-2039 to the Developed Areas. Between 2006 and 2018, 10.24 per cent of population growth occurred in Developed Areas. A number of initiatives are currently underway to progress toward the target. These include the Established Areas Growth and Change Strategy, Main Streets, Local Area Planning Strategy and the Industry/City Work Plan. Over 28,000 more residents currently live in the Developed Areas than in 2006.
The City contributes to the creation and maintenance of inspiring neighbourhoods by:
• Responding to community calls for service, conducting crime prevention, and criminal investigations through the Calgary Police Service.
• Enhancing plans to deal with emergencies.
• Supporting the development of complete communities by providing accessible and affordable transportation networks and services.
• Promoting increased use of public spaces to build closer community bonds.
• Working with stakeholders to encourage diversity in amenities, housing types, activities, and services to create places where all citizens can make choices about their quality of life.
1,500
3,500
5,500
7,500
2013 2014 2015 2016 2017 2018
Crimes Against Persons - 2nd Quarter Comparison
10,000
15,000
20,000
25,000
30,000
2013 2014 2015 2016 2017 2018
Crimes Against Property - 2nd Quarter Comparison
0%
10%
20%
30%
40%
Accessibility to Daily Needs
Source: Planning & Development
-10%
0%
10%
20%
30%
2012 2014 2016 2018
Cumulative Share of Growth to Developed Areas Some Partners Include:
Community Associations: Government of Alberta Government of Canada Calgary Home Builders Association Urban Development Institute
Source: Calgary Police Service Source: Calgary Police Service
Source: Planning & Development
ATTACH 1 - FINAL ACCOUNTABILITY REPORT FOR ACTION PLAN - PFC2018-0988 9 of 52 ISC: UNRESTRICTED
A city of inspiring neighbourhoods
Every Calgarian lives in a safe, mixed and just
neighbourhood, and has the opportunity to
participate in civic life.
Selected highlights of The City’s performance as of 2018 June 30
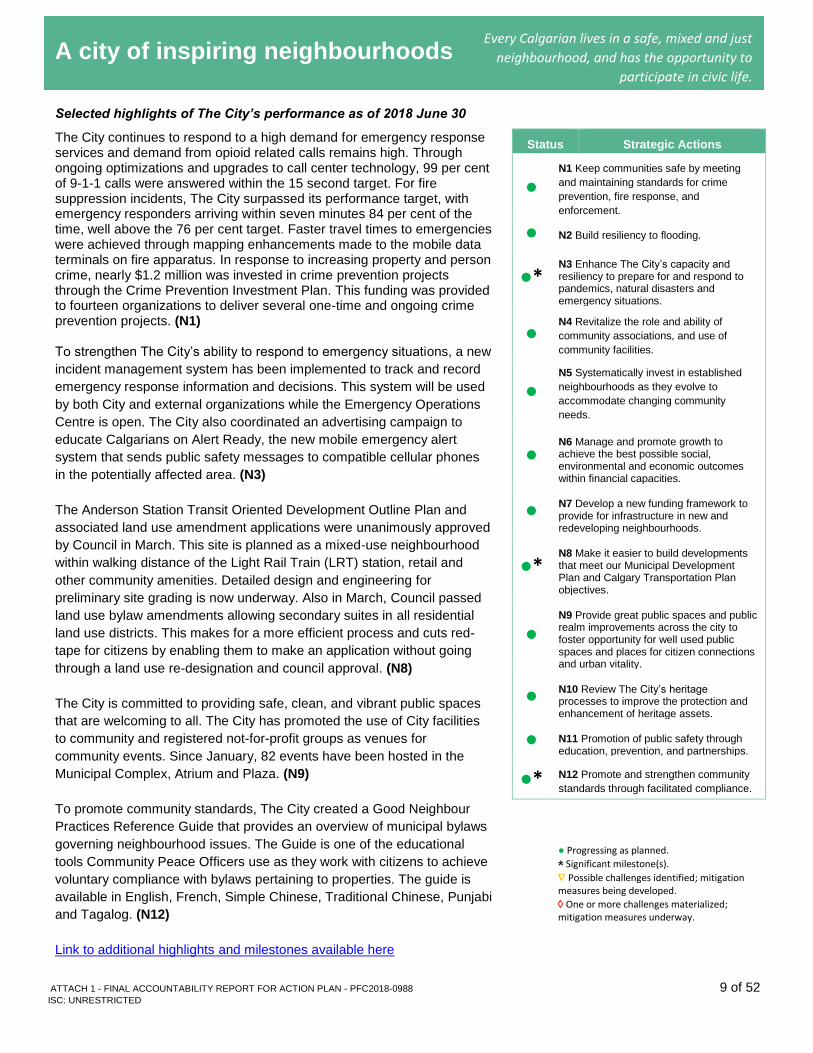
The City continues to respond to a high demand for emergency response services and demand from opioid related calls remains high. Through ongoing optimizations and upgrades to call center technology, 99 per cent of 9-1-1 calls were answered within the 15 second target. For fire suppression incidents, The City surpassed its performance target, with emergency responders arriving within seven minutes 84 per cent of the time, well above the 76 per cent target. Faster travel times to emergencies were achieved through mapping enhancements made to the mobile data terminals on fire apparatus. In response to increasing property and person crime, nearly $1.2 million was invested in crime prevention projects through the Crime Prevention Investment Plan. This funding was provided to fourteen organizations to deliver several one-time and ongoing crime prevention projects. (N1) To strengthen The City’s ability to respond to emergency situations, a new
incident management system has been implemented to track and record
emergency response information and decisions. This system will be used
by both City and external organizations while the Emergency Operations
Centre is open. The City also coordinated an advertising campaign to
educate Calgarians on Alert Ready, the new mobile emergency alert
system that sends public safety messages to compatible cellular phones
in the potentially affected area. (N3)
The Anderson Station Transit Oriented Development Outline Plan and
associated land use amendment applications were unanimously approved
by Council in March. This site is planned as a mixed-use neighbourhood
within walking distance of the Light Rail Train (LRT) station, retail and
other community amenities. Detailed design and engineering for
preliminary site grading is now underway. Also in March, Council passed
land use bylaw amendments allowing secondary suites in all residential
land use districts. This makes for a more efficient process and cuts red-
tape for citizens by enabling them to make an application without going
through a land use re-designation and council approval. (N8)
The City is committed to providing safe, clean, and vibrant public spaces
that are welcoming to all. The City has promoted the use of City facilities
to community and registered not-for-profit groups as venues for
community events. Since January, 82 events have been hosted in the
Municipal Complex, Atrium and Plaza. (N9)
To promote community standards, The City created a Good Neighbour
Practices Reference Guide that provides an overview of municipal bylaws
governing neighbourhood issues. The Guide is one of the educational
tools Community Peace Officers use as they work with citizens to achieve
voluntary compliance with bylaws pertaining to properties. The guide is
available in English, French, Simple Chinese, Traditional Chinese, Punjabi
and Tagalog. (N12)
Link to additional highlights and milestones available here
Status Strategic Actions
● N1 Keep communities safe by meeting
and maintaining standards for crime
prevention, fire response, and
enforcement.
● N2 Build resiliency to flooding.
●*
N3 Enhance The City’s capacity and resiliency to prepare for and respond to pandemics, natural disasters and emergency situations.
● N4 Revitalize the role and ability of
community associations, and use of
community facilities.
● N5 Systematically invest in established
neighbourhoods as they evolve to
accommodate changing community
needs.
●
N6 Manage and promote growth to achieve the best possible social, environmental and economic outcomes within financial capacities.
● N7 Develop a new funding framework to provide for infrastructure in new and redeveloping neighbourhoods.
●*
N8 Make it easier to build developments that meet our Municipal Development Plan and Calgary Transportation Plan objectives.
●
N9 Provide great public spaces and public realm improvements across the city to foster opportunity for well used public spaces and places for citizen connections and urban vitality.
● N10 Review The City’s heritage processes to improve the protection and enhancement of heritage assets.
● N11 Promotion of public safety through education, prevention, and partnerships.
●* N12 Promote and strengthen community
standards through facilitated compliance.
● Progressing as planned.
* Significant milestone(s).
Possible challenges identified; mitigation measures being developed.
One or more challenges materialized; mitigation measures underway.
ATTACH 1 - FINAL ACCOUNTABILITY REPORT FOR ACTION PLAN - PFC2018-0988 10 of 52 ISC: UNRESTRICTED
A city that moves
The movement of people and goods throughout the city is made
possible by providing a safe, efficient, and accessible
transportation network used every day by citizens, commuters and
visitors. Getting around is a top priority among citizens and
influences daily quality of life. Efficient movement of workers and
goods helps foster economic development in and around Calgary.
Access to a variety of transportation options (including walking,
cycling, public transit, driving, parking and taxis) that are affordable
and convenient is critical to ensuring a city continues to move well.
Effective emergency response depends on a safe and secure
transportation system.
How Is The Community Doing? Selected Indicators:
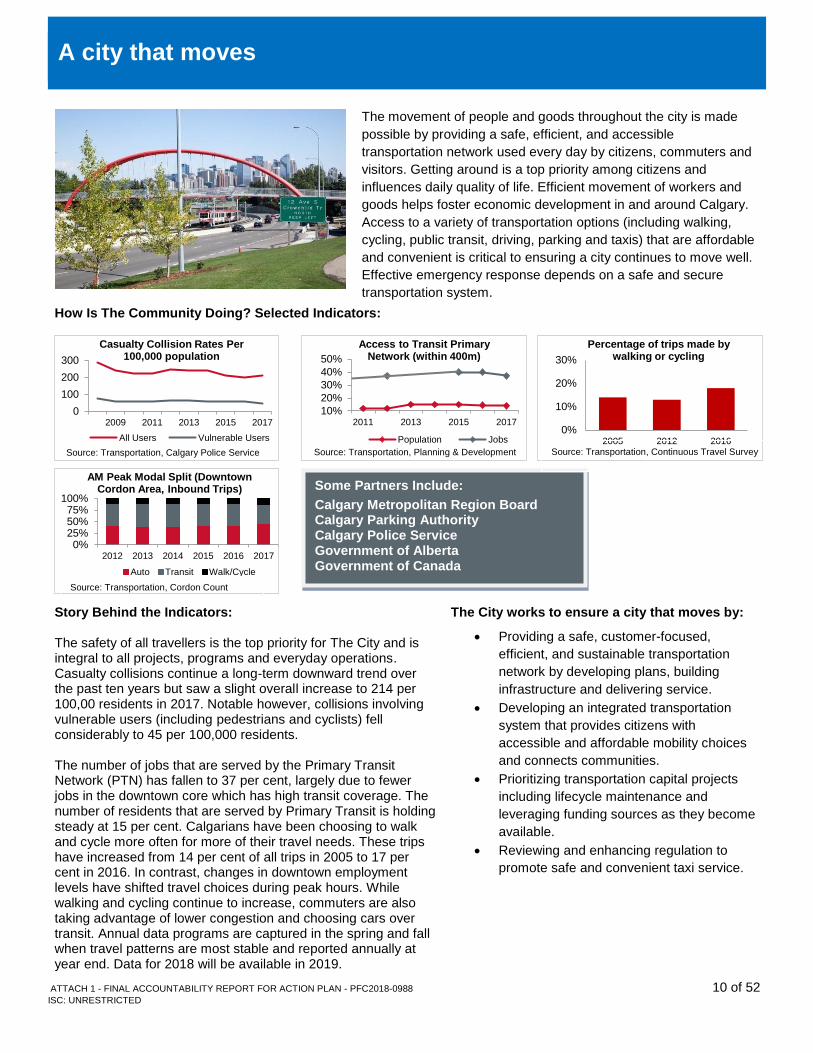
Story Behind the Indicators: The safety of all travellers is the top priority for The City and is integral to all projects, programs and everyday operations. Casualty collisions continue a long-term downward trend over the past ten years but saw a slight overall increase to 214 per 100,00 residents in 2017. Notable however, collisions involving vulnerable users (including pedestrians and cyclists) fell considerably to 45 per 100,000 residents. The number of jobs that are served by the Primary Transit Network (PTN) has fallen to 37 per cent, largely due to fewer jobs in the downtown core which has high transit coverage. The number of residents that are served by Primary Transit is holding steady at 15 per cent. Calgarians have been choosing to walk and cycle more often for more of their travel needs. These trips have increased from 14 per cent of all trips in 2005 to 17 per cent in 2016. In contrast, changes in downtown employment levels have shifted travel choices during peak hours. While walking and cycling continue to increase, commuters are also taking advantage of lower congestion and choosing cars over transit. Annual data programs are captured in the spring and fall when travel patterns are most stable and reported annually at year end. Data for 2018 will be available in 2019.
The City works to ensure a city that moves by:
• Providing a safe, customer-focused,
efficient, and sustainable transportation
network by developing plans, building
infrastructure and delivering service.
• Developing an integrated transportation
system that provides citizens with
accessible and affordable mobility choices
and connects communities.
• Prioritizing transportation capital projects
including lifecycle maintenance and
leveraging funding sources as they become
available.
• Reviewing and enhancing regulation to
promote safe and convenient taxi service.
0%
10%
20%
30%
2005 2012 2016
Percentage of trips made by walking or cycling
0
100
200
300
2009 2011 2013 2015 2017
Casualty Collision Rates Per 100,000 population
All Users Vulnerable Users
10%
20%
30%
40%
50%
2011 2013 2015 2017
Access to Transit Primary Network (within 400m)
Population Jobs
0%25%50%75%
100%
2012 2013 2014 2015 2016 2017
AM Peak Modal Split (Downtown Cordon Area, Inbound Trips)
Auto Transit Walk/Cycle
Some Partners Include:
Calgary Metropolitan Region Board Calgary Parking Authority Calgary Police Service Government of Alberta Government of Canada
Source: Transportation, Calgary Police Service Source: Transportation, Planning & Development
Source: Transportation, Continuous Travel Survey
Source: Transportation, Cordon Count
ATTACH 1 - FINAL ACCOUNTABILITY REPORT FOR ACTION PLAN - PFC2018-0988 11 of 52 ISC: UNRESTRICTED
A city that moves People and goods can move well and safely throughout the
city, using a variety of convenient, affordable, accessible and
efficient transportation choices.
Selected highlights of The City’s performance as of 2018 June 30
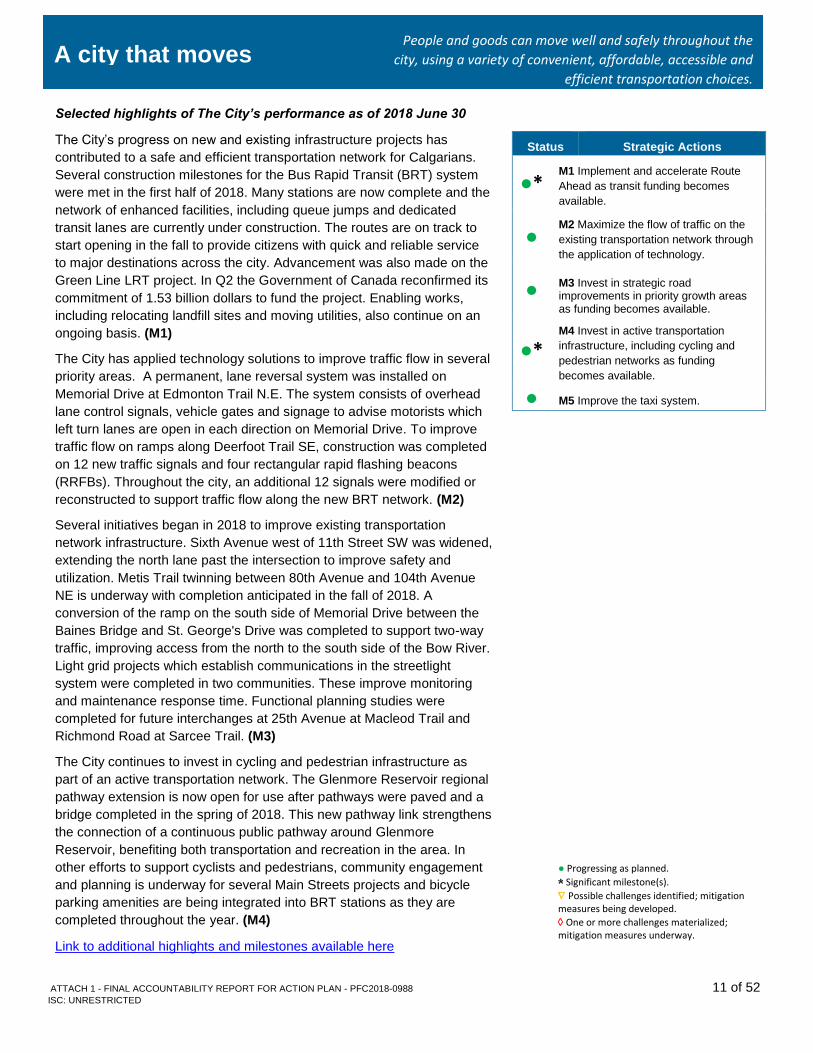
The City’s progress on new and existing infrastructure projects has
contributed to a safe and efficient transportation network for Calgarians.
Several construction milestones for the Bus Rapid Transit (BRT) system
were met in the first half of 2018. Many stations are now complete and the
network of enhanced facilities, including queue jumps and dedicated
transit lanes are currently under construction. The routes are on track to
start opening in the fall to provide citizens with quick and reliable service
to major destinations across the city. Advancement was also made on the
Green Line LRT project. In Q2 the Government of Canada reconfirmed its
commitment of 1.53 billion dollars to fund the project. Enabling works,
including relocating landfill sites and moving utilities, also continue on an
ongoing basis. (M1)
The City has applied technology solutions to improve traffic flow in several
priority areas. A permanent, lane reversal system was installed on
Memorial Drive at Edmonton Trail N.E. The system consists of overhead
lane control signals, vehicle gates and signage to advise motorists which
left turn lanes are open in each direction on Memorial Drive. To improve
traffic flow on ramps along Deerfoot Trail SE, construction was completed
on 12 new traffic signals and four rectangular rapid flashing beacons
(RRFBs). Throughout the city, an additional 12 signals were modified or
reconstructed to support traffic flow along the new BRT network. (M2)
Several initiatives began in 2018 to improve existing transportation
network infrastructure. Sixth Avenue west of 11th Street SW was widened,
extending the north lane past the intersection to improve safety and
utilization. Metis Trail twinning between 80th Avenue and 104th Avenue
NE is underway with completion anticipated in the fall of 2018. A
conversion of the ramp on the south side of Memorial Drive between the
Baines Bridge and St. George's Drive was completed to support two-way
traffic, improving access from the north to the south side of the Bow River.
Light grid projects which establish communications in the streetlight
system were completed in two communities. These improve monitoring
and maintenance response time. Functional planning studies were
completed for future interchanges at 25th Avenue at Macleod Trail and
Richmond Road at Sarcee Trail. (M3)
The City continues to invest in cycling and pedestrian infrastructure as
part of an active transportation network. The Glenmore Reservoir regional
pathway extension is now open for use after pathways were paved and a
bridge completed in the spring of 2018. This new pathway link strengthens
the connection of a continuous public pathway around Glenmore
Reservoir, benefiting both transportation and recreation in the area. In
other efforts to support cyclists and pedestrians, community engagement
and planning is underway for several Main Streets projects and bicycle
parking amenities are being integrated into BRT stations as they are
completed throughout the year. (M4)
Status Strategic Actions
●* M1 Implement and accelerate Route
Ahead as transit funding becomes
available.
● M2 Maximize the flow of traffic on the
existing transportation network through
the application of technology.
● M3 Invest in strategic road improvements in priority growth areas as funding becomes available.
●* M4 Invest in active transportation
infrastructure, including cycling and
pedestrian networks as funding
becomes available.
● M5 Improve the taxi system.
● Progressing as planned.
* Significant milestone(s).
Possible challenges identified; mitigation measures being developed.
One or more challenges materialized; mitigation measures underway.
Link to additional highlights and milestones available here
ATTACH 1 - FINAL ACCOUNTABILITY REPORT FOR ACTION PLAN - PFC2018-0988
ISC: UNRESTRICTED 12 of 52
A healthy and green city
Environmental stewardship is a shared responsibility of government,
business, communities, and individual citizens. Collectively they
make decisions and take action to conserve energy and other
resources, protect air and water quality, and minimize waste and
pollution. A healthy and green city includes a well-planned and
maintained mix of urban forest, parks, pathways, recreation
amenities, and natural areas. Healthy lifestyles are supported through
access to facilities and programs to promote health and well-being,
and through services that enable active modes of travel and
community engagement.
How Is The Community Doing? Selected Indicators:
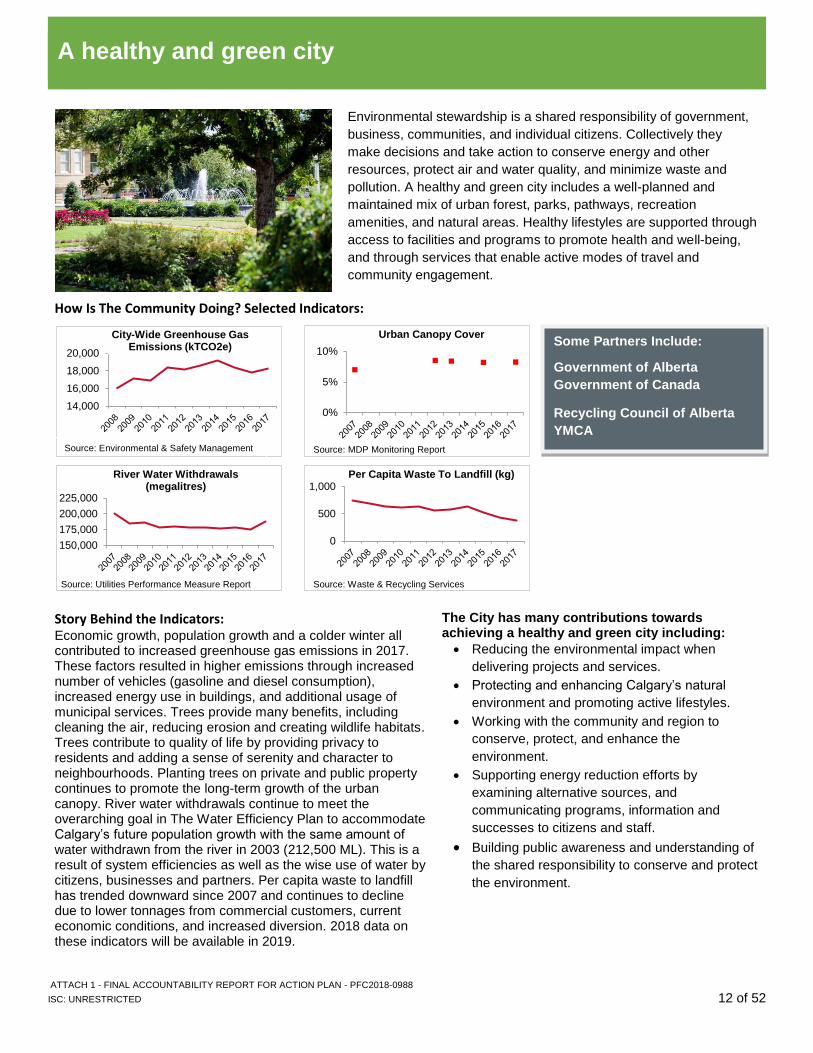
Story Behind the Indicators: Economic growth, population growth and a colder winter all contributed to increased greenhouse gas emissions in 2017. These factors resulted in higher emissions through increased number of vehicles (gasoline and diesel consumption), increased energy use in buildings, and additional usage of municipal services. Trees provide many benefits, including cleaning the air, reducing erosion and creating wildlife habitats. Trees contribute to quality of life by providing privacy to residents and adding a sense of serenity and character to neighbourhoods. Planting trees on private and public property continues to promote the long-term growth of the urban canopy. River water withdrawals continue to meet the overarching goal in The Water Efficiency Plan to accommodate Calgary’s future population growth with the same amount of water withdrawn from the river in 2003 (212,500 ML). This is a result of system efficiencies as well as the wise use of water by citizens, businesses and partners. Per capita waste to landfill has trended downward since 2007 and continues to decline due to lower tonnages from commercial customers, current economic conditions, and increased diversion. 2018 data on these indicators will be available in 2019.
The City has many contributions towards achieving a healthy and green city including:
• Reducing the environmental impact when
delivering projects and services.
• Protecting and enhancing Calgary’s natural
environment and promoting active lifestyles.
• Working with the community and region to
conserve, protect, and enhance the
environment.
• Supporting energy reduction efforts by
examining alternative sources, and
communicating programs, information and
successes to citizens and staff.
• Building public awareness and understanding of
the shared responsibility to conserve and protect
the environment.
0%
5%
10%
Urban Canopy Cover
0
500
1,000Per Capita Waste To Landfill (kg)
150,000
175,000
200,000
225,000
River Water Withdrawals (megalitres)
14,000
16,000
18,000
20,000
City-Wide Greenhouse Gas Emissions (kTCO2e) Some Partners Include:
Government of Alberta
Government of Canada
Recycling Council of Alberta
YMCA
Source: Waste & Recycling Services
Source: Environmental & Safety Management
Source: Utilities Performance Measure Report
Source: MDP Monitoring Report
ATTACH 1 - FINAL ACCOUNTABILITY REPORT FOR ACTION PLAN - PFC2018-0988
ISC: UNRESTRICTED 13 of 52
A healthy and green city
We steward our air, land, and water while encouraging
healthy lifestyles for all Calgarians.
Selected highlights of The City’s performance as of 2018 June 30
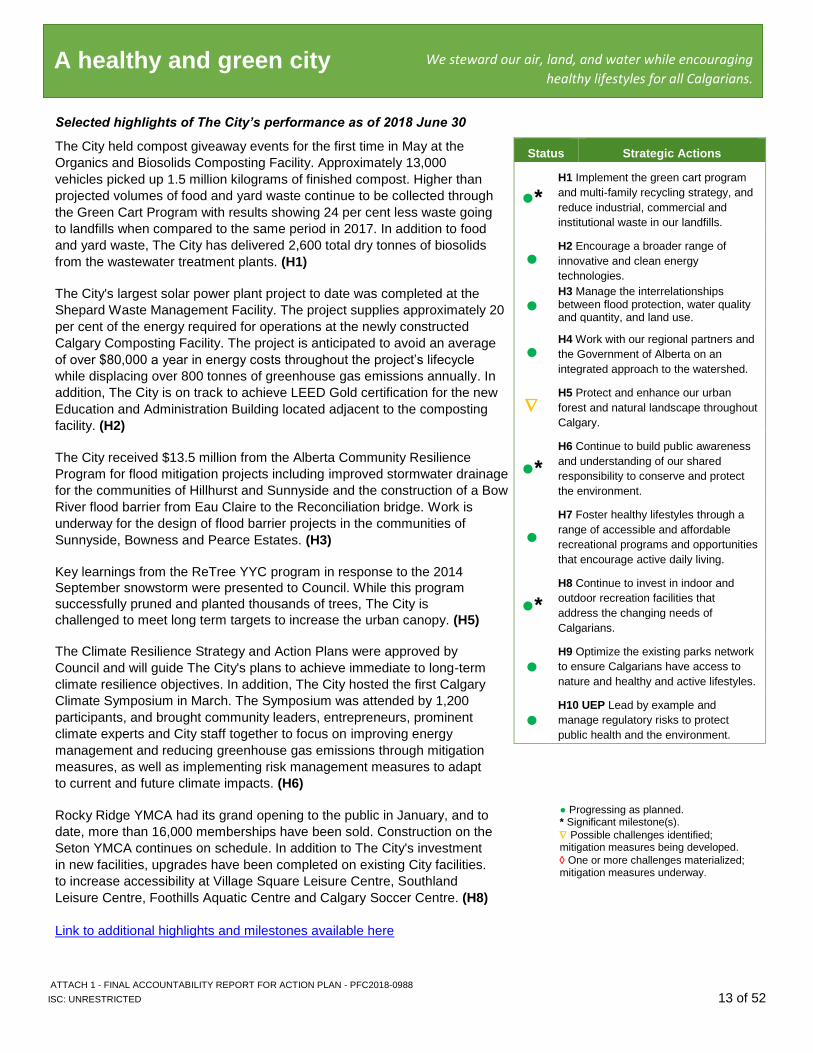
The City held compost giveaway events for the first time in May at the
Organics and Biosolids Composting Facility. Approximately 13,000
vehicles picked up 1.5 million kilograms of finished compost. Higher than
projected volumes of food and yard waste continue to be collected through
the Green Cart Program with results showing 24 per cent less waste going
to landfills when compared to the same period in 2017. In addition to food
and yard waste, The City has delivered 2,600 total dry tonnes of biosolids
from the wastewater treatment plants. (H1)
The City's largest solar power plant project to date was completed at the
Shepard Waste Management Facility. The project supplies approximately 20
per cent of the energy required for operations at the newly constructed
Calgary Composting Facility. The project is anticipated to avoid an average
of over $80,000 a year in energy costs throughout the project’s lifecycle
while displacing over 800 tonnes of greenhouse gas emissions annually. In
addition, The City is on track to achieve LEED Gold certification for the new
Education and Administration Building located adjacent to the composting
facility. (H2)
The City received $13.5 million from the Alberta Community Resilience
Program for flood mitigation projects including improved stormwater drainage
for the communities of Hillhurst and Sunnyside and the construction of a Bow
River flood barrier from Eau Claire to the Reconciliation bridge. Work is
underway for the design of flood barrier projects in the communities of
Sunnyside, Bowness and Pearce Estates. (H3)
Key learnings from the ReTree YYC program in response to the 2014
September snowstorm were presented to Council. While this program
successfully pruned and planted thousands of trees, The City is
challenged to meet long term targets to increase the urban canopy. (H5)
The Climate Resilience Strategy and Action Plans were approved by
Council and will guide The City's plans to achieve immediate to long-term
climate resilience objectives. In addition, The City hosted the first Calgary
Climate Symposium in March. The Symposium was attended by 1,200
participants, and brought community leaders, entrepreneurs, prominent
climate experts and City staff together to focus on improving energy
management and reducing greenhouse gas emissions through mitigation
measures, as well as implementing risk management measures to adapt
to current and future climate impacts. (H6)
Rocky Ridge YMCA had its grand opening to the public in January, and to
date, more than 16,000 memberships have been sold. Construction on the
Seton YMCA continues on schedule. In addition to The City's investment
in new facilities, upgrades have been completed on existing City facilities.
to increase accessibility at Village Square Leisure Centre, Southland
Leisure Centre, Foothills Aquatic Centre and Calgary Soccer Centre. (H8)
Status Strategic Actions
●* H1 Implement the green cart program
and multi-family recycling strategy, and
reduce industrial, commercial and
institutional waste in our landfills.
● H2 Encourage a broader range of
innovative and clean energy
technologies.
● H3 Manage the interrelationships between flood protection, water quality and quantity, and land use.
● H4 Work with our regional partners and
the Government of Alberta on an
integrated approach to the watershed.
H5 Protect and enhance our urban
forest and natural landscape throughout
Calgary.
●*
H6 Continue to build public awareness
and understanding of our shared
responsibility to conserve and protect
the environment.
●
H7 Foster healthy lifestyles through a
range of accessible and affordable
recreational programs and opportunities
that encourage active daily living.
●*
H8 Continue to invest in indoor and
outdoor recreation facilities that
address the changing needs of
Calgarians.
●
H9 Optimize the existing parks network
to ensure Calgarians have access to
nature and healthy and active lifestyles.
●
H10 UEP Lead by example and
manage regulatory risks to protect
public health and the environment.
● Progressing as planned. * Significant milestone(s).
Possible challenges identified; mitigation measures being developed.
One or more challenges materialized; mitigation measures underway.
Link to additional highlights and milestones available here
ATTACH 1 - FINAL ACCOUNTABILITY REPORT FOR ACTION PLAN - PFC2018-0988
ISC: UNRESTRICTED 14 of 52
People and goods can move well and safely throughout the
city, using a variety of convenient, affordable, accessible and
efficient transportation choices. A well-run city Calgary’s government is open, responsive, accountable and
transparent, delivering excellent services at a fair price. We work
with our government partners to ensure we have the tools we need.
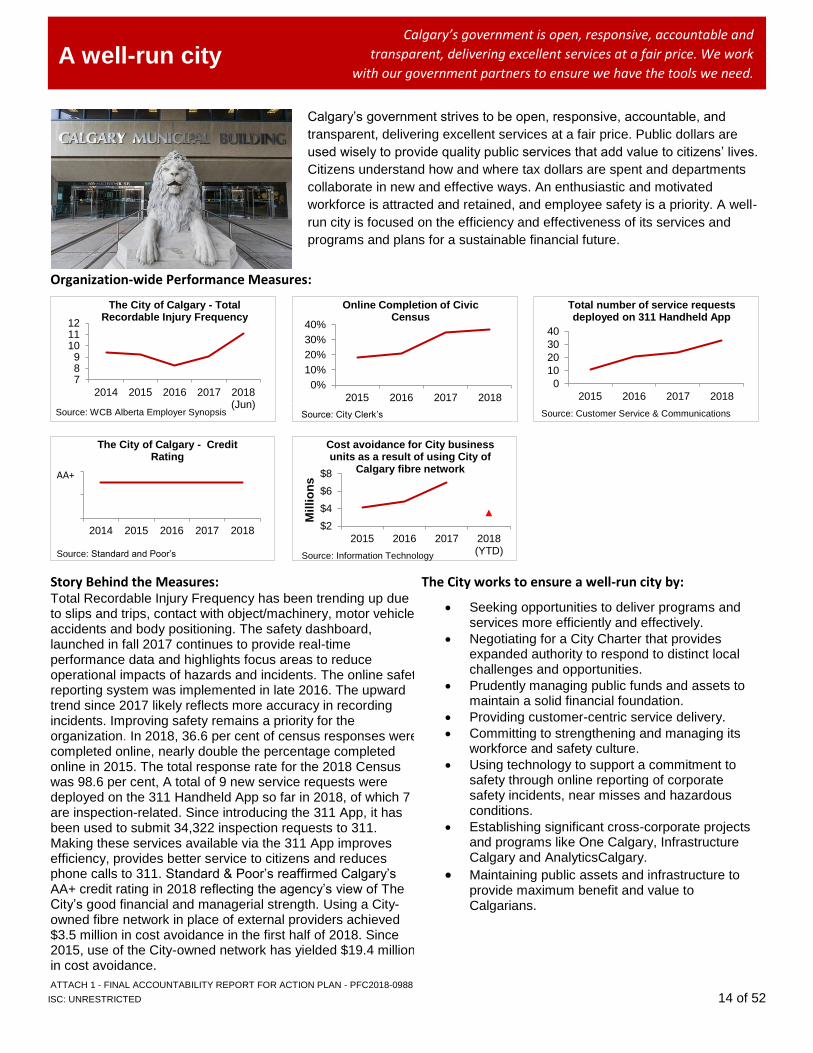
Calgary’s government strives to be open, responsive, accountable, and
transparent, delivering excellent services at a fair price. Public dollars are
used wisely to provide quality public services that add value to citizens’ lives.
Citizens understand how and where tax dollars are spent and departments
collaborate in new and effective ways. An enthusiastic and motivated
workforce is attracted and retained, and employee safety is a priority. A well-
run city is focused on the efficiency and effectiveness of its services and
programs and plans for a sustainable financial future.
Organization-wide Performance Measures:
Story Behind the Measures: Total Recordable Injury Frequency has been trending up due to slips and trips, contact with object/machinery, motor vehicle accidents and body positioning. The safety dashboard, launched in fall 2017 continues to provide real-time performance data and highlights focus areas to reduce operational impacts of hazards and incidents. The online safety reporting system was implemented in late 2016. The upward trend since 2017 likely reflects more accuracy in recording incidents. Improving safety remains a priority for the organization. In 2018, 36.6 per cent of census responses were completed online, nearly double the percentage completed online in 2015. The total response rate for the 2018 Census was 98.6 per cent, A total of 9 new service requests were deployed on the 311 Handheld App so far in 2018, of which 7 are inspection-related. Since introducing the 311 App, it has been used to submit 34,322 inspection requests to 311. Making these services available via the 311 App improves efficiency, provides better service to citizens and reduces phone calls to 311. Standard & Poor’s reaffirmed Calgary’s AA+ credit rating in 2018 reflecting the agency’s view of The City’s good financial and managerial strength. Using a City-owned fibre network in place of external providers achieved $3.5 million in cost avoidance in the first half of 2018. Since 2015, use of the City-owned network has yielded $19.4 million in cost avoidance.
The City works to ensure a well-run city by:
• Seeking opportunities to deliver programs and services more efficiently and effectively.
• Negotiating for a City Charter that provides expanded authority to respond to distinct local challenges and opportunities.
• Prudently managing public funds and assets to maintain a solid financial foundation.
• Providing customer-centric service delivery.
• Committing to strengthening and managing its workforce and safety culture.
• Using technology to support a commitment to safety through online reporting of corporate safety incidents, near misses and hazardous conditions.
• Establishing significant cross-corporate projects and programs like One Calgary, Infrastructure Calgary and AnalyticsCalgary.
• Maintaining public assets and infrastructure to provide maximum benefit and value to Calgarians.
789
101112
2014 2015 2016 2017 2018(Jun)
The City of Calgary - Total Recordable Injury Frequency
0%
10%
20%
30%
40%
2015 2016 2017 2018
Online Completion of Civic Census
0
10
20
30
40
2015 2016 2017 2018
Total number of service requests deployed on 311 Handheld App
2014 2015 2016 2017 2018
The City of Calgary - Credit Rating
$2
$4
$6
$8
2015 2016 2017 2018(YTD)
Mil
lio
ns
Cost avoidance for City business units as a result of using City of
Calgary fibre network
Source: WCB Alberta Employer Synopsis Source: City Clerk’s Source: Customer Service & Communications
Source: Standard and Poor’s
AA+
Source: Information Technology
ATTACH 1 - FINAL ACCOUNTABILITY REPORT FOR ACTION PLAN - PFC2018-0988
ISC: UNRESTRICTED 15 of 52
People and goods can move well and safely throughout the
city, using a variety of convenient, affordable, accessible and
efficient transportation choices. A well-run city Calgary’s government is open, responsive, accountable and
transparent, delivering excellent services at a fair price. We work
with our government partners to ensure we have the tools we need.
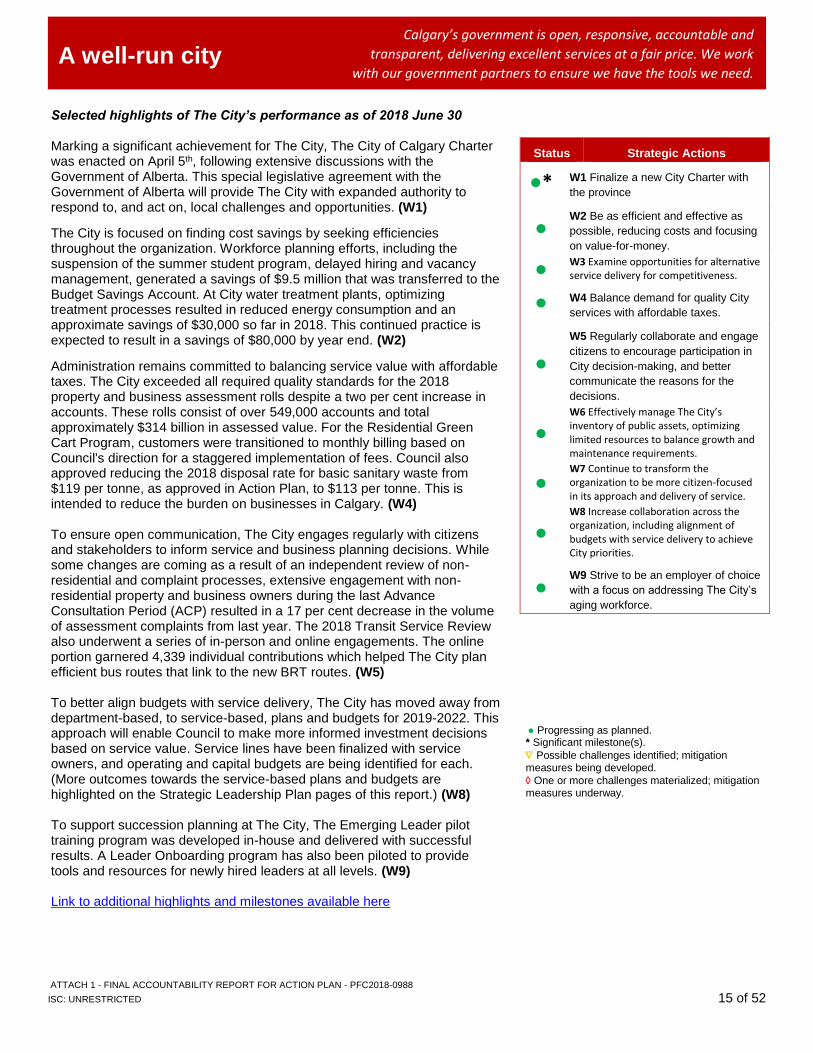
Selected highlights of The City’s performance as of 2018 June 30
Marking a significant achievement for The City, The City of Calgary Charter was enacted on April 5th, following extensive discussions with the Government of Alberta. This special legislative agreement with the Government of Alberta will provide The City with expanded authority to respond to, and act on, local challenges and opportunities. (W1)
The City is focused on finding cost savings by seeking efficiencies throughout the organization. Workforce planning efforts, including the suspension of the summer student program, delayed hiring and vacancy management, generated a savings of $9.5 million that was transferred to the Budget Savings Account. At City water treatment plants, optimizing treatment processes resulted in reduced energy consumption and an approximate savings of $30,000 so far in 2018. This continued practice is expected to result in a savings of $80,000 by year end. (W2)
Administration remains committed to balancing service value with affordable taxes. The City exceeded all required quality standards for the 2018 property and business assessment rolls despite a two per cent increase in accounts. These rolls consist of over 549,000 accounts and total approximately $314 billion in assessed value. For the Residential Green Cart Program, customers were transitioned to monthly billing based on Council's direction for a staggered implementation of fees. Council also approved reducing the 2018 disposal rate for basic sanitary waste from $119 per tonne, as approved in Action Plan, to $113 per tonne. This is intended to reduce the burden on businesses in Calgary. (W4) To ensure open communication, The City engages regularly with citizens and stakeholders to inform service and business planning decisions. While some changes are coming as a result of an independent review of non-residential and complaint processes, extensive engagement with non-residential property and business owners during the last Advance Consultation Period (ACP) resulted in a 17 per cent decrease in the volume of assessment complaints from last year. The 2018 Transit Service Review also underwent a series of in-person and online engagements. The online portion garnered 4,339 individual contributions which helped The City plan efficient bus routes that link to the new BRT routes. (W5) To better align budgets with service delivery, The City has moved away from department-based, to service-based, plans and budgets for 2019-2022. This approach will enable Council to make more informed investment decisions based on service value. Service lines have been finalized with service owners, and operating and capital budgets are being identified for each. (More outcomes towards the service-based plans and budgets are highlighted on the Strategic Leadership Plan pages of this report.) (W8) To support succession planning at The City, The Emerging Leader pilot training program was developed in-house and delivered with successful results. A Leader Onboarding program has also been piloted to provide tools and resources for newly hired leaders at all levels. (W9)
Status Strategic Actions
●* W1 Finalize a new City Charter with
the province
● W2 Be as efficient and effective as
possible, reducing costs and focusing
on value-for-money.
● W3 Examine opportunities for alternative service delivery for competitiveness.
● W4 Balance demand for quality City
services with affordable taxes.
●
W5 Regularly collaborate and engage
citizens to encourage participation in
City decision-making, and better
communicate the reasons for the
decisions.
●
W6 Effectively manage The City’s inventory of public assets, optimizing limited resources to balance growth and maintenance requirements.
● W7 Continue to transform the organization to be more citizen-focused in its approach and delivery of service.
●
W8 Increase collaboration across the organization, including alignment of budgets with service delivery to achieve City priorities.
● W9 Strive to be an employer of choice
with a focus on addressing The City’s
aging workforce.
● Progressing as planned. * Significant milestone(s).
Possible challenges identified; mitigation measures being developed.
One or more challenges materialized; mitigation measures underway.
Link to additional highlights and milestones available here
ATTACH 1 - FINAL ACCOUNTABILITY REPORT FOR ACTION PLAN - PFC2018-0988
ISC: UNRESTRICTED 16 of 52
Leadership Strategic Plan
The story behind the plan
The Leadership Strategic Plan (LSP), approved by Council
in September 2014 (C2014-0703) is the organization’s
response to Council’s and citizens’ priorities. Consistent with
our commitment to be publicly accountable, Administration
provides LSP status updates in each Accountability Report.
These two pages highlight accomplishments thus far in
2018.
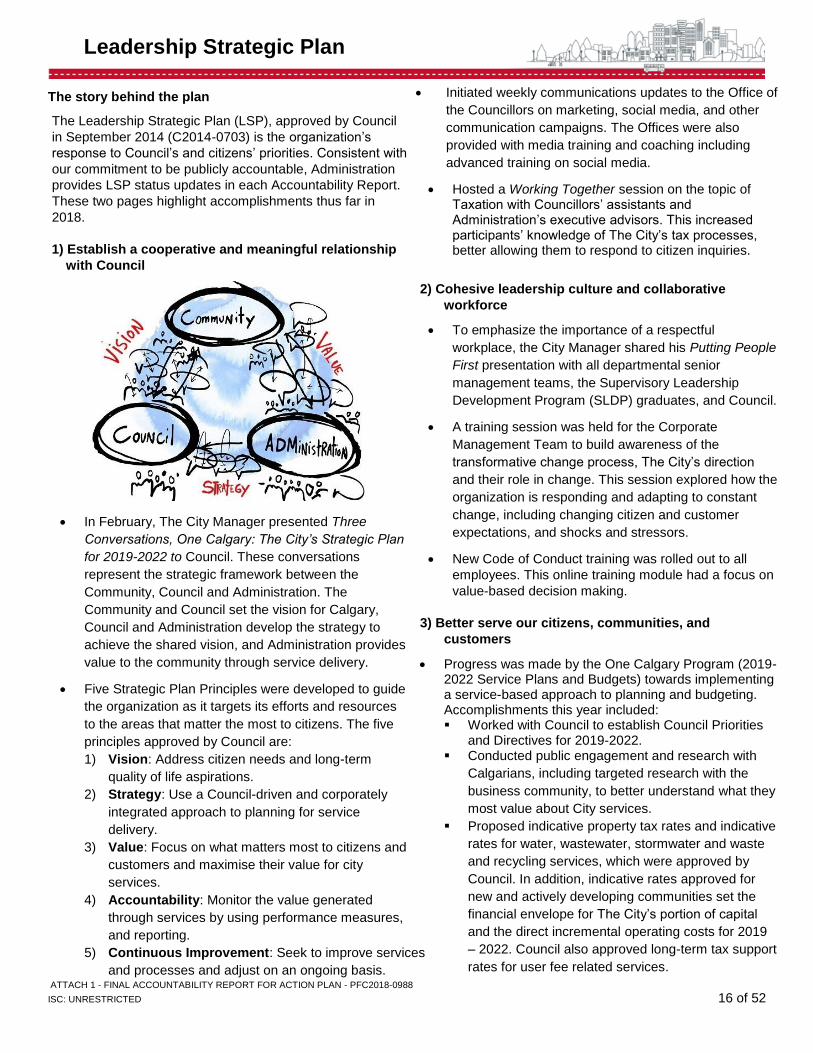
1) Establish a cooperative and meaningful relationship
with Council
• In February, The City Manager presented Three
Conversations, One Calgary: The City’s Strategic Plan
for 2019-2022 to Council. These conversations
represent the strategic framework between the
Community, Council and Administration. The
Community and Council set the vision for Calgary,
Council and Administration develop the strategy to
achieve the shared vision, and Administration provides
value to the community through service delivery.
• Five Strategic Plan Principles were developed to guide
the organization as it targets its efforts and resources
to the areas that matter the most to citizens. The five
principles approved by Council are:
1) Vision: Address citizen needs and long-term
quality of life aspirations.
2) Strategy: Use a Council-driven and corporately
integrated approach to planning for service
delivery.
3) Value: Focus on what matters most to citizens and
customers and maximise their value for city
services.
4) Accountability: Monitor the value generated
through services by using performance measures,
and reporting.
5) Continuous Improvement: Seek to improve services
and processes and adjust on an ongoing basis.
• Initiated weekly communications updates to the Office of
the Councillors on marketing, social media, and other
communication campaigns. The Offices were also
provided with media training and coaching including
advanced training on social media.
• Hosted a Working Together session on the topic of Taxation with Councillors’ assistants and Administration’s executive advisors. This increased participants’ knowledge of The City’s tax processes, better allowing them to respond to citizen inquiries.
2) Cohesive leadership culture and collaborative
workforce
• To emphasize the importance of a respectful
workplace, the City Manager shared his Putting People
First presentation with all departmental senior
management teams, the Supervisory Leadership
Development Program (SLDP) graduates, and Council.
• A training session was held for the Corporate
Management Team to build awareness of the
transformative change process, The City’s direction
and their role in change. This session explored how the
organization is responding and adapting to constant
change, including changing citizen and customer
expectations, and shocks and stressors.
• New Code of Conduct training was rolled out to all
employees. This online training module had a focus on
value-based decision making.
3) Better serve our citizens, communities, and
customers
• Progress was made by the One Calgary Program (2019-2022 Service Plans and Budgets) towards implementing a service-based approach to planning and budgeting. Accomplishments this year included: ▪ Worked with Council to establish Council Priorities
and Directives for 2019-2022. ▪ Conducted public engagement and research with
Calgarians, including targeted research with the
business community, to better understand what they
most value about City services.
▪ Proposed indicative property tax rates and indicative
rates for water, wastewater, stormwater and waste
and recycling services, which were approved by
Council. In addition, indicative rates approved for
new and actively developing communities set the
financial envelope for The City’s portion of capital
and the direct incremental operating costs for 2019
– 2022. Council also approved long-term tax support
rates for user fee related services.
ATTACH 1 - FINAL ACCOUNTABILITY REPORT FOR ACTION PLAN - PFC2018-0988
ISC: UNRESTRICTED 17 of 52
Leadership Strategic Plan
• Launched a Business Customer Research Panel with
over 700 business leaders. This group is assembled to
provide insights on issues that are important to Calgary
businesses and their ongoing relationship with The City.
The panel has been used to provide additional insight
into citizen satisfaction and perception measures as well
as provided support to the One Calgary program.
• Introduced Service Risk Registers to replace business
unit risk registers. This aligns the identification and
assessment of risks to service delivery across the
organization. The Results Based Accountability
evidence-based thinking process was also used to
enhance risk analysis of services, including greater use
of indicators and performance measures. A cross-
corporate workshop, with representatives from all
departments, identified common themes and
connections between risk profiles amongst services
lines, incorporating service level risks to City-wide
strategic risks.
• Acquired the customer relationship management product
Salesforce. This tool provides more effective monitoring
of online conversations on The City’s social media sites.
This will enable The City to better listen and respond to
online conversations and get ahead of trends and
issues. Efficiencies realized by using this technology
include improvements in 311 social media monitoring
and faster turnaround for citizen inquiries due to
collaboration functions requiring less staff time per issue.
• As a result of Information Technology’s Zero Based
Review (ZBR), the Right Device initiative is underway to
ensure employees have the right technology, no more or
less, to do their job. Annual, direct cost savings of $786
thousand are expected with an additional productivity gain
estimated at $3.8 million. Efficiency opportunities were
identified in Recreation’s ZBR that, when fully
implemented, are anticipated to bring tangible benefits.
These include up to 843,000 new visits per year to Calgary
Recreation facilities, forecast to generate an additional
$1.8 million in annual revenue, and savings up to $375
thousand per year by aligning facility hours with customer
usage.
4) Focus immediate and collective attention on planning
and building a great city
• Launched the next phase of the This is my
Neighbourhood (TIMN) online engagement and
information website to gather community feedback
from 14 Calgary neighbourhoods. TIMN provides
opportunity for residents to partner with The City to
identify how their community could become an even
better place to live, work and play.
• Established, in partnership with CED, a new wholly-
owned subsidiary to oversee the $100 million
Opportunity Calgary Investment Fund (OCIF). The
OCIF provides funds to support qualified private sector
companies or public institutions make investments to
catalyze and diversify economic growth, create
employment, and increase the property tax
assessment base.
• Developed an information package outlining The City’s
business friendly actions and initiatives which support
business development in Calgary. This information will
be used to support the Mayor and Council, CED, and
other economic or business development stakeholders
speak to the specific actions The City is taking to work
with members of the business community.
5) Strengthen the Corporation’s financial position
• To address the infrastructure funding gap and support
needed investments in Calgary’s communities, the
Deputy City Manager has led City Charter Fiscal
Framework negotiations with administrative
counterparts at the Government of Alberta. The
objective is to replace unpredictable capital grants
with capital funding based on a share of defined
provincial revenue. The new agreement is expected to
be confirmed in provincial legislation and to come into
force in 2022 once the current MSI capital grant
program has concluded in 2021.
• The City released a refresh to the Capital
Infrastructure Investment Strategy, now the Capital
Infrastructure Investment Principles. New capital
business cases for 2019-2029 have been scored and
ranked according to a new set of corporate capital
prioritization criteria, to optimize the allocation of
limited capital with service requirements to achieve
City priorities. New Capital business cases are now
consolidated into a single, cross-corporate system
(MS Project Online) to facilitate corporate oversight
and reporting.
ATTACH 1 - FINAL ACCOUNTABILITY REPORT FOR ACTION PLAN - PFC2018-0988
ISC: UNRESTRICTED 18 of 52
Operating Budget Overview
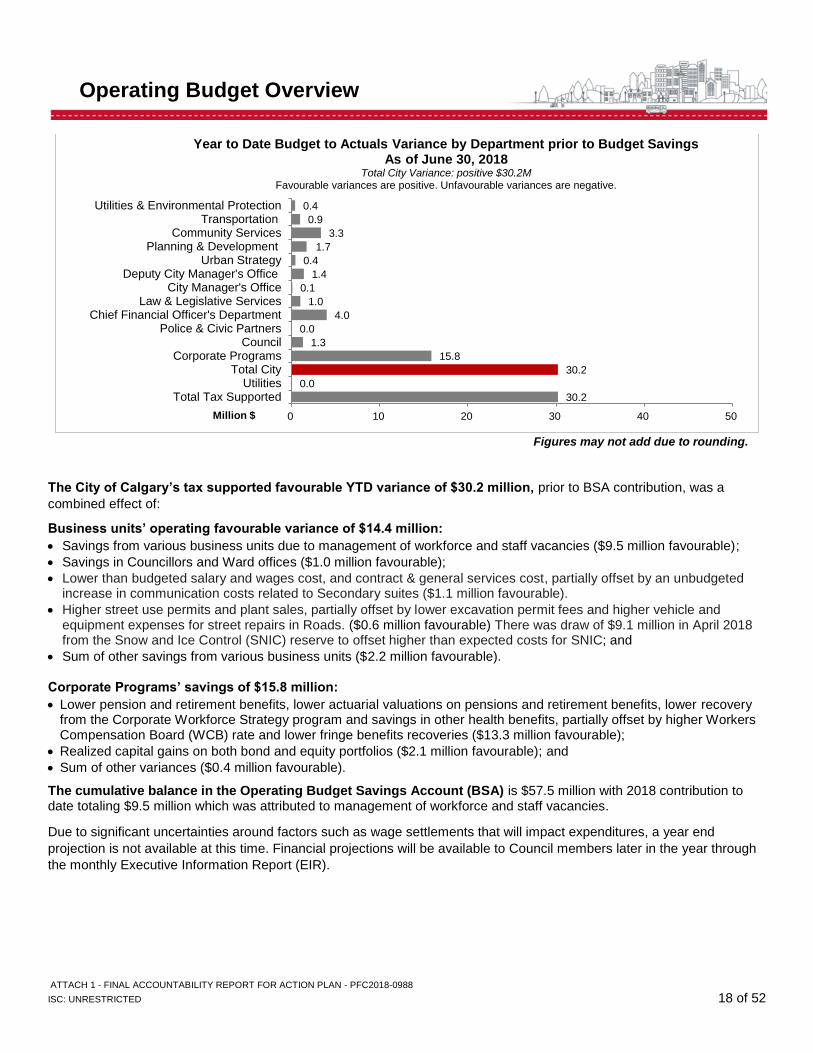
Figures may not add due to rounding.
The City of Calgary’s tax supported favourable YTD variance of $30.2 million, prior to BSA contribution, was a
combined effect of:
Business units’ operating favourable variance of $14.4 million:
• Savings from various business units due to management of workforce and staff vacancies ($9.5 million favourable);
• Savings in Councillors and Ward offices ($1.0 million favourable);
• Lower than budgeted salary and wages cost, and contract & general services cost, partially offset by an unbudgeted increase in communication costs related to Secondary suites ($1.1 million favourable).
• Higher street use permits and plant sales, partially offset by lower excavation permit fees and higher vehicle and equipment expenses for street repairs in Roads. ($0.6 million favourable) There was draw of $9.1 million in April 2018 from the Snow and Ice Control (SNIC) reserve to offset higher than expected costs for SNIC; and
• Sum of other savings from various business units ($2.2 million favourable).
Corporate Programs’ savings of $15.8 million:
• Lower pension and retirement benefits, lower actuarial valuations on pensions and retirement benefits, lower recovery from the Corporate Workforce Strategy program and savings in other health benefits, partially offset by higher Workers Compensation Board (WCB) rate and lower fringe benefits recoveries ($13.3 million favourable);
• Realized capital gains on both bond and equity portfolios ($2.1 million favourable); and
• Sum of other variances ($0.4 million favourable).
The cumulative balance in the Operating Budget Savings Account (BSA) is $57.5 million with 2018 contribution to date totaling $9.5 million which was attributed to management of workforce and staff vacancies.
Due to significant uncertainties around factors such as wage settlements that will impact expenditures, a year end
projection is not available at this time. Financial projections will be available to Council members later in the year through
the monthly Executive Information Report (EIR).
0.4
0.9
3.3
1.7
0.4
1.4
0.1
1.0
4.0
0.0
1.3
15.8
30.2
0.0
30.2
0 10 20 30 40 50
Utilities & Environmental ProtectionTransportation
Community ServicesPlanning & Development
Urban StrategyDeputy City Manager's Office
City Manager's OfficeLaw & Legislative Services
Chief Financial Officer's DepartmentPolice & Civic Partners
CouncilCorporate Programs
Total CityUtilities
Total Tax Supported
Million $
Year to Date Budget to Actuals Variance by Department prior to Budget SavingsAs of June 30, 2018
Total City Variance: positive $30.2MFavourable variances are positive. Unfavourable variances are negative.
ATTACH 1 - FINAL ACCOUNTABILITY REPORT FOR ACTION PLAN - PFC2018-0988
ISC: UNRESTRICTED 19 of 52
Capital Budget Overview
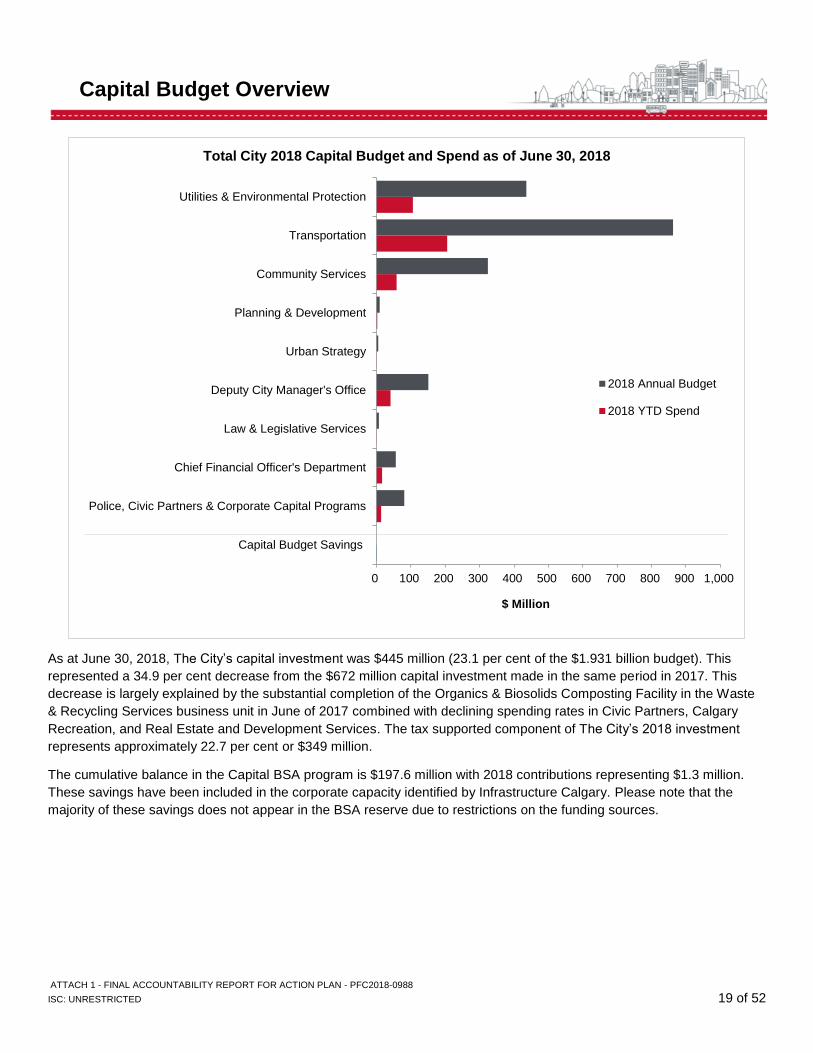
As at June 30, 2018, The City’s capital investment was $445 million (23.1 per cent of the $1.931 billion budget). This
represented a 34.9 per cent decrease from the $672 million capital investment made in the same period in 2017. This
decrease is largely explained by the substantial completion of the Organics & Biosolids Composting Facility in the Waste
& Recycling Services business unit in June of 2017 combined with declining spending rates in Civic Partners, Calgary
Recreation, and Real Estate and Development Services. The tax supported component of The City’s 2018 investment
represents approximately 22.7 per cent or $349 million.
The cumulative balance in the Capital BSA program is $197.6 million with 2018 contributions representing $1.3 million.
These savings have been included in the corporate capacity identified by Infrastructure Calgary. Please note that the
majority of these savings does not appear in the BSA reserve due to restrictions on the funding sources.
0 100 200 300 400 500 600 700 800 900 1,000
Capital Budget Savings
Police, Civic Partners & Corporate Capital Programs
Chief Financial Officer's Department
Law & Legislative Services
Deputy City Manager's Office
Urban Strategy
Planning & Development
Community Services
Transportation
Utilities & Environmental Protection
$ Million
Total City 2018 Capital Budget and Spend as of June 30, 2018
2018 Annual Budget
2018 YTD Spend
ATTACH 1 - FINAL ACCOUNTABILITY REPORT FOR ACTION PLAN - PFC2018-0988
ISC: UNRESTRICTED 20 of 52
Utilities & Environmental Protection
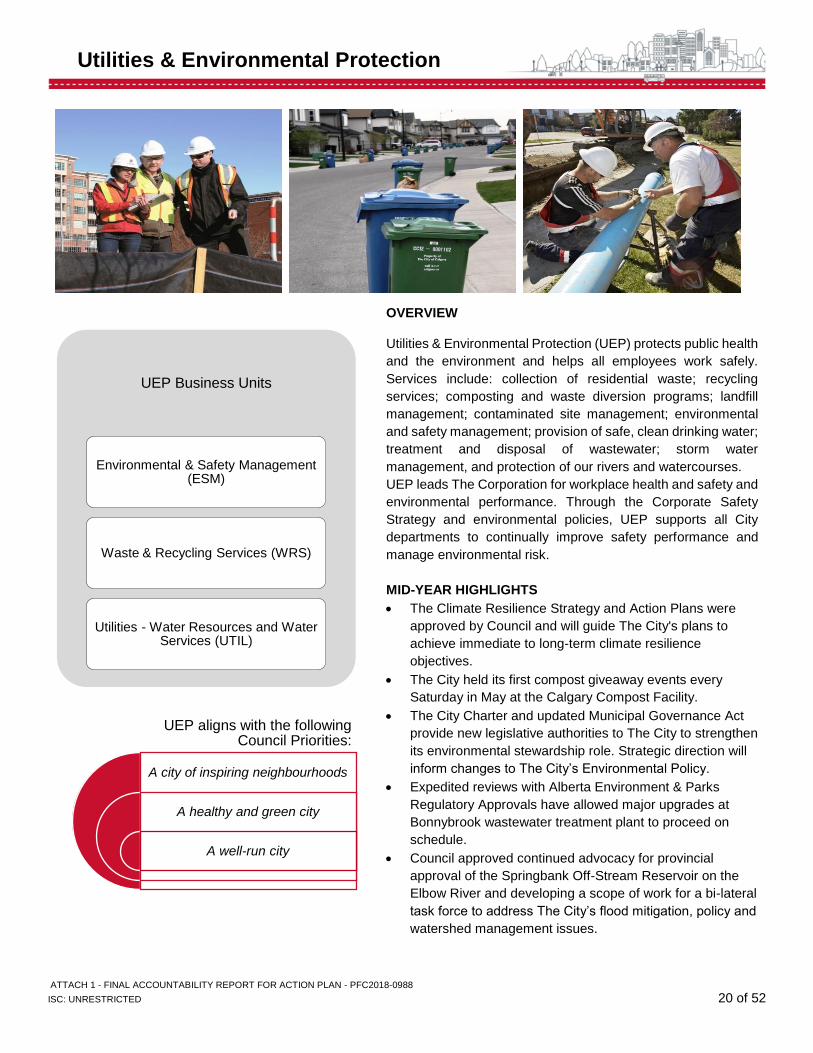
OVERVIEW Utilities & Environmental Protection (UEP) protects public health
and the environment and helps all employees work safely.
Services include: collection of residential waste; recycling
services; composting and waste diversion programs; landfill
management; contaminated site management; environmental
and safety management; provision of safe, clean drinking water;
treatment and disposal of wastewater; storm water
management, and protection of our rivers and watercourses.
UEP leads The Corporation for workplace health and safety and
environmental performance. Through the Corporate Safety
Strategy and environmental policies, UEP supports all City
departments to continually improve safety performance and
manage environmental risk.
MID-YEAR HIGHLIGHTS
• The Climate Resilience Strategy and Action Plans were
approved by Council and will guide The City's plans to
achieve immediate to long-term climate resilience
objectives.
• The City held its first compost giveaway events every
Saturday in May at the Calgary Compost Facility.
• The City Charter and updated Municipal Governance Act
provide new legislative authorities to The City to strengthen
its environmental stewardship role. Strategic direction will
inform changes to The City’s Environmental Policy.
• Expedited reviews with Alberta Environment & Parks
Regulatory Approvals have allowed major upgrades at
Bonnybrook wastewater treatment plant to proceed on
schedule.
• Council approved continued advocacy for provincial
approval of the Springbank Off-Stream Reservoir on the
Elbow River and developing a scope of work for a bi-lateral
task force to address The City’s flood mitigation, policy and
watershed management issues.
UEP aligns with the following Council Priorities:
A city of inspiring neighbourhoods
A healthy and green city
A well-run city
UEP Business Units
Environmental & Safety Management (ESM)
Waste & Recycling Services (WRS)
Utilities - Water Resources and Water Services (UTIL)
ATTACH 1 - FINAL ACCOUNTABILITY REPORT FOR ACTION PLAN - PFC2018-0988
ISC: UNRESTRICTED 21 of 52
Utilities & Environmental Protection
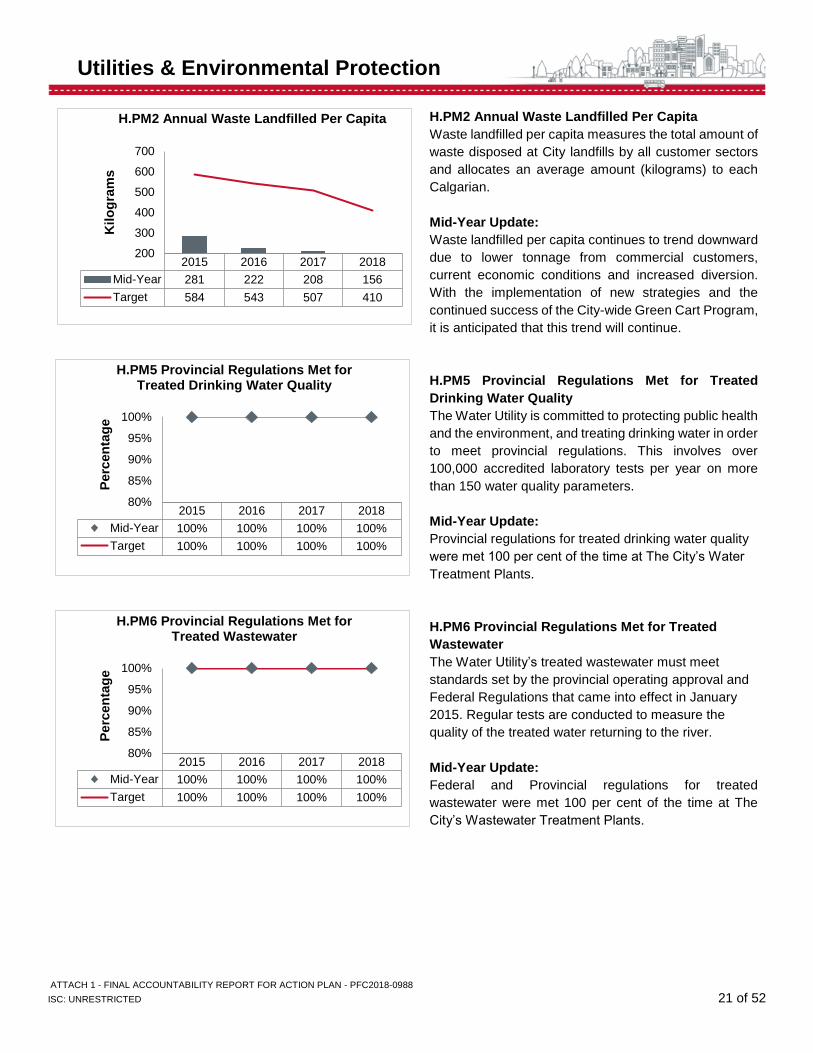
H.PM2 Annual Waste Landfilled Per Capita
Waste landfilled per capita measures the total amount of
waste disposed at City landfills by all customer sectors
and allocates an average amount (kilograms) to each
Calgarian.
Mid-Year Update:
Waste landfilled per capita continues to trend downward
due to lower tonnage from commercial customers,
current economic conditions and increased diversion.
With the implementation of new strategies and the
continued success of the City-wide Green Cart Program,
it is anticipated that this trend will continue.
H.PM5 Provincial Regulations Met for Treated
Drinking Water Quality
The Water Utility is committed to protecting public health
and the environment, and treating drinking water in order
to meet provincial regulations. This involves over
100,000 accredited laboratory tests per year on more
than 150 water quality parameters.
Mid-Year Update:
Provincial regulations for treated drinking water quality
were met 100 per cent of the time at The City’s Water
Treatment Plants.
H.PM6 Provincial Regulations Met for Treated
Wastewater
The Water Utility’s treated wastewater must meet
standards set by the provincial operating approval and
Federal Regulations that came into effect in January
2015. Regular tests are conducted to measure the
quality of the treated water returning to the river.
Mid-Year Update:
Federal and Provincial regulations for treated
wastewater were met 100 per cent of the time at The
City’s Wastewater Treatment Plants.
2015 2016 2017 2018
Mid-Year 281 222 208 156
Target 584 543 507 410
200
300
400
500
600
700
Kilo
gra
ms
H.PM2 Annual Waste Landfilled Per Capita
2015 2016 2017 2018
Mid-Year 100% 100% 100% 100%
Target 100% 100% 100% 100%
80%
85%
90%
95%
100%
Perc
en
tag
e
H.PM5 Provincial Regulations Met for Treated Drinking Water Quality
2015 2016 2017 2018
Mid-Year 100% 100% 100% 100%
Target 100% 100% 100% 100%
80%
85%
90%
95%
100%
Perc
en
tag
e
H.PM6 Provincial Regulations Met for Treated Wastewater
ATTACH 1 - FINAL ACCOUNTABILITY REPORT FOR ACTION PLAN - PFC2018-0988
ISC: UNRESTRICTED 22 of 52
Utilities & Environmental Protection
Link to additional performance measures here
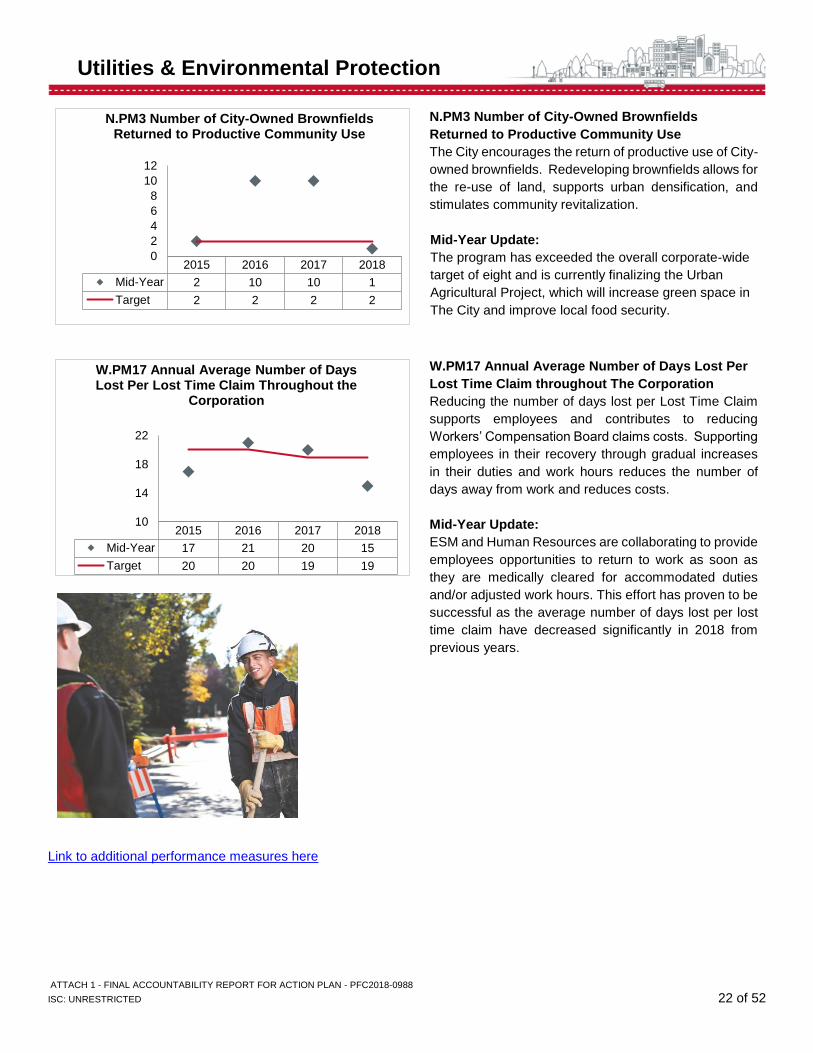
N.PM3 Number of City-Owned Brownfields
Returned to Productive Community Use
The City encourages the return of productive use of City-
owned brownfields. Redeveloping brownfields allows for
the re-use of land, supports urban densification, and
stimulates community revitalization.
Mid-Year Update:
The program has exceeded the overall corporate-wide
target of eight and is currently finalizing the Urban
Agricultural Project, which will increase green space in
The City and improve local food security.
W.PM17 Annual Average Number of Days Lost Per
Lost Time Claim throughout The Corporation
Reducing the number of days lost per Lost Time Claim
supports employees and contributes to reducing
Workers’ Compensation Board claims costs. Supporting
employees in their recovery through gradual increases
in their duties and work hours reduces the number of
days away from work and reduces costs.
Mid-Year Update:
ESM and Human Resources are collaborating to provide
employees opportunities to return to work as soon as
they are medically cleared for accommodated duties
and/or adjusted work hours. This effort has proven to be
successful as the average number of days lost per lost
time claim have decreased significantly in 2018 from
previous years.
2015 2016 2017 2018
Mid-Year 2 10 10 1
Target 2 2 2 2
0
2
4
6
8
10
12
N.PM3 Number of City-Owned Brownfields Returned to Productive Community Use
2015 2016 2017 2018
Mid-Year 17 21 20 15
Target 20 20 19 19
10
14
18
22
W.PM17 Annual Average Number of Days Lost Per Lost Time Claim Throughout the
Corporation
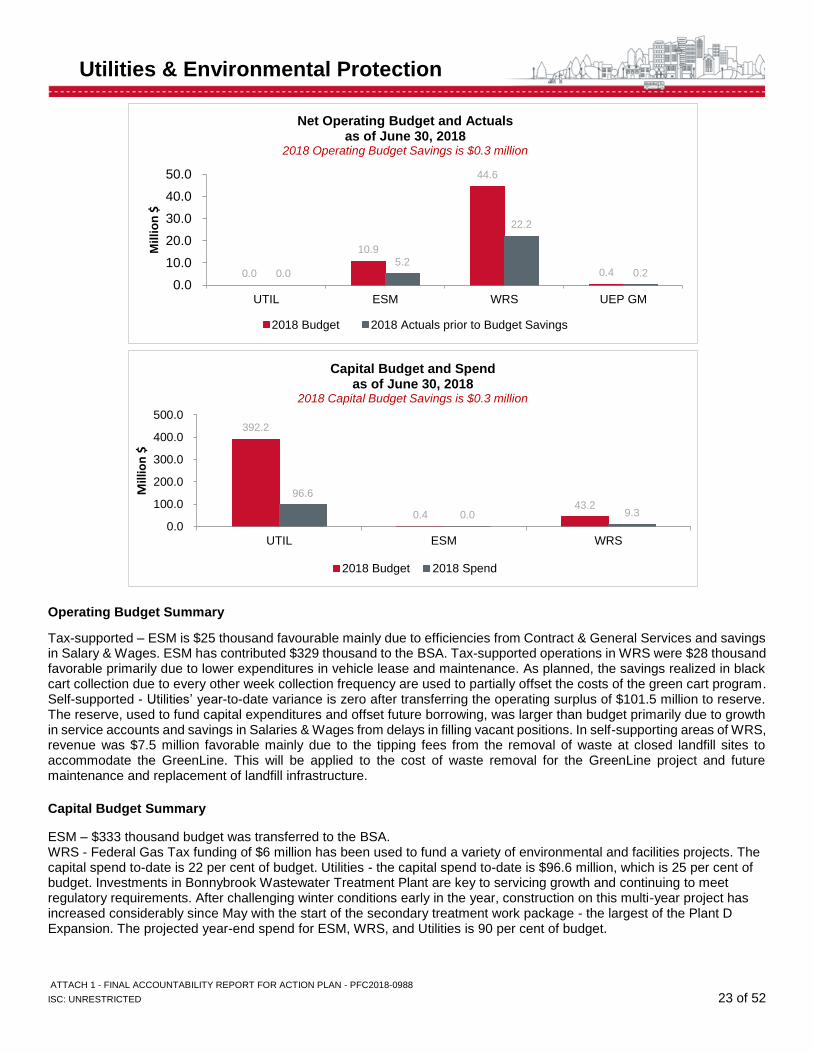
ATTACH 1 - FINAL ACCOUNTABILITY REPORT FOR ACTION PLAN - PFC2018-0988
ISC: UNRESTRICTED 23 of 52
Utilities & Environmental Protection
Operating Budget Summary
Tax-supported – ESM is $25 thousand favourable mainly due to efficiencies from Contract & General Services and savings in Salary & Wages. ESM has contributed $329 thousand to the BSA. Tax-supported operations in WRS were $28 thousand favorable primarily due to lower expenditures in vehicle lease and maintenance. As planned, the savings realized in black cart collection due to every other week collection frequency are used to partially offset the costs of the green cart program. Self-supported - Utilities’ year-to-date variance is zero after transferring the operating surplus of $101.5 million to reserve. The reserve, used to fund capital expenditures and offset future borrowing, was larger than budget primarily due to growth in service accounts and savings in Salaries & Wages from delays in filling vacant positions. In self-supporting areas of WRS, revenue was $7.5 million favorable mainly due to the tipping fees from the removal of waste at closed landfill sites to accommodate the GreenLine. This will be applied to the cost of waste removal for the GreenLine project and future maintenance and replacement of landfill infrastructure.
Capital Budget Summary
ESM – $333 thousand budget was transferred to the BSA. WRS - Federal Gas Tax funding of $6 million has been used to fund a variety of environmental and facilities projects. The capital spend to-date is 22 per cent of budget. Utilities - the capital spend to-date is $96.6 million, which is 25 per cent of budget. Investments in Bonnybrook Wastewater Treatment Plant are key to servicing growth and continuing to meet regulatory requirements. After challenging winter conditions early in the year, construction on this multi-year project has increased considerably since May with the start of the secondary treatment work package - the largest of the Plant D Expansion. The projected year-end spend for ESM, WRS, and Utilities is 90 per cent of budget.
0.0
10.9
44.6
0.4 0.0 5.2
22.2
0.2
0.0
10.0
20.0
30.0
40.0
50.0
UTIL ESM WRS UEP GM
Mil
lio
n$
Net Operating Budget and Actuals as of June 30, 2018
2018 Operating Budget Savings is $0.3 million
2018 Budget 2018 Actuals prior to Budget Savings
392.2
0.4 43.2
96.6
0.0 9.3
0.0
100.0
200.0
300.0
400.0
500.0
UTIL ESM WRS
Mill
ion
$
Capital Budget and Spend as of June 30, 2018
2018 Capital Budget Savings is $0.3 million
2018 Budget 2018 Spend
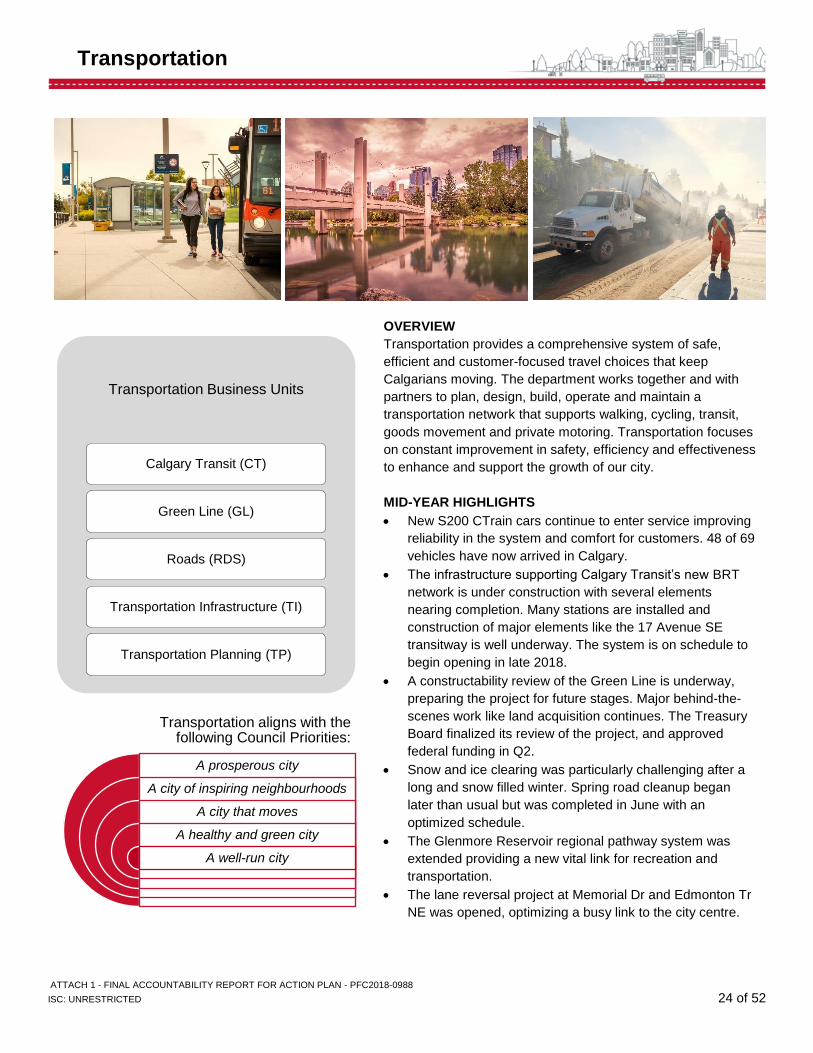
ATTACH 1 - FINAL ACCOUNTABILITY REPORT FOR ACTION PLAN - PFC2018-0988
ISC: UNRESTRICTED 24 of 52
Transportation
OVERVIEW
Transportation provides a comprehensive system of safe,
efficient and customer-focused travel choices that keep
Calgarians moving. The department works together and with
partners to plan, design, build, operate and maintain a
transportation network that supports walking, cycling, transit,
goods movement and private motoring. Transportation focuses
on constant improvement in safety, efficiency and effectiveness
to enhance and support the growth of our city.
MID-YEAR HIGHLIGHTS
• New S200 CTrain cars continue to enter service improving
reliability in the system and comfort for customers. 48 of 69
vehicles have now arrived in Calgary.
• The infrastructure supporting Calgary Transit’s new BRT
network is under construction with several elements
nearing completion. Many stations are installed and
construction of major elements like the 17 Avenue SE
transitway is well underway. The system is on schedule to
begin opening in late 2018.
• A constructability review of the Green Line is underway,
preparing the project for future stages. Major behind-the-
scenes work like land acquisition continues. The Treasury
Board finalized its review of the project, and approved
federal funding in Q2.
• Snow and ice clearing was particularly challenging after a
long and snow filled winter. Spring road cleanup began
later than usual but was completed in June with an
optimized schedule.
• The Glenmore Reservoir regional pathway system was
extended providing a new vital link for recreation and
transportation.
• The lane reversal project at Memorial Dr and Edmonton Tr
NE was opened, optimizing a busy link to the city centre.
Transportation Business Units
Calgary Transit (CT)
Green Line (GL)
Roads (RDS)
Transportation Infrastructure (TI)
Transportation Planning (TP)
Transportation aligns with the following Council Priorities:
A prosperous city
A city of inspiring neighbourhoods
A city that moves
A healthy and green city
A well-run city
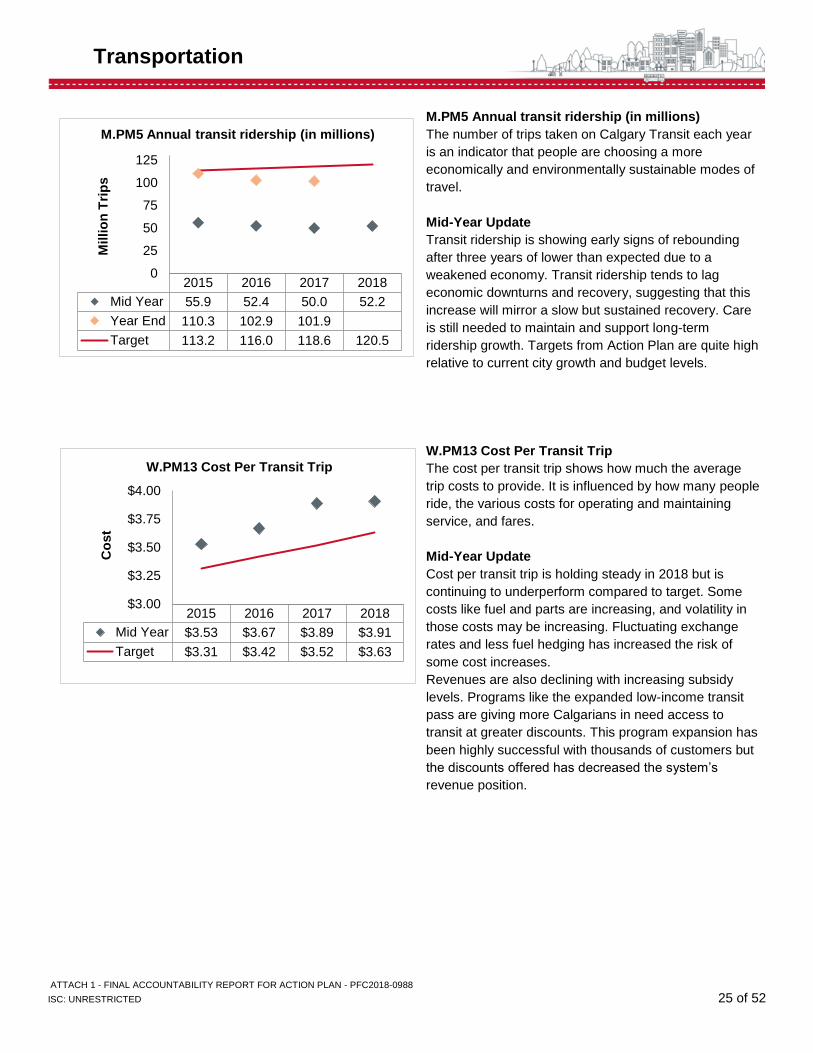
ATTACH 1 - FINAL ACCOUNTABILITY REPORT FOR ACTION PLAN - PFC2018-0988
ISC: UNRESTRICTED 25 of 52
Transportation
M.PM5 Annual transit ridership (in millions)
The number of trips taken on Calgary Transit each year
is an indicator that people are choosing a more
economically and environmentally sustainable modes of
travel.
Mid-Year Update
Transit ridership is showing early signs of rebounding
after three years of lower than expected due to a
weakened economy. Transit ridership tends to lag
economic downturns and recovery, suggesting that this
increase will mirror a slow but sustained recovery. Care
is still needed to maintain and support long-term
ridership growth. Targets from Action Plan are quite high
relative to current city growth and budget levels.
W.PM13 Cost Per Transit Trip
The cost per transit trip shows how much the average
trip costs to provide. It is influenced by how many people
ride, the various costs for operating and maintaining
service, and fares.
Mid-Year Update
Cost per transit trip is holding steady in 2018 but is
continuing to underperform compared to target. Some
costs like fuel and parts are increasing, and volatility in
those costs may be increasing. Fluctuating exchange
rates and less fuel hedging has increased the risk of
some cost increases.
Revenues are also declining with increasing subsidy
levels. Programs like the expanded low-income transit
pass are giving more Calgarians in need access to
transit at greater discounts. This program expansion has
been highly successful with thousands of customers but
the discounts offered has decreased the system’s
revenue position.
2015 2016 2017 2018
Mid Year $3.53 $3.67 $3.89 $3.91
Target $3.31 $3.42 $3.52 $3.63
$3.00
$3.25
$3.50
$3.75
$4.00
Co
st
W.PM13 Cost Per Transit Trip
2015 2016 2017 2018
Mid Year 55.9 52.4 50.0 52.2
Year End 110.3 102.9 101.9
Target 113.2 116.0 118.6 120.5
0
25
50
75
100
125
Millio
n T
rip
s
M.PM5 Annual transit ridership (in millions)
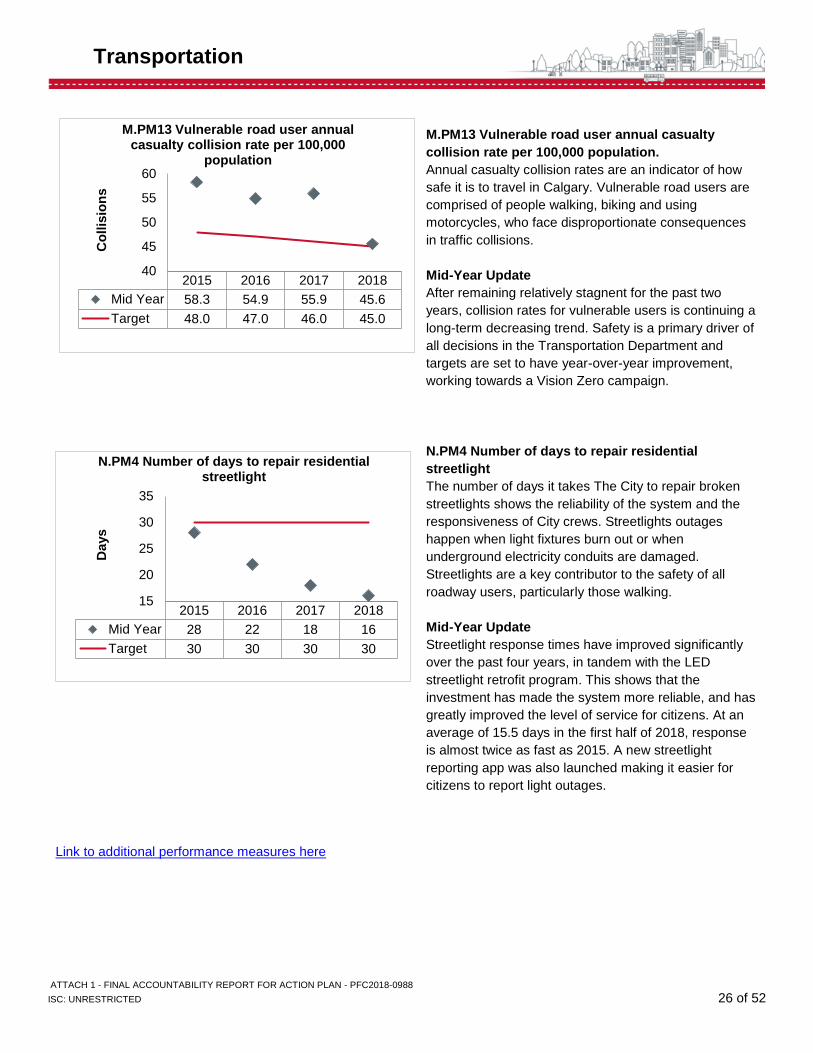
ATTACH 1 - FINAL ACCOUNTABILITY REPORT FOR ACTION PLAN - PFC2018-0988
ISC: UNRESTRICTED 26 of 52
Transportation
Link to additional performance measures here
M.PM13 Vulnerable road user annual casualty
collision rate per 100,000 population.
Annual casualty collision rates are an indicator of how
safe it is to travel in Calgary. Vulnerable road users are
comprised of people walking, biking and using
motorcycles, who face disproportionate consequences
in traffic collisions.
Mid-Year Update
After remaining relatively stagnent for the past two
years, collision rates for vulnerable users is continuing a
long-term decreasing trend. Safety is a primary driver of
all decisions in the Transportation Department and
targets are set to have year-over-year improvement,
working towards a Vision Zero campaign.
N.PM4 Number of days to repair residential
streetlight
The number of days it takes The City to repair broken
streetlights shows the reliability of the system and the
responsiveness of City crews. Streetlights outages
happen when light fixtures burn out or when
underground electricity conduits are damaged.
Streetlights are a key contributor to the safety of all
roadway users, particularly those walking.
Mid-Year Update
Streetlight response times have improved significantly
over the past four years, in tandem with the LED
streetlight retrofit program. This shows that the
investment has made the system more reliable, and has
greatly improved the level of service for citizens. At an
average of 15.5 days in the first half of 2018, response
is almost twice as fast as 2015. A new streetlight
reporting app was also launched making it easier for
citizens to report light outages.
2015 2016 2017 2018
Mid Year 58.3 54.9 55.9 45.6
Target 48.0 47.0 46.0 45.0
40
45
50
55
60
Co
llis
ion
s
M.PM13 Vulnerable road user annual casualty collision rate per 100,000
population
2015 2016 2017 2018
Mid Year 28 22 18 16
Target 30 30 30 30
15
20
25
30
35
Days
N.PM4 Number of days to repair residential streetlight
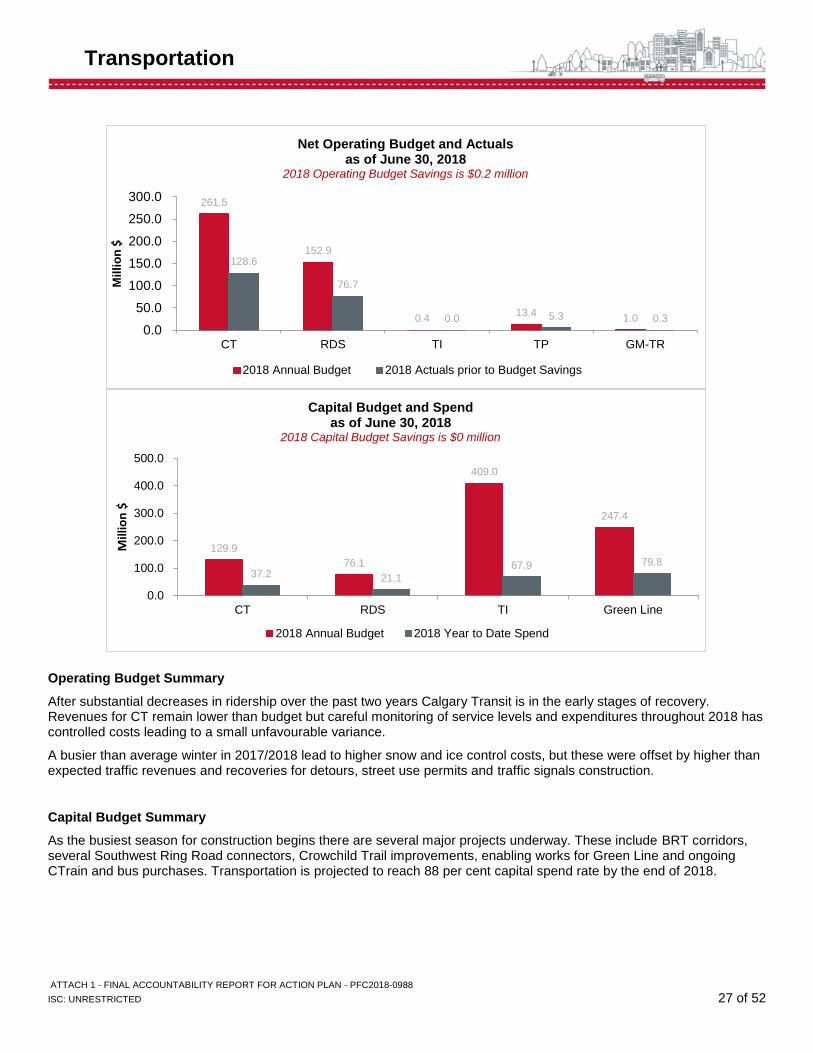
ATTACH 1 - FINAL ACCOUNTABILITY REPORT FOR ACTION PLAN - PFC2018-0988
ISC: UNRESTRICTED 27 of 52
Transportation
Operating Budget Summary
After substantial decreases in ridership over the past two years Calgary Transit is in the early stages of recovery. Revenues for CT remain lower than budget but careful monitoring of service levels and expenditures throughout 2018 has controlled costs leading to a small unfavourable variance.
A busier than average winter in 2017/2018 lead to higher snow and ice control costs, but these were offset by higher than expected traffic revenues and recoveries for detours, street use permits and traffic signals construction.
Capital Budget Summary
As the busiest season for construction begins there are several major projects underway. These include BRT corridors, several Southwest Ring Road connectors, Crowchild Trail improvements, enabling works for Green Line and ongoing CTrain and bus purchases. Transportation is projected to reach 88 per cent capital spend rate by the end of 2018.
261.5
152.9
0.4 13.4
1.0
128.6
76.7
0.0 5.3 0.3 0.0
50.0
100.0
150.0
200.0
250.0
300.0
CT RDS TI TP GM-TR
Mil
lio
n$
Net Operating Budget and Actuals as of June 30, 2018
2018 Operating Budget Savings is $0.2 million
2018 Annual Budget 2018 Actuals prior to Budget Savings
129.9
76.1
409.0
247.4
37.2 21.1
67.9 79.8
0.0
100.0
200.0
300.0
400.0
500.0
CT RDS TI Green Line
Mill
ion
$
Capital Budget and Spend as of June 30, 2018
2018 Capital Budget Savings is $0 million
2018 Annual Budget 2018 Year to Date Spend
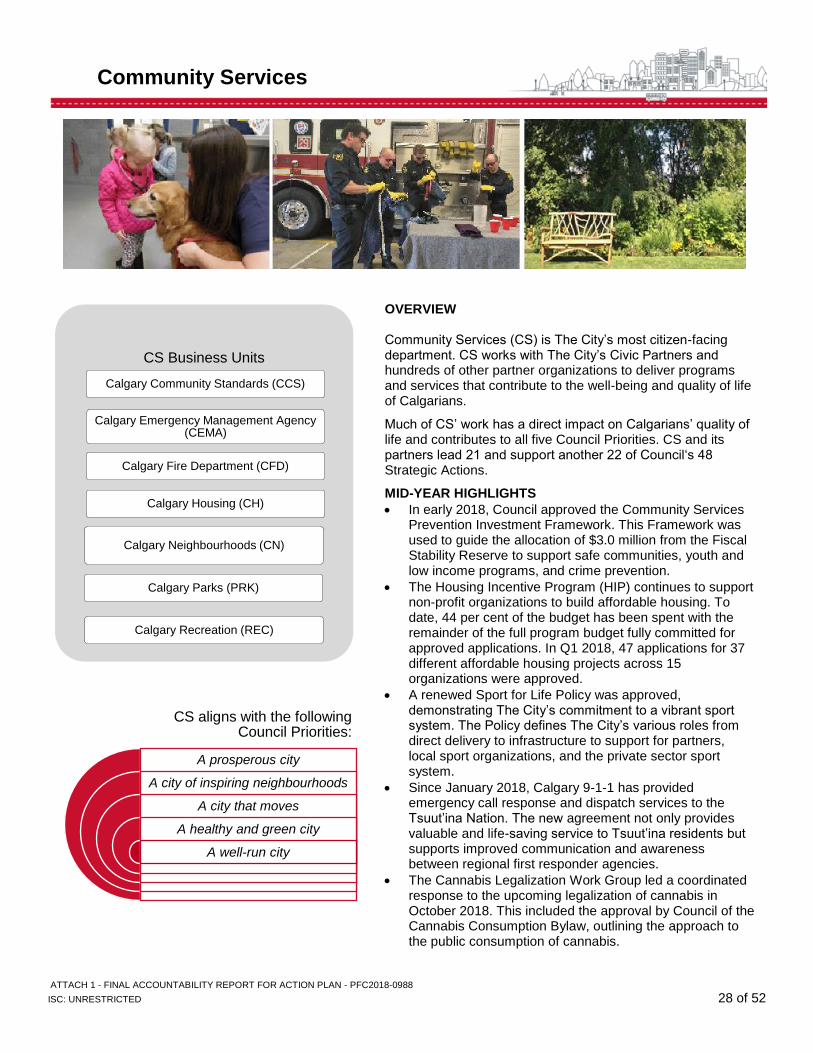
ATTACH 1 - FINAL ACCOUNTABILITY REPORT FOR ACTION PLAN - PFC2018-0988
ISC: UNRESTRICTED 28 of 52
Community Services
OVERVIEW Community Services (CS) is The City’s most citizen-facing department. CS works with The City’s Civic Partners and hundreds of other partner organizations to deliver programs and services that contribute to the well-being and quality of life of Calgarians.
Much of CS’ work has a direct impact on Calgarians’ quality of life and contributes to all five Council Priorities. CS and its partners lead 21 and support another 22 of Council‘s 48 Strategic Actions.
MID-YEAR HIGHLIGHTS
• In early 2018, Council approved the Community Services Prevention Investment Framework. This Framework was used to guide the allocation of $3.0 million from the Fiscal Stability Reserve to support safe communities, youth and low income programs, and crime prevention.
• The Housing Incentive Program (HIP) continues to support non-profit organizations to build affordable housing. To date, 44 per cent of the budget has been spent with the remainder of the full program budget fully committed for approved applications. In Q1 2018, 47 applications for 37 different affordable housing projects across 15 organizations were approved.
• A renewed Sport for Life Policy was approved, demonstrating The City’s commitment to a vibrant sport system. The Policy defines The City’s various roles from direct delivery to infrastructure to support for partners, local sport organizations, and the private sector sport system.
• Since January 2018, Calgary 9-1-1 has provided emergency call response and dispatch services to the Tsuut’ina Nation. The new agreement not only provides valuable and life-saving service to Tsuut’ina residents but supports improved communication and awareness between regional first responder agencies.
• The Cannabis Legalization Work Group led a coordinated response to the upcoming legalization of cannabis in October 2018. This included the approval by Council of the Cannabis Consumption Bylaw, outlining the approach to the public consumption of cannabis.
CS aligns with the following Council Priorities:
A prosperous city
A city of inspiring neighbourhoods
A city that moves
A healthy and green city
A well-run city
CS Business Units
Calgary Community Standards (CCS)
Calgary Emergency Management Agency (CEMA)
Calgary Fire Department (CFD)
Calgary Housing (CH)
Calgary Neighbourhoods (CN)
Calgary Parks (PRK)
Calgary Recreation (REC)
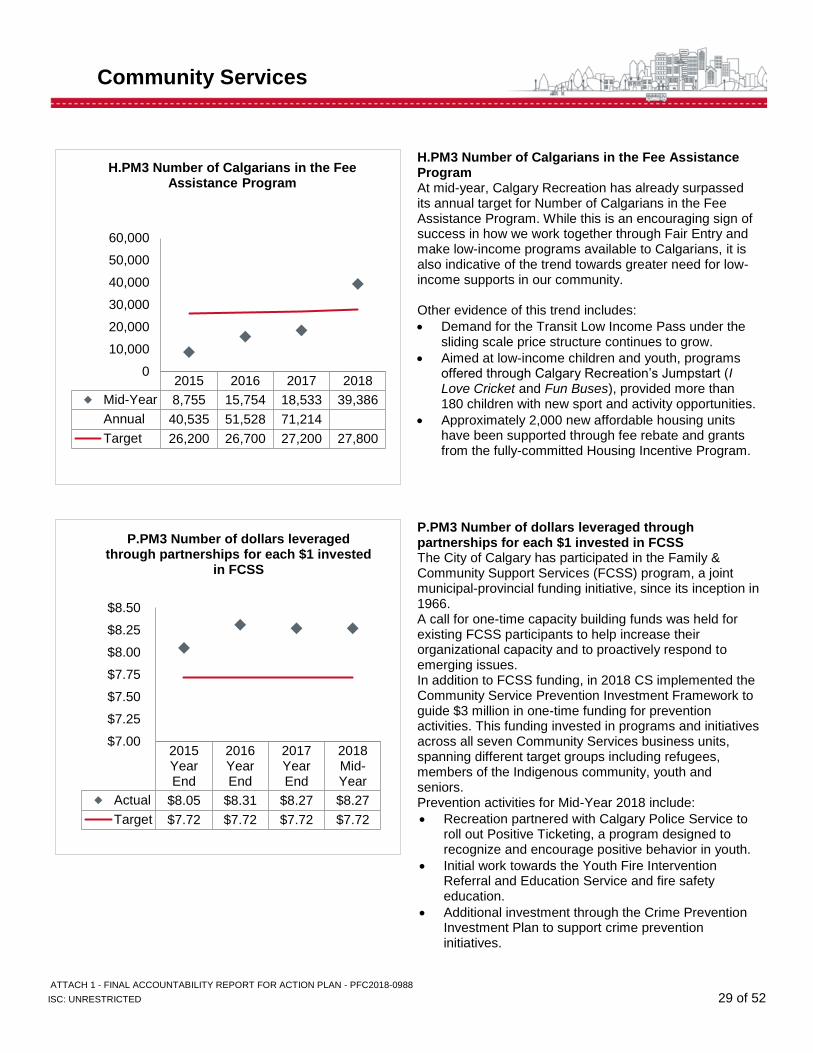
ATTACH 1 - FINAL ACCOUNTABILITY REPORT FOR ACTION PLAN - PFC2018-0988
ISC: UNRESTRICTED 29 of 52
Community Services
H.PM3 Number of Calgarians in the Fee Assistance Program At mid-year, Calgary Recreation has already surpassed its annual target for Number of Calgarians in the Fee Assistance Program. While this is an encouraging sign of success in how we work together through Fair Entry and make low-income programs available to Calgarians, it is also indicative of the trend towards greater need for low-income supports in our community. Other evidence of this trend includes:
• Demand for the Transit Low Income Pass under the sliding scale price structure continues to grow.
• Aimed at low-income children and youth, programs offered through Calgary Recreation’s Jumpstart (I Love Cricket and Fun Buses), provided more than 180 children with new sport and activity opportunities.
• Approximately 2,000 new affordable housing units have been supported through fee rebate and grants from the fully-committed Housing Incentive Program.
P.PM3 Number of dollars leveraged through partnerships for each $1 invested in FCSS The City of Calgary has participated in the Family & Community Support Services (FCSS) program, a joint municipal-provincial funding initiative, since its inception in 1966. A call for one-time capacity building funds was held for existing FCSS participants to help increase their organizational capacity and to proactively respond to emerging issues. In addition to FCSS funding, in 2018 CS implemented the Community Service Prevention Investment Framework to guide $3 million in one-time funding for prevention activities. This funding invested in programs and initiatives across all seven Community Services business units, spanning different target groups including refugees, members of the Indigenous community, youth and seniors. Prevention activities for Mid-Year 2018 include:
• Recreation partnered with Calgary Police Service to roll out Positive Ticketing, a program designed to recognize and encourage positive behavior in youth.
• Initial work towards the Youth Fire Intervention Referral and Education Service and fire safety education.
• Additional investment through the Crime Prevention Investment Plan to support crime prevention initiatives.
2015 2016 2017 2018
Mid-Year 8,755 15,754 18,533 39,386
Annual 40,535 51,528 71,214
Target 26,200 26,700 27,200 27,800
0
10,000
20,000
30,000
40,000
50,000
60,000
H.PM3 Number of Calgarians in the Fee Assistance Program
2015YearEnd
2016YearEnd
2017YearEnd
2018Mid-Year
Actual $8.05 $8.31 $8.27 $8.27
Target $7.72 $7.72 $7.72 $7.72
$7.00
$7.25
$7.50
$7.75
$8.00
$8.25
$8.50
P.PM3 Number of dollars leveraged through partnerships for each $1 invested
in FCSS
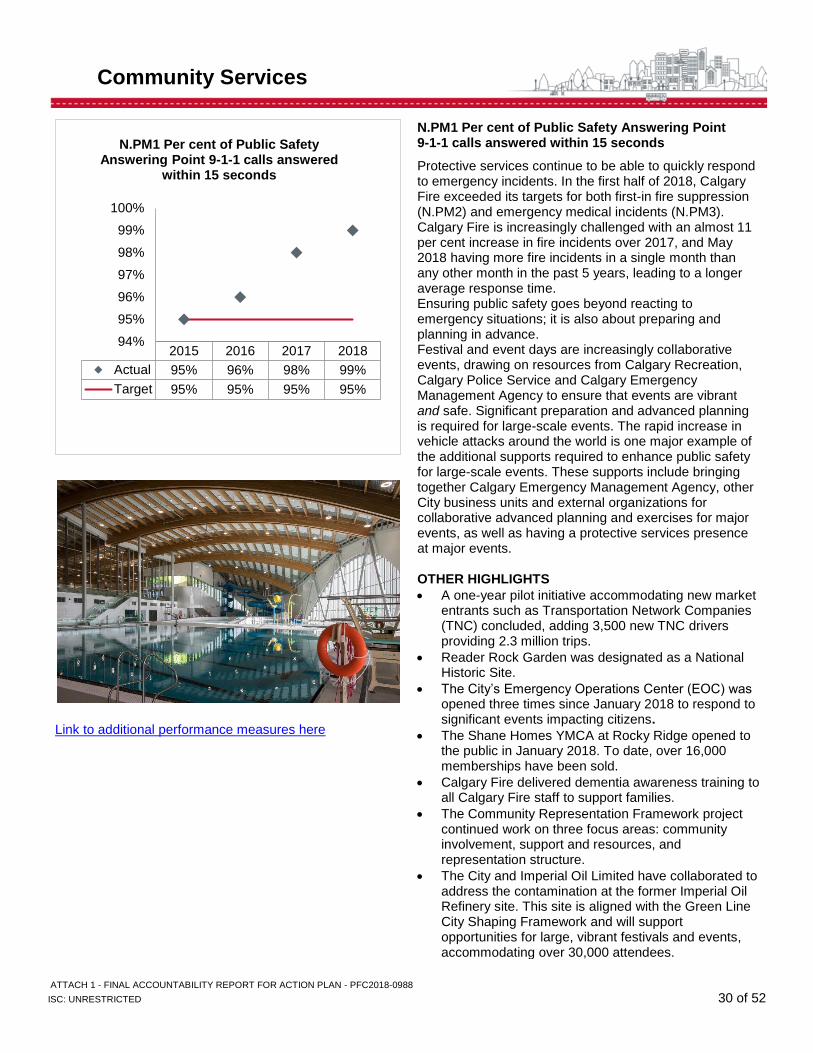
ATTACH 1 - FINAL ACCOUNTABILITY REPORT FOR ACTION PLAN - PFC2018-0988
ISC: UNRESTRICTED 30 of 52
Community Services
Link to additional performance measures here
N.PM1 Per cent of Public Safety Answering Point 9-1-1 calls answered within 15 seconds
Protective services continue to be able to quickly respond to emergency incidents. In the first half of 2018, Calgary Fire exceeded its targets for both first-in fire suppression (N.PM2) and emergency medical incidents (N.PM3). Calgary Fire is increasingly challenged with an almost 11 per cent increase in fire incidents over 2017, and May 2018 having more fire incidents in a single month than any other month in the past 5 years, leading to a longer average response time. Ensuring public safety goes beyond reacting to emergency situations; it is also about preparing and planning in advance. Festival and event days are increasingly collaborative events, drawing on resources from Calgary Recreation, Calgary Police Service and Calgary Emergency Management Agency to ensure that events are vibrant and safe. Significant preparation and advanced planning is required for large-scale events. The rapid increase in vehicle attacks around the world is one major example of the additional supports required to enhance public safety for large-scale events. These supports include bringing together Calgary Emergency Management Agency, other City business units and external organizations for collaborative advanced planning and exercises for major events, as well as having a protective services presence at major events. OTHER HIGHLIGHTS
• A one-year pilot initiative accommodating new market entrants such as Transportation Network Companies (TNC) concluded, adding 3,500 new TNC drivers providing 2.3 million trips.
• Reader Rock Garden was designated as a National Historic Site.
• The City’s Emergency Operations Center (EOC) was opened three times since January 2018 to respond to significant events impacting citizens.
• The Shane Homes YMCA at Rocky Ridge opened to the public in January 2018. To date, over 16,000 memberships have been sold.
• Calgary Fire delivered dementia awareness training to all Calgary Fire staff to support families.
• The Community Representation Framework project continued work on three focus areas: community involvement, support and resources, and representation structure.
• The City and Imperial Oil Limited have collaborated to address the contamination at the former Imperial Oil Refinery site. This site is aligned with the Green Line City Shaping Framework and will support opportunities for large, vibrant festivals and events, accommodating over 30,000 attendees.
2015 2016 2017 2018
Actual 95% 96% 98% 99%
Target 95% 95% 95% 95%
94%
95%
96%
97%
98%
99%
100%
N.PM1 Per cent of Public Safety Answering Point 9-1-1 calls answered
within 15 seconds
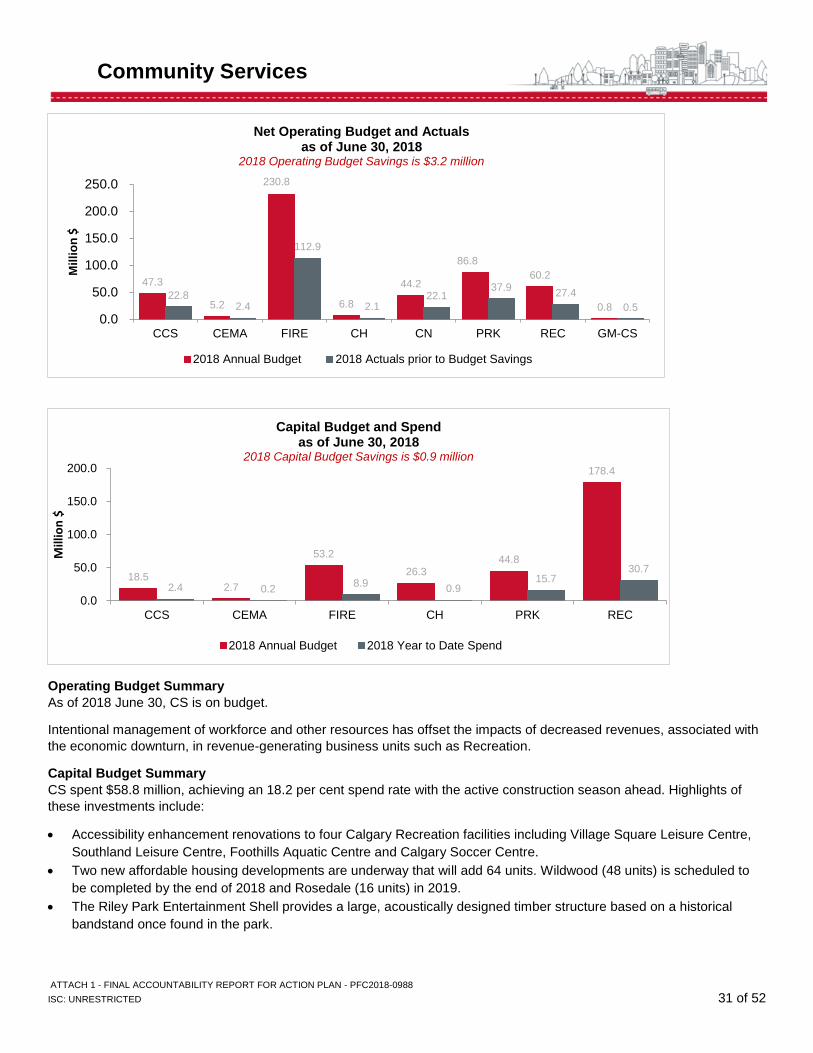
ATTACH 1 - FINAL ACCOUNTABILITY REPORT FOR ACTION PLAN - PFC2018-0988
ISC: UNRESTRICTED 31 of 52
Community Services
Operating Budget Summary
As of 2018 June 30, CS is on budget.
Intentional management of workforce and other resources has offset the impacts of decreased revenues, associated with
the economic downturn, in revenue-generating business units such as Recreation.
Capital Budget Summary
CS spent $58.8 million, achieving an 18.2 per cent spend rate with the active construction season ahead. Highlights of
these investments include:
• Accessibility enhancement renovations to four Calgary Recreation facilities including Village Square Leisure Centre,
Southland Leisure Centre, Foothills Aquatic Centre and Calgary Soccer Centre.
• Two new affordable housing developments are underway that will add 64 units. Wildwood (48 units) is scheduled to
be completed by the end of 2018 and Rosedale (16 units) in 2019.
• The Riley Park Entertainment Shell provides a large, acoustically designed timber structure based on a historical
bandstand once found in the park.
18.52.7
53.2
26.344.8
178.4
2.4 0.28.9
0.915.7
30.7
0.0
50.0
100.0
150.0
200.0
CCS CEMA FIRE CH PRK REC
Mill
ion
$
Capital Budget and Spend as of June 30, 2018
2018 Capital Budget Savings is $0.9 million
2018 Annual Budget 2018 Year to Date Spend
47.3
5.2
230.8
6.8
44.2
86.8
60.2
0.8 22.8
2.4
112.9
2.1 22.1
37.9 27.4
0.5
0.0
50.0
100.0
150.0
200.0
250.0
CCS CEMA FIRE CH CN PRK REC GM-CS
Mil
lio
n$
Net Operating Budget and Actuals as of June 30, 2018
2018 Operating Budget Savings is $3.2 million
2018 Annual Budget 2018 Actuals prior to Budget Savings
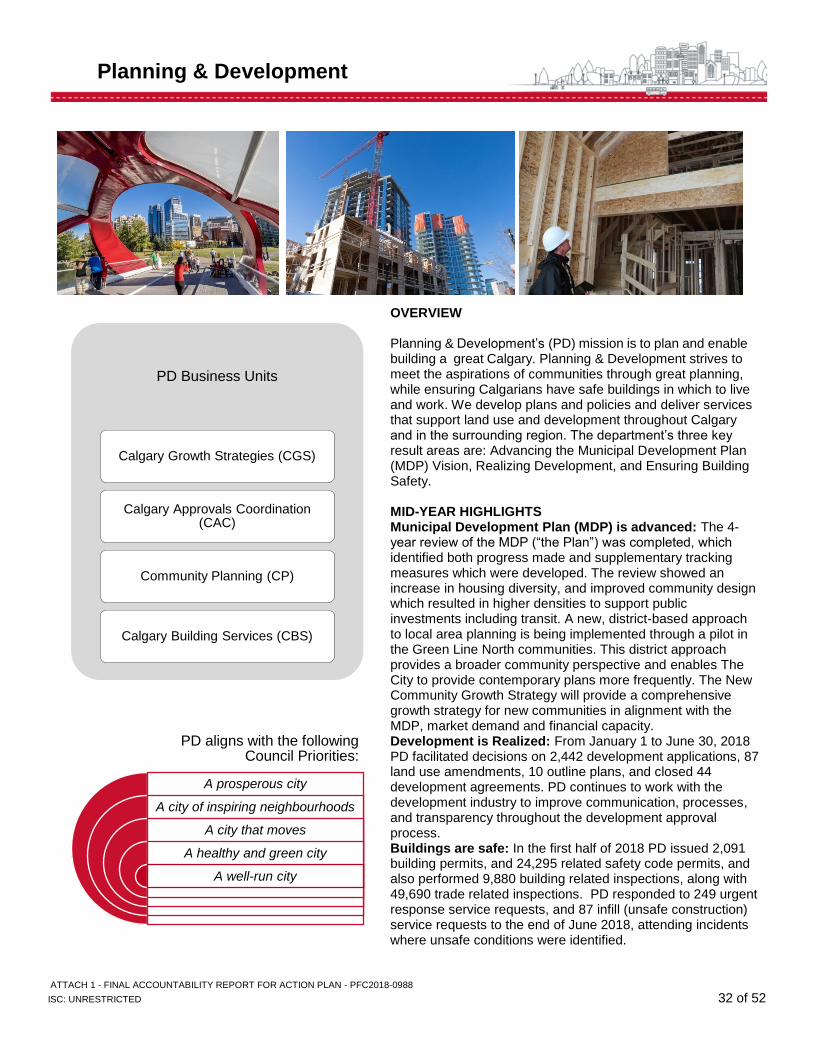
ATTACH 1 - FINAL ACCOUNTABILITY REPORT FOR ACTION PLAN - PFC2018-0988
ISC: UNRESTRICTED 32 of 52
Planning & Development
OVERVIEW Planning & Development’s (PD) mission is to plan and enable building a great Calgary. Planning & Development strives to meet the aspirations of communities through great planning, while ensuring Calgarians have safe buildings in which to live and work. We develop plans and policies and deliver services that support land use and development throughout Calgary and in the surrounding region. The department’s three key result areas are: Advancing the Municipal Development Plan (MDP) Vision, Realizing Development, and Ensuring Building Safety. MID-YEAR HIGHLIGHTS Municipal Development Plan (MDP) is advanced: The 4-year review of the MDP (“the Plan”) was completed, which identified both progress made and supplementary tracking measures which were developed. The review showed an increase in housing diversity, and improved community design which resulted in higher densities to support public investments including transit. A new, district-based approach to local area planning is being implemented through a pilot in the Green Line North communities. This district approach provides a broader community perspective and enables The City to provide contemporary plans more frequently. The New Community Growth Strategy will provide a comprehensive growth strategy for new communities in alignment with the MDP, market demand and financial capacity. Development is Realized: From January 1 to June 30, 2018 PD facilitated decisions on 2,442 development applications, 87 land use amendments, 10 outline plans, and closed 44 development agreements. PD continues to work with the development industry to improve communication, processes, and transparency throughout the development approval process. Buildings are safe: In the first half of 2018 PD issued 2,091 building permits, and 24,295 related safety code permits, and also performed 9,880 building related inspections, along with 49,690 trade related inspections. PD responded to 249 urgent response service requests, and 87 infill (unsafe construction) service requests to the end of June 2018, attending incidents where unsafe conditions were identified.
PD aligns with the following Council Priorities:
A prosperous city
A city of inspiring neighbourhoods
A city that moves
A healthy and green city
A well-run city
PD Business Units
Calgary Growth Strategies (CGS)
Calgary Approvals Coordination (CAC)
Community Planning (CP)
Calgary Building Services (CBS)
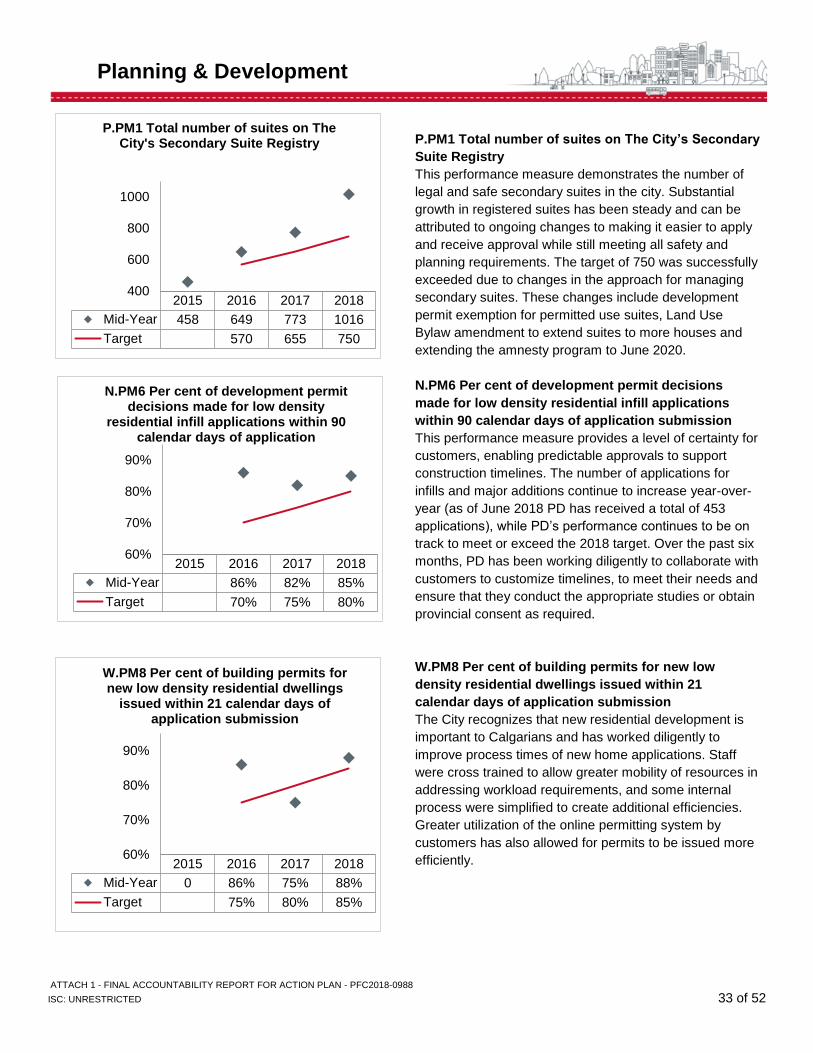
ATTACH 1 - FINAL ACCOUNTABILITY REPORT FOR ACTION PLAN - PFC2018-0988
ISC: UNRESTRICTED 33 of 52
Planning & Development
P.PM1 Total number of suites on The City’s Secondary
Suite Registry
This performance measure demonstrates the number of
legal and safe secondary suites in the city. Substantial
growth in registered suites has been steady and can be
attributed to ongoing changes to making it easier to apply
and receive approval while still meeting all safety and
planning requirements. The target of 750 was successfully
exceeded due to changes in the approach for managing
secondary suites. These changes include development
permit exemption for permitted use suites, Land Use
Bylaw amendment to extend suites to more houses and
extending the amnesty program to June 2020.
N.PM6 Per cent of development permit decisions
made for low density residential infill applications
within 90 calendar days of application submission
This performance measure provides a level of certainty for
customers, enabling predictable approvals to support
construction timelines. The number of applications for
infills and major additions continue to increase year-over-
year (as of June 2018 PD has received a total of 453
applications), while PD’s performance continues to be on
track to meet or exceed the 2018 target. Over the past six
months, PD has been working diligently to collaborate with
customers to customize timelines, to meet their needs and
ensure that they conduct the appropriate studies or obtain
provincial consent as required.
W.PM8 Per cent of building permits for new low
density residential dwellings issued within 21
calendar days of application submission
The City recognizes that new residential development is
important to Calgarians and has worked diligently to
improve process times of new home applications. Staff
were cross trained to allow greater mobility of resources in
addressing workload requirements, and some internal
process were simplified to create additional efficiencies.
Greater utilization of the online permitting system by
customers has also allowed for permits to be issued more
efficiently.
2015 2016 2017 2018
Mid-Year 458 649 773 1016
Target 570 655 750
400
600
800
1000
P.PM1 Total number of suites on The City's Secondary Suite Registry
2015 2016 2017 2018
Mid-Year 86% 82% 85%
Target 70% 75% 80%
60%
70%
80%
90%
N.PM6 Per cent of development permit decisions made for low density
residential infill applications within 90 calendar days of application
2015 2016 2017 2018
Mid-Year 0 86% 75% 88%
Target 75% 80% 85%
60%
70%
80%
90%
W.PM8 Per cent of building permits for new low density residential dwellings
issued within 21 calendar days of application submission
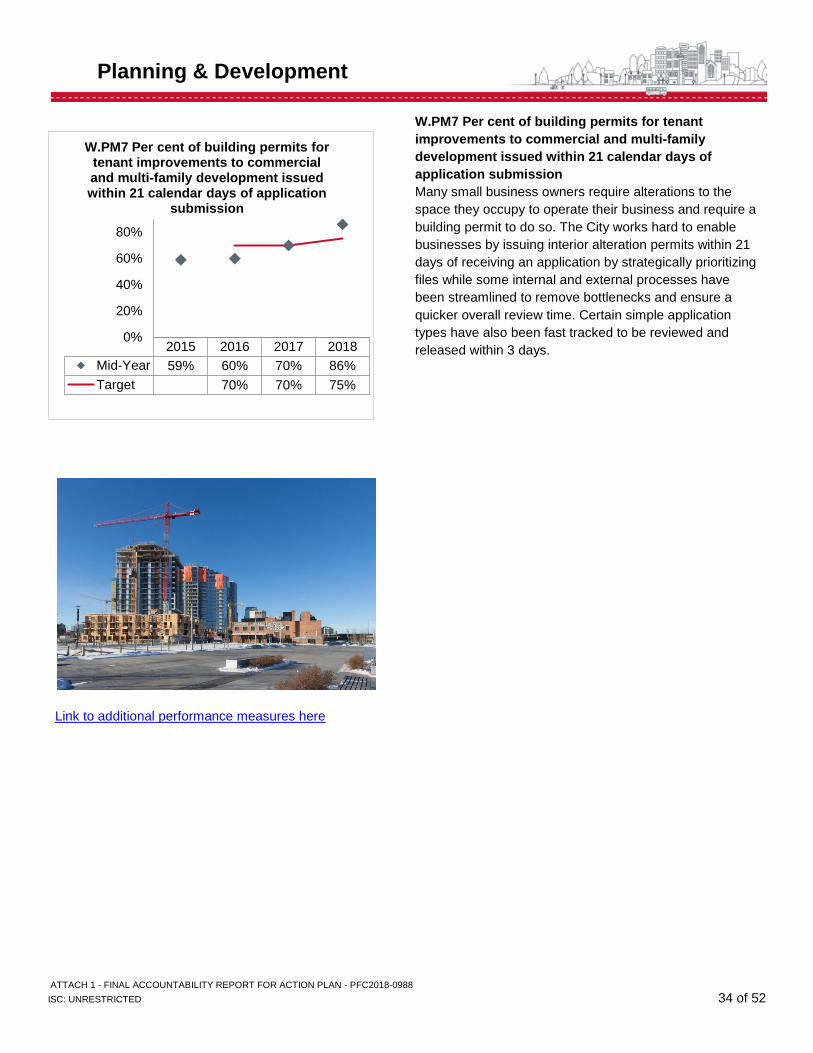
ATTACH 1 - FINAL ACCOUNTABILITY REPORT FOR ACTION PLAN - PFC2018-0988
ISC: UNRESTRICTED 34 of 52
Planning & Development
Link to additional performance measures here
W.PM7 Per cent of building permits for tenant
improvements to commercial and multi-family
development issued within 21 calendar days of
application submission
Many small business owners require alterations to the
space they occupy to operate their business and require a
building permit to do so. The City works hard to enable
businesses by issuing interior alteration permits within 21
days of receiving an application by strategically prioritizing
files while some internal and external processes have
been streamlined to remove bottlenecks and ensure a
quicker overall review time. Certain simple application
types have also been fast tracked to be reviewed and
released within 3 days.
2015 2016 2017 2018
Mid-Year 59% 60% 70% 86%
Target 70% 70% 75%
0%
20%
40%
60%
80%
W.PM7 Per cent of building permits for tenant improvements to commercial and multi-family development issued within 21 calendar days of application
submission
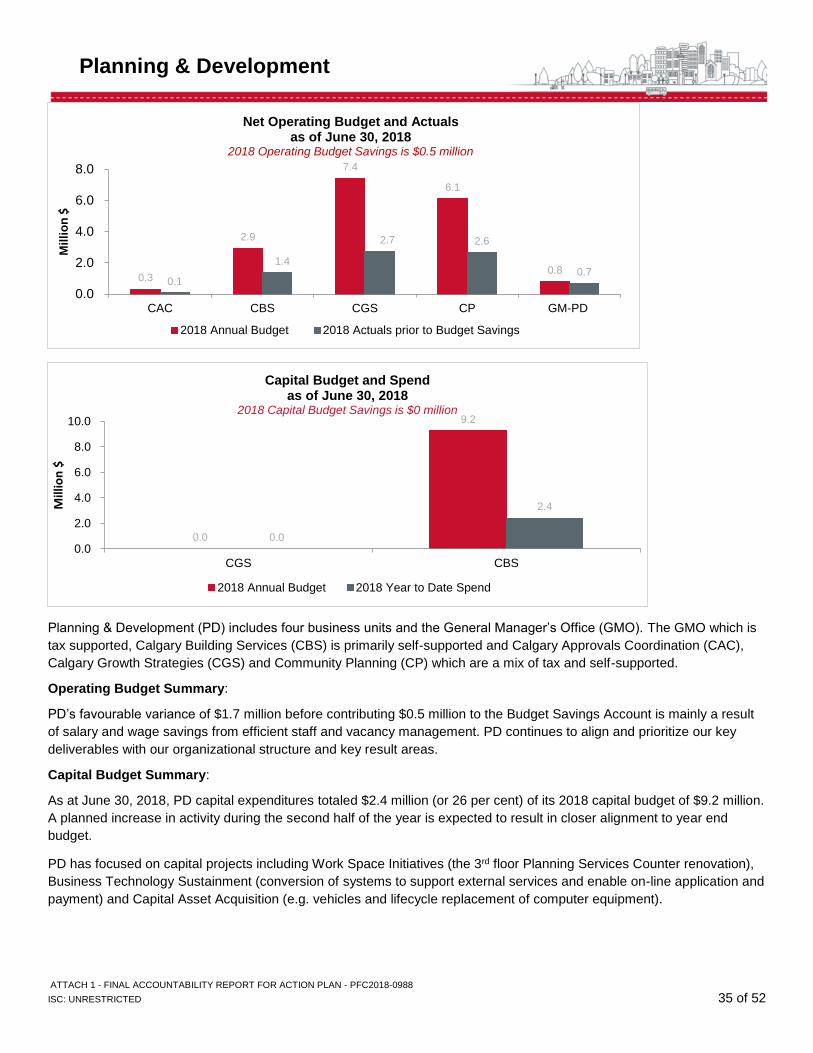
ATTACH 1 - FINAL ACCOUNTABILITY REPORT FOR ACTION PLAN - PFC2018-0988
ISC: UNRESTRICTED 35 of 52
Planning & Development
Planning & Development (PD) includes four business units and the General Manager’s Office (GMO). The GMO which is
tax supported, Calgary Building Services (CBS) is primarily self-supported and Calgary Approvals Coordination (CAC),
Calgary Growth Strategies (CGS) and Community Planning (CP) which are a mix of tax and self-supported.
Operating Budget Summary:
PD’s favourable variance of $1.7 million before contributing $0.5 million to the Budget Savings Account is mainly a result
of salary and wage savings from efficient staff and vacancy management. PD continues to align and prioritize our key
deliverables with our organizational structure and key result areas.
Capital Budget Summary:
As at June 30, 2018, PD capital expenditures totaled $2.4 million (or 26 per cent) of its 2018 capital budget of $9.2 million.
A planned increase in activity during the second half of the year is expected to result in closer alignment to year end
budget.
PD has focused on capital projects including Work Space Initiatives (the 3rd floor Planning Services Counter renovation),
Business Technology Sustainment (conversion of systems to support external services and enable on-line application and
payment) and Capital Asset Acquisition (e.g. vehicles and lifecycle replacement of computer equipment).
0.3
2.9
7.4
6.1
0.8 0.1
1.4
2.7 2.6
0.7
0.0
2.0
4.0
6.0
8.0
CAC CBS CGS CP GM-PD
Mil
lio
n$
Net Operating Budget and Actuals as of June 30, 2018
2018 Operating Budget Savings is $0.5 million
2018 Annual Budget 2018 Actuals prior to Budget Savings
0.0
9.2
0.0
2.4
0.0
2.0
4.0
6.0
8.0
10.0
CGS CBS
Mill
ion
$
Capital Budget and Spend as of June 30, 2018
2018 Capital Budget Savings is $0 million
2018 Annual Budget 2018 Year to Date Spend
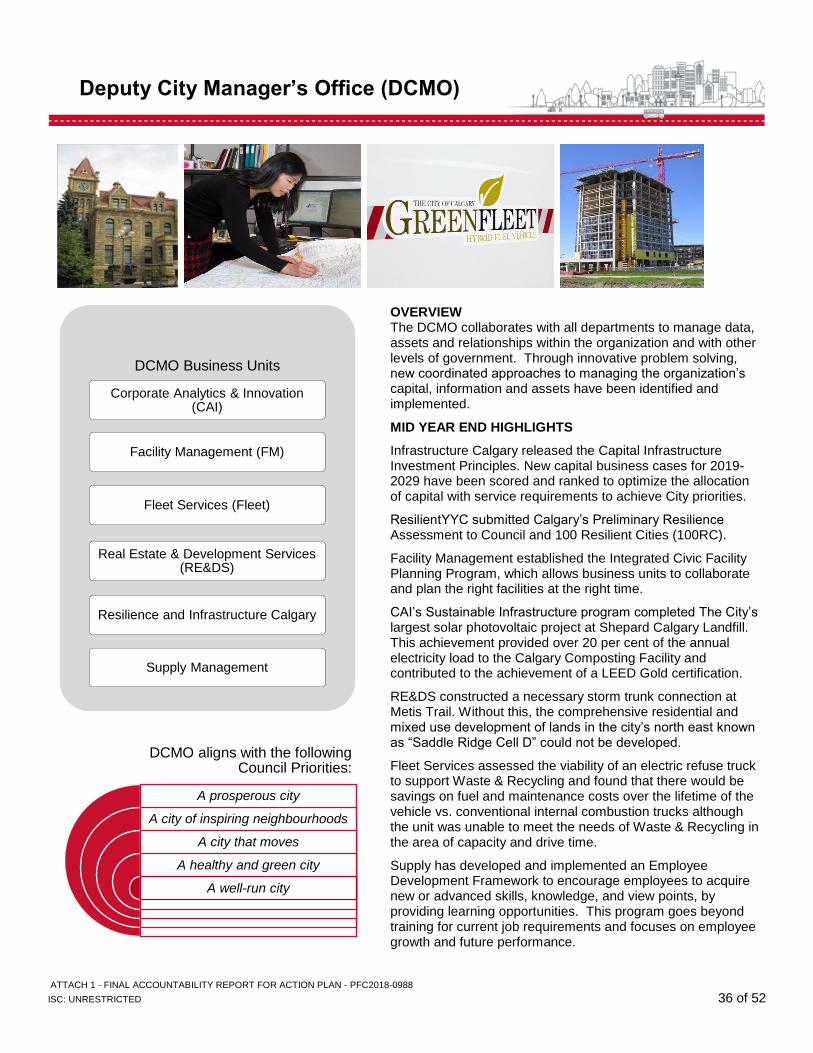
ATTACH 1 - FINAL ACCOUNTABILITY REPORT FOR ACTION PLAN - PFC2018-0988
ISC: UNRESTRICTED 36 of 52
Deputy City Manager’s Office (DCMO)
OVERVIEW The DCMO collaborates with all departments to manage data, assets and relationships within the organization and with other levels of government. Through innovative problem solving, new coordinated approaches to managing the organization’s capital, information and assets have been identified and implemented.
MID YEAR END HIGHLIGHTS
Infrastructure Calgary released the Capital Infrastructure Investment Principles. New capital business cases for 2019-2029 have been scored and ranked to optimize the allocation of capital with service requirements to achieve City priorities.
ResilientYYC submitted Calgary’s Preliminary Resilience Assessment to Council and 100 Resilient Cities (100RC).
Facility Management established the Integrated Civic Facility Planning Program, which allows business units to collaborate and plan the right facilities at the right time.
CAI’s Sustainable Infrastructure program completed The City’s largest solar photovoltaic project at Shepard Calgary Landfill. This achievement provided over 20 per cent of the annual electricity load to the Calgary Composting Facility and contributed to the achievement of a LEED Gold certification.
RE&DS constructed a necessary storm trunk connection at Metis Trail. Without this, the comprehensive residential and mixed use development of lands in the city’s north east known as “Saddle Ridge Cell D” could not be developed.
Fleet Services assessed the viability of an electric refuse truck to support Waste & Recycling and found that there would be savings on fuel and maintenance costs over the lifetime of the vehicle vs. conventional internal combustion trucks although the unit was unable to meet the needs of Waste & Recycling in the area of capacity and drive time.
Supply has developed and implemented an Employee Development Framework to encourage employees to acquire new or advanced skills, knowledge, and view points, by providing learning opportunities. This program goes beyond training for current job requirements and focuses on employee growth and future performance.
DCMO aligns with the following Council Priorities:
A prosperous city
A city of inspiring neighbourhoods
A city that moves
A healthy and green city
A well-run city
DCMO Business Units
Facility Management (FM)
Fleet Services (Fleet)
Corporate Analytics & Innovation (CAI)
Real Estate & Development Services (RE&DS)
Resilience and Infrastructure Calgary
Supply Management
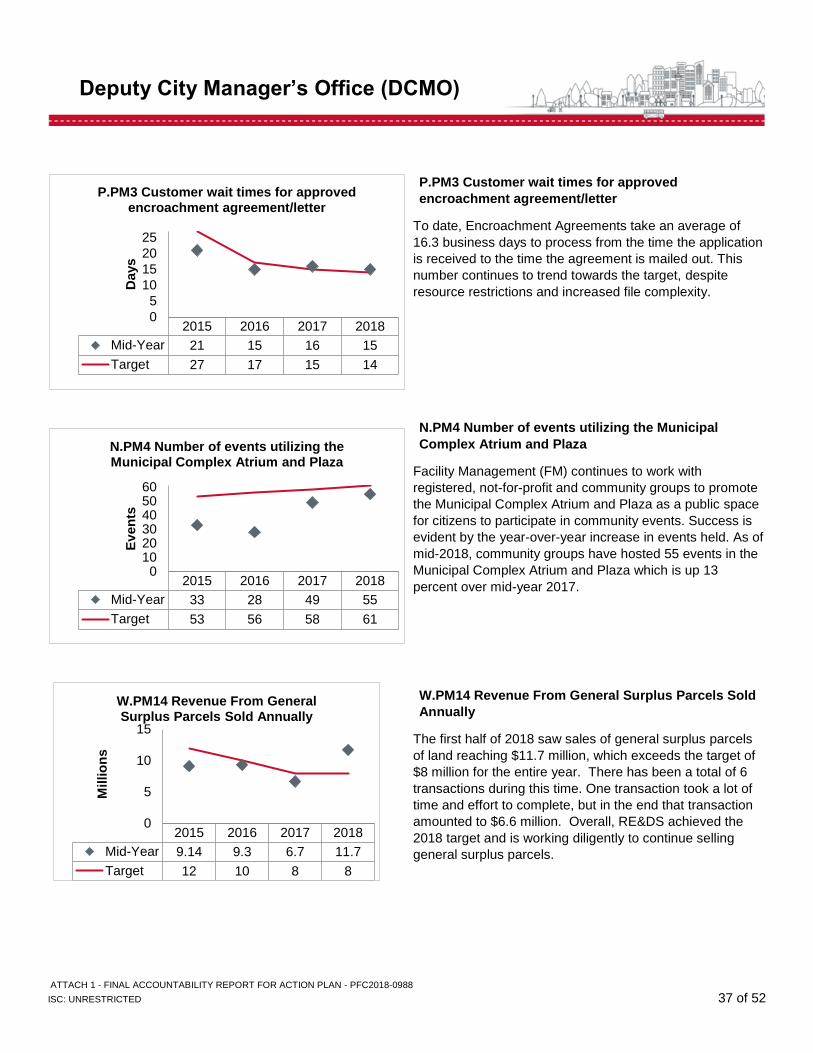
ATTACH 1 - FINAL ACCOUNTABILITY REPORT FOR ACTION PLAN - PFC2018-0988
ISC: UNRESTRICTED 37 of 52
Deputy City Manager’s Office (DCMO)
P.PM3 Customer wait times for approved
encroachment agreement/letter
To date, Encroachment Agreements take an average of
16.3 business days to process from the time the application
is received to the time the agreement is mailed out. This
number continues to trend towards the target, despite
resource restrictions and increased file complexity.
N.PM4 Number of events utilizing the Municipal
Complex Atrium and Plaza
Facility Management (FM) continues to work with
registered, not-for-profit and community groups to promote
the Municipal Complex Atrium and Plaza as a public space
for citizens to participate in community events. Success is
evident by the year-over-year increase in events held. As of
mid-2018, community groups have hosted 55 events in the
Municipal Complex Atrium and Plaza which is up 13
percent over mid-year 2017.
W.PM14 Revenue From General Surplus Parcels Sold
Annually
The first half of 2018 saw sales of general surplus parcels
of land reaching $11.7 million, which exceeds the target of
$8 million for the entire year. There has been a total of 6
transactions during this time. One transaction took a lot of
time and effort to complete, but in the end that transaction
amounted to $6.6 million. Overall, RE&DS achieved the
2018 target and is working diligently to continue selling
general surplus parcels.
2015 2016 2017 2018
Mid-Year 21 15 16 15
Target 27 17 15 14
0
5
10
15
20
25
Days
P.PM3 Customer wait times for approved encroachment agreement/letter
2015 2016 2017 2018
Mid-Year 33 28 49 55
Target 53 56 58 61
0102030405060
Ev
en
ts
N.PM4 Number of events utilizing the Municipal Complex Atrium and Plaza
2015 2016 2017 2018
Mid-Year 9.14 9.3 6.7 11.7
Target 12 10 8 8
0
5
10
15
Millio
ns
W.PM14 Revenue From General Surplus Parcels Sold Annually
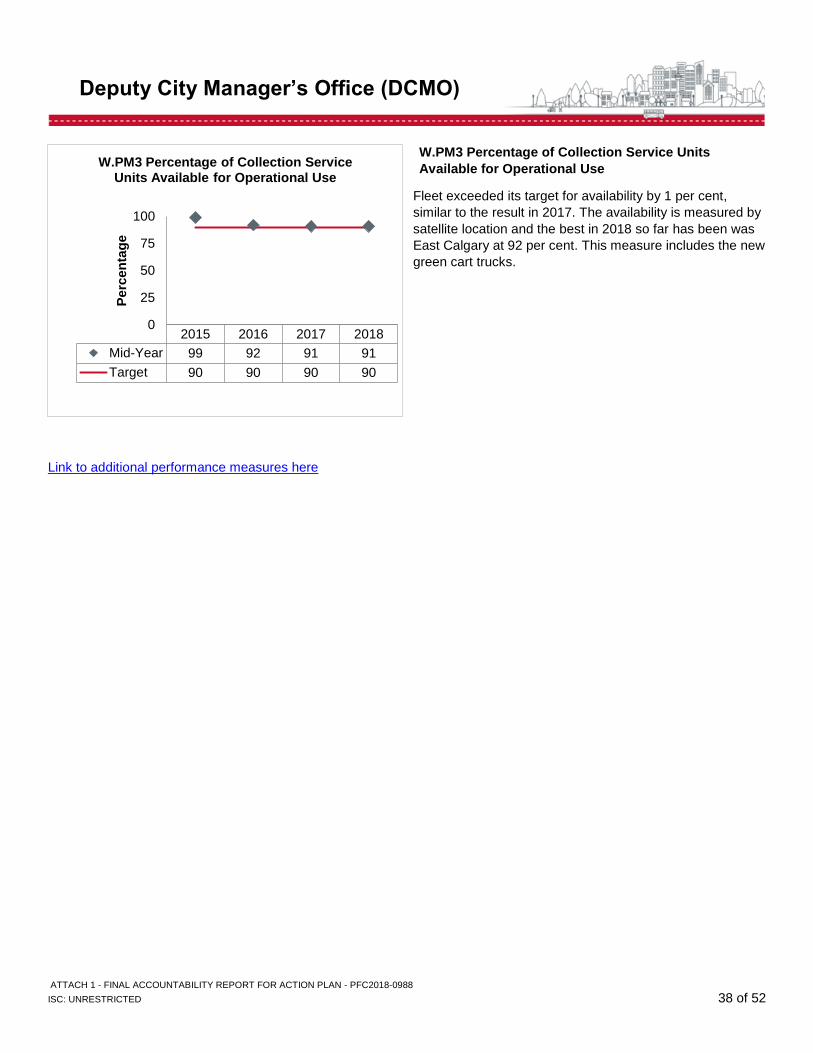
ATTACH 1 - FINAL ACCOUNTABILITY REPORT FOR ACTION PLAN - PFC2018-0988
ISC: UNRESTRICTED 38 of 52
Deputy City Manager’s Office (DCMO)
Link to additional performance measures here
W.PM3 Percentage of Collection Service Units
Available for Operational Use
Fleet exceeded its target for availability by 1 per cent,
similar to the result in 2017. The availability is measured by
satellite location and the best in 2018 so far has been was
East Calgary at 92 per cent. This measure includes the new
green cart trucks.
2015 2016 2017 2018
Mid-Year 99 92 91 91
Target 90 90 90 90
0
25
50
75
100
Perc
en
tag
e
W.PM3 Percentage of Collection Service Units Available for Operational Use
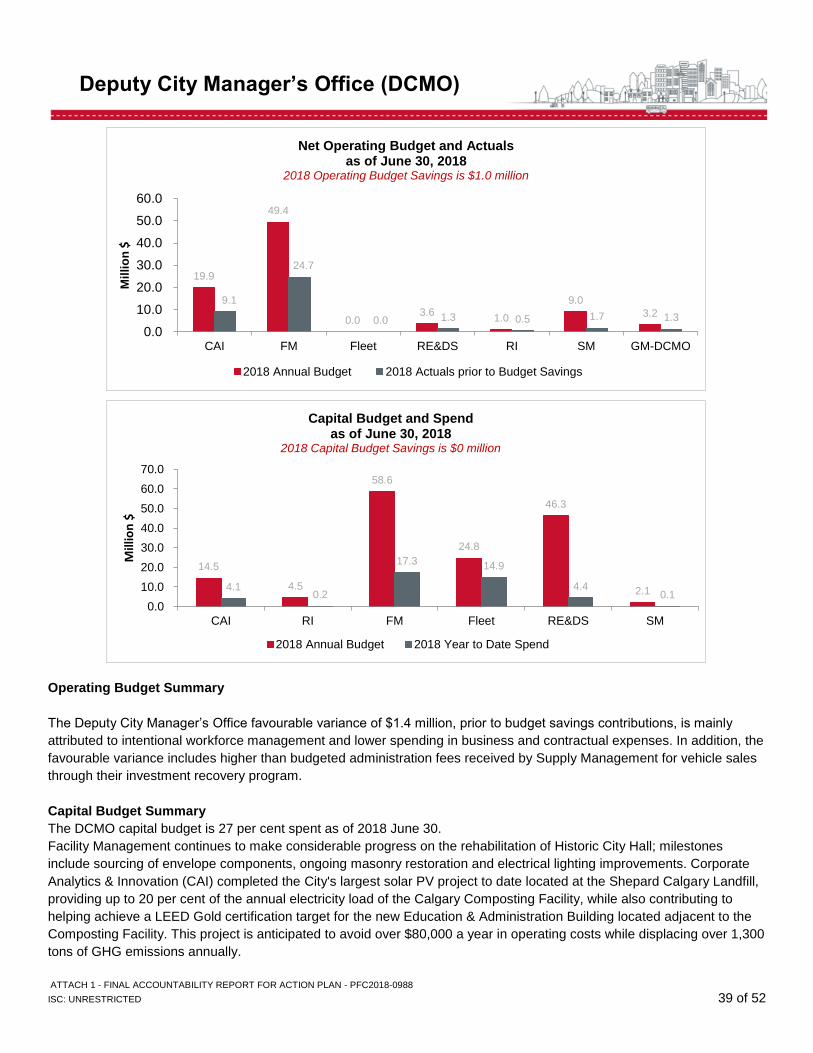
ATTACH 1 - FINAL ACCOUNTABILITY REPORT FOR ACTION PLAN - PFC2018-0988
ISC: UNRESTRICTED 39 of 52
Deputy City Manager’s Office (DCMO)
Operating Budget Summary
The Deputy City Manager’s Office favourable variance of $1.4 million, prior to budget savings contributions, is mainly
attributed to intentional workforce management and lower spending in business and contractual expenses. In addition, the
favourable variance includes higher than budgeted administration fees received by Supply Management for vehicle sales
through their investment recovery program.
Capital Budget Summary
The DCMO capital budget is 27 per cent spent as of 2018 June 30.
Facility Management continues to make considerable progress on the rehabilitation of Historic City Hall; milestones
include sourcing of envelope components, ongoing masonry restoration and electrical lighting improvements. Corporate
Analytics & Innovation (CAI) completed the City's largest solar PV project to date located at the Shepard Calgary Landfill,
providing up to 20 per cent of the annual electricity load of the Calgary Composting Facility, while also contributing to
helping achieve a LEED Gold certification target for the new Education & Administration Building located adjacent to the
Composting Facility. This project is anticipated to avoid over $80,000 a year in operating costs while displacing over 1,300
tons of GHG emissions annually.
19.9
49.4
0.0 3.6
1.0
9.0
3.2
9.1
24.7
0.0 1.3 0.5 1.7 1.3
0.0
10.0
20.0
30.0
40.0
50.0
60.0
CAI FM Fleet RE&DS RI SM GM-DCMO
Mil
lio
n$
Net Operating Budget and Actuals as of June 30, 2018
2018 Operating Budget Savings is $1.0 million
2018 Annual Budget 2018 Actuals prior to Budget Savings
14.5
4.5
58.6
24.8
46.3
2.14.10.2
17.3 14.9
4.40.1
0.0
10.0
20.0
30.0
40.0
50.0
60.0
70.0
CAI RI FM Fleet RE&DS SM
Mill
ion
$
Capital Budget and Spend as of June 30, 2018
2018 Capital Budget Savings is $0 million
2018 Annual Budget 2018 Year to Date Spend
ATTACH 1 - FINAL ACCOUNTABILITY REPORT FOR ACTION PLAN - PFC2018-0988
ISC: UNRESTRICTED 40 of 52
Chief Financial Officer’s Department
CFOD aligns with the following Council Priorities:
A prosperous city
A city of inspiring neighbourhoods
A city that moves
A healthy and green city
A well-run city
OVERVIEW
The Chief Financial Officer’s Department (CFOD) collaborates
with internal and external partners to provide financial leadership,
annual market value assessments, technology solutions, human
resources strategies, customer and communication services as
well as strategic leadership and coordination of corporate-wide
initiatives.
MID-YEAR HIGHLIGHTS
• The Compassionate Tax Penalty Relief Program was approved by Council to provide tax penalty relief to property owners under extraordinary circumstances.
• The City’s municipally-owned Internet of Things (IoT) wireless network project was awarded the 2018 Minister’s Award for Municipal Excellence in the Larger Municipalities category. This IoT infrastructure gives The City control over the network and sensor devices, reducing operating costs and providing secure access to internal users and partners.
• Extensive engagement with non-residential property and business owners during Assessment’s last Advance Consultation Period (ACP) has resulted in a 17 per cent decrease in 2018 assessment complaints.
• Workforce planning efforts resulted in $9.5 million in savings. In addition, by using internal talent acquisition resources as opposed to external search agencies, executive and hard-to-fill recruitments resulted in $654 thousand in cost savings.
• With the new “Top-of-mind” widget, site visitors for Calgary.ca now have the ability to quickly find popular tasks. The widget uses predictive and real-time analytics to display the top tasks of the day, reducing task completion time for users by 7 per cent and decreasing their likelihood of leaving the site early by 47 per cent.
• Approximately $27 million in annual financial gains have been realized through the Zero-Based Review Program as of December 2017. The City is on track to meet the goal of reviewing services that account for 80 per cent of gross operating budget by 2020.
• Code of Conduct mandatory training is underway and human resources policies were updated to reflect legislative changes.
CFOD Business Units
Assessment (ASMT)
Corporate Initatives (CI)
Customer Service & Communications (CSC)
Finance (FN)
Information Technology (IT)
Human Resources (HR)
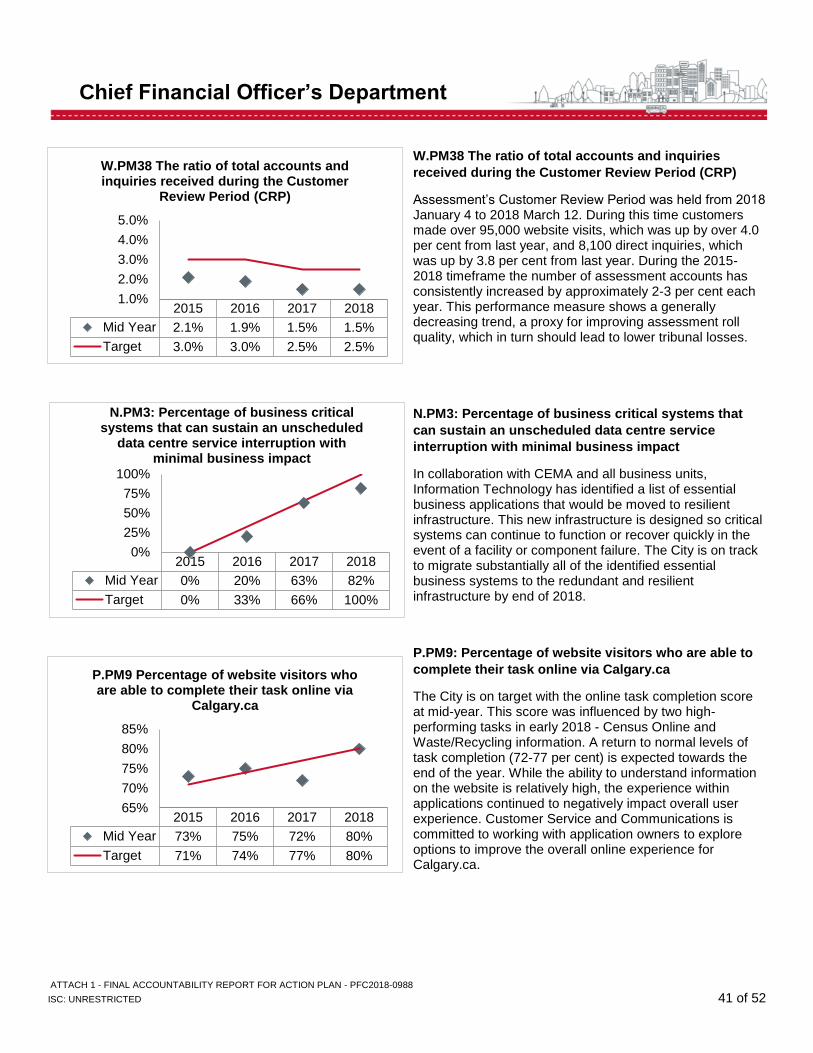
ATTACH 1 - FINAL ACCOUNTABILITY REPORT FOR ACTION PLAN - PFC2018-0988
ISC: UNRESTRICTED 41 of 52
Chief Financial Officer’s Department
W.PM38 The ratio of total accounts and inquiries
received during the Customer Review Period (CRP)
Assessment’s Customer Review Period was held from 2018 January 4 to 2018 March 12. During this time customers made over 95,000 website visits, which was up by over 4.0 per cent from last year, and 8,100 direct inquiries, which was up by 3.8 per cent from last year. During the 2015-2018 timeframe the number of assessment accounts has consistently increased by approximately 2-3 per cent each year. This performance measure shows a generally decreasing trend, a proxy for improving assessment roll quality, which in turn should lead to lower tribunal losses. N.PM3: Percentage of business critical systems that
can sustain an unscheduled data centre service
interruption with minimal business impact
In collaboration with CEMA and all business units, Information Technology has identified a list of essential business applications that would be moved to resilient infrastructure. This new infrastructure is designed so critical systems can continue to function or recover quickly in the event of a facility or component failure. The City is on track to migrate substantially all of the identified essential business systems to the redundant and resilient infrastructure by end of 2018.
P.PM9: Percentage of website visitors who are able to
complete their task online via Calgary.ca
The City is on target with the online task completion score at mid-year. This score was influenced by two high-performing tasks in early 2018 - Census Online and Waste/Recycling information. A return to normal levels of task completion (72-77 per cent) is expected towards the end of the year. While the ability to understand information on the website is relatively high, the experience within applications continued to negatively impact overall user experience. Customer Service and Communications is committed to working with application owners to explore options to improve the overall online experience for Calgary.ca.
2015 2016 2017 2018
Mid Year 2.1% 1.9% 1.5% 1.5%
Target 3.0% 3.0% 2.5% 2.5%
1.0%
2.0%
3.0%
4.0%
5.0%
W.PM38 The ratio of total accounts and inquiries received during the Customer
Review Period (CRP)
2015 2016 2017 2018
Mid Year 0% 20% 63% 82%
Target 0% 33% 66% 100%
0%
25%
50%
75%
100%
N.PM3: Percentage of business critical systems that can sustain an unscheduled
data centre service interruption with minimal business impact
2015 2016 2017 2018
Mid Year 73% 75% 72% 80%
Target 71% 74% 77% 80%
65%
70%
75%
80%
85%
P.PM9 Percentage of website visitors who are able to complete their task online via
Calgary.ca
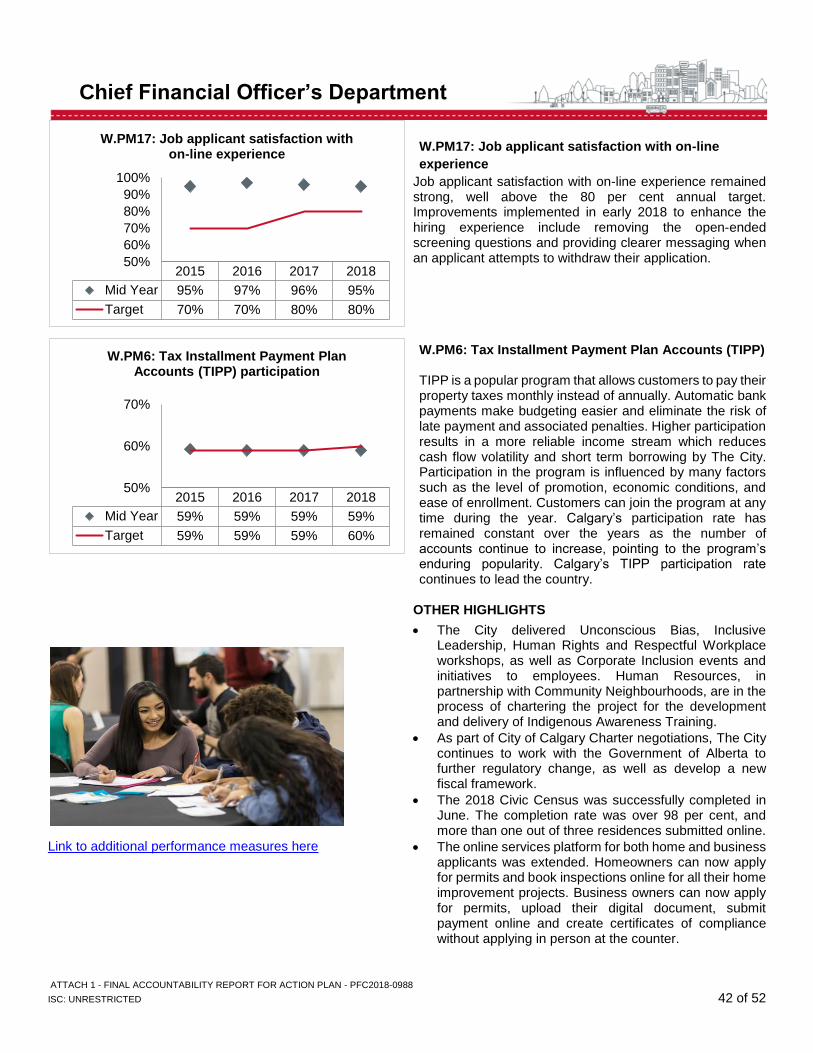
ATTACH 1 - FINAL ACCOUNTABILITY REPORT FOR ACTION PLAN - PFC2018-0988
ISC: UNRESTRICTED 42 of 52
Chief Financial Officer’s Department
Link to additional performance measures here
W.PM17: Job applicant satisfaction with on-line
experience
Job applicant satisfaction with on-line experience remained strong, well above the 80 per cent annual target. Improvements implemented in early 2018 to enhance the hiring experience include removing the open-ended screening questions and providing clearer messaging when an applicant attempts to withdraw their application. W.PM6: Tax Installment Payment Plan Accounts (TIPP) TIPP is a popular program that allows customers to pay their property taxes monthly instead of annually. Automatic bank payments make budgeting easier and eliminate the risk of late payment and associated penalties. Higher participation results in a more reliable income stream which reduces cash flow volatility and short term borrowing by The City. Participation in the program is influenced by many factors such as the level of promotion, economic conditions, and ease of enrollment. Customers can join the program at any time during the year. Calgary’s participation rate has remained constant over the years as the number of accounts continue to increase, pointing to the program’s enduring popularity. Calgary’s TIPP participation rate continues to lead the country.
OTHER HIGHLIGHTS
• The City delivered Unconscious Bias, Inclusive Leadership, Human Rights and Respectful Workplace workshops, as well as Corporate Inclusion events and initiatives to employees. Human Resources, in partnership with Community Neighbourhoods, are in the process of chartering the project for the development and delivery of Indigenous Awareness Training.
• As part of City of Calgary Charter negotiations, The City continues to work with the Government of Alberta to further regulatory change, as well as develop a new fiscal framework.
• The 2018 Civic Census was successfully completed in June. The completion rate was over 98 per cent, and more than one out of three residences submitted online.
• The online services platform for both home and business applicants was extended. Homeowners can now apply for permits and book inspections online for all their home improvement projects. Business owners can now apply for permits, upload their digital document, submit payment online and create certificates of compliance without applying in person at the counter.
2015 2016 2017 2018
Mid Year 95% 97% 96% 95%
Target 70% 70% 80% 80%
50%
60%
70%
80%
90%
100%
W.PM17: Job applicant satisfaction with on-line experience
2015 2016 2017 2018
Mid Year 59% 59% 59% 59%
Target 59% 59% 59% 60%
50%
60%
70%
W.PM6: Tax Installment Payment Plan Accounts (TIPP) participation
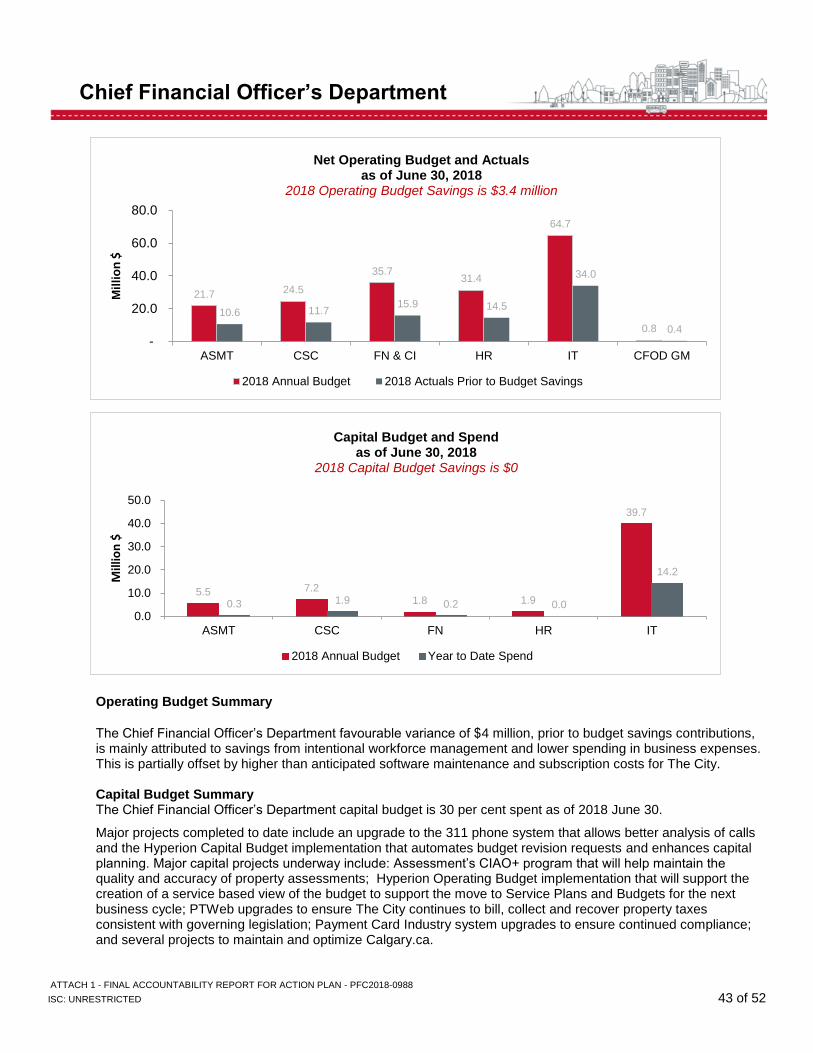
ATTACH 1 - FINAL ACCOUNTABILITY REPORT FOR ACTION PLAN - PFC2018-0988
ISC: UNRESTRICTED 43 of 52
Chief Financial Officer’s Department
Operating Budget Summary
The Chief Financial Officer’s Department favourable variance of $4 million, prior to budget savings contributions, is mainly attributed to savings from intentional workforce management and lower spending in business expenses. This is partially offset by higher than anticipated software maintenance and subscription costs for The City. Capital Budget Summary The Chief Financial Officer’s Department capital budget is 30 per cent spent as of 2018 June 30.
Major projects completed to date include an upgrade to the 311 phone system that allows better analysis of calls and the Hyperion Capital Budget implementation that automates budget revision requests and enhances capital planning. Major capital projects underway include: Assessment’s CIAO+ program that will help maintain the quality and accuracy of property assessments; Hyperion Operating Budget implementation that will support the creation of a service based view of the budget to support the move to Service Plans and Budgets for the next business cycle; PTWeb upgrades to ensure The City continues to bill, collect and recover property taxes consistent with governing legislation; Payment Card Industry system upgrades to ensure continued compliance; and several projects to maintain and optimize Calgary.ca.
21.7 24.5
35.731.4
64.7
0.8
10.6 11.715.9 14.5
34.0
0.4
-
20.0
40.0
60.0
80.0
ASMT CSC FN & CI HR IT CFOD GM
Mil
lio
n$
Net Operating Budget and Actualsas of June 30, 2018
2018 Operating Budget Savings is $3.4 million
2018 Annual Budget 2018 Actuals Prior to Budget Savings
5.5 7.21.8 1.9
39.7
0.3 1.9 0.2 0.0
14.2
0.0
10.0
20.0
30.0
40.0
50.0
ASMT CSC FN HR IT
Mill
ion
$
Capital Budget and Spendas of June 30, 2018
2018 Capital Budget Savings is $0
2018 Annual Budget Year to Date Spend
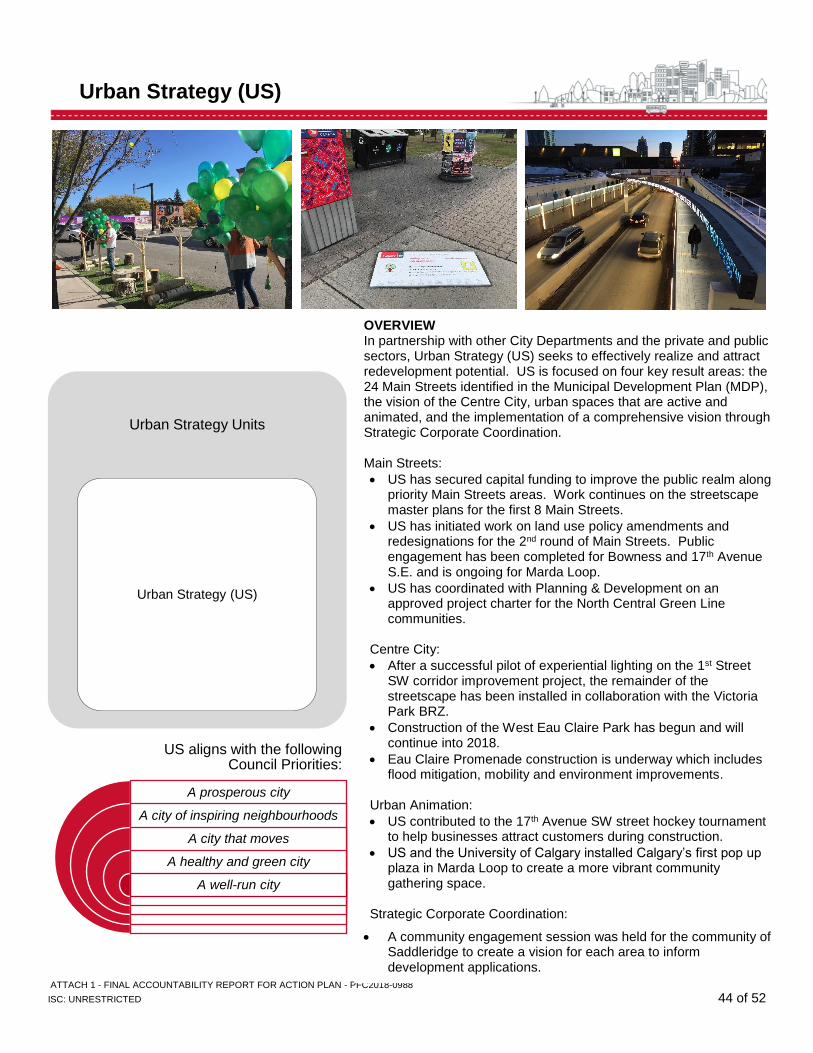
ATTACH 1 - FINAL ACCOUNTABILITY REPORT FOR ACTION PLAN - PFC2018-0988
ISC: UNRESTRICTED 44 of 52
Urban Strategy (US)
Urban Strategy Units
Urban Strategy (US)
US aligns with the following Council Priorities:
A prosperous city
A city of inspiring neighbourhoods
A city that moves
A healthy and green city
A well-run city
OVERVIEW In partnership with other City Departments and the private and public sectors, Urban Strategy (US) seeks to effectively realize and attract redevelopment potential. US is focused on four key result areas: the 24 Main Streets identified in the Municipal Development Plan (MDP), the vision of the Centre City, urban spaces that are active and animated, and the implementation of a comprehensive vision through Strategic Corporate Coordination. Main Streets:
• US has secured capital funding to improve the public realm along priority Main Streets areas. Work continues on the streetscape master plans for the first 8 Main Streets.
• US has initiated work on land use policy amendments and redesignations for the 2nd round of Main Streets. Public engagement has been completed for Bowness and 17th Avenue S.E. and is ongoing for Marda Loop.
• US has coordinated with Planning & Development on an approved project charter for the North Central Green Line communities.
Centre City:
• After a successful pilot of experiential lighting on the 1st Street SW corridor improvement project, the remainder of the streetscape has been installed in collaboration with the Victoria Park BRZ.
• Construction of the West Eau Claire Park has begun and will continue into 2018.
• Eau Claire Promenade construction is underway which includes flood mitigation, mobility and environment improvements.
Urban Animation:
• US contributed to the 17th Avenue SW street hockey tournament to help businesses attract customers during construction.
• US and the University of Calgary installed Calgary’s first pop up plaza in Marda Loop to create a more vibrant community gathering space.
Strategic Corporate Coordination:
• A community engagement session was held for the community of Saddleridge to create a vision for each area to inform development applications.
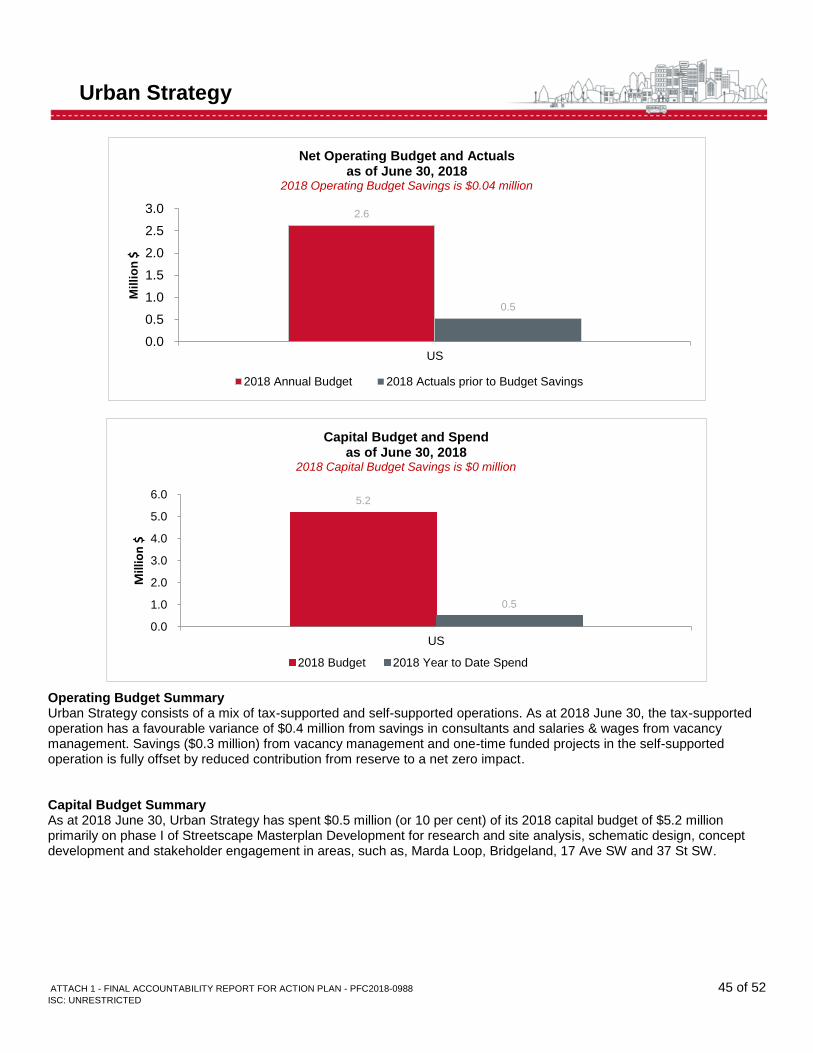
ATTACH 1 - FINAL ACCOUNTABILITY REPORT FOR ACTION PLAN - PFC2018-0988 45 of 52 ISC: UNRESTRICTED
Urban Strategy
Operating Budget Summary Urban Strategy consists of a mix of tax-supported and self-supported operations. As at 2018 June 30, the tax-supported operation has a favourable variance of $0.4 million from savings in consultants and salaries & wages from vacancy management. Savings ($0.3 million) from vacancy management and one-time funded projects in the self-supported operation is fully offset by reduced contribution from reserve to a net zero impact. Capital Budget Summary As at 2018 June 30, Urban Strategy has spent $0.5 million (or 10 per cent) of its 2018 capital budget of $5.2 million primarily on phase I of Streetscape Masterplan Development for research and site analysis, schematic design, concept development and stakeholder engagement in areas, such as, Marda Loop, Bridgeland, 17 Ave SW and 37 St SW.
2.6
0.5
0.0
0.5
1.0
1.5
2.0
2.5
3.0
US
Mil
lio
n$
Net Operating Budget and Actuals as of June 30, 2018
2018 Operating Budget Savings is $0.04 million
2018 Annual Budget 2018 Actuals prior to Budget Savings
5.2
0.5
0.0
1.0
2.0
3.0
4.0
5.0
6.0
US
Mill
ion
$
Capital Budget and Spend as of June 30, 2018
2018 Capital Budget Savings is $0 million
2018 Budget 2018 Year to Date Spend
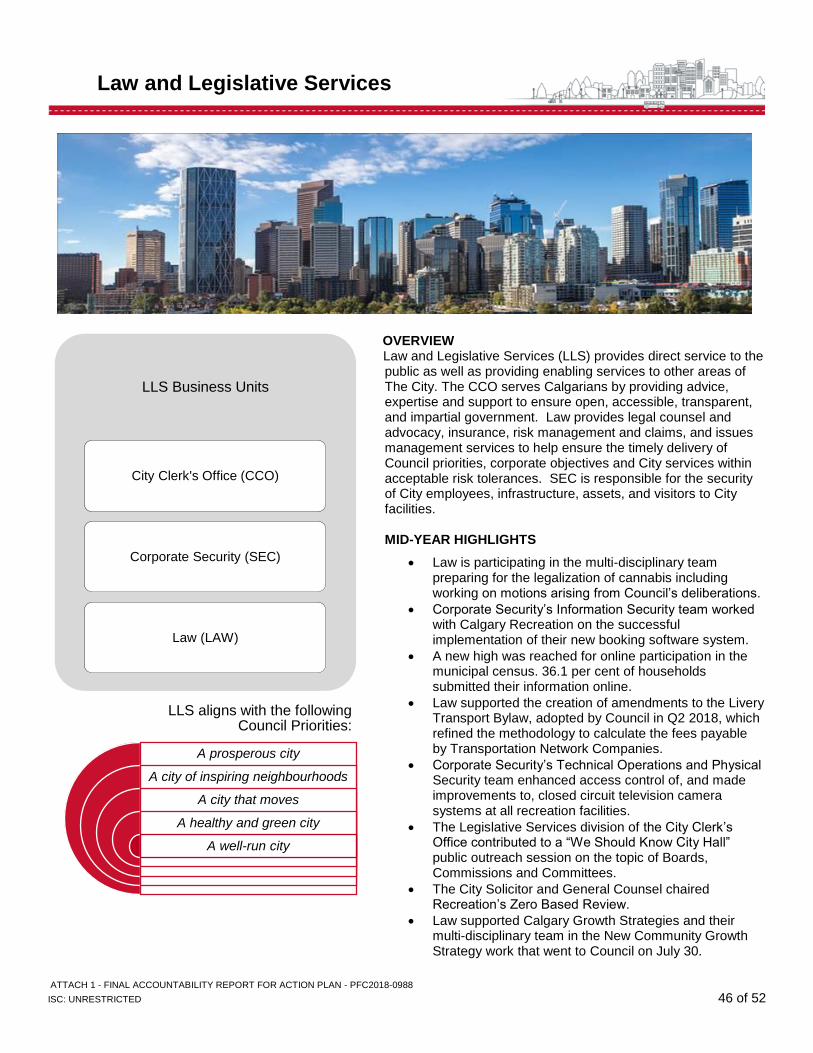
ATTACH 1 - FINAL ACCOUNTABILITY REPORT FOR ACTION PLAN - PFC2018-0988
ISC: UNRESTRICTED 46 of 52
Law and Legislative Services
OVERVIEW Law and Legislative Services (LLS) provides direct service to the public as well as providing enabling services to other areas of The City. The CCO serves Calgarians by providing advice, expertise and support to ensure open, accessible, transparent, and impartial government. Law provides legal counsel and advocacy, insurance, risk management and claims, and issues management services to help ensure the timely delivery of Council priorities, corporate objectives and City services within acceptable risk tolerances. SEC is responsible for the security of City employees, infrastructure, assets, and visitors to City facilities. MID-YEAR HIGHLIGHTS
• Law is participating in the multi-disciplinary team preparing for the legalization of cannabis including working on motions arising from Council’s deliberations.
• Corporate Security’s Information Security team worked with Calgary Recreation on the successful implementation of their new booking software system.
• A new high was reached for online participation in the municipal census. 36.1 per cent of households submitted their information online.
• Law supported the creation of amendments to the Livery Transport Bylaw, adopted by Council in Q2 2018, which refined the methodology to calculate the fees payable by Transportation Network Companies.
• Corporate Security’s Technical Operations and Physical Security team enhanced access control of, and made improvements to, closed circuit television camera systems at all recreation facilities.
• The Legislative Services division of the City Clerk’s Office contributed to a “We Should Know City Hall” public outreach session on the topic of Boards, Commissions and Committees.
• The City Solicitor and General Counsel chaired Recreation’s Zero Based Review.
• Law supported Calgary Growth Strategies and their multi-disciplinary team in the New Community Growth Strategy work that went to Council on July 30.
LLS Business Units
City Clerk's Office (CCO)
Corporate Security (SEC)
Law (LAW)
LLS aligns with the following Council Priorities:
A prosperous city
A city of inspiring neighbourhoods
A city that moves
A healthy and green city
A well-run city
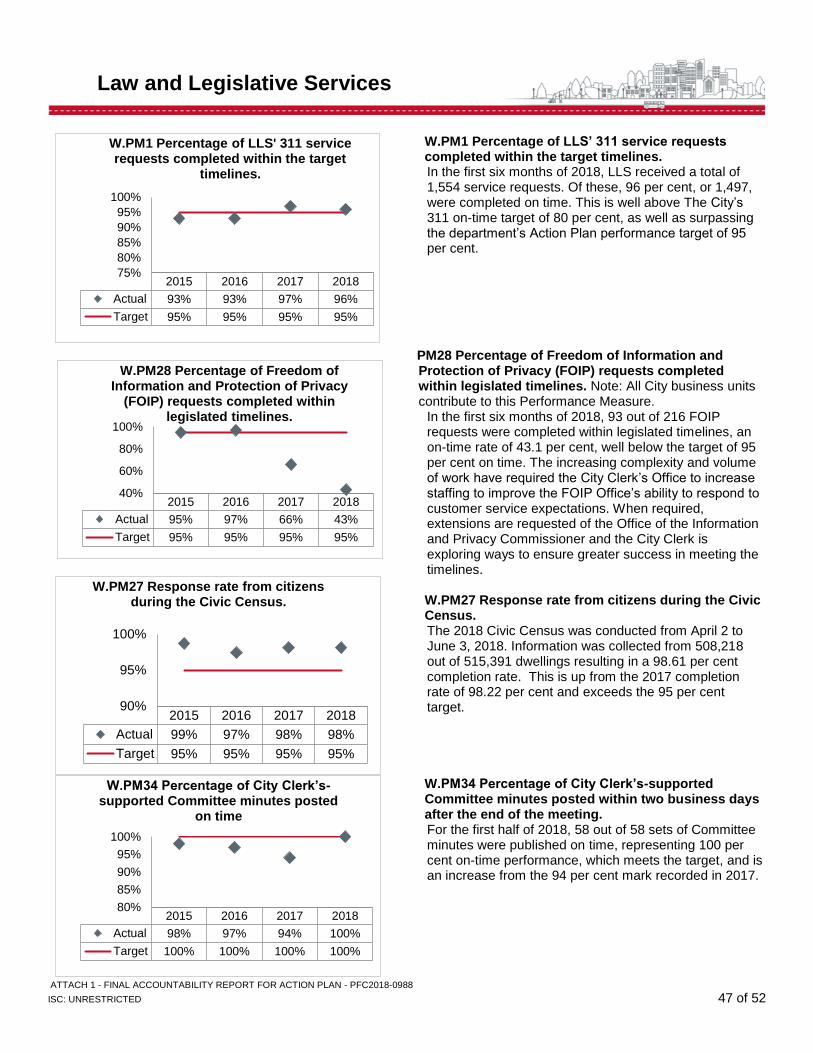
ATTACH 1 - FINAL ACCOUNTABILITY REPORT FOR ACTION PLAN - PFC2018-0988
ISC: UNRESTRICTED 47 of 52
Law and Legislative Services
W.PM1 Percentage of LLS’ 311 service requests completed within the target timelines. In the first six months of 2018, LLS received a total of 1,554 service requests. Of these, 96 per cent, or 1,497, were completed on time. This is well above The City’s 311 on-time target of 80 per cent, as well as surpassing the department’s Action Plan performance target of 95 per cent.
W.PM28 Percentage of Freedom of Information and Protection of Privacy (FOIP) requests completed within legislated timelines. Note: All City business units contribute to this Performance Measure.
In the first six months of 2018, 93 out of 216 FOIP requests were completed within legislated timelines, an on-time rate of 43.1 per cent, well below the target of 95 per cent on time. The increasing complexity and volume of work have required the City Clerk’s Office to increase staffing to improve the FOIP Office’s ability to respond to customer service expectations. When required, extensions are requested of the Office of the Information and Privacy Commissioner and the City Clerk is exploring ways to ensure greater success in meeting the timelines. W.PM27 Response rate from citizens during the Civic Census. The 2018 Civic Census was conducted from April 2 to June 3, 2018. Information was collected from 508,218 out of 515,391 dwellings resulting in a 98.61 per cent completion rate. This is up from the 2017 completion rate of 98.22 per cent and exceeds the 95 per cent target. W.PM34 Percentage of City Clerk’s-supported Committee minutes posted within two business days after the end of the meeting. For the first half of 2018, 58 out of 58 sets of Committee minutes were published on time, representing 100 per cent on-time performance, which meets the target, and is an increase from the 94 per cent mark recorded in 2017.
2015 2016 2017 2018
Actual 93% 93% 97% 96%
Target 95% 95% 95% 95%
75%
80%
85%
90%
95%
100%
W.PM1 Percentage of LLS' 311 service requests completed within the target
timelines.
2015 2016 2017 2018
Actual 95% 97% 66% 43%
Target 95% 95% 95% 95%
40%
60%
80%
100%
W.PM28 Percentage of Freedom of Information and Protection of Privacy
(FOIP) requests completed within legislated timelines.
2015 2016 2017 2018
Actual 99% 97% 98% 98%
Target 95% 95% 95% 95%
90%
95%
100%
W.PM27 Response rate from citizens during the Civic Census.
2015 2016 2017 2018
Actual 98% 97% 94% 100%
Target 100% 100% 100% 100%
80%
85%
90%
95%
100%
W.PM34 Percentage of City Clerk’s-supported Committee minutes posted
on time
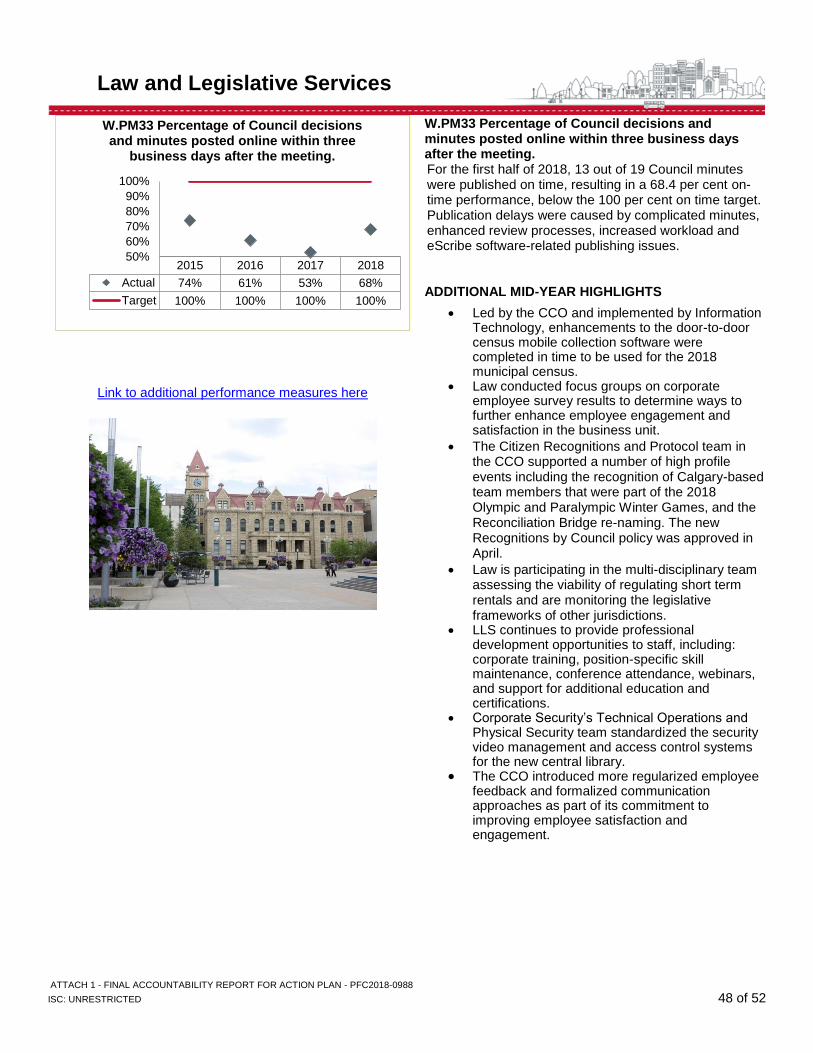
ATTACH 1 - FINAL ACCOUNTABILITY REPORT FOR ACTION PLAN - PFC2018-0988
ISC: UNRESTRICTED 48 of 52
Law and Legislative Services
Link to additional performance measures here
W.PM33 Percentage of Council decisions and minutes posted online within three business days after the meeting. For the first half of 2018, 13 out of 19 Council minutes were published on time, resulting in a 68.4 per cent on-time performance, below the 100 per cent on time target. Publication delays were caused by complicated minutes, enhanced review processes, increased workload and eScribe software-related publishing issues. ADDITIONAL MID-YEAR HIGHLIGHTS
• Led by the CCO and implemented by Information Technology, enhancements to the door-to-door census mobile collection software were completed in time to be used for the 2018 municipal census.
• Law conducted focus groups on corporate employee survey results to determine ways to further enhance employee engagement and satisfaction in the business unit.
• The Citizen Recognitions and Protocol team in the CCO supported a number of high profile events including the recognition of Calgary-based team members that were part of the 2018 Olympic and Paralympic Winter Games, and the Reconciliation Bridge re-naming. The new Recognitions by Council policy was approved in April.
• Law is participating in the multi-disciplinary team assessing the viability of regulating short term rentals and are monitoring the legislative frameworks of other jurisdictions.
• LLS continues to provide professional development opportunities to staff, including: corporate training, position-specific skill maintenance, conference attendance, webinars, and support for additional education and certifications.
• Corporate Security’s Technical Operations and Physical Security team standardized the security video management and access control systems for the new central library.
• The CCO introduced more regularized employee feedback and formalized communication approaches as part of its commitment to improving employee satisfaction and engagement.
2015 2016 2017 2018
Actual 74% 61% 53% 68%
Target 100% 100% 100% 100%
50%
60%
70%
80%
90%
100%
W.PM33 Percentage of Council decisions and minutes posted online within three
business days after the meeting.
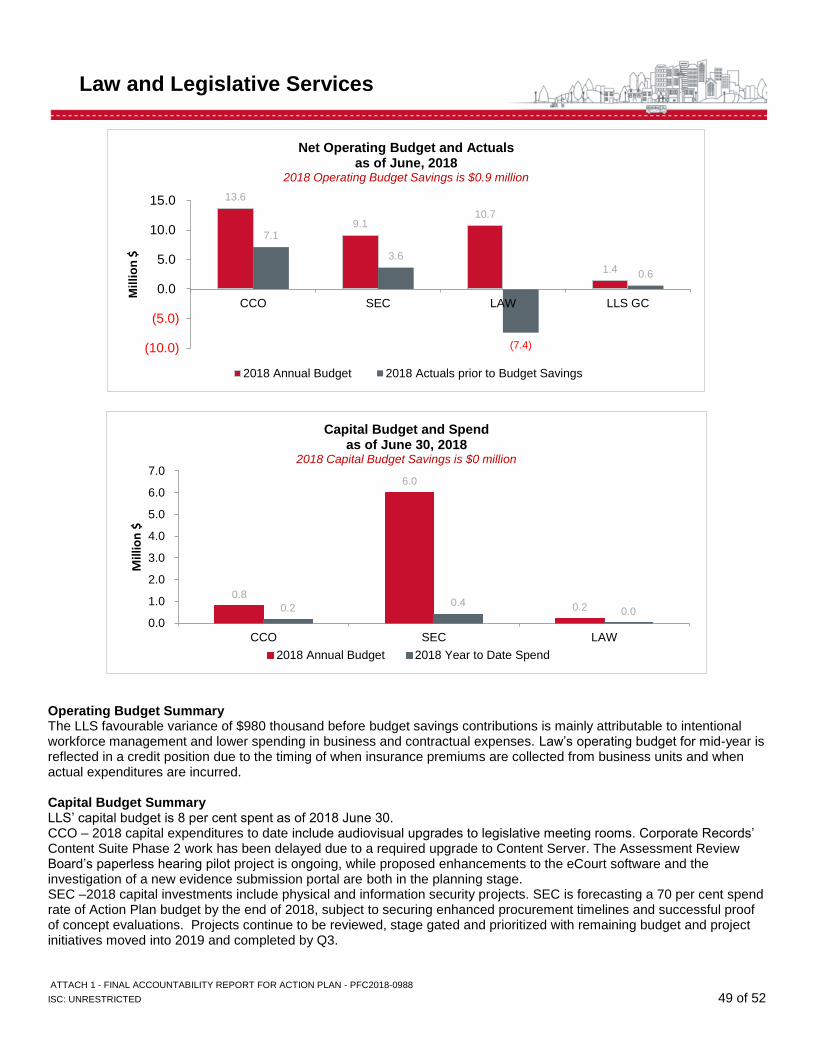
ATTACH 1 - FINAL ACCOUNTABILITY REPORT FOR ACTION PLAN - PFC2018-0988
ISC: UNRESTRICTED 49 of 52
Law and Legislative Services
Operating Budget Summary The LLS favourable variance of $980 thousand before budget savings contributions is mainly attributable to intentional workforce management and lower spending in business and contractual expenses. Law’s operating budget for mid-year is reflected in a credit position due to the timing of when insurance premiums are collected from business units and when actual expenditures are incurred. Capital Budget Summary LLS’ capital budget is 8 per cent spent as of 2018 June 30. CCO – 2018 capital expenditures to date include audiovisual upgrades to legislative meeting rooms. Corporate Records’ Content Suite Phase 2 work has been delayed due to a required upgrade to Content Server. The Assessment Review Board’s paperless hearing pilot project is ongoing, while proposed enhancements to the eCourt software and the investigation of a new evidence submission portal are both in the planning stage. SEC –2018 capital investments include physical and information security projects. SEC is forecasting a 70 per cent spend rate of Action Plan budget by the end of 2018, subject to securing enhanced procurement timelines and successful proof of concept evaluations. Projects continue to be reviewed, stage gated and prioritized with remaining budget and project initiatives moved into 2019 and completed by Q3.
0.8
6.0
0.20.20.4
0.00.0
1.0
2.0
3.0
4.0
5.0
6.0
7.0
CCO SEC LAW
Mill
ion
$
Capital Budget and Spend as of June 30, 2018
2018 Capital Budget Savings is $0 million
2018 Annual Budget 2018 Year to Date Spend
13.6
9.110.7
1.4
7.1
3.6
(7.4)
0.6
(10.0)
(5.0)
0.0
5.0
10.0
15.0
CCO SEC LAW LLS GC
Mil
lio
n$
Net Operating Budget and Actuals as of June, 2018
2018 Operating Budget Savings is $0.9 million
2018 Annual Budget 2018 Actuals prior to Budget Savings
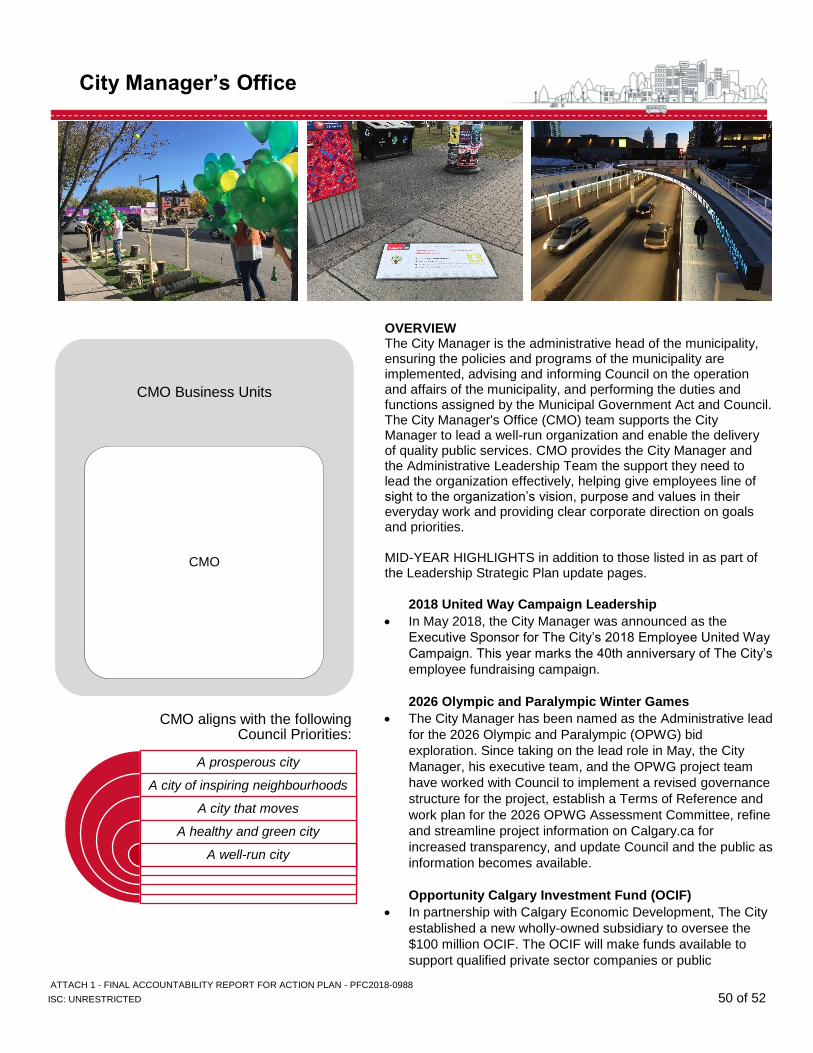
ATTACH 1 - FINAL ACCOUNTABILITY REPORT FOR ACTION PLAN - PFC2018-0988
ISC: UNRESTRICTED 50 of 52
City Manager’s Office
OVERVIEW
The City Manager is the administrative head of the municipality, ensuring the policies and programs of the municipality are implemented, advising and informing Council on the operation and affairs of the municipality, and performing the duties and functions assigned by the Municipal Government Act and Council. The City Manager's Office (CMO) team supports the City Manager to lead a well-run organization and enable the delivery of quality public services. CMO provides the City Manager and the Administrative Leadership Team the support they need to lead the organization effectively, helping give employees line of sight to the organization’s vision, purpose and values in their everyday work and providing clear corporate direction on goals and priorities. MID-YEAR HIGHLIGHTS in addition to those listed in as part of the Leadership Strategic Plan update pages.
2018 United Way Campaign Leadership
• In May 2018, the City Manager was announced as the
Executive Sponsor for The City’s 2018 Employee United Way
Campaign. This year marks the 40th anniversary of The City’s
employee fundraising campaign.
2026 Olympic and Paralympic Winter Games
• The City Manager has been named as the Administrative lead
for the 2026 Olympic and Paralympic (OPWG) bid
exploration. Since taking on the lead role in May, the City
Manager, his executive team, and the OPWG project team
have worked with Council to implement a revised governance
structure for the project, establish a Terms of Reference and
work plan for the 2026 OPWG Assessment Committee, refine
and streamline project information on Calgary.ca for
increased transparency, and update Council and the public as
information becomes available.
Opportunity Calgary Investment Fund (OCIF)
• In partnership with Calgary Economic Development, The City
established a new wholly-owned subsidiary to oversee the
$100 million OCIF. The OCIF will make funds available to
support qualified private sector companies or public
CMO aligns with the following Council Priorities:
A prosperous city
A city of inspiring neighbourhoods
A city that moves
A healthy and green city
A well-run city
CMO Business Units
CMO
ATTACH 1 - FINAL ACCOUNTABILITY REPORT FOR ACTION PLAN - PFC2018-0988
ISC: UNRESTRICTED 51 of 52
City Manager’s Office
institutions, making investments to catalyze economic growth,
retain and diversify the economy, create employment, and
increase the property tax assessment base.
Business Friendly Actions and Initiatives
• The CMO led the development of an information package
outlining The City’s business friendly actions and initiatives,
which aim to support business development in Calgary. This
information can be used to support the Mayor and Council,
our colleagues at Calgary Economic Development, and other
economic/business development stakeholders to better be
able to speak to the specific actions The City is taking to work
with members of the business community and continue to be
business-friendly.
External Speaking Engagements
• City Manager, Jeff Fielding, spoke at a number of events to
promote The City as a place to do business, a place of
employment, and an innovative organization in Calgary.
These events included the Partnering with Industry
Symposium, Building Industry and Land Development
Association (BILD) Calgary Region membership event,
National Association for Industrial and Office Parks (NAIOP)
Board and Government Affairs Committee, Urban Land
Alberta Institute’s (ULI) Canadian City Catalyst Council,
Calgary Economic Development’s Calgary CEO Roundtable,
and an ENMAX Leaders Forum.
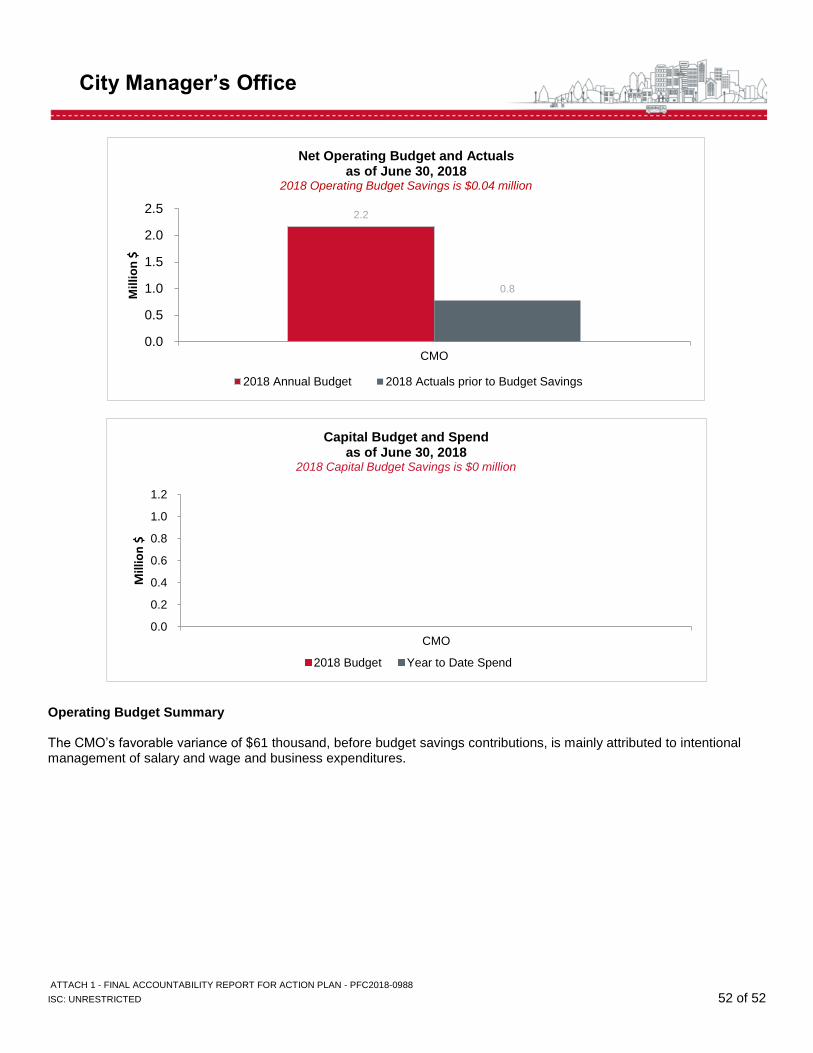
ATTACH 1 - FINAL ACCOUNTABILITY REPORT FOR ACTION PLAN - PFC2018-0988
ISC: UNRESTRICTED 52 of 52
City Manager’s Office
Operating Budget Summary The CMO’s favorable variance of $61 thousand, before budget savings contributions, is mainly attributed to intentional management of salary and wage and business expenditures.
2.2
0.8
0.0
0.5
1.0
1.5
2.0
2.5
CMO
Mil
lio
n$
Net Operating Budget and Actuals as of June 30, 2018
2018 Operating Budget Savings is $0.04 million
2018 Annual Budget 2018 Actuals prior to Budget Savings
0.0
0.2
0.4
0.6
0.8
1.0
1.2
CMO
Mill
ion
$
Capital Budget and Spend as of June 30, 2018
2018 Capital Budget Savings is $0 million
2018 Budget Year to Date Spend