action plan of greece - international civil aviation ... · action plan on emissions reduction of...
TRANSCRIPT

Action Plan on Emissions Reduction of Greece Draft version 1.0

Action Plan on Emissions Reduction of Greece
2
Table of Contents
INTRODUCTION ............................................................................... 3
1. General Information ................................................................. 4
2. Current State of Aviation in Greece ............................................ 6
2.1. Background information on greenhouse gas inventories, climate
change and supplementary information required under Article 7,
paragraph 1, of the Kyoto Protocol ......................................................................... 6
2.2. Background information on climate change United Nations
Framework Convention on Climate Change ......................................................... 6
2.2.1. Background information on greenhouse gas inventories ........ 8
2.2.2. Background information on supplementary information
required under Article 7, paragraph 1, of the Kyoto Protocol ................... 9
2.3. Overview of institutional, legal and procedural arrangements for
compiling GHG inventory and supplementary information required under
Article 7, paragraph 1, of the Kyoto Protocol .................................................... 10
2.4. GHG inventory, data collection, processing and storage .............. 11
2.5. Emissions trends for aggregated greenhouse gas emissions ...... 15
2.6. Transport .......................................................................................................... 18
2.7. Internal aviation ............................................................................................ 21
2.8. International bunker fuels ......................................................................... 23
SECTION I ..................................................................................... 27
Supra-national measures, including those led by the EU ...................... 27
1. Aircraft Related Technology Development ...................................... 28
2. Alternative Fuels ................................................................... 32
3. Improved Air Traffic Management and Infrastructure Use ........... 35
4. Economic / Market-based Measures .............................................. 38
5. Support to Voluntary Actions: ACI Airport Carbon Accreditation ... 41
SECTION 2 .................................................................................... 45
National Actions in Greece ............................................................... 45
CONCLUSION ................................................................................. 46

Action Plan on Emissions Reduction of Greece
3
INTRODUCTION

Action Plan on Emissions Reduction of Greece
4
1. General Information
a) Greece is a member of the European Union since 1981 and a founding member of the European Civil Aviation Conference (ECAC). ECAC is an intergovernmental organisation covering the widest grouping of Member States1 of any European organisation dealing with civil aviation. It is currently composed of 44 Member States, and was created in 1955.
b) ECAC States share the view that environmental concerns represent a potential constraint on the future development of the international aviation sector, and together they fully support ICAO’s ongoing efforts to address the full range of these concerns, including the key strategic challenge posed by climate change, for the sustainable development of international air transport.
c) Greece, like all of ECAC’s forty-four States, is fully committed to and involved in the fight against climate change, and works towards a resource-efficient, competitive and sustainable multimodal transport system.
d) Greece recognises the value of each State preparing and submitting to ICAO a State Action Plan on emissions reductions, as an important step towards the achievement of the global collective goals agreed at the 37th Session of the ICAO Assembly in 2010.
e) In that context, it is the intention that all ECAC States submit to ICAO an Action Plan2, regardless of whether or not the 1% de mimimis threshold is met, thus going beyond the agreement of ICAO Assembly Resolution A/37-19. This is the Action Plan of Greece.
f) Greece shares the view of all ECAC States that a comprehensive approach to reducing aviation emissions is necessary, and that this should include:
i. emission reductions at source, including European support to CAEP work
ii. research and development on emission reductions technologies, including public-private partnerships
1 Albania, Armenia, Austria, Azerbaijan, Belgium, Bosnia and Herzegovina, Bulgaria, Croatia, Cyprus, Czech Republic, Denmark, Estonia, Finland, France, Georgia, Germany, Greece, Hungary, Iceland, Ireland, Italy, Latvia, Lithuania, Luxembourg, Malta, Moldova, Monaco, Montenegro, Netherlands, Norway, Poland, Portugal, Romania, San Marino, Serbia, Slovakia, Slovenia, Spain, Sweden, Switzerland, The former Yugoslav Republic of Macedonia, Turkey, Ukraine, and the United Kingdom
2 [Comment: Insert this footnote only if necessary, i.e. if emissions reporting is not included in this Action Plan] ICAO Assembly Resolution A37-19 also encourages States to submit an annual reporting on international aviation CO2 emissions. This is considered by Europe an important task, but one which is different in nature and purpose to the Action Plans, which are strategic in their nature. For that reason, the reporting to ICAO on international aviation CO2 emissions referred to at paragraph 9 of ICAO Resolution A37/19 is not part of this Action Plan. This information will be provided to ICAO separately.

Action Plan on Emissions Reduction of Greece
5
iii. the development and deployment of low-carbon sustainable alternative fuels, including research and operational initiatives undertaken jointly with stakeholders
iv. the optimisation and improvement of Air Traffic Management, and infrastructure use within Europe, in particular through the Single European Sky ATM Research (SESAR), and also beyond European borders, through the Atlantic Initiative for the Reduction of Emissions (AIRE) in cooperation with the US FAA.
v. Market-based measures, such as open emission trading schemes (ETS), which allow the sector to continue to grow in a sustainable and efficient manner, recognising that the measures at (i) to (iv) above cannot, even in aggregate, deliver in time the emissions reductions necessary to meet the global goals. This growth becomes possible through the purchase under an ETS of CO2 allowances from other sectors of the economy, where abatement costs are lower than within the aviation sector.
g) In Europe, many of the actions which are undertaken within the framework of this comprehensive approach are in practice taken at a supra-national level, most of them led by the EU. They are reported in Section 1 of this Action Plan, where Greece’s involvement in them is described, as well as that of stakeholders.
h) In Greece a number of actions are undertaken at the national level, including by stakeholders, in addition to those of a supra-national nature. These national actions are reported in Section 2 of this Plan.
i) In relation to actions which are taken at a supranational level, it is important to note that:
i. The extent of participation will vary from one State and another, reflecting the priorities and circumstances of each State (economic situation, size of its aviation market, historical and institutional context, such as EU/ non EU). The ECAC States are thus involved to different degrees and on different timelines in the delivery of these common actions. When an additional State joins a collective action, including at a later stage, this broadens the effect of the measure, thus increasing the European contribution to meeting the global goals.
ii. Nonetheless, acting together, the ECAC States have undertaken to reduce the region’s emissions through a comprehensive approach which uses each of the pillars of that approach. Some of the component measures, although implemented by some but not all of ECAC’s 44 States, nonetheless yield emission reduction benefits across the whole of the region (thus for example research, ETS).

Action Plan on Emissions Reduction of Greece
6
2. Current State of Aviation in Greece
2.1. Background information on greenhouse gas inventories,
climate change and supplementary information required under Article 7, paragraph 1, of the Kyoto Protocol
The impact of all human activities on the climate of earth has been recognized as the greatest global environmental challenge involving the whole international community. The mitigation of the effects of this problem requires responses from governments, economic sectors and all societal actors working together.
Naturally occurring greenhouse gases (GHG) include water vapour, carbon dioxide (CO2), methane (CH4), nitrous oxide (N2O) and ozone (O3). In the last few years, a new category of greenhouse gases has emerged that includes hydrofluorocarbons (HFC), perfluorocarbons (PFC) and sulphur hexafluoride (SF6). These gases are man-made and are mainly used in a number of industrial activities in replacement of CFCs. Other naturally occurring gases, which do not contribute directly to the greenhouse effect, are carbon monoxide (CO), oxides of nitrogen (NOx), non-methane volatile organic compounds (NMVOC) and sulphur dioxide (SO2).
2.2. Background information on climate change United Nations
Framework Convention on Climate Change
In response to the emerging evidence that climate change could have a major global impact, the United Nations Framework Convention on Climate Change (henceforth the Convention) was adopted on 9 May 1992 and was opened for signature in Rio de Janeiro in June 1992. Greece signed the Convention in Rio and ratified it in 1994 (Law 2205/94). The ultimate objective of the Convention is the stabilisation of greenhouse gas concentrations in the atmosphere at a level that would prevent dangerous anthropogenic interference with the climate system. The Convention recognizes that the developed countries should take the lead in combating climate change and calls these countries to:
• Adopt policies and measures to mitigate climate change. • Return, individually or jointly, to 1990 levels of carbon dioxide and
other greenhouse gas by the year 2000 • Provide technology transfer and financial resources to help
developing countries so as to confront climate change impacts and to develop, ensuring at the same time the environmental protection through the restraint of GHG emissions.

Action Plan on Emissions Reduction of Greece
7
Kyoto Protocol
Recognizing early the need for an effective instrument to provide confidence in addressing the climate change challenge, the Parties at the third meeting of the Conference of the Parties (COP) to the Convention, held in Kyoto (1-11 December 1997), finalised negotiations related to the establishment of such a legal instrument, the Kyoto Protocol on Climate Change (henceforth the Protocol). The Protocol provides a foundation upon which future action can be intensified. It establishes, for the first time, legally binding targets for the reduction of greenhouse gas emissions and it also confirms the capacity of the international community to cooperate in action to deal with a major global environmental problem. The Protocol calls for legally binding commitments of the developed countries to reduce, individually or jointly, emissions of 6 greenhouse gases (CO2, CH4, N2O, HFC, PFC and SF6) by more than 5% in the period 2008 to 2012, below their 1990 level. The EU and its Member States agreed to a -8% reduction. For the achievement of these targets, the Protocol provides for the use of the following:
• Adoption of national policies and measures. • Establishment of an emissions trading regime. • Establishment of the joint implementation mechanism. • Establishment of a clean development mechanism and • Protection and promotion of sinks to enhance CO2 removals.
Detailed rules for the implementation of the Protocol were set out at the 7th Conference of the Parties (in Marrakesh) and are described in the Marrakesh Accords adopted in 2001. The Protocol entered into force on 16 February 2005, after its ratification from 141 Parties including developed countries with a contribution of more than 55% to global CO2 emissions in 1990. At the first Conference of the Parties serving as the Meeting of the Parties to the Protocol (COP/CMP) held in Canada (December 2005) the rules for the implementation of the Protocol agreed at COP7 were adopted. The same COP/CMP established a working group, called the Ad Hoc Working Group on Further Commitments for Annex I Parties under the Kyoto Protocol (AWG-KP), to discuss future commitments for industrialized countries under the Kyoto Protocol. The Conference of the Parties (COP) in 2007, by its decision 1/CP.13 (the Bali Action Plan) launched a comprehensive process to enable the full, effective and sustained implementation of the Convention through long-term cooperative action, now, up to and beyond 2012, to be conducted under a subsidiary body under the Convention, the Ad Hoc Working Group on Long-Term Cooperative Action under the Convention (AWG-LCA).

Action Plan on Emissions Reduction of Greece
8
National commitments
Within the framework of the Convention, the Greek government, after taking into consideration both economic and social parameters, agreed that a realistic target for Greece was the restriction of the overall increase of carbon dioxide emissions to 15% ± 3% by 2000 compared to 1990 levels. The measures taken in order to achieve this restriction in the CO2 emissions were described in the 1st Greek National Action Plan for the abatement of CO2 and other greenhouse gases emissions (MINENV / NTUA 1995). With respect to the EU target under the Kyoto Protocol (i.e. reduction of emissions at 8% for the period 2008-2012), EU has stated that this will be achieved jointly by EU Member-States under the provisions of Article 4 of the Protocol. The Burden-Sharing agreement between all Member States was finalised during the Environment Council in June 1998 and entered into force with Decision 2002/358/EC concerning the approval, on behalf of the European Community, of the Kyoto Protocol. According to this agreement, Greece is committed to limit its GHG emissions increase for the period 2008 – 2012 to +25% compared to base year emissions (1990 for CO2, CH4 and N2O emissions – 1995 for F - gases). Greece ratified the Protocol in 2002 (Law 3017/2002) and adopted the 2nd National Programme for Climate Change (MINENV, 2002) for achieving the abovementioned commitment by a decision of the Council of Ministers (DCM5/2003).
2.2.1. Background information on greenhouse gas inventories
Annual inventories of greenhouse and other gases emissions form an essential element of each national environmental policy-making process. They can be used to derive information on emissions trends, with reference to a pre-selected base year, and can assist in monitoring the progress of existing abatement measures for the reduction of greenhouse gases emissions and the fulfilment of the KP target. According to Article 4 of the Convention, Annex I Parties have the obligation to submit national inventories of GHG emissions and removals. At COP2, the annual submission of inventories was decided (Decision 9/CP.2), while the use of the "Revised 1996 IPCC Guidelines for National Greenhouse Gas Inventories" (henceforth IPCC Guidelines) was adopted with Decision 2/CP.3. In order to enhance the transparency of the GHG inventories submitted and improve comparability across sectors and different countries, the use of Common Reporting Format (CRF) tables for the submission of the emissions/removals estimates per source/sink category was adopted at COP5 (Decision 3/CP.5). At the 12th session of the Subsidiary Body for Scientific and Technological Advice (SBSTA), the use of the IPCC "Good Practice Guidance and

Action Plan on Emissions Reduction of Greece
9
Uncertainty Management in National Greenhouse Gas Inventories" (henceforth IPCC Good Practice Guidance) for inventories due in 2003 and beyond was decided. The IPCC Good Practice Guidance is considered as an elaboration of the IPCC Guidelines. New reporting guidelines, together with a structure of the National Inventory Report (NIR) were adopted at COP8 (Decision 18/CP.8) for use in reporting annual inventories due in 2004 and beyond. Overall annual national inventories submissions include the submission of both the Common Reporting Format tables and the National Inventory Report by the 15th of April. At COP9 the use of the IPCC "Good Practice Guidance for Land Use, Land Use Change and Forestry" (henceforth LULUCF Good Practice Guidance) for inventories due in 2005 and beyond was adopted (Decision 13/CP.9). Moreover, new Common Reporting Format tables for LULUCF, to be used for a trial period covering inventory submissions due in 2005, were adopted with the same decision. The Conference of the Parties (COP), by its decision 14/CP.11, adopted the tables of the common reporting format and their notes for reporting on land use, land-use change and forestry (LULUCF) sector, to be used for the purpose of submission of the annual inventory due in and after 2007. Greece, as an Annex I signatory Party to the Convention, has to comply with the above-mentioned reporting requirements. Parallel commitments also exist under the European Council Decision 280/2004/EC concerning a mechanism for monitoring Community greenhouse gas emissions and for implementing the Kyoto Protocol. With the present report, which contains estimates of GHG emissions for Greece for the years 1990-2009, and the mandatory supplementary information required for the 2011 submission under the Kyoto Protocol, the above obligations are addressed.
2.2.2. Background information on supplementary information
required under Article 7, paragraph 1, of the Kyoto Protocol
Greece, as an Annex I Party that is also Party to the Kyoto Protocol is also required to report supplementary information required under Article 7, paragraph 1, of the Kyoto Protocol, with the inventory submission due under the Convention, in accordance with paragraph 3(a) of decision 15/CMP.1. Part II of this report (Chapters 10-14) provides information on activities under Article 3, paragraph 3 (Afforestation, Reforestation, Deforestation) and the elected activity under Article 3, paragraph 4 (Forest Management), on accounting of Kyoto units, on changes in the national system and the national registry and information on the minimization of adverse impacts of climate change in accordance with Articles 3.14.

Action Plan on Emissions Reduction of Greece
10
2.3. Overview of institutional, legal and procedural arrangements for compiling GHG inventory and supplementary information
required under Article 7, paragraph 1, of the Kyoto Protocol In article 5, paragraph 1 of the Protocol, it is specified that "Each Party included in Annex I shall have in place, no later than one year prior to the start of the first commitment period, a national system for the estimation of anthropogenic emissions by sources and removals by sinks of all greenhouse gases not controlled by the Montreal Protocol". A national system includes all institutional, legal and procedural arrangements made within an Annex I Party of the Convention that is also a Party to the Protocol for estimating anthropogenic emissions by sources and removals by sinks of all greenhouse gases not controlled by the Montreal Protocol, and for reporting and archiving inventory information. The Ministry of Environment, Energy and Climate Change, MEECC (former Ministry for the Environment, Physical Planning and Public Works) is the governmental body responsible for the development and implementation of environmental policy in Greece, as well as for the provision of information concerning the state of the environment in Greece in compliance with relevant requirements defined in international conventions, protocols and agreements. Moreover, the MEECC is responsible for the co-ordination of all involved ministries, as well as any relevant public or private organization, in relation to the implementation of the provisions of the Kyoto Protocol, according to the Law 3017/2002 with which Greece ratified the Kyoto Protocol. Figure 2.1 provides an overview of the organizational structure of the National Inventory System. The entities participating in it are:
• The MEECC designated as the national entity responsible for the national inventory, which keeps the overall responsibility, but also plays an active role in the inventory planning, preparation and management.
• The National Technical University of Athens (NTUA) / School of Chemical Engineering, which has the technical and scientific responsibility for the compilation of the annual inventory.
• Governmental ministries and agencies through their appointed focal persons, ensure the data provision.
The compilation of the LULUCF inventory (UNFCCC and Kyoto Protocol) is a responsibility of the General Directorate for the Development and Protection of Forests and Natural Environment (GDDPFNE) of MEECC and is conducted by external consultant. International or national associations, along with individual public or private industrial companies cotribute to data providing and development of methodological issues as appropriate.

Action Plan on Emissions Reduction of Greece
11
The legal framework defining the roles-responsibilities and the co-operation between the MEECC Climate team, the NTUA Inventory team and the designated contact points of the competent Ministries was formalized by circular 918/21-4-08 released by MEECC (former MINENV) entitled “Structure and operation of the National Greenhouse Gases Inventory System- Roles and Responsibilities” and modified accordingly. The above-mentioned circular includes a description of each entity’s responsibilities, concerning the inventory preparation, data providing or other relative information. This formal framework has improved the collaboration between the entities involved, assuring the timely collection and quality of the activity data required and solving data access restriction problems raised due to confidentiality issues. According to the Presidential Decree No 189 dated 5th November 2009 the new Ministry of Environment, Energy and Climate change retains the responsibilities regarding the Environment, and Physical Planning of the former Ministry for the Environment, Physical Planning and Public Works. Furthermore, the General Directorate of Energy and Natural Resources, previously belonging to the Ministry of Development as well as the General Directorate of Forest Development and Protection and Natural Resources, previously belonging to the Ministry of Rural Development and Food, are transferred to the Ministry of Environment, Energy and Climate Change. The Public Works General Secretariat was transferred to the new Ministry of Infrastructure, Transport and Networks.
2.4. GHG inventory, data collection, processing and storage
The preparation of the Greek GHG emissions inventory is based on the application of the Revised 1996 IPCC Guidelines for National Greenhouse Gas Inventories, as elaborated by the IPCC good practice guidance. The compilation of the inventory is completed in three main stages (Figure 2.2), while the timetable for the completion of those stages in the annual inventory cycle is presented in Figure 2.3.

Action Plan on Emissions Reduction of Greece
12
Figure 2.1 Organizational Structure of the National Inventory System

Action Plan on Emissions Reduction of Greece
13
Figure 2.2 GHG emissions inventory preparation process in Greece

Action Plan on Emissions Reduction of Greece
14
Fig
ure
2.3
Tim
eta
ble
for
the p
repara
tion a
nd s
ubm
issio
n o
f G
HG
em
issio
ns/r
em
ovals
invento
ry in G
reece
Action Plan on Emissions Reduction of Greece
15
2.5. Emissions trends for aggregated greenhouse gas
emissions
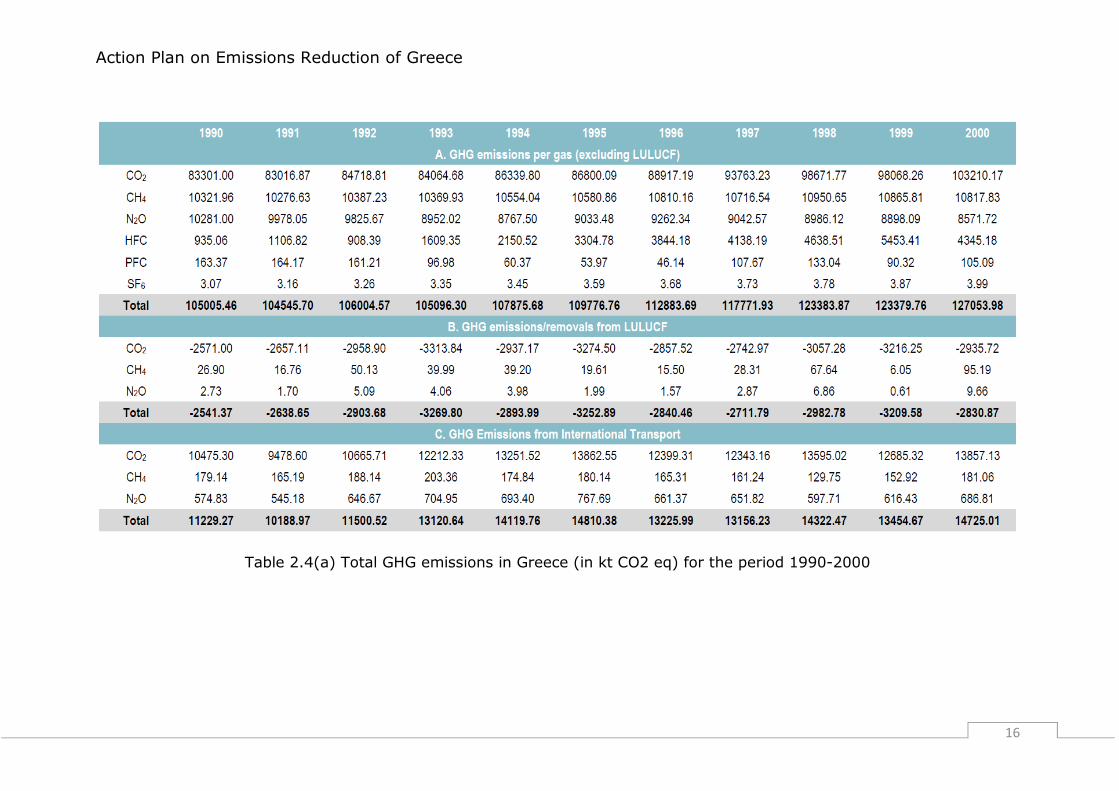
The GHG emissions trends (CO2, CH4, N2O, HFC, PFC and SF6) for the period 1990 - 2010 are presented in Table 2.4a & b (in kt CO2 eq). It is noted that according to the IPCC Guidelines, emissions estimates for international marine and aviation bunkers were not included in the national totals, but are reported separately as memo items. Base year GHG emissions for Greece (1990 for CO2, CH4, and Ν2Ο - 1995 for F-gases) were estimated at 107.23 Mt CO2 eq. Given that LULUCF was a net sink of GHG emissions in 1990 (and for the rest of the reporting period) the relevant emissions / removals are not considered in estimating base year emissions for Greece. In 2010, GHG emissions (without LULUCF) amounted to 118.29 Mt CO2 eq showing an increase of 10.27 % compared to base year emissions and of 12.65% compared to 1990 levels. If emissions / removals from LULUCF were to be included then the increase would be 10.43 % (from 102.46 Mt CO2 eq in 1990 to 115.64 Mt CO2 eq in 2010). Carbon dioxide emissions accounted for 82.40% of total GHG emissions in 2010 (without LULUCF) and increased by approximately 17.01% from 1990. Methane emissions accounted for 8.28% of total GHG emissions in 2010 and decreased by 5.1% from 1990, while nitrous oxide emissions accounted for 6.22 % of the total GHG emissions in 2010 and decreased by 28.44% from 1990. Finally, F-gases emissions that accounted for 3.1% of total GHG emissions in 2010, increased by 9.02% from 1995 (base year for F-gases).
Action Plan on Emissions Reduction of Greece
16
Table 2.4(a) Total GHG emissions in Greece (in kt CO2 eq) for the period 1990-2000

Action Plan on Emissions Reduction of Greece
17
Table 2.4(b) Total GHG emissions in Greece (in kt CO2 eq) for the period 2001-2010

Action Plan on Emissions Reduction of Greece
18
2.6. Transport
Internal aviation, road transportation, railways and internal navigation are included in the transport sector. Emissions from international marine and aviation bunkers are not included in national totals, but are calculated and reported separately as Memo items. In total, GHG emissions from transport (Table 2.5(a,b)) in 2010 increased by approximately 58% compared to 1990 emissions (from 14.77 Mt CO2 eq in 1990 to 23.33 Mt CO2 eq in 2010). The average annual rate of emissions increase from transport for the period 1990 – 2010 was approximately 3%, however, in 2008, an approximately 5% decrease of total emissions was observed compared to 2007 emissions. A more intense decrease (>10%) occurred in 2010 compared to 2009 emissions as a result of the economic recession. In 2010, the majority of GHG emissions derived from road transport, the contribution of which increased from 80% in 1990 to approximately 84% of total emissions of the sector, as a result of two contradictory parameters: a) the significant increase of the number of vehicles in the country and b) the considerable progress in antipollution technology of the vehicles engines. The share of internal navigation in the emissions of the transport sector fluctuated from 9-13% during the whole time period with almost 10% in 2009. Additionally, the contribution of internal aviation ranges from almost 5% in 1990 to 6% in 2010, while the contribution of railways decreased from 1.5% in 1990 to less than 0.3% in 2010. The contribution of other transport (pipeline transportation) is negligible. Finally, the aggregated contribution of transport in total National GHG emissions is 21%.

Action Plan on Emissions Reduction of Greece
19
Table 2.5(a) GHG emissions in the transportation sector per category for the period 1990 – 1999

Action Plan on Emissions Reduction of Greece
20
Table 2.5(b) GHG emissions in the transportation sector per category for the period 2000 – 2009

Action Plan on Emissions Reduction of Greece
21
2.7. Internal aviation GHG emissions from domestic aviation are calculated according to the Tier 2a methodology suggested by the IPCC Guidelines, which is based on the combination of energy consumption data and air traffic data (Landing and Take-off cycles, LTOs). The emission factors used and the distribution of consumption in LTOs and cruise are the suggested CORINAIR values (SNAP 080501 & 080503 – EEA 2001) for average fleet. The data on energy consumption derive from the national energy balance, while data on LTOs are provided by the Civil Aviation Authority. However, some inconsistencies were identified, as according to the Civil Aviation Authority the number of LTOs increased by 71% from 1990 to 2004 while energy consumption (as recorded in the national energy balance) for the same time period decreased by 15.6%. For this reason adjustments have been made to the energy consumption data of the whole time period. More specifically, during the in-country review of the initial report of Greece (Report FCCC/IRR/2007/GRC/28Dec2007), the ERT informed Greece of the potential problem of an overestimation in the base year for CO2, CH4 and N2O emissions from civil aviation. After the incountry review, Greece provided additional information on domestic LTOs and number of passengers travelling on domestic flights. The number of passengers, travelling on domestic flights, increased by 40 per cent over the period 1990-2004. The ERT identified that there is a potential overestimation of CO2, CH4 and N2O emissions from civil aviation in the base year and decided to calculate and apply an adjustment. To determine whether fuel consumption and consequently emissions of CO2, CH4 and N2O were overestimated in 1990 or underestimated in 2004, the ERT estimated fuel consumption for 2004 based on number of LTOs, and the average share (10.20 per cent) of LTO emissions in relation to total emissions from domestic flights (as provided in the Revised 1996 IPCC Guidelines). This approach depends mainly on the length of the domestic flight, which depends on the size of the country. As almost all domestic flights from Athens are in the range of 100-500 km, and flights from Greece to the Greek islands are relatively short, the share of LTOs in total flight fuel consumption would be expected to be closer to the upper part of the range or even higher than the range indicated in the Revised 1996 IPCC Guidelines. For example, the share of LTOs in total fuel consumption for domestic flights reported by Italy (with larger distances between major domestic hubs) was 25.4 per cent in 1990 and 25.0 per cent in 2004. Applying the upper part of the IPCC range (20 per cent) to reported fuel consumption in 2004 for Greece resulted in 383 kg of fuel per LTO. The ERT considered that this would be the expected amount of fuel consumption for Greece for fleets operating domestic routes. Furthermore the ERT compared Greece’s ratio, fuel consumption/domestic flight (0.085 TJ/flight), in 2004 with data from a cluster of comparable countries and concluded that Greece’s data were closely aligned with the cluster of countries selected (United Kingdom 0.08 TJ/flight, Italy 0.12 TJ/flight, Norway 0.05 TJ/flight). The ERT agreed that fuel consumption in

Action Plan on Emissions Reduction of Greece
22
2004 as reported in the NIR is a solid starting point for extrapolation back to 1990. The adjusted estimate for CO2, CH4 and N2O emissions from civil aviation in the base year amounts to 593.691 Gg CO2 eq., compared to the 1,469.238 Gg CO2 eq. reported by Greece in the 2006 GHG inventory submission. Since the discrepancies between the number of LTOs and the corresponding fuel consumption still persist, the above adjustment continues to be applied. GHG emissions from internal aviation increased by 82% since 1990 with an average annual increase rate of approximately 4% (Table 2.7(a,b)).
Table 2.6 Allocation of LTOs to domestic aviation for the period 1990-2010.
Table 2.7(a) GHG emissions (in kt CO2 eq) and energy consumption (in TJ) for the period 1990–1999
Total Domestic Air Traffic
Year Flights
Arr+Dep Passengers Freight (tonnes)
Arrivals Depart. Arrivals Depart.
1990 121070 4077892 3979100 28700 28707 1991 105306 3318846 3318712 27389 25396 1992 115898 3340391 3341487 27081 27081 1993 127499 3271677 3271813 27342 27342 1994 127565 3395661 3389672 29763 29765 1995 135252 3660572 3653970 30640 30683 1996 145115 4064377 4055412 28616 27540 1997 164879 4621880 4620680 27871 27675 1998 167701 4427465 4389715 21815 21675 1999 200527 5219042 5162982 19567 19685 2000 222962 6024624 6100445 22188 22004 2001 199529 5233269 5344853 20382 26427 2002 171441 4562874 4672378 17015 18801 2003 195948 4968967 5061410 19841 20480 2004 212216 5615088 5620146 15462 21968 2005 200672 5652345 5733562 16017 20144 2006 211854 6004154 6075932 17073 20516 2007 222848 6569217 6642967 17797 19841 2008 214364 6473941 6521907 17008 19720 2009 240126 6802618 6845291 14357 16141 2010 216203 6200867 6266594 13857 15847

Action Plan on Emissions Reduction of Greece
23
Table 2.7(b) GHG emissions (in kt CO2 eq) and energy consumption (in TJ) for the period 2000–2010
2.8. International bunker fuels
GHG emissions from international aviation and marine bunkers are calculated with the same methodologies as described for internal aviation and navigation. The allocation of fuel consumption between domestic and international transportation is based on the data of the national energy balance, as declared by oil trading companies. Finally, the allocation of LTOs between domestic and international aviation is based on data provided by the Hellenic Civil Aviation Authority (Table 2.7(a) & (b)). After ERT recommendation, revised emission estimates for CH4 and N2O emissions from liquid fuels in navigation, which are based on EFs from the Revised 1996 IPCC Guidelines are provided in this submission. GHG emissions from international bunkers (Table 2.8 a & b) increased by about 4% since 1990. The substantial decrease of 20% in 2010 international aviation emissions is associated with financial recession.
Table 2.8(a) GHG emissions in the transportation sector per category for the period 1990 – 1999
Table 2.8(b) GHG emissions in the transportation sector per category for the period 2000 – 2001
1) Emissions from international transport are not included in national emissions

Action Plan on Emissions Reduction of Greece
24
Table 2.9. Scheduled international aviation for the period 1990-2010.
Table 2.10. Non-scheduled international aviation for the period 1990-2010.
Scheduled International Total Air Traffic
Year Flights Passengers Freight (tonnes)
Arr+Dep Arrivals Depart. Arrivals Depart.
1990 55311 2593659 2685631 32722 29148 1991 48322 2006211 2161270 29581 25586 1992 58729 2534813 2609484 33609 27676 1993 62218 2785220 2845421 36971 29788 1994 62946 3013663 3058202 38346 31269 1995 64958 3179508 3214930 39156 31029 1996 63154 3013260 3048968 32480 24814 1997 81558 4079016 3989301 42154 33726 1998 72783 3427697 3405221 35373 29102 1999 81147 3513706 3569003 35433 27350 2000 89210 4045504 4235394 36229 32882 2001 90120 4150600 4320101 34550 25475 2002 91247 4393370 4393393 34005 25300 2003 91232 4449892 4374846 52834 28952 2004 103872 4852866 4857876 56355 30763 2005 98251 5156615 5180225 55969 30963 2006 104132 5508381 5537776 57463 33179 2007 113508 6007499 6093985 55129 34846 2008 110736 6120008 6164710 56750 35536 2009 112747 5904531 5965433 47372 31437 2010 107721 5940503 5985947 43100 30702
Non-scheduled International Total Air Traffic
Year Flights Passengers Freight (tonnes)
Arr+Dep Arrivals Depart. Arrivals Depart.
1990 68295 4408677 4402368 2006 722 1991 69752 4402324 4380442 2500 922 1992 84477 5544759 5490660 2484 338 1993 87180 5743571 5734596 3117 888 1994 98028 6730408 6726518 3825 1310 1995 92155 6184894 6195371 5367 3172 1996 82836 5896436 5750536 5119 3676 1997 86054 5575128 5184830 23252 3871 1998 102930 6669147 6136970 22223 5037 1999 114950 7725796 7614206 27677 5517 2000 115137 7847818 7978099 25320 4720 2001 106543 8216819 8292869 26500 3200 2002 97594 7690181 7765973 26505 3875 2003 108593 7552936 7617175 3105 1301 2004 103763 7121727 7172088 4429 2253 2005 104240 7321137 7402952 1401 880 2006 113433 7747214 7840055 876 968 2007 118843 7953122 8047589 1615 802 2008 115814 7751606 7804747 2413 1590 2009 104833 7038956 7088657 1410 4510 2010 104939 6941977 6967685 655 469

Action Plan on Emissions Reduction of Greece
25
Airport Name
JANUARY - DECEMBER 2011
COMMERCIAL TRAFFIC GENERAL TOTAL FLIGHTS DOMESTIC TOTAL INTERNATIONAL
FLIGHTS PASSENGERS FLIGHTS ΕΠΙΒΑΤΕΣ 2011 2010
ARR+DEP ARRI. DEP. ARR+DEP ARR. DEP. ARR+DEP ARR+DEP
ARAXOS 36 485 332 766 37583 37097 802 914
AKTIO 871 2453 2438 1857 144058 145207 2728 2758
ALEX/POLIS 3518 116642 119532 24 1173 918 3542 3958
ASTYPALAIA 743 6508 6841 1 0 1 744 740
N.ANCHIALOS 119 906 1014 899 45514 45140 1018 568
ZAKYNTHOS 1219 11886 13305 5703 447885 447625 6922 6782
IRAKLEION 14971 447279 473357 29549 2161577 2164794 44520 42396
THESSALONIKI 20585 712390 775582 22845 1251433 1219070 43430 44938
IKARIA 1546 18291 19243 0 0 0 1546 964
IOANNINA 1605 44016 44255 15 150 176 1620 2190
KAVALA 2244 45742 47529 1374 79651 79385 3618 4506
KALAMATA 936 13905 14094 716 35502 35950 1652 1776
KALYMNOS 920 11376 12873 0 0 0 920 854
KARPATHOS 2659 29222 30210 969 60668 60984 3628 3382
KASOS 1038 2249 2617 0 0 0 1038 1034
KASTELORIZO 486 4555 4168 0 0 0 486 452
KASTORIA 592 2294 2955 0 0 0 592 310
KERKYRA 4280 128746 135592 11022 789546 790289 15302 14636
KEFALLINIA 1767 22753 25556 2025 148858 149230 3792 4144
KOZANH 408 1622 1991 0 0 0 408 202
KYTHIRA 643 11953 12953 63 1202 1283 706 692
KOS 4607 107819 113102 12125 851489 853813 16732 14872
LEROS 1470 14096 16804 2 0 6 1472 1428
LIMNOS 3193 39364 40802 181 6248 6538 3374 3794
MILOS 1286 16822 13529 0 0 0 1286 1350
MYKONOS 3600 106295 117830 2318 130974 127710 5918 6142
MYTILINI 5782 169003 175577 974 62008 62792 6756 7992
NAXOS 873 11562 12913 37 711 597 910 800
PAROS 1914 22205 14066 0 0 0 1914 1800
RODOS 11394 332505 343958 23268 1734418 1737505 34662 31558
SAMOS 3495 83834 88838 1853 118274 117774 5348 6314
SANTORINI 4612 173496 203977 3390 202139 205935 8002 7914
SITEIA 1786 19029 20575 0 0 0 1786 1806
SKIATHOS 653 10095 10378 1719 113125 113060 2372 2472
SKYROS 538 2045 2435 2 4 4 540 524
SYROS 568 4183 5674 6 5 10 574 680
CHANIA 5591 217817 231394 8325 656791 668706 13916 13852
CHIOS 3701 99593 110068 259 9885 9954 3960 5510
ATHENS 73124 2499717 2364458 88567 4667223 4794107 161691 181859
TOTAL 189373 5564753 5632815 220854 13758094 13875660 410227 428863
Table 2.11 Allocation of LTOs to domestic and international aviation per airport for the period January to December 2011.

Action Plan on Emissions Reduction of Greece
26
# Operator / Organization OPS1 AOC
OPS3 AOC
Part-145 Part-MG Part-147 Part-MF Part-21G
1 1 Source EL.145.0043
2 3D EL.145.0057 EL.MG.0042
3 Aegean Airlines GR-007 EL.145.0008 EL.MG.0004
4 Aeolian Airlines GR-043 EL.145.0068 EL.MG.0048
5 Aerocandia Aviation Services EL.145.0060
6 Aeroland GR-022 EL.MG.0011
7 Aeroservices EL.145.0035 EL.MG.0023
9 Air1 EL.MG.0050
10 Air Business International EL.MG.0047
11 Air Cbs EL.MG.0003
12 Air Intersalonika GR-016 EL.MG.0018
13 Air Lift GR-017 EL.145.0031 EL.MG.0008
14 Amjet Executive GR-044 EL.145.0063 EL.MG.0044
15 Apella EL.145.0032
16 Astra Airlines GR-028 EL.145.0053 EL.MG.0027
17 Athena Airlift EL.MG.0025
18 Athens Aeroservices EL.145.0069
19 Athens Helicopters EL.145.0066 EL.MG.0049
20 Aviator GR-009 EL.145.0018 EL.MG.0001
21 Balkan Aircarft Maintenance
Center EL.MG.0045 EL.MF.0001
22 Blue Bird Airways GR-034 EL.145.0050 EL.MG.0029
23 Blue Bird Techniques EL.MG.0041
24 Cosmos Aeroservices EL.145.0067
25 Dedalus Aviation Services EL.MG.0037 EL.MF.0003
26 Didavia
27 Egnatia Aviation EL.MF.0002
28 Epsilon Aviation GR-010 EL.145.0011 EL.MG.0007
29 Fas Rhodos Pilots Academy GR-032 EL.145.0052 EL.MG.0031
30 First Airways EL.MG.0033
31 Flight Simulator Centre Ltd
32 Flyway Maintenance Services EL.145.0048
33 Gain Jet GR-024 EL.145.0044 EL.MG.0020
34 Global Air Services SA EL.MG.0039 EL.MF.0004
35 Greek Air Aviation Services SA EL.145.0038 EL.MG.0038
36 Greek Airman
37 Hellenic Aerospace Industry EL.145.0003 EL.147.0002 EL.21G.0001
38 Hellenic Airline Maintenance Engineering Training
EL.147.0008
39 Head Start Aviation Systems EL.145.0064 EL.MG.0036
40 Hellenic Aviation Training
Academy EL.147.0007
41 Hellenic Imperial Airways GR-025 EL.145.0046 EL.MG.0022
42 Hermes Airlines GR-038 EL.MG.0051
43 ICSS S.A. EL.145.0047 EL.MG.0035
44 I-FLY Aviation Services GR-046 EL.MG.0053
45 Interisland Airways EL.MG.0054 EL.MF.0005
46 Interjet Airplanes GR-012 EL.145.0012 EL.MG.0014 EL.147.0003
47 Interjet Helicopters GR-018 EL.MG.0015
48 Jet Stream
49 K2 Smart Jets GR-026 EL.MG.0024
50 Life Line Aviation GR-027 EL.145.0045 EL.MG.0026
51 Meelad Air EL.MG.0046
52 Minoan Air GR-030 EL.MG.0052
53 Olympic Air GR-030 EL.145.0055 EL.MG.0030
54 Olympic Airlines EL.MG.0010
55 Olympic Engineering EL.145.0058 EL.147.0006
56 Premier Aviation Services GR-033 EL.145.0054 EL.MG.0040
57 Sky Express GR-021 EL.145.0041 EL.MG.0002
58 Sky Wings GR-023 EL.145.0049 EL.MG.0019
59 Skyline Avionics EL.145.0061
60 Superior Air GR-040 EL.145.0051 EL.MG.0034
61 Swift Air Hellas GR-004 EL.145.0042 EL.MG.0006
Total 22 4 34 44 5 5 1
Suspended or Expired
Table 2.12. List of Greek Operators / Organizations

Action Plan on Emissions Reduction of Greece
27
SECTION I
Supra-national measures,
including those led by the EU

Action Plan on Emissions Reduction of Greece
28
1. Aircraft Related Technology Development
Aircraft emissions standards European states fully support the ongoing work in ICAO’s Committee on Aviation Environmental Protection (CAEP) to develop an aircraft CO2 standard. Assembly Resolution A37-19 requests the Council to develop a global CO2 standard for aircraft aiming for 2013. It is recognized that this is an ambitious timeframe for the development of a completely new ICAO standard. Europe is contributing to this task notably through the European Aviation Safety Agency providing the co-rapporteurship of the CO2 task group within CAEP’s Working Group 3. In the event that a standard, comprising certification requirement and regulatory level, is adopted in 2013, it is likely to have an applicability date set some years in the future. The contribution that such a standard will make towards the global aspirational goals will of course depend on the regulatory level that is set, but it seems unlikely that an aircraft CO2 standard could have any significant effect on the fuel efficiency of the global in-service fleet until well after 2020. Research and development
Clean Sky is an EU Joint Technology Initiative (JTI) that aims to develop and mature breakthrough “clean technologies” for air transport. By accelerating their deployment, the JTI will contribute to Europe’s strategic environmental and social priorities, and simultaneously promote competitiveness and sustainable economic growth. Joint Technology Initiatives are specific large scale EU research projects created by the European Commission within the 7th Framework Programme (FP7) in order to allow the achievement of ambitious and complex research goals. Set up as a Public Private Partnership between the European Commission and the European aeronautical industry, Clean Sky will pull together the research and technology resources of the European Union in a coherent, 7-year, €1.6bn programme, and contribute significantly to the ’greening’ of aviation. The Clean Sky goal is to identify, develop and validate the key technologies necessary to achieve major steps towards the Advisory Council for Aeronautics Research in Europe (ACARE) environmental goals for 2020 when compared to 2000 levels:
• Fuel consumption and carbon dioxide (CO2) emissions reduced by 50%
• Nitrous oxides (NOX) emissions reduced by 80% • Perceived external noise reduction of 50% • Improved environmental impact of the lifecycle of aircraft and
related products. Three complementary instruments are used by Clean Sky in meeting these goals:

Action Plan on Emissions Reduction of Greece
29
Technologies. These are selected, developed and monitored in terms of maturity, or “technology readiness level” (TRL). A detailed list of more than one hundred key technologies has been set. The technologies developed by Clean Sky will cover all major segments of commercial aircraft. Concept Aircraft. These are design studies dedicated to integrating technologies into a viable conceptual configuration, and assessing their potential and relevance. They cover a broad range of aircraft: business jets, regional and large commercial aircraft, as well as rotorcraft. They have been grouped and categorised in order to represent the major future aircraft families. Clean Sky’s environmental results will be measured and reported upon principally by Concept Aircraft. Demonstration Programmes. Some technologies can be assessed during their development phase, but many key technologies need to be validated at an integrated vehicle or system level via dedicated demonstrators. These demonstrators pull together several technologies at a larger “system” or aircraft level. Airframe, Engine and Systems technologies are monitored through in-flight or large scale ground demonstrations. The aim is to validate the feasibility of these technologies in relevant (in-flight or operating) conditions. Their performance can then be predicted in areas such as mechanical or in-flight behaviour. This in turn will help determine the true potential of the technologies and enable a realistic environmental assessment. Demonstrations enable technologies to reach a higher level of maturity (or TRL: technology readiness level), which is the “raison d’être” of Clean Sky. The environmental objectives of the programme are determined by evaluating the performance of concept aircraft in the global air transport system (when compared to 2000 level technology and to a "business as usual" evolution of technology). The ranges of environmental improvements result from the sum of technologies which are expected to reach TRL5-6 within the programme timeframe. While not all of these technologies will be developed directly through the Clean Sky programme, it is neither feasible nor relevant at this stage to isolate the benefits derived purely from Clean Sky technologies, as Clean Sky will achieve a significant synergy effect in European Aeronautics Research by maturing closely linked technologies to a materially higher TRL through demonstration and integration. Clean Sky activities are performed within six “Integrated Technology
Demonstrators” (ITDs) and a “Technology Evaluator”.
The three vehicle-based ITDs will develop, deliver and integrate
technologies into concrete aircraft configurations. The two “transversal”

Action Plan on Emissions Reduction of Greece
30
ITDs are focused on propulsion and systems, and will deliver technologies,
which will be integrated in various aircraft configurations by the vehicle
ITDs. A further ITD will focus specifically on the life cycle assessment and
'eco-design' philosophy.
Smart Fixed Wing Aircraft (SFWA) – co-led by Airbus and SAAB - will
deliver innovative wing technologies together with new aircraft
configurations, covering large aircraft and business jets. Key enabling
technologies from the transversal ITDs, for instance Contra Rotating Open
Rotor, will be integrated into the demonstration programmes and concept
aircraft.
Green Regional Aircraft (GRA) – co-led by Alenia and EADS CASA - will
develop new technologies for the reduction of noise and emissions, in
particular advanced low-weight & high performance structures,
incorporation of all-electric systems, bleed-less engine architecture, low
noise/high efficiency aerodynamics, and finally environmentally optimised
mission and trajectory management.
Green Rotorcraft (GRC) – co-led by Agusta Westland and Eurocopter -
will deliver innovative rotor blade technologies for reduction in rotor noise
and power consumption, technologies for lower airframe drag,
environmentally friendly flight paths, the integration of diesel engine
technology, and advanced electrical systems for elimination of hydraulic
fluids and for improved fuel consumption.
Sustainable and Green Engines (SAGE) - co-led by Rolls-Royce and
Safran - will design and build five engine demonstrators to integrate
technologies for low fuel consumption, whilst reducing noise levels and
nitrous oxides. The ‘Open Rotor’ is the target of two demonstrators. The
others address geared turbofan technology, low pressure stages of a
three-shaft engine and a new turboshaft engine for helicopters.
Systems for Green Operations (SGO) - co-led by Liebherr and Thales -
will focus on all electrical aircraft equipment and system architectures,
thermal management, capabilities for environmentally-friendly trajectories
and missions, and improved ground operations to give any aircraft the
capability to fully exploit the benefits of the “Single European Sky”.
Eco-Design - co-led by Dassault and Fraunhofer Gesellschaft - will
support the ITDs with environmental impact analysis of the product life-
cycle. Eco-Design will focus on environmentally-friendly design and
production, withdrawal, and recycling of aircraft, by optimal use of raw
materials and energies, thus improving the environmental impact of the
entire aircraft life-cycle.

Action Plan on Emissions Reduction of Greece
31
Complementing these six ITDs, the Technology Evaluator (TE) is a
dedicated evaluation platform cross-positioned within the Clean Sky
project structure. The TE is co-led by DLR and Thales, and includes the
major European aeronautical research organisations. It will assess the
environmental impact of the technologies developed by the ITDs and
integrated into the Concept Aircraft. By doing this, the TE will enable
Clean Sky to measure and report the level of success in achieving the
environmental objectives, and in contributing towards the ACARE
environmental goals. Besides a mission level analysis (aircraft level), the
positive impact of the Clean Sky technologies will be shown at a relevant
hub airport environment and across the global air transport system.
The first assessment by the Technology Evaluator on the way to meeting
Clean Sky's environmental objectives is planned for the end of 2011. The
ranges of potential performance improvement (reduction in CO2, NOX and
Noise) will be narrowed or evolved during the life of the programme based
on the results from the key technologies developed and validated through
the demonstrations performed.
Clean Sky is a ‘living’ programme: each year, Annual Implementation
Plans are produced and agreed, and research priorities are (re-)calibrated
based on results achieved. The best approach to progressing the
technologies is pursued. The Clean Sky JU uses regular Calls for Proposals
to engage with the wider aeronautical industry, research organisations
and universities in order to bring the best talent on board and enable
broad collaborative participation. A very significant share of the Clean Sky
research programme is already being taken on by Europe’s aerospace
related SMEs, and by September 2011 nine Calls for Proposals will have
been completed, demonstrating the JU's commitment to involving all
competent organisations in the European aeronautics research arena. In
June 2011, a major and exciting milestone was reached with the 400th
partner joining the Clean Sky programme.

Action Plan on Emissions Reduction of Greece
32
2. Alternative Fuels
European Advanced Biofuels Flightpath
In February 2009, the European Commission's Directorate General for
Energy and Transport initiated the SWAFEA (Sustainable Ways for
Alternative Fuels and Energy for Aviation) study to investigate the
feasibility and the impact of the use of alternative fuels in aviation. The
goal was to provide the European Commission with information and
decision elements to support its future air transport policy, in the
framework of the European commitment to promote renewable energy for
the mitigation of climate change, security of supply and also to contribute
to Europe's competitiveness and economic growth.
The study team involved 20 European and international organisations,
representing all players in alternative aviation fuels: aircraft and engine
manufacturing, air transport, oil industry, research and consulting
organisations covering a large spectrum of expertise in the fields of fuel,
combustion, environment as well as agriculture.
The SWAFEA final report was published in July 20113. It provides a
comprehensive analysis on the prospects for alternative fuels in aviation,
including an integrated analysis of technical feasibility, environmental
sustainability (based on the sustainability criteria of the EU Directive on
renewable energy4) and economic aspects. It includes a number of
recommendations on the steps that should be taken to promote the take-
up of sustainable biofuels for aviation in Europe.
In March 2011, the European Commission published a White Paper on
transport5. In the context of an overall goal of achieving a reduction of at
least 60% in greenhouse gas emissions from transport by 2050 with
respect to 1990, the White Paper established a goal of low-carbon
sustainable fuels in aviation reaching 40% by 2050.
As a first step towards delivering this goal, in June the European
Commission, in close coordination with Airbus, leading European airlines
(Lufthansa, Air France/KLM, & British Airways) and key European biofuel
producers (Choren Industries, Neste Oil, Biomass Technology Group and
UOP), launched the European Advanced Biofuels Flightpath. This
industry-wide initiative aims to speed up the commercialisation of aviation
3 http://www.swafea.eu/LinkClick.aspx?fileticket=llISmYPFNxY%3D&tabid=38
4 Directive 2009/28/EC of the European Parliament and of the Council of 23 April 2009 on the promotion of the use of energy from renewable sources and amending and subsequently repealing Directives 2001/77/EC and 2003/30/EC
5 Roadmap to a Single European Transport Area – Towards a competitive and resource efficient transport system, COM(2011) 144 final

Action Plan on Emissions Reduction of Greece
33
biofuels in Europe, with the objective of achieving the commercialisation
of sustainably produced paraffinic biofuels in the aviation sector by
reaching a 2 million tons consumption by 2020.
This initiative is a shared and voluntary commitment by its members to
support and promote the production, storage and distribution of
sustainably produced drop-in biofuels for use in aviation. It also targets
establishing appropriate financial mechanisms to support the construction
of industrial "first of a kind" advanced biofuel production plants. The
Biofuels Flight path is explained in a technical paper, which sets out in
more detail the challenges and required actions6.
More specifically, the initiative focuses on the following:
1. Facilitate the development of standards for drop-in biofuels and their certification for use in commercial aircraft;
2. Work together with the full supply chain to further develop worldwide accepted sustainability certification frameworks
3. Agree on biofuel take-off arrangements over a defined period of time and at a reasonable cost;
4. Promote appropriate public and private actions to ensure the market uptake of paraffinic biofuels by the aviation sector;
5. Establish financing structures to facilitate the realisation of 2G biofuel projects;
6. Accelerate targeted research and innovation for advanced biofuel technologies, and especially algae.
Take concrete actions to inform the European citizen of the benefits of
replacing kerosene by certified sustainable biofuels.
The following “Flight Path” provides an overview about the objectives,
tasks, and milestones of the initiative.
6 http://ec.europa.eu/energy/technology/initiatives/doc/20110622_biofuels_flight_path_technical_paper.pdf

Action Plan on Emissions Reduction of Greece
34
Time
horizo
ns
Action Aim/Result
Short-
term
(next 0-3
years)
Announcement of action at International
Paris Air Show
To mobilise all stakeholders including
Member States.
High level workshop with financial
institutions to address funding mechanisms.
To agree on a "Biofuel in Aviation Fund".
> 1,000 tons of Fisher-Tropsch biofuel
become available.
Verification of Fisher-Tropsch product quality.
Significant volumes of synthetic biofuel
become available for flight testing.
Production of aviation class biofuels in the
hydrotreated vegetable oil (HVO) plants from
sustainable feedstock
Regular testing and eventually few regular
flights with HVO biofuels from sustainable
feedstock.
Secure public and private financial and
legislative mechanisms for industrial second
generation biofuel plants.
To provide the financial means for investing
in first of a kind plants and to permit use of
aviation biofuel at economically acceptable
conditions.
Biofuel purchase agreement signed between
aviation sector and biofuel producers.
To ensure a market for aviation biofuel
production and facilitate investment in
industrial 2G plants.
Start construction of the first series of 2G
plants.
Plants are operational by 2015-16.
Identification of refineries & blenders which
will take part in the first phase of the action.
Mobilise fuel suppliers and logistics along the
supply chain.
Mid
-term
(4-7
years)
2000 tons of algal oils are becoming
available.
First quantities of algal oils are used to
produce aviation fuels.
Supply of 1.0 M tons of hydrotreated
sustainable oils and 0.2 tons of synthetic
aviation biofuels in the aviation market.
1.2 M tons of biofuels are blended with
kerosene.
Start construction of the second series of 2G
plants including algal biofuels and pyrolytic
oils from residues.
Operational by 2020.
Long-t
erm
(up to 2
020)
Supply of an additional 0.8 M tons of aviation
biofuels based on synthetic biofuels, pyrolytic
oils and algal biofuels.
2.0 M tons of biofuels are blended with
kerosene.
Further supply of biofuels for aviation,
biofuels are used in most EU airports.
Commercialisation of aviation biofuels is
achieved.

Action Plan on Emissions Reduction of Greece
35
3. Improved Air Traffic Management and Infrastructure Use
The EU’s Single European Sky initiative and SESAR
The EU’s Single European Sky initiative was originally launched by the
European Commission in 1999. Its fundamental aim is to reform the
architecture of European air traffic control to meet future capacity and
safety needs. Its main principles are to reduce fragmentation in European
air traffic management, between states, between civil and military, and
between systems; to introduce new technology; and to establish a new
regulatory framework built on closer synergy between the EU and
Eurocontrol.
The first package of EU Single European Sky legislation was adopted by
the Council and European Parliament in 2004. This was followed in 2009
by the Single European Sky II package of measures, which comprises five
main pillars: performance, safety, technology, airport capacity and the
human factor. The aim is to improve the performance of air navigation
services by reducing the cost of flights, while improving the capacity and
better preserving the environment, all having regard to the overriding
safety objectives.
Reducing fragmentation in European air traffic management is expected to
result in significant efficiency and environmental improvements. A core
starting point is the reduction of the current surplus length of flights in
Europe, estimated on average to be almost 50 km. The defragmentation
of European airspace with new possibilities for more direct routing, and
efforts to define a true pan European network of routes and to implement
flexible use of airspace are expected to result in emission reductions of
2% per year.
SESAR
SESAR (Single European Sky ATM Research) is the technological
component of the Single European Sky (SES). It is a €2.1bn Joint
Undertaking, funded equally by the EU, Eurocontrol and industry (€700m
EU, €700m Eurocontrol, €700m industry). Fifteen companies are members
of the SESAR JU: AENA, Airbus, Alenia Aeronautica, the DFS, the DSNA,
ENAV, Frequentis, Honeywell, INDRA, NATMIG, NATS (En Route) Limited,
NORACON, SEAC, SELEX Sistemi Integrati and Thales. The SESAR SJU
includes an additional thirteen associate partners including non-European
companies with different profiles and expertise.
SESAR aims to help create a "paradigm shift" by putting performance-
based operations at the core of air traffic management’s objectives, and
will be supported by state-of-the-art and innovative technology capable of

Action Plan on Emissions Reduction of Greece
36
ensuring the safety, sustainability and fluidity of air transport worldwide
over the next 30 years. It is composed of three phases:
• The Definition phase (2004-2008) delivered the ATM master plan defining the content, the development and deployment plans of the next generation of ATM systems. This definition phase was led by Eurocontrol, and co-funded by the European Commission under the Trans European Network-Transport programme and executed by a large consortium of all air transport stakeholders.
• The Development phase (2008-2013) will produce the required new generation of technological systems, components and operational procedures as defined in the SESAR ATM Master Plan and Work Programme.
• The Deployment phase (2014-2020) will see the large scale production and implementation of the new air traffic management infrastructure, composed of fully harmonised and interoperable components guaranteeing high performance air transport activities in Europe.
Implementation of SESAR in general will facilitate the following:
• Moving from airspace to trajectory based operations, so that each aircraft achieves its agreed route and time of arrival and air and ground systems share a common system view.
• Collaborative planning so that all parties involved in flight management from departure gate to arrival gate can strategically and tactically plan their business activities based on the performance the system will deliver.
• An information rich ATM environment where partners share information through system wide information management.
• A globally agreed 4D trajectory definition and exchange format at the core of the ATM system where time is the 4th dimension providing a synchronised “time” reference for all partners.
• Airspace users and aircraft fully integrated as essential constituents and nodes of the ATM system.
• Dynamic airspace management and integrated co-ordination between civil and military authorities optimising the available airspace.
• Network planning focused on the arrival time as opposed to today’s departure based system with Airport airside and turn-around fully integrated into ATM.
• New Communication, Navigation & Surveillance (CNS) technologies providing for more accurate airborne navigation and spacing between aircraft to maximise airspace and airport efficiency, improve communication and surveillance.
• Central role for the human widely supported by automation and advanced tools ensuring safe working without undue pressure.

Action Plan on Emissions Reduction of Greece
37
Within the SESAR programme most of the almost 300 projects include
environmental aspects of aviation. They concern aircraft noise
management and mitigation, aircraft fuel use and emissions management
etc. throughout all of SESAR’s 16 work packages. The Joint Undertaking’s
role is to establish environmental sustainability as an integral aspect of
broader ATM development and operating processes.
SESAR aims at reducing the environmental impact per flight by 10%
without compromising on safety but with clear capacity and cost efficiency
targets in mind. More specifically, in addressing environmental issues,
SESAR will:
1. Achieve emission improvements through the optimisation of air traffic
management services. The SESAR target for 2020 is to enable 10%
fuel savings per flight as a result of ATM improvements alone, leading
to a 10% reduction of CO2 emissions per flight;
2. Improve the management of noise emissions and their impacts
through better flight paths, or optimised climb and descent solutions;
3. Improve the role of ATM in enforcing local environmental rules by
ensuring that flight operations fully comply with aircraft type
restrictions, night movement bans, noise routes, noise quotas, etc.;
4. Improve the role of ATM in developing environmental rules by
assessing the ecological impact of ATM constraints, and, following this
assessment, adopting the best alternative solutions from a European
sustainability perspective.
5. Accompany the development of new procedures and targets with an
effective regulatory framework in close cooperation with the European
Commission;
6. Implement more effective two-way community relations and
communications capabilities at local and regional levels including a
commonly agreed environmental strategy and vision.
By 2012 SESAR is expected to deliver fuel burn reductions of
approximately 2% (compared with a baseline 2010), to demonstrate
environmental benefits on city pairs connecting 8 European airports, and
to have airspace users signing up to the SESAR business case (including
the environment case) for time-based operations.
Operational improvements: AIRE
The Atlantic Interoperability Initiative to Reduce Emissions (AIRE) is a
programme designed to improve energy efficiency and lower engine
emissions and aircraft noise in cooperation with the US FAA. The SESAR
JU is responsible for its management from a European perspective.

Action Plan on Emissions Reduction of Greece
38
Under this initiative ATM stakeholders work collaboratively to perform
integrated flight trials and demonstrations validating solutions for the
reduction of CO2 emissions for surface, terminal and oceanic operations to
substantially accelerate the pace of change.
AIRE has demonstrated in 2009, with 1,152 trials performed, that
significant savings can be achieved using existing technology. CO2 savings
per flight ranged from 90kg to 1250kg and the accumulated savings
during trials were equivalent to 400 tons of CO2. Another positive aspect
is the human dimension - the AIRE projects boost crew and controller
motivation to pioneer new ways of working together focusing on
environmental aspects, and enabled cooperative decision-making towards
a common goal.
The strategy is to produce constant step-based improvements, to be
implemented by each partner in order to contribute to reaching the
common objective. In 2010 demand for projects has more than doubled
and a high transition rate from R&D to day-to-day operations, estimated
at 80%, from AIRE 2009 projects was observed (expected to further
increase with time). Everyone sees the “AIRE way of working together” as
an absolute win-win to implement change before the implementation of
more technology intensive ATM advancements expected for the period
2013 onward. A concrete example of the progress achieved is that, due to
AIRE, both FAA and NAV Portugal offer lateral optimisation over the
transatlantic routes to any user upon request. In July 2010, the SESAR JU
launched a new call for tender and had an excellent response - 18
projects were selected involving 40 airlines, airport, air navigation service
providers and industry partners. More than 5,000 trials are expected to
take place.
4. Economic / Market-based Measures
The EU Emissions Trading System
The EU Emissions Trading System (EU ETS) is a cornerstone of the
European Union's policy to combat climate change and its key tool for
reducing industrial greenhouse gas emissions cost-effectively. Being the
first and biggest international scheme for the trading of greenhouse gas
emission allowances, the EU ETS currently covers some 11,000 power
stations and industrial plants in 30 countries.
Launched in 2005, the EU ETS works on the "cap and trade" principle. This
means there is a "cap", or limit, on the total amount of certain
greenhouse gases that can be emitted by the factories, power plants and
other installations in the system. Within this cap, companies receive

Action Plan on Emissions Reduction of Greece
39
emission allowances which they can sell to or buy from one another as
needed. The limit on the total number of allowances available provides
certainty that the environmental objective is achieved and ensures that
the allowances have a market value.
At the end of each year each company must surrender enough allowances
to cover all its emissions, otherwise heavy fines are imposed. If a
company reduces its emissions, it can keep the spare allowances to cover
its future needs or else sell them to another company that is short of
allowances. The flexibility that trading brings ensures that emissions are
cut where it costs least to do so. The number of allowances is reduced
over time so that total emissions fall.
The EU ETS now operates in 30 countries (the 27 EU Member States plus
Iceland, Liechtenstein and Norway). It currently covers CO2 emissions
from installations such as power stations, combustion plants, oil refineries
and iron and steel works, as well as factories making cement, glass, lime,
bricks, ceramics, pulp, paper and board. Between them, the installations
currently in the scheme account for almost half of the EU's CO2 emissions
and 40% of its total greenhouse gas emissions.
The EU ETS will be further expanded to the petrochemicals, ammonia and
aluminium industries and to additional gases (PFCs and N2O) in 2013,
when the third trading period starts. At the same time a series of
important changes to the way the EU ETS works will take effect in order to
strengthen the system.
The legislation to include aviation in the EU ETS was adopted in November
2008, and entered into force as Directive 2008/101/EC of the European
Parliament and of the Council on 2 February 2009. The proposal to
include aviation in the EU ETS, made by the European Commission in
December 2006, was accompanied by a detailed impact assessment.
Under the EU ETS, the emissions cap is increased to accommodate the
inclusion of aviation. This addition to the cap establishes the total
quantity of allowances to be allocated to aircraft operators. This quantity
is defined as a percentage of historical aviation emissions, which is
defined as the mean average of the annual emissions in the calendar
years 2004, 2005 and 2006 from aircraft performing an aviation activity
falling within the scope of the legislation. In July 2011, it was decided
that the historical aviation emissions are set at 221,420,279 tonnes of
CO2.
The additional cap to be added to the EU ETS in 2012, the first year of
operation for aviation, will be set at 97% of the historical aviation
emissions. For the period from 2013 to 2020 inclusive the additional cap
will be set at 95% of the historical aviation emissions.

Action Plan on Emissions Reduction of Greece
40
Aircraft operators flying to and from airports in 30 European states from
2012 will be required to surrender allowances in respect of their CO2
emissions on an annual basis. The large majority of allowances will be
allocated to individual aircraft operators free of charge, based on their
respective aviation output (rather than emissions) in 2010, thus rewarding
operators that have already invested in cleaner aircraft. In 2012, 85% of
the total quantity of the additional allowances (or “cap”) will be allocated
free of charge according to this benchmarking methodology, while in the
2013-2020 trading period 82% of the additional allowances will be
allocated free of charge in this way. In the 2013-2020 trading period, an
additional 3% of the total additional allowances for aviation will be set
aside for allocation free of charge via the special reserve, to new entrants
and fast-growing airlines. The remaining 15% of allowances will be
allocated each year by auction.
Aircraft operators that choose to emit more than their free allocation of
allowances will be able to source allowances from other participants in the
ETS (including those outside the aviation sector), from intermediaries who
trade allowances, from Member States via auctions, or they can use
specific quantities of international credits from emissions reduction
projects in third countries (e.g. CDM credits and ERUs).
The system also includes a de minimis provision under which commercial
aircraft operators with a low level of aviation activity in Europe are
excluded from its scope. This is likely to mean that many aircraft
operators from developing countries will be unaffected by the scheme
and, indeed, over 90 ICAO states have no commercial aircraft operators
included in the scope of the EU ETS.
The EU legislation foresees that, where a third country takes measures of
its own to reduce the climate change impact of flights departing from its
airports, the EU will consider options available in order to provide for
optimal interaction between the EU scheme and that country’s measures.
In such a case, flights arriving from the third country could be excluded
from the scope of the EU scheme. The EU therefore encourages other
countries to adopt measures of their own and is ready to engage in
bilateral discussions with any country that has done so.
The legislation also makes it clear that if there is agreement on global
measures, the EU shall consider whether amendments to this Directive as
it applies to aircraft operators are necessary.
Anticipated change in fuel consumption and/or CO2 emissions
The environmental outcome of an emissions trading system is pre-
determined through the setting of an emissions cap. In the case of the EU
ETS, an addition to the overall cap is established for aviation emissions.

Action Plan on Emissions Reduction of Greece
41
However, aircraft operators are also able to use allowances allocated to
other sectors to cover their emissions. It is therefore possible (indeed
highly likely given traffic growth forecasts) that the absolute level of CO2
emissions from aviation will exceed the number of allowances allocated to
aviation. However, any aviation emissions will necessarily be offset by
CO2 emissions reductions elsewhere, either in other sectors within the EU
that are subject to the EU ETS, or through emissions reduction projects in
third countries. The “net” aviation emissions will however be the same as
the number of allowances allocated to aviation under the EU ETS.
In terms of contribution towards the ICAO global goals, the states
implementing the EU ETS will together deliver, in “net” terms, a 3%
reduction below the 2005 level of aviation CO2 emissions in 2012, and a
5% reduction below the 2005 level of aviation CO2 emissions in the period
2013-2020.
Other emissions reduction measures taken, either at supra-national level
in Europe or, by any of the 30 individual states implementing the EU ETS,
will of course make their own contribution towards the ICAO global goals.
Such measures are likely to moderate the anticipated growth in aviation
emissions in Europe and therefore reduce the extent to which the absolute
level of CO2 emissions from aviation will exceed the number of allowances
allocated to aviation. However, assuming that absolute aviation emissions
will nonetheless in future exceed the additional aviation cap, the
aggregate contribution towards the global goals is likely to remain that
which is determined by the EU ETS cap.
Expected co-benefits
The EU ETS covers both international and domestic aviation and does not
distinguish between them. It is not therefore possible to identify how the
“net” emissions reductions it delivers are apportioned between
international and domestic aviation.
5. Support to Voluntary Actions: ACI Airport Carbon
Accreditation
Airport Carbon Accreditation is a certification programme for carbon
management at airports, based on carbon mapping and management
standard specifically designed for the airport industry. It was launched in
2009 by ACI EUROPE, the trade association for European airports.
This industry-driven initiative was officially endorsed by Eurocontrol and
the European Civil Aviation Conference (ECAC). It is also officially

Action Plan on Emissions Reduction of Greece
42
supported by the United Nations Environmental Programme (UNEP). The
programme is overseen by an independent Advisory Board. ACI EUROPE is
looking at expanding the geographical scope of the programme through
the other ACI regions. Discussions are currently under way with ACI Asia
Pacific for a possible extension of the programme to the Asia Pacific
region.
Airport Carbon Accreditation is a four-step programme, from carbon
mapping to carbon neutrality. The four steps of certification are: Level 1
“Mapping”, Level 2 “Reduction”, Level 3 “Optimisation”, and Level 3+
“Carbon Neutrality”. One of its essential requirements is the verification
by external and independent auditors of the data provided by airports.
Aggregated data are included in the Airport Carbon Accreditation Annual
Report thus ensuring transparent and accurate carbon reporting. At level
2 of the programme and above (Reduction, Optimisation and Carbon
Neutrality), airport operators are required to demonstrate CO2 reduction
associated with the activities they control.
In June 2011, 2 years after the launch of the programme, 43 airports
were accredited, representing 43% of European passenger traffic.
ACI/Europe’s objective for the end of the 3rd year of the programme’s
operation is to cover airports representing 50% of European passenger
traffic. Programme’s implementation is twofold: on top of recruiting new
participants, individual airports should progress along the 4 levels of the
programme.
Anticipated benefits:
The Administrator of the programme has been collecting CO2 data from
participating airports over the past two years. This has allowed the
absolute CO2 reduction from the participation in the programme to be
quantified.
2009-2010 2010-2011
Total aggregate scope 1 & 2 reduction
(tCO2)
51,657 54,565
Total aggregate scope 3 reduction
(tCO2)
359,733 675,124

Action Plan on Emissions Reduction of Greece
43
Variable Year 1 Year 2
Emissions Number
of
airports
Emissions Number
of
airports
Aggregate carbon footprint for ‘year
0’7 for emissions under airports’
direct control (all airports)
803,050
tonnes CO2
17
2,275,469
tonnes CO2
43
Carbon footprint per passenger 2.6
kg CO2
3.73
kgCO2
Aggregate reduction in emissions
from sources under airports’ direct
control (Level 2 and above)8
51,657
tonnes CO2
9 51,819
tonnes CO2
19
Carbon footprint reduction per
passenger
0.351
kg CO2
0.11
kg CO2
Total carbon footprint for ‘year 0’ for
emissions sources which an airport
may guide or influence (level 3 and
above)
2,397,622
tonnes CO2
6 6,643,266
tonnes CO29
13
Aggregate reductions from emissions
sources which an airport may guide
or influence
359,733
tonnes CO2
675,124
tonnes CO2
Total emissions offset (Level 3+) 13,129
tonnes CO2
4 85,602
tonnes CO2
8
Its main immediate environmental co-benefit is the improvement of local
air quality.
Costs for design, development and implementation of Airport Carbon
Accreditation have been borne by ACI EUROPE. Airport Carbon
Accreditation is a non-for-profit initiative, with participation fees set at a
level aimed at allowing for the recovery of the aforementioned costs.
7 ‘Year 0’ refers to the 12 month period for which an individual airport’s carbon footprint refers to, which according to the Airport Carbon Accreditation requirements must have been within 12 months of the application date.
8 This figure includes increases in emissions at airports that have used a relative emissions benchmark in order to demonstrate a reduction.

Action Plan on Emissions Reduction of Greece
44
The scope of Airport Carbon Accreditation, i.e. emissions that an airport
operator can control, guide and influence, implies that aircraft emissions
in the LTO cycle are also covered. Thus, airlines can benefit from the gains
made by more efficient airport operations to see a decrease in their
emissions during the LTO cycle. This is coherent with the objectives
pursued with the inclusion of aviation in the EU ETS as of 1 January 2012
(Directive 2008/101/EC) and can support the efforts of airlines to reduce
these emissions.

Action Plan on Emissions Reduction of Greece
45
SECTION 2
National Actions in Greece
To be added

Action Plan on Emissions Reduction of Greece
46
CONCLUSION
To be added