action research on water buffering in bangladesh scope and options for application in bangladesh...
TRANSCRIPT

ACTION RESEARCH ON WATER BUFFERING IN BANGLADESH
SCOPE AND OPTIONS FOR APPLICATION IN BANGLADESH
Albert Tuinhof – Acacia Water
Dhaka, 24 February 2011
University of Dhaka
Geology Department
Department of Public health Engineering

(GROUND)WATER BUFFERING IN BANGLADESH
• Why is storage important ?• Water buffering: the concept• Technical options • Possibilities in Bangladesh• Examples/tools• Cost and benefits

Source Abstraction Treatment Distribution Point of use
Water supply provision
Water res. dev. & mgt.
Storage needed to bridge gaps in supply
and demand
Resource mgt and water supply need more integration
STORAGE: BETWEEN RESOURCE AND SUPPLY

SOME FIGURES
• Surface water storage per capita– Ethiopia 43m3
– South Africa 750m3
– North America 6150m3
• Village ponds or domestic rainwater storage could add 2-5 m3 per person per annum
• Each additional 10mm groundwater recharge could add 50-100 m3 per person per annum
4

WHERE STORAGE IS INADEQUATE
5

WHERE THERE IS STORAGE
6
The Economist 22 May 2010 :
In semi- arid Gujarat agriculture has grown at an average of 9.6% since 2000, due to the creation of 500,000 small ponds,
dams and such like
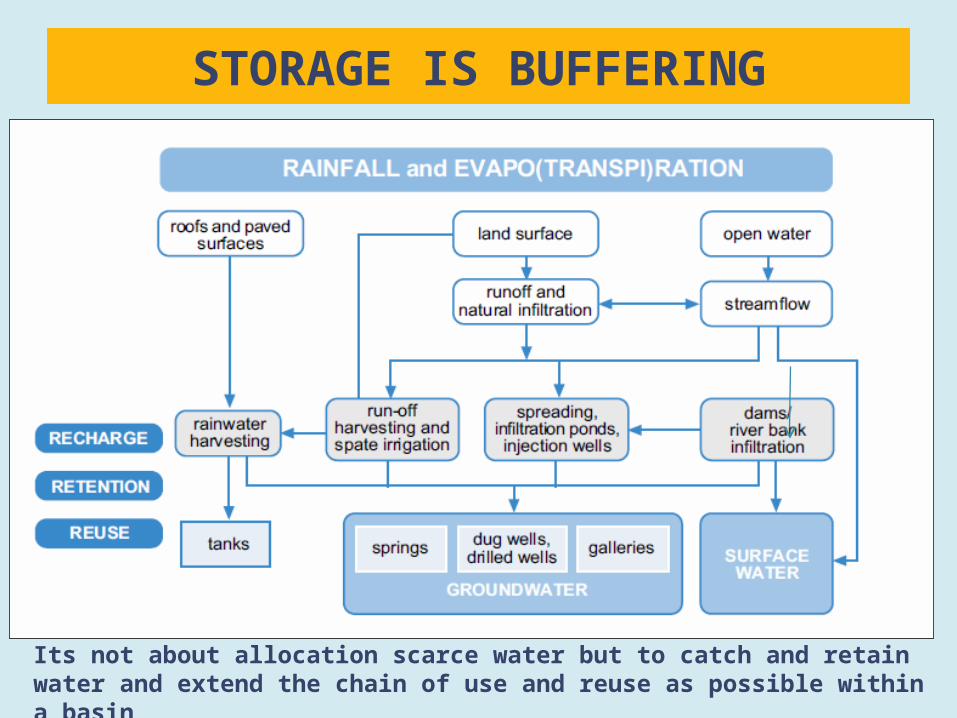
STORAGE IS BUFFERING
Its not about allocation scarce water but to catch and retain water and extend the chain of use and reuse as possible within a basin

MANAGING THE WATER BUFFER: THE CONCEPT
Quick scan to assess hydrological, socio-economic and environmental conditions and water buffering needs on basin /catchment level
Selection of appropriate Recharge, Retention and Reuse) interventions using tools and valuation techniques for decision making
Focus on rural water livelihoods but also for urban ws and productive use
Goal: upscaling (pilot projects) and integration of buffer management in IWRM /Basin Water Management
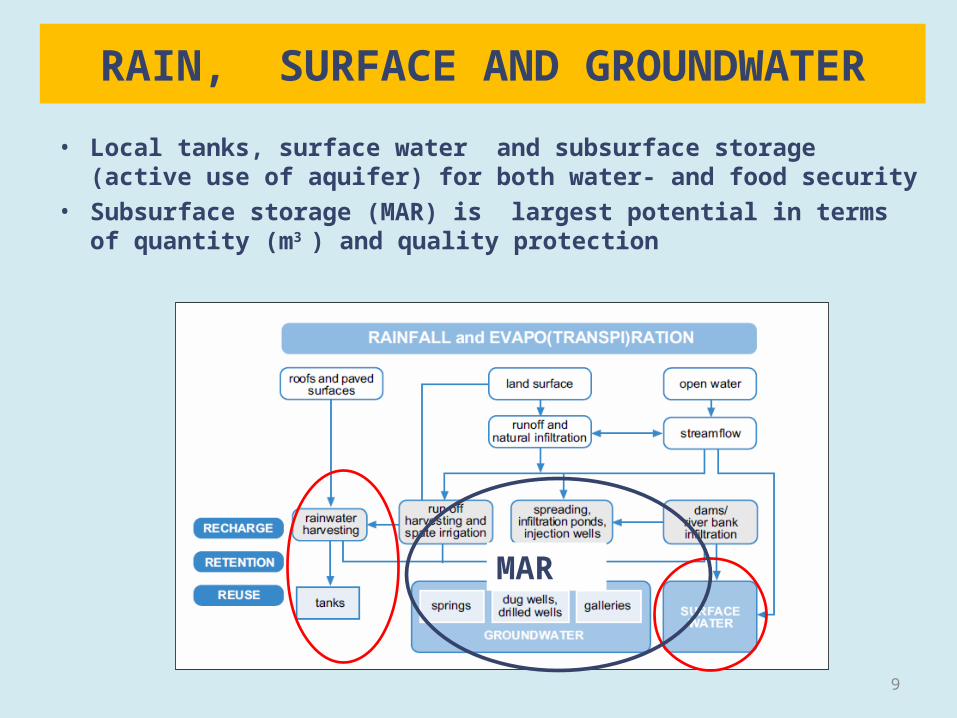
RAIN, SURFACE AND GROUNDWATER
• Local tanks, surface water and subsurface storage (active use of aquifer) for both water- and food security
• Subsurface storage (MAR) is largest potential in terms of quantity (m3 ) and quality protection
9
MAR
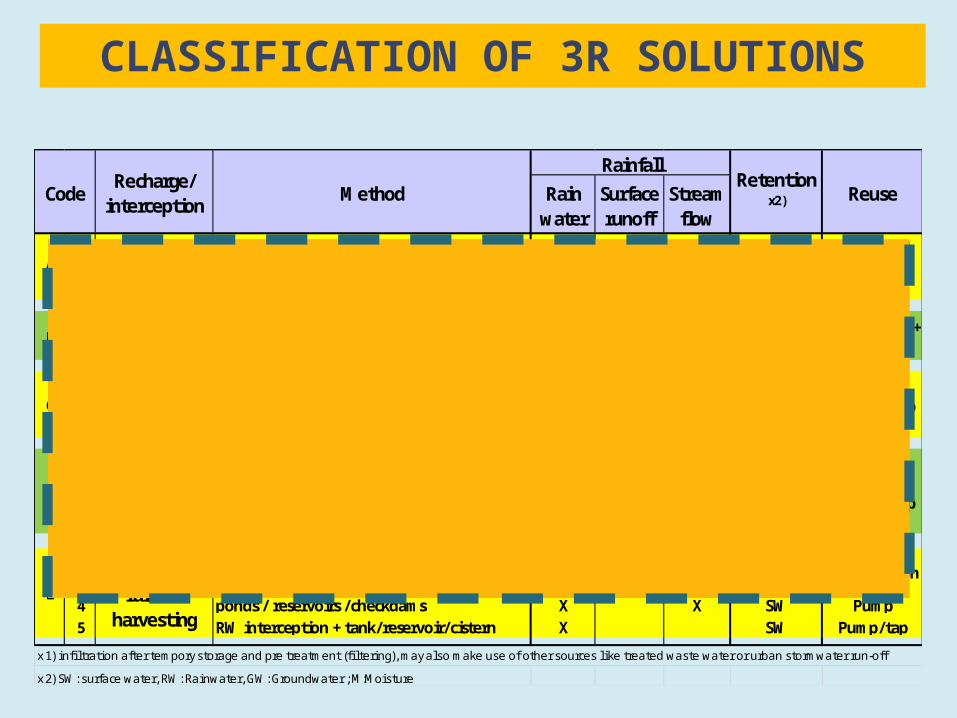
CLASSIFICATION OF 3R SOLUTIONS
Rain water
Surface runoff
Stream flow
1 infiltration ponds / recharge basins/ percolation tanks
X GW2 flooding and irrigation X GW4 ditch, furrow, drains, burrowing, punching x3 X GW
B 1Induced
infiltrationbank infiltration X GW
Well/gallery + pump
1 deep injection well (ASR, AS-TR) X *1) X GW2 shallow injection well / recharge shafts X X *1) GW3 dug well /recharge pits X X GW
1 gully plugging /small weirs X GW/M3 sand dams /gabions /sub surface dams X GW5 recharge dams /percolation tanks/ check X GW/SW6 maintaining river beds/stream channel mod X GW/M
1 barriers, bunds, trenches X M3 terracing, vegetation strips etc X X M4 ponds / reservoirs /checkdams X X SW Pump5 RW interception + tank/reservoir/cistern X SW Pump/tap
x 2) SW: surface water, RW: Ra inwater, GW: Groundwater ; M:Moisture
E
Run-off and rainfall
harvesting
x 1) infi l tration after tempory s torage and pre treatment (fi l tering), may a lso make use of other sources l ike treated waste water or urban s tormwater run-off
Mainly Well + pump
Transpiration
ASurface
recharge
CPoint
rechargeWell + pump
drain/well /gallery +
pump
In channel recharge and
retentionD
CodeRecharge/
interceptionMethod
RainfallRetention
x2) Reuse

3R and MAR
MAR:
building infrastructure and/or modifying the landscape to intentionally enhance groundwater recharge
Recharge enhancement provides additional storage
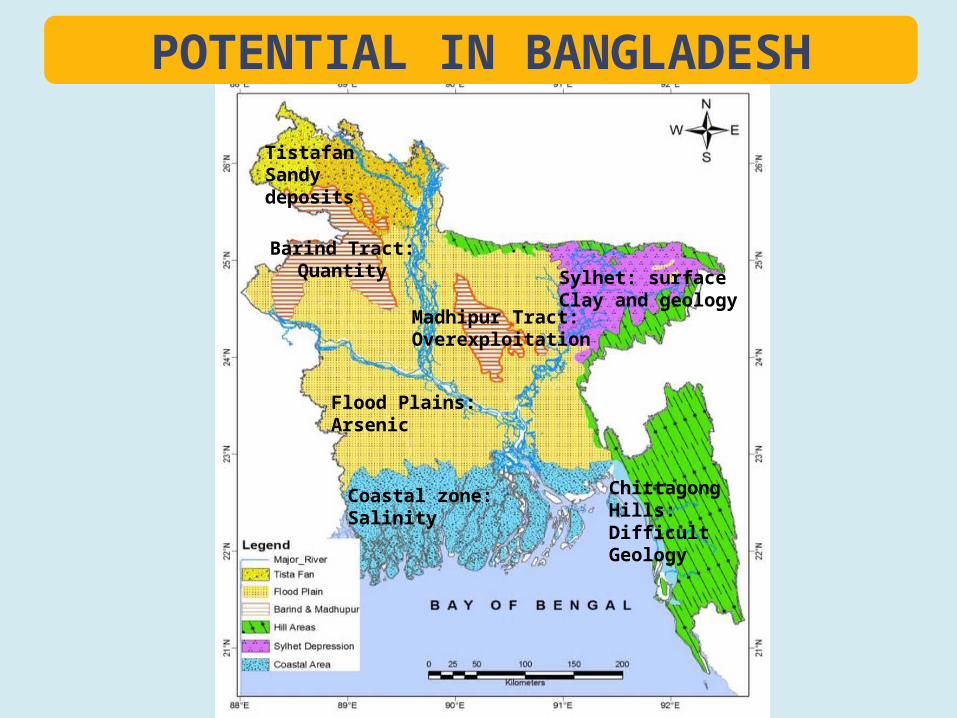
Coastal: Salinity
Barind Tract: Quantity
Flood Plains: Arsenic
Chittagong Hills: Difficult Geology
Madhipur Tract: Overexploitation
Sylhet: surfaceClay and geology
Coastal zone:Salinity
TistafanSandy deposits
POTENTIAL IN BANGLADESH

POTENTIAL IN BANGLADESH
infiltration ponds / recharge basins - + - - - - -flooding and irrigation - + + - - + -ditch, furrow, drains, burrowing, punching etc - - + - - + -
Induced infiltration
bank infiltration - + - + - - -
deep injection well (ASR, AS-TR) + - + + + + -shallow injection well / recharge shafts + + + + - + -dug well /recharge pits - + + + - + -
gully plugging/ small weirs - + - - - - +sand dams /gabions /sub surface dams - + - - - - +recharge dams /percolation tanks/ check dams + - - + - - +maintaining river beds /stream channel modifcations
barrier, bunds, trenches etc. + + - + - - -terracing, nefarim, veg strips etcponds / reservoirs /checkdams + + + + + + +RW interception + tank/reservoir/cistern + + + + + + +
Run-off and rainfall
harvesting
Tista Fan
x1): Includes Greater Dhaka x2) includes Chapai Nawabganj area
Surface recharge
Point recharge
Recharge/ interception
MethodSylhet
DepressionCoastal Plains
In channel recharge and
retention
Barind Tract
Flood Plains X2)
Madhupur Tract x1)
Hill Tracts

Production wells drilled along the Mohanandan River abstract part of the water from the river. Simulations with a groundwater model and with a Bank Infiltration Simulator (NASRI) show that approximately 30% (dry season) to 60% (wet season) of the pumped water (at 30-50 m) originates from the river with travel times of 5-10 days (wet season) to 30-40 days (dry season).
BANK INFILTRATION:CHAPAI NAWABGANJ

Subsurface storage
Abstraction well
- Capital cost : 8,000-12,000 USD- Annual cost: O&Mand monitoring: 1,000-1500 USD- Water storage provided: 2,000 m3/rainy season - Number of users: 20-30 families (100-200 users)
SAND STORAGE DAMS

Khulna
Sundarbans
SHALLOW GROUNDWATER INFILTRATION
Pilot Study of fresh WR in the coastal belt (IWACO, UNICEF, 1985)
Infiltration testing
ACTION RESEARCH ON GROUNDWATER BUFERING IN BANGLADESH , PHASE 2

173R solutions to improve Water Quality and Quantity
Fresh water from ponds and roofs can be injected in the shallow (brachish) aquifer during monsoon for abstraction during dry season
2 tests sites are constructed and tested after the 2010 monsoon
2 new sites will be added for testing during the 2011 monsoon
A 3D model was made to guide the testing and to be calibrated for future desings and upscaling
INFILTRATION TESTING

Upozila Population 2006
Area km2 % affected
Kaliganj 275.000 329 100
Assasuni 268,000 377 100
Syamnagar 337,000 1969 100
Batiaghata 151,000 237 20
Paikgacha 267,000 378 50
Koyra 207,000 1583 100
Dacope 169,000 1050 100
Rampal 192,000 276 80
Mongla 160,000 1502 100
Morrelganj 376,000 439 95
Sarankhola 123,000 825 100
Total 2,526,000
UPSCALING POTENTIAL SHALLOW GW INFILTRATIONIN KHULNA AND SATHKIRA DISTRICT:
Experiences can also be used to assess and test the application elsewhere in Bangladesh

Station Country
Coordinates Longitude xxx Latitude xxx
Town DhakaProvince /District
Country Bangladesh
Rainfall data
Period: 1953 1982
Number of years ny 30
Number months nm 360
Average annual rainfall (mm) 1951
Fixed input parameters
Leakage losses (%) L 5Run-off coefficient f 0.8
Jan Feb Mar Apr May Jun Jul Aug Sep Oct Nov Dec Average
5 5 5 6 6 6 6 6 5 5 5 5 5.4
DHAKA BANGLADESH
Consumption (lit/cap/day)
0.0
50.0
100.0
150.0
200.0
250.0
300.0
350.0
400.0
Jan Feb Mar Apr May Jun Jul Aug Sep Oct Nov Dec
Ave
rag
e ra
infa
llMonth
Average monthly rainfall
SIMULATION MODEL RAINWATER HARVESTING
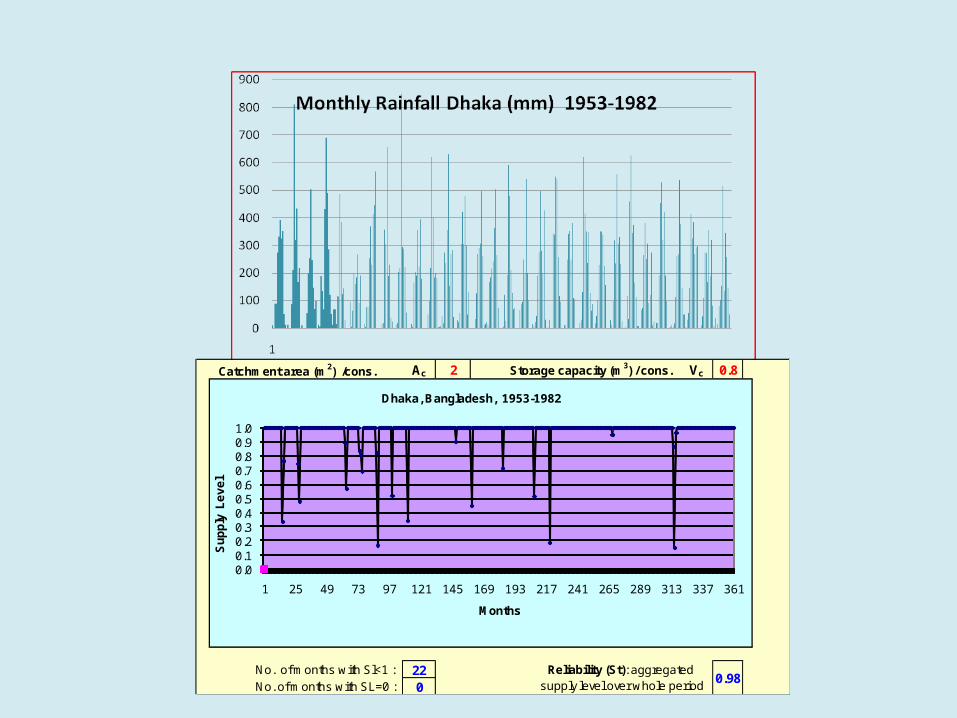
Catchment area (m2) /cons. Ac 2 Vc 0.8
No. of months with Sl<1 : 22No. of months with SL=0 : 0
0.98
Storage capacity (m3) / cons.
Reliability (St): aggregated supply level over whole period
0.00.10.20.30.40.50.60.70.80.91.0
1 25 49 73 97 121 145 169 193 217 241 265 289 313 337 361
Su
pp
ly L
ev
el
Months
Dhaka, Bangladesh, 1953-1982

Ac 2 Vc 0.8 reliability St 0.98
Parameter A(m 2) V (m 3) No.
Roof surface (A) 500 200 250
Tank capacity (V) 25 10 13
No. consumers 100 40 50
select values for red numbers
Design parameters of RHS for selected Ac and Vc which are entered in above graph
0.98 2 4 6 8 10 120.8 0.98 0.99 1.00 1.00 1.00 1.00
1 1.00 1.00 1.00 1.00 1.00 1.00
2 1.00 1.00 1.00 1.00 1.00 1.00
3 1.00 1.00 1.00 1.00 1.00 1.004 1.00 1.00 1.00 1.00 1.00 1.00
Vc
Reliabiliy (St) for a range of Ac and Vc Ac

sensitivity analysis
Assign monetary values to non financial cost and benefits
value and discount all cost and benefits
determine Net Present Value (NPV) and Cost/Beneftit Ratio ( BCR) for decision making
Carry out water buffer quick scan
Identify potential 3R solution(s)
Identify cost & benefits of 3R solution(s) and of the "no intervention" option
Determine whether C&B can be measured and quantified
Select and apply valuation tool
Techniques : Revealed Preference Stated Preference Benefit Transfer
YES NO
ECONOMIC VALUATION OF STORAGE: 3R CBA

OVERVIEW OF COST /BENEFITS OF STORAGE
COST ITEM VALUATION
CONSTRUCTION Incl. design etc USD
ADDITIONAL COST Land acquisitionPower supply
USD
SOCIAL/ENV. COST EIA/SIA / Mitigation USD - USD/yr
O&M Incl .monitoring USD/yr
BENEFITS ITEM VALUATION
REDUCED COST OF WATER Drinking, livestock, rural industry, small scale irr. USD/yr, based on
interviewsINCR. PRODUCTIVITY See above: income increase
HOUSEHOLD BENEFITS Improved health, more time Indirect, through valuation methods.
SOCIAL / COMMUNITY BENEFITS
Cohesion, security, education
ENVIRONMENTAL BEN. Biodiversity, vegetation
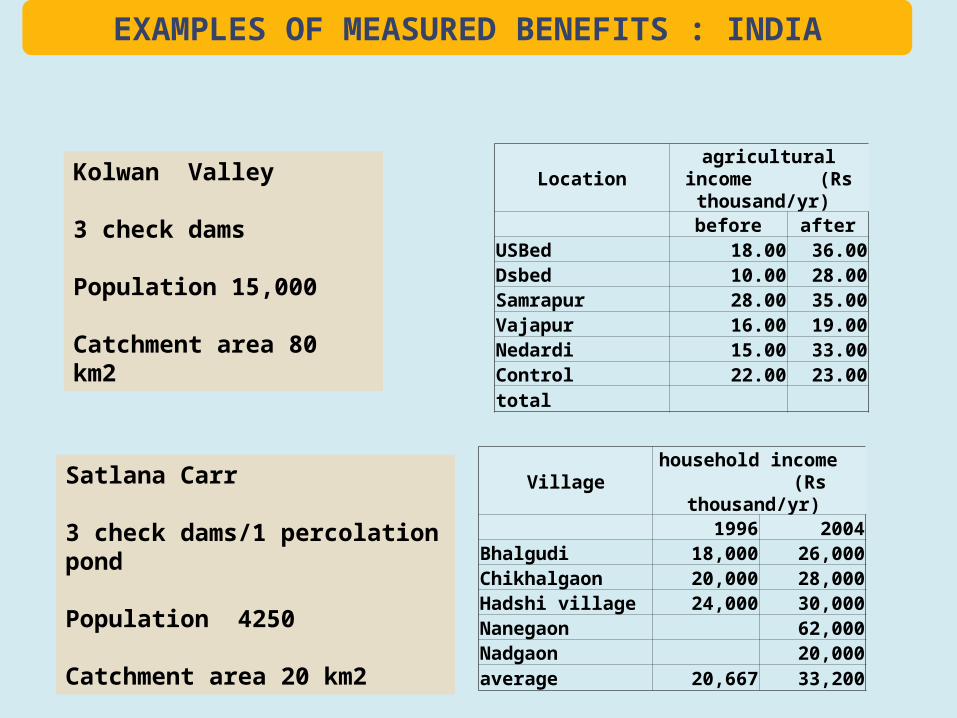
Village household income (Rs thousand/yr)
1996 2004Bhalgudi 18,000 26,000Chikhalgaon 20,000 28,000Hadshi village 24,000 30,000Nanegaon 62,000Nadgaon 20,000average 20,667 33,200
Location agricultural income (Rs thousand/yr)
before afterUSBed 18.00 36.00Dsbed 10.00 28.00Samrapur 28.00 35.00Vajapur 16.00 19.00Nedardi 15.00 33.00Control 22.00 23.00total
Kolwan Valley
3 check dams
Population 15,000
Catchment area 80 km2
EXAMPLES OF MEASURED BENEFITS : INDIA
Satlana Carr
3 check dams/1 percolation pond
Population 4250
Catchment area 20 km2

Thank you