actionable metrics
TRANSCRIPT

ACTIONABLE METRICSHOW TO MEASURE WHAT
MATTERS BEFORE PRODUCT/MARKET FIT
ASH MAURYA@ashmaurya
http://www.ashmaurya.com
What is an Actionable Metric?
Ties specific, repeatable actions to observed results

Vanity Metrics
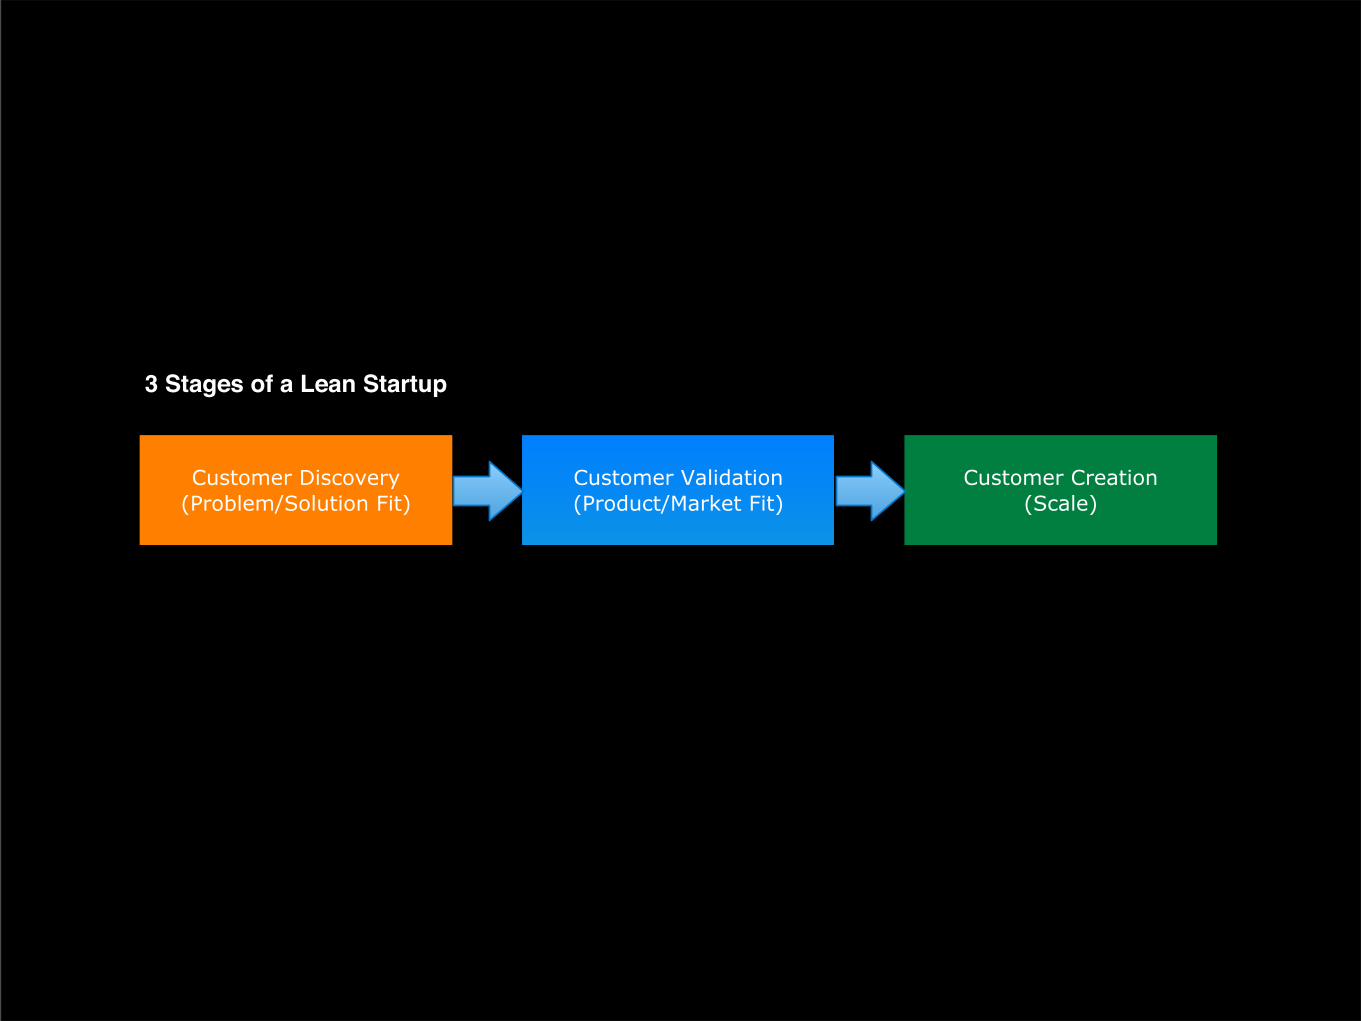
Customer Discovery(Problem/Solution Fit)
Customer Validation(Product/Market Fit)
Customer Creation(Scale)
3 Stages of a Lean Startup
How You Measure Matters
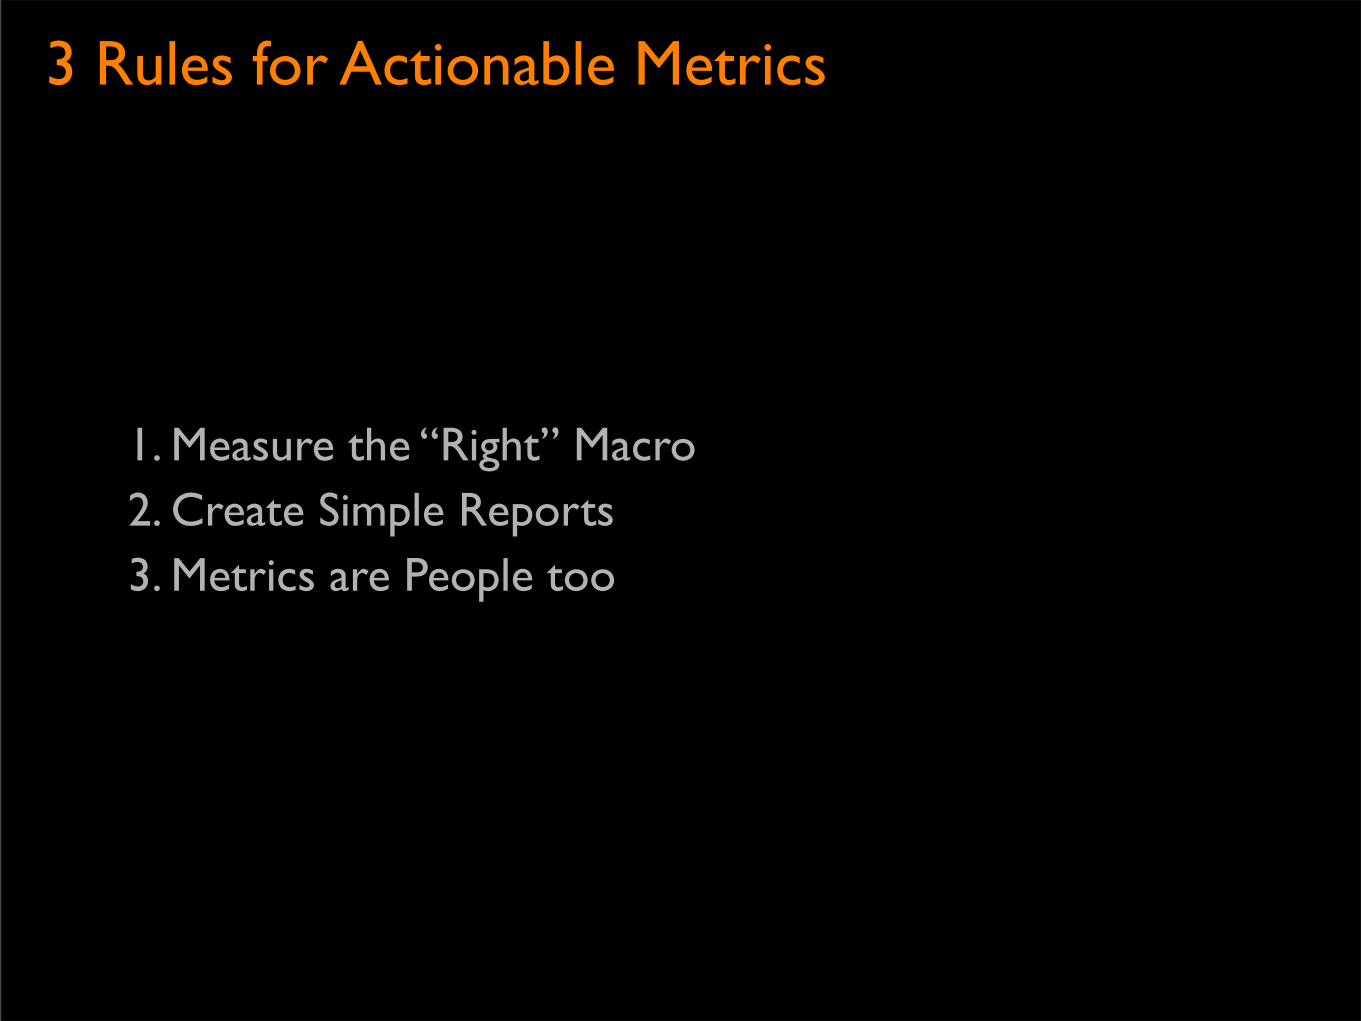
3 Rules for Actionable Metrics
1. Measure the “Right” Macro2. Create Simple Reports3. Metrics are People too
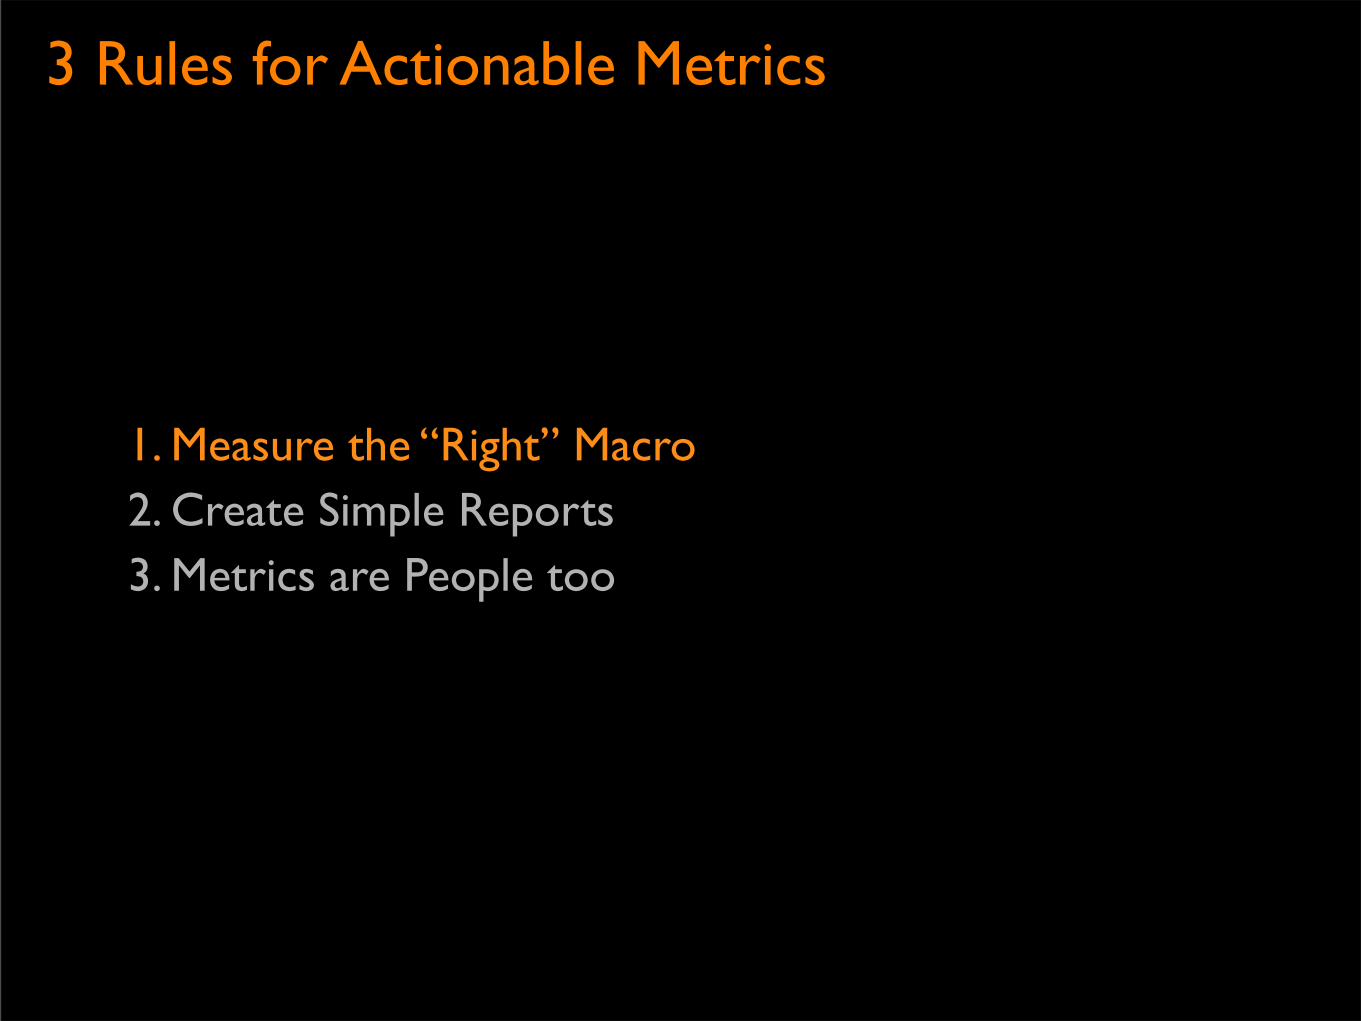
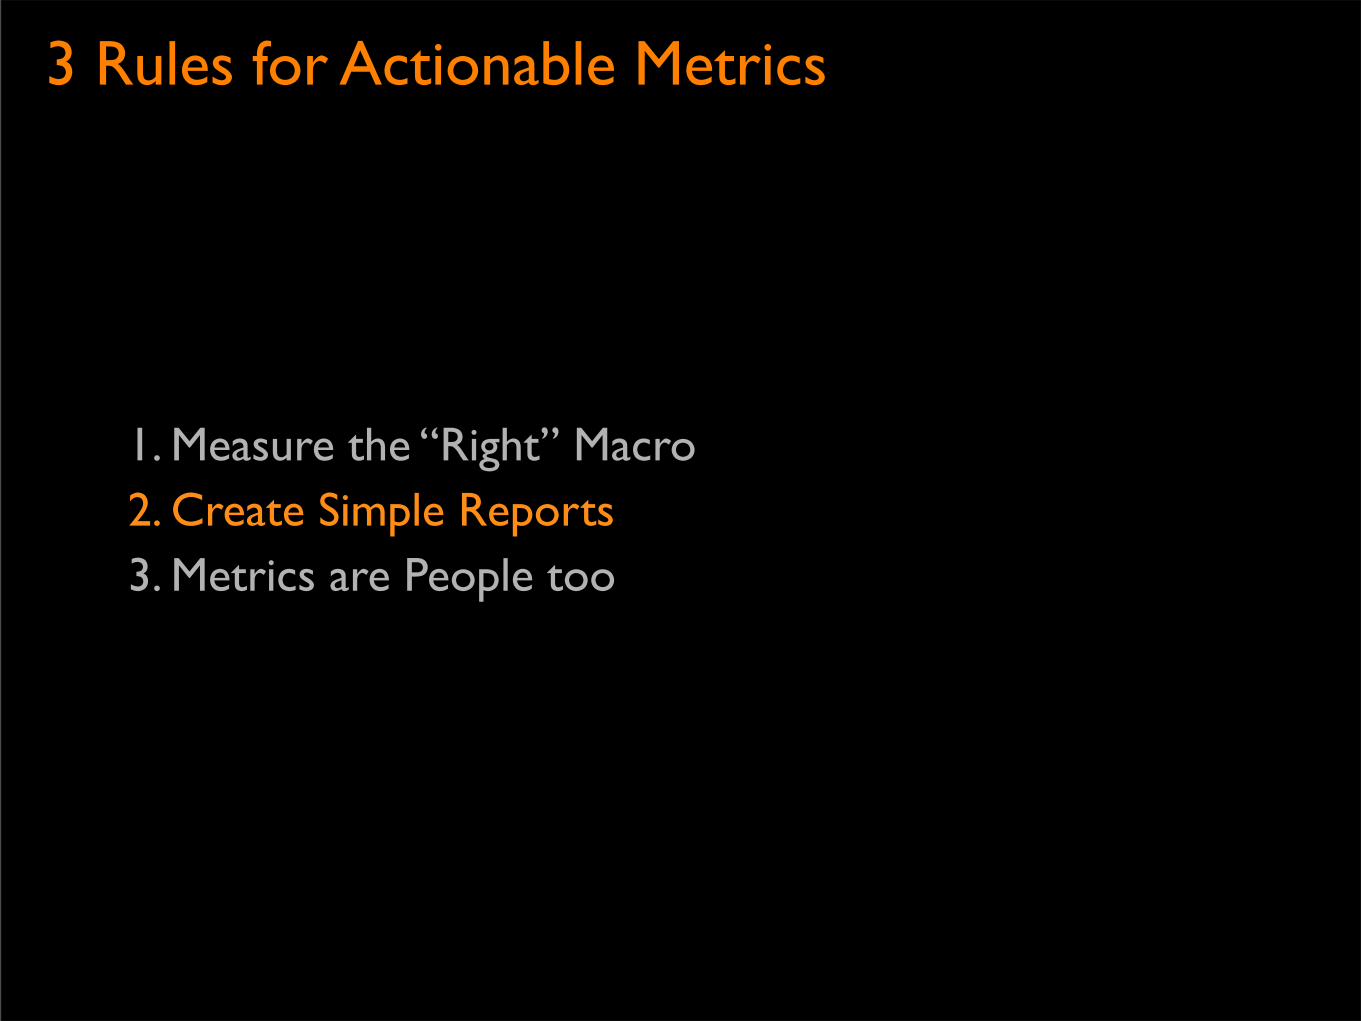
3 Rules for Actionable Metrics
1. Measure the “Right” Macro2. Create Simple Reports3. Metrics are People too
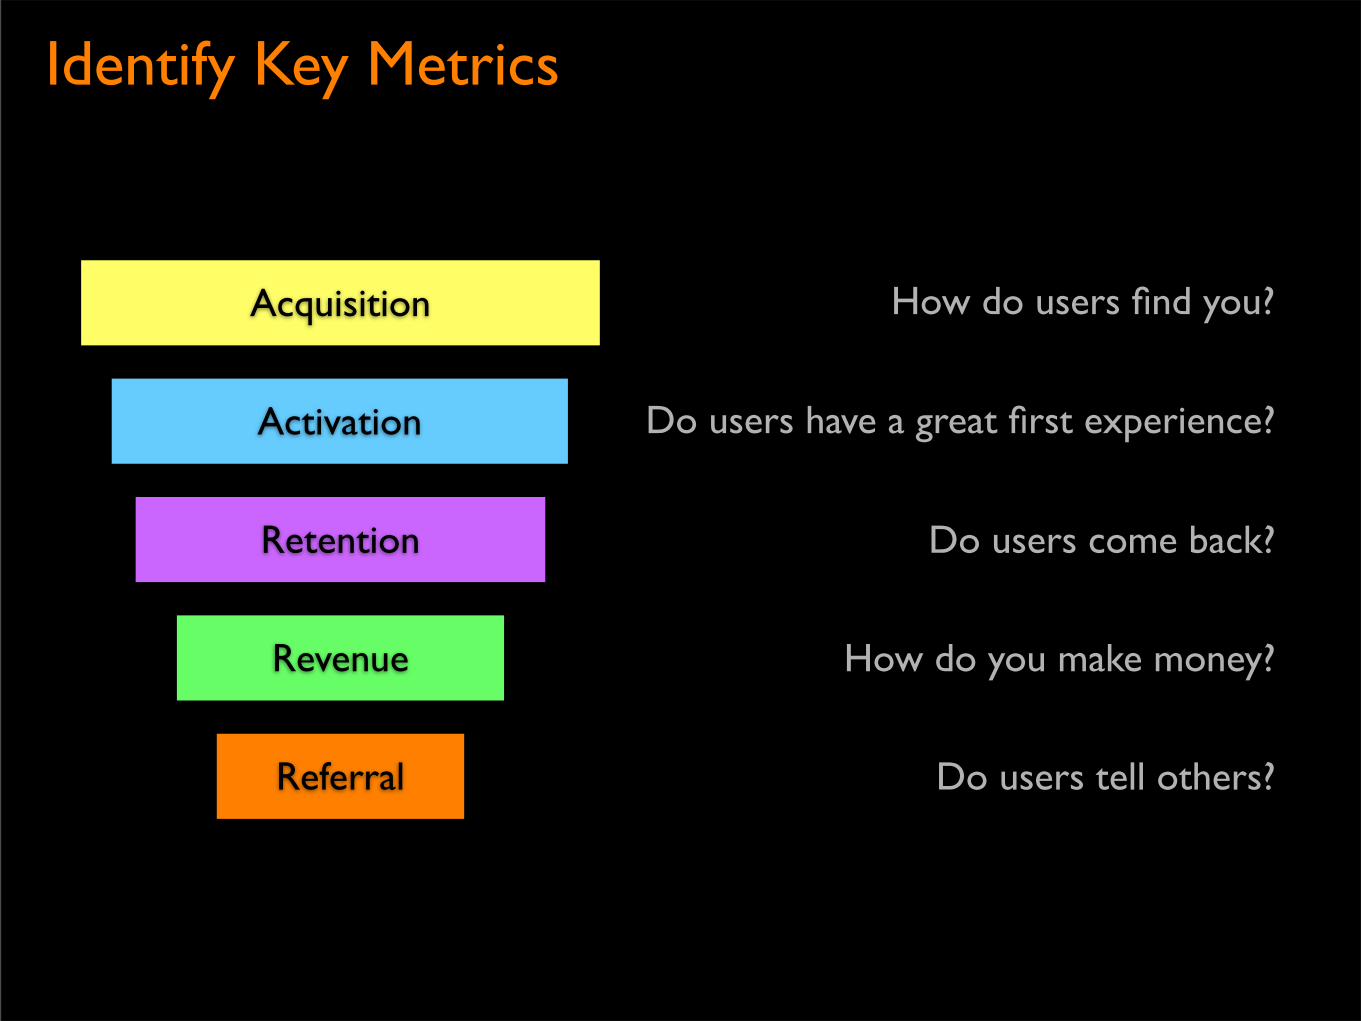
Identify Key Metrics
Acquisition
Activation
Retention
Revenue
Referral
How do users find you?
Do users have a great first experience?
Do users come back?
How do you make money?
Do users tell others?
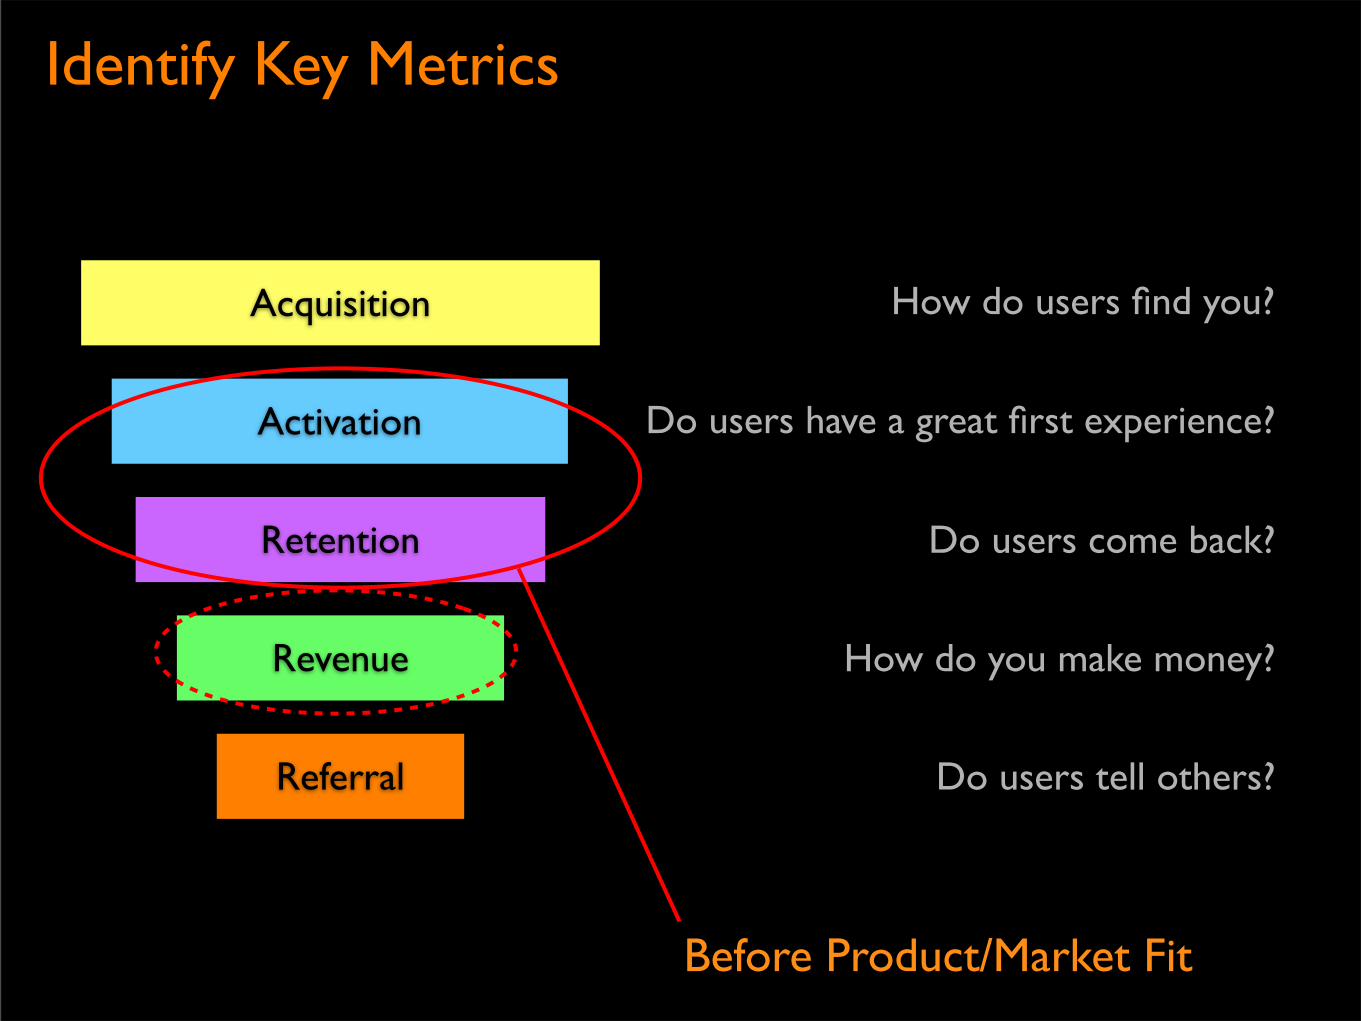
Identify Key Metrics
Acquisition
Activation
Retention
Revenue
Referral
How do users find you?
Do users have a great first experience?
Do users come back?
How do you make money?
Do users tell others?
Before Product/Market Fit
Map Metrics to Actions

Activation Actions
Signup Download Share Stuff Tell Friends

Retention Actions
1. Revisits2. Churn - cancellations, no activity3. Loyalty - days since last visit4. Key Activity - Shared 1 new album/movie per month
3 Rules for Actionable Metrics
1. Measure the “Right” Macro2. Create Simple Reports3. Metrics are People too
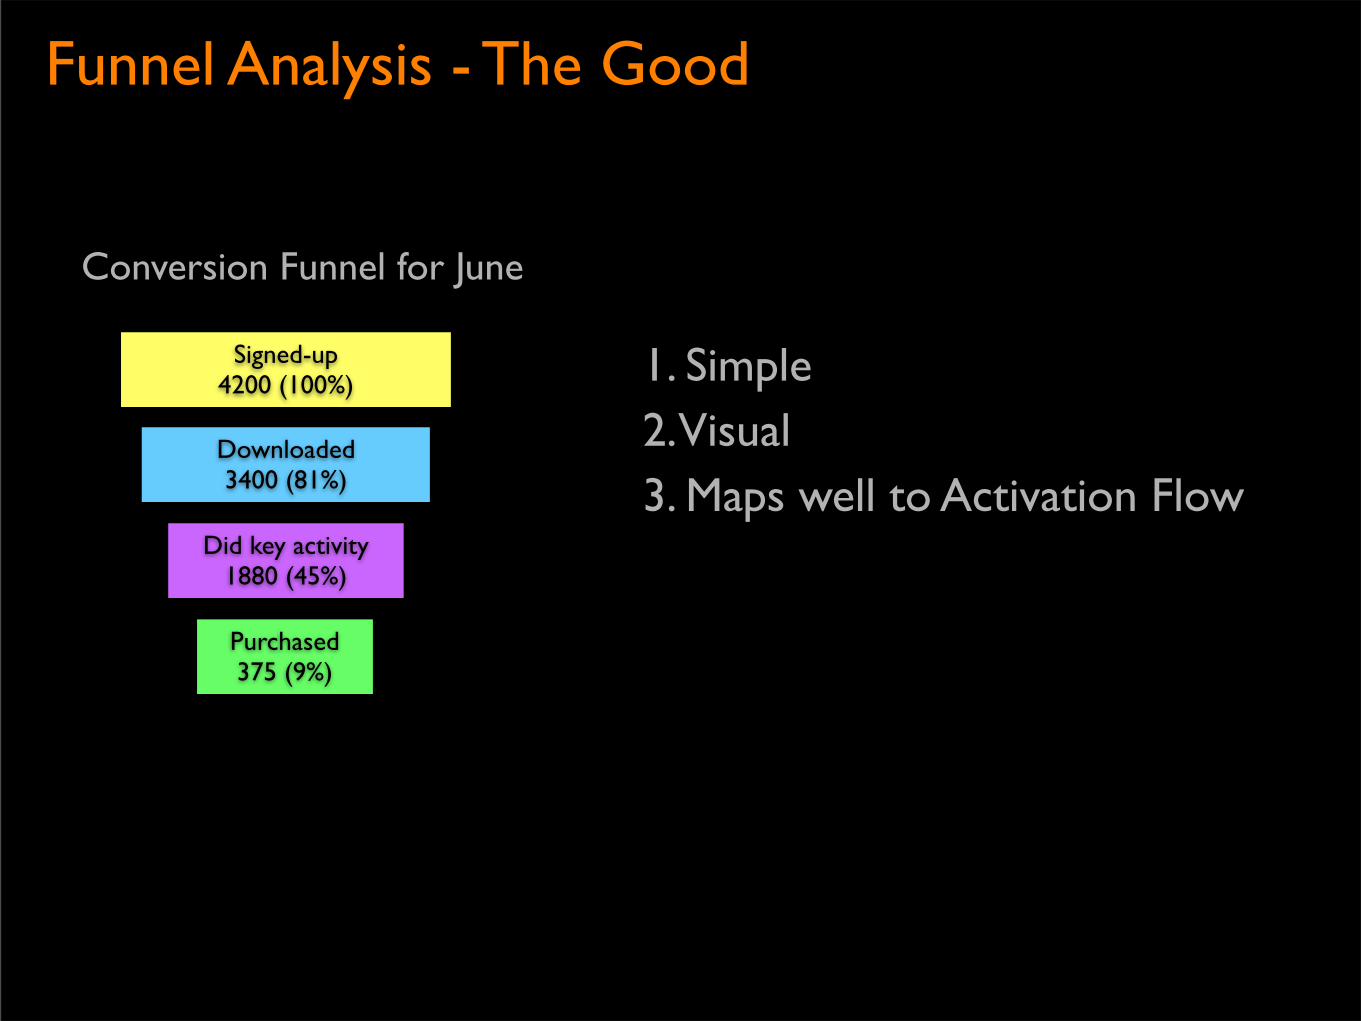
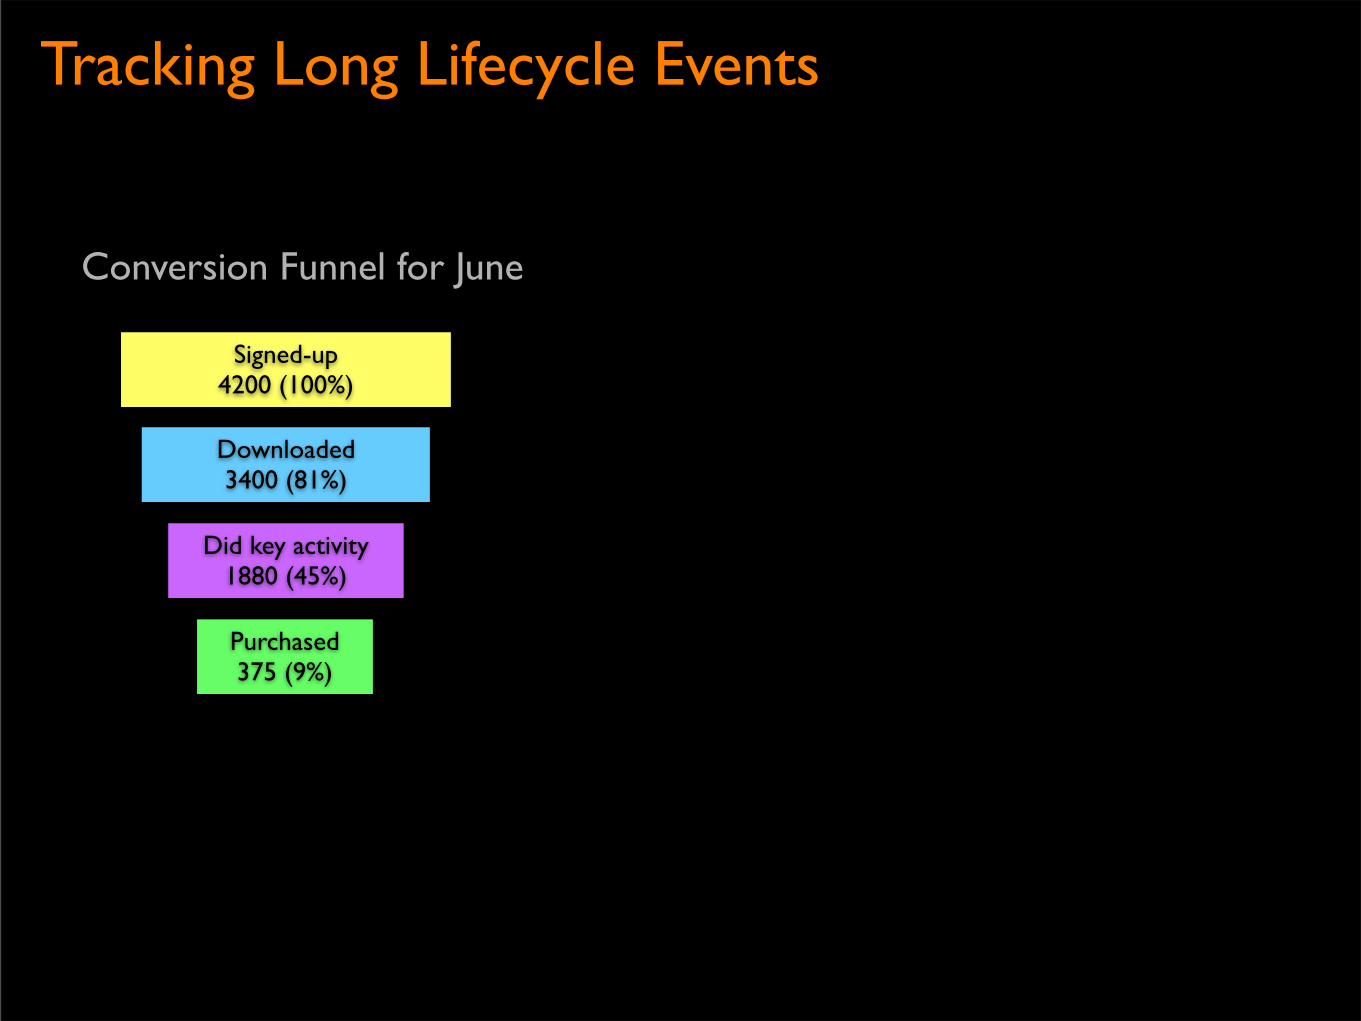
Funnel Analysis - The Good
Conversion Funnel for June
1. Simple2. Visual3. Maps well to Activation Flow
Signed-up 4200 (100%)
Downloaded 3400 (81%)
Did key activity 1880 (45%)
Purchased 375 (9%)
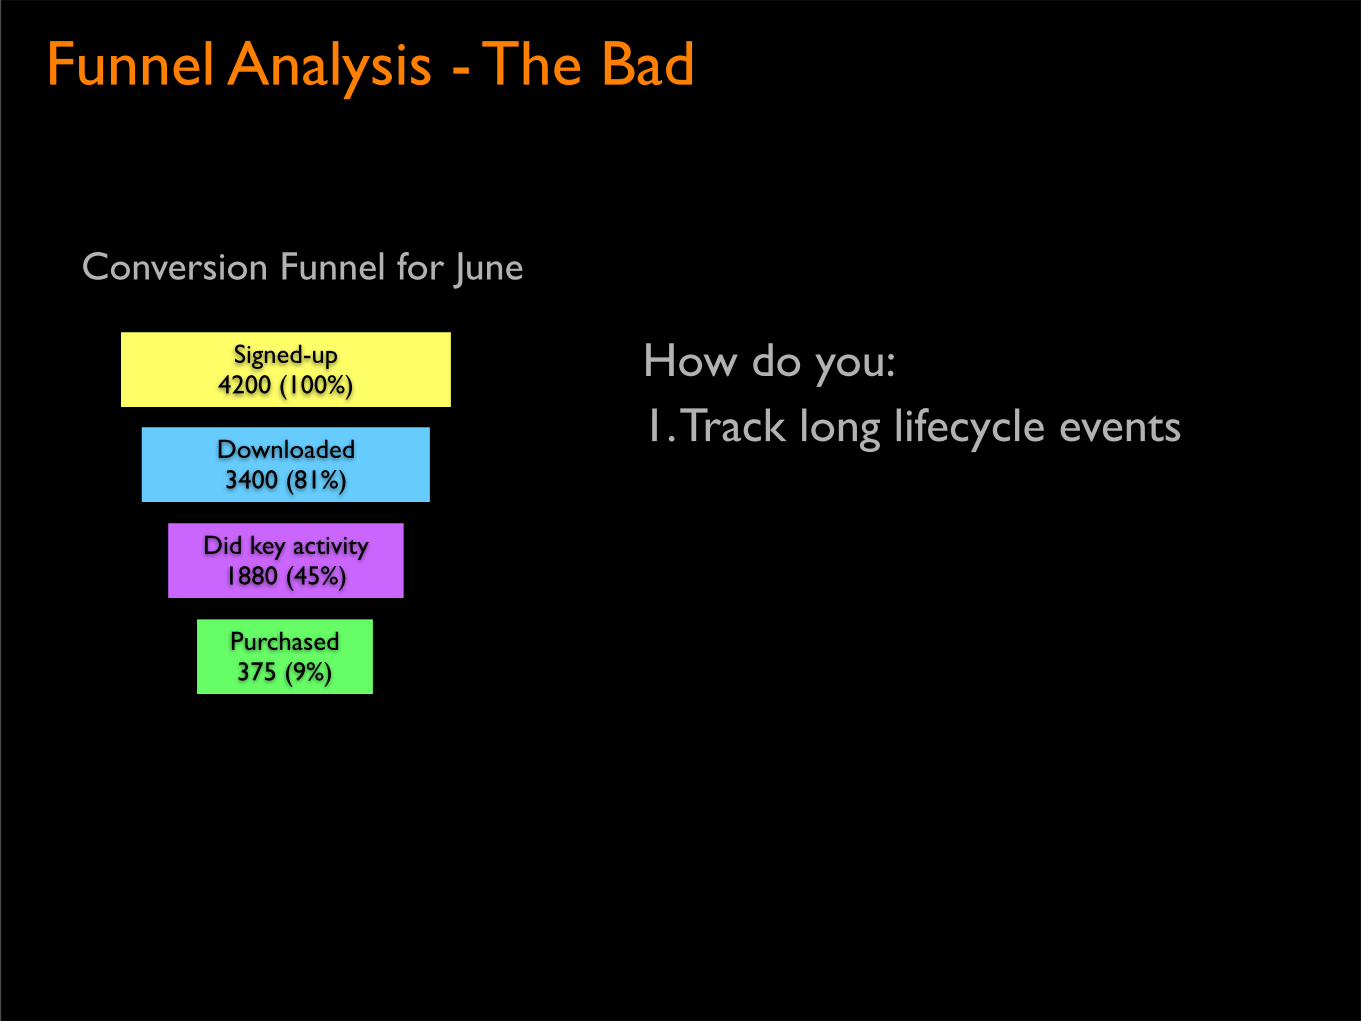
Funnel Analysis - The Bad
How do you:1. Track long lifecycle events
Conversion Funnel for June
Signed-up 4200 (100%)
Downloaded 3400 (81%)
Did key activity 1880 (45%)
Purchased 375 (9%)

Funnel Analysis - The Bad
How do you:1. Track long lifecycle events2. Handle split tests
Conversion Funnel for June
Signed-up 4200 (100%)
Downloaded 3400 (81%)
Did key activity 1880 (45%)
Purchased 375 (9%)

Funnel Analysis - The Bad
How do you:1. Track long lifecycle events2. Handle split tests3. Measure Retention
Conversion Funnel for June
Signed-up 4200 (100%)
Downloaded 3400 (81%)
Did key activity 1880 (45%)
Purchased 375 (9%)

Funnels Alone Are Not Enough.Say Hello to the Cohort.
What is Cohort Analysis
A cohort is a group of people who share a common characteristic over a period of time e.g. join date.
Conversion Funnel for June
Signed-up 4200 (100%)
Downloaded 3400 (81%)
Did key activity 1880 (45%)
Purchased 375 (9%)
Tracking Long Lifecycle Events
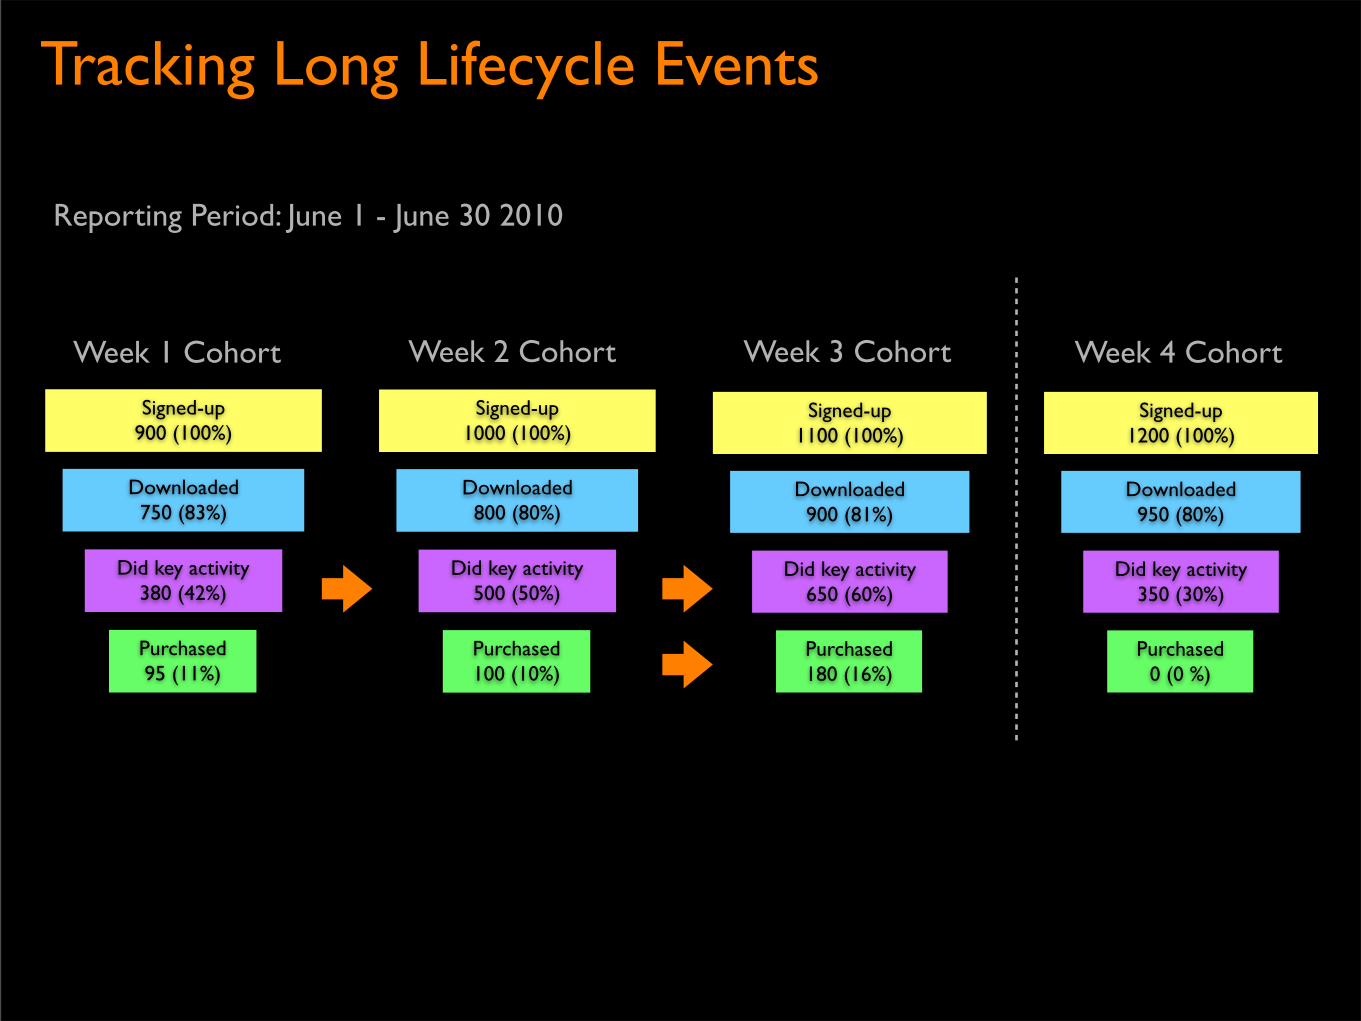
Tracking Long Lifecycle Events
Week 1 Cohort Week 2 Cohort Week 3 Cohort
Signed-up 1000 (100%)
Downloaded 800 (80%)
Did key activity 500 (50%)
Purchased 100 (10%)
Signed-up 900 (100%)
Downloaded 750 (83%)
Did key activity 380 (42%)
Purchased 95 (11%)
Signed-up 1100 (100%)
Downloaded 900 (81%)
Did key activity 650 (60%)
Purchased 180 (16%)
Week 4 Cohort
Signed-up 1200 (100%)
Downloaded 950 (80%)
Did key activity 350 (30%)
Purchased 0 (0 %)
Reporting Period: June 1 - June 30 2010
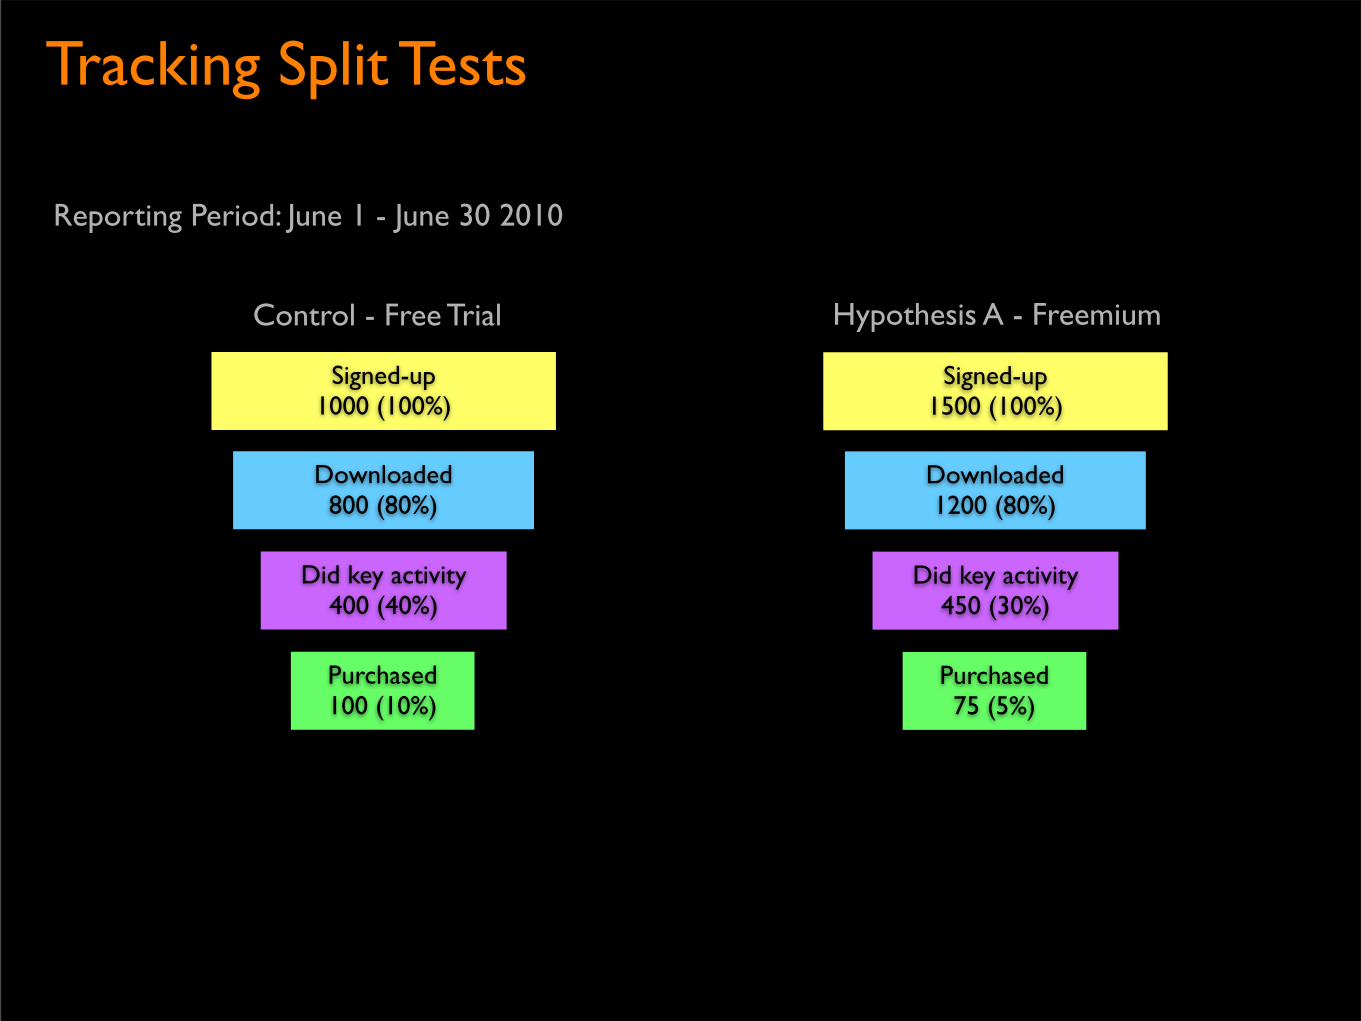
Tracking Split Tests
Control - Free Trial Hypothesis A - Freemium
Signed-up 1500 (100%)
Downloaded 1200 (80%)
Did key activity 450 (30%)
Purchased 75 (5%)
Signed-up 1000 (100%)
Downloaded 800 (80%)
Did key activity 400 (40%)
Purchased 100 (10%)
Reporting Period: June 1 - June 30 2010
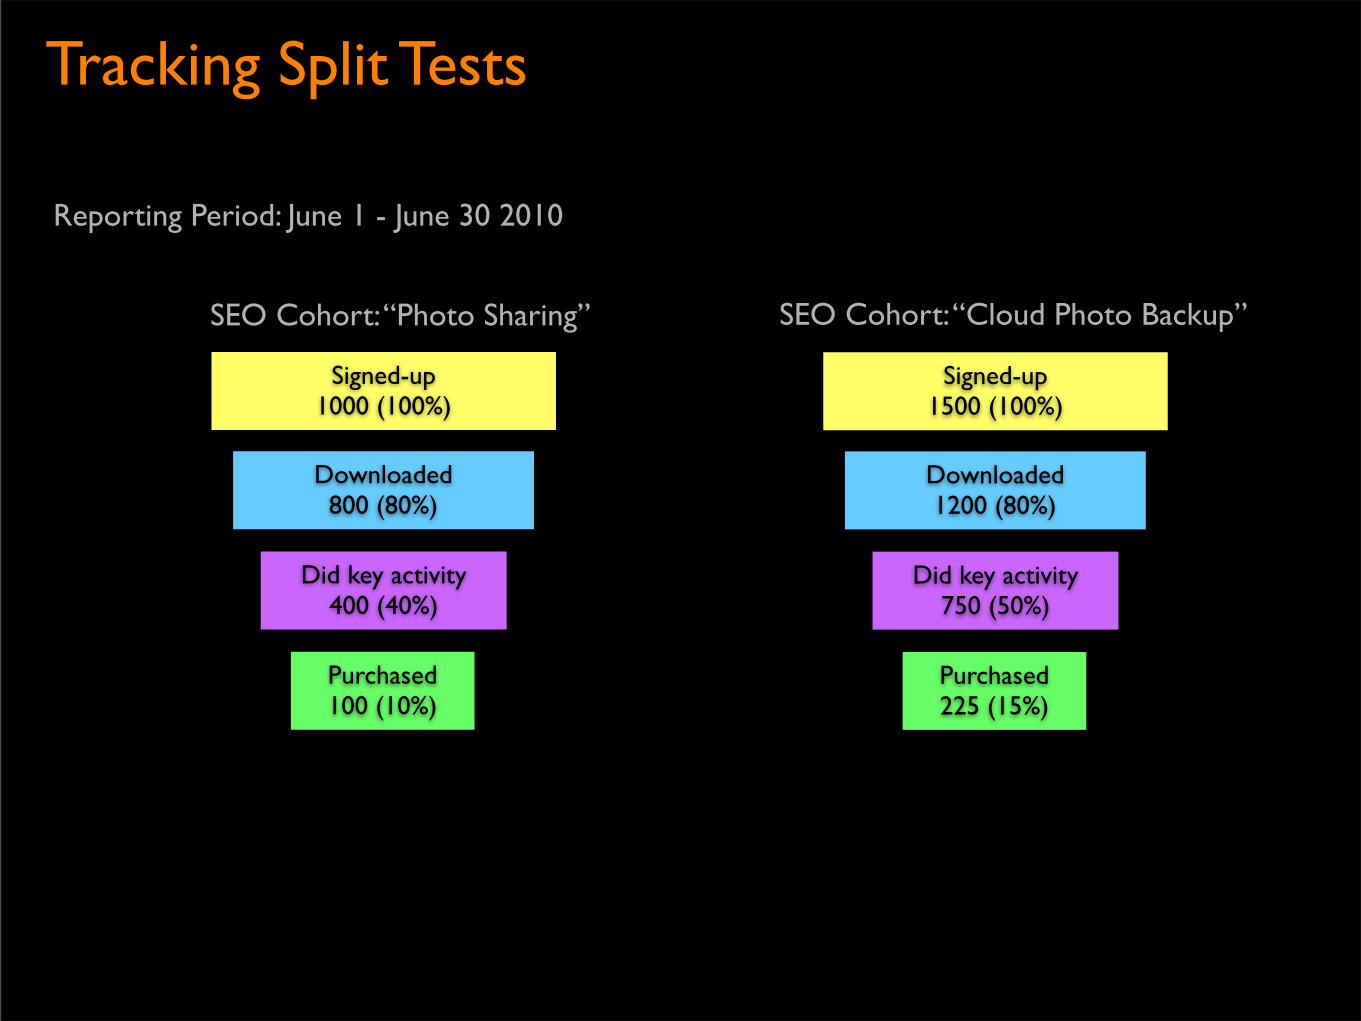
Tracking Split Tests
SEO Cohort: “Photo Sharing” SEO Cohort: “Cloud Photo Backup”
Signed-up 1500 (100%)
Downloaded 1200 (80%)
Did key activity 750 (50%)
Purchased 225 (15%)
Signed-up 1000 (100%)
Downloaded 800 (80%)
Did key activity 400 (40%)
Purchased 100 (10%)
Reporting Period: June 1 - June 30 2010
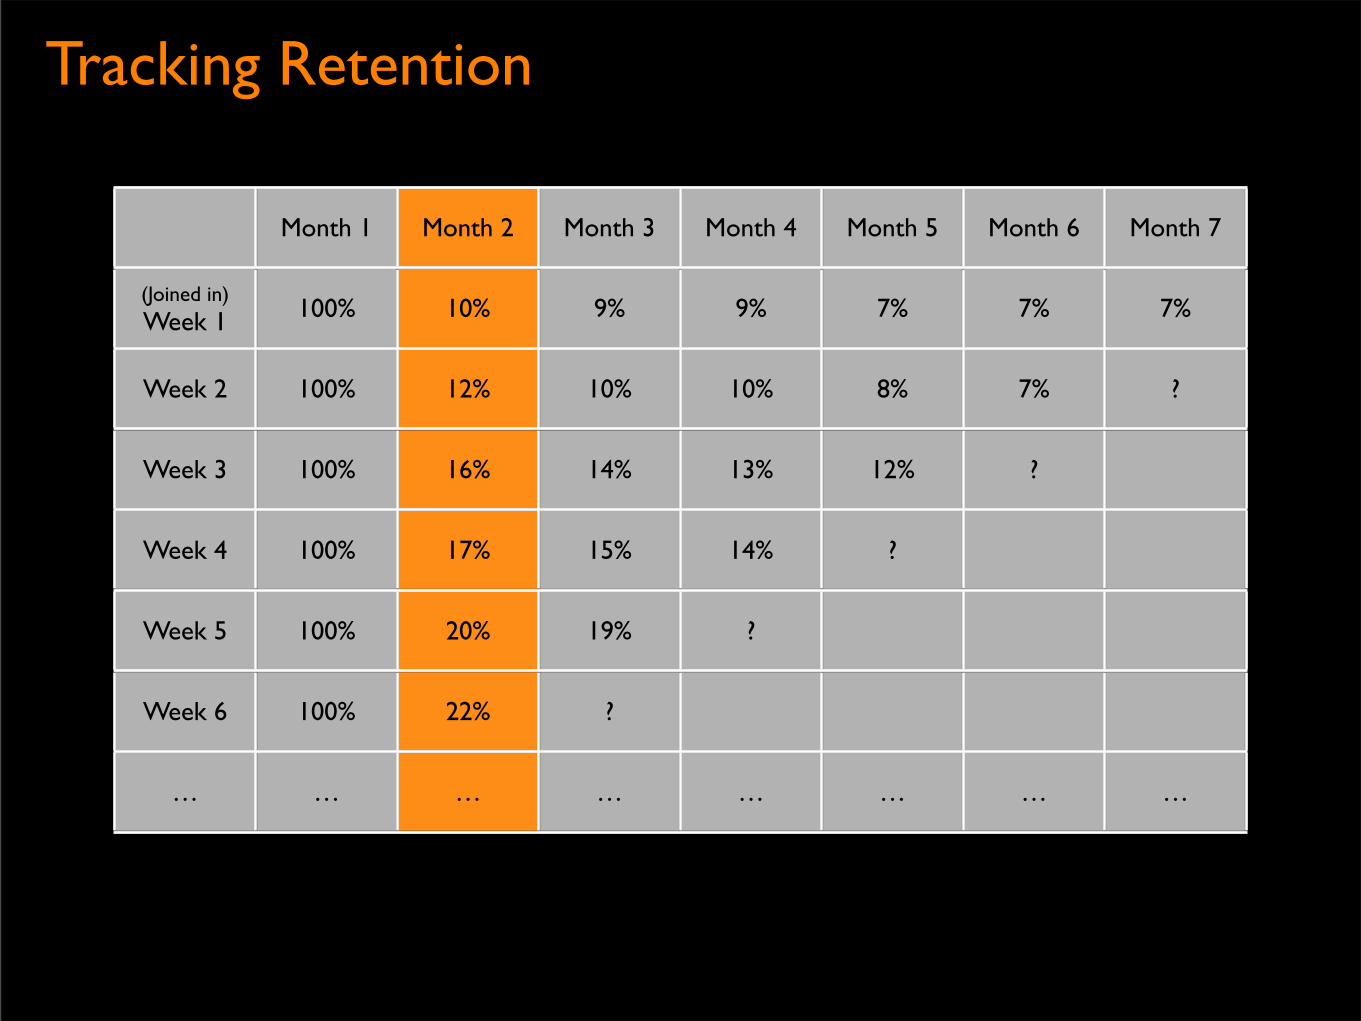
Tracking Retention
Month 1 Month 2 Month 3 Month 4 Month 5 Month 6 Month 7
(Joined in)Week 1 100% 10% 9% 9% 7% 7% 7%
Week 2 100% 12% 10% 10% 8% 7% ?
Week 3 100% 16% 14% 13% 12% ?
Week 4 100% 17% 15% 14% ?
Week 5 100% 20% 19% ?
Week 6 100% 22% ?
… … … … … … … …

3 Rules for Actionable Metrics
1. Measure the “Right” Macro2. Create Simple Reports3. Metrics are People too

Validate Qualitatively, Verify Quantitatively
Who are these people?
Cohort - Free Trial
Signed-up 1000 (100%)
Downloaded 800 (80%)
Did key activity 400 (40%)
Purchased 100 (10%)
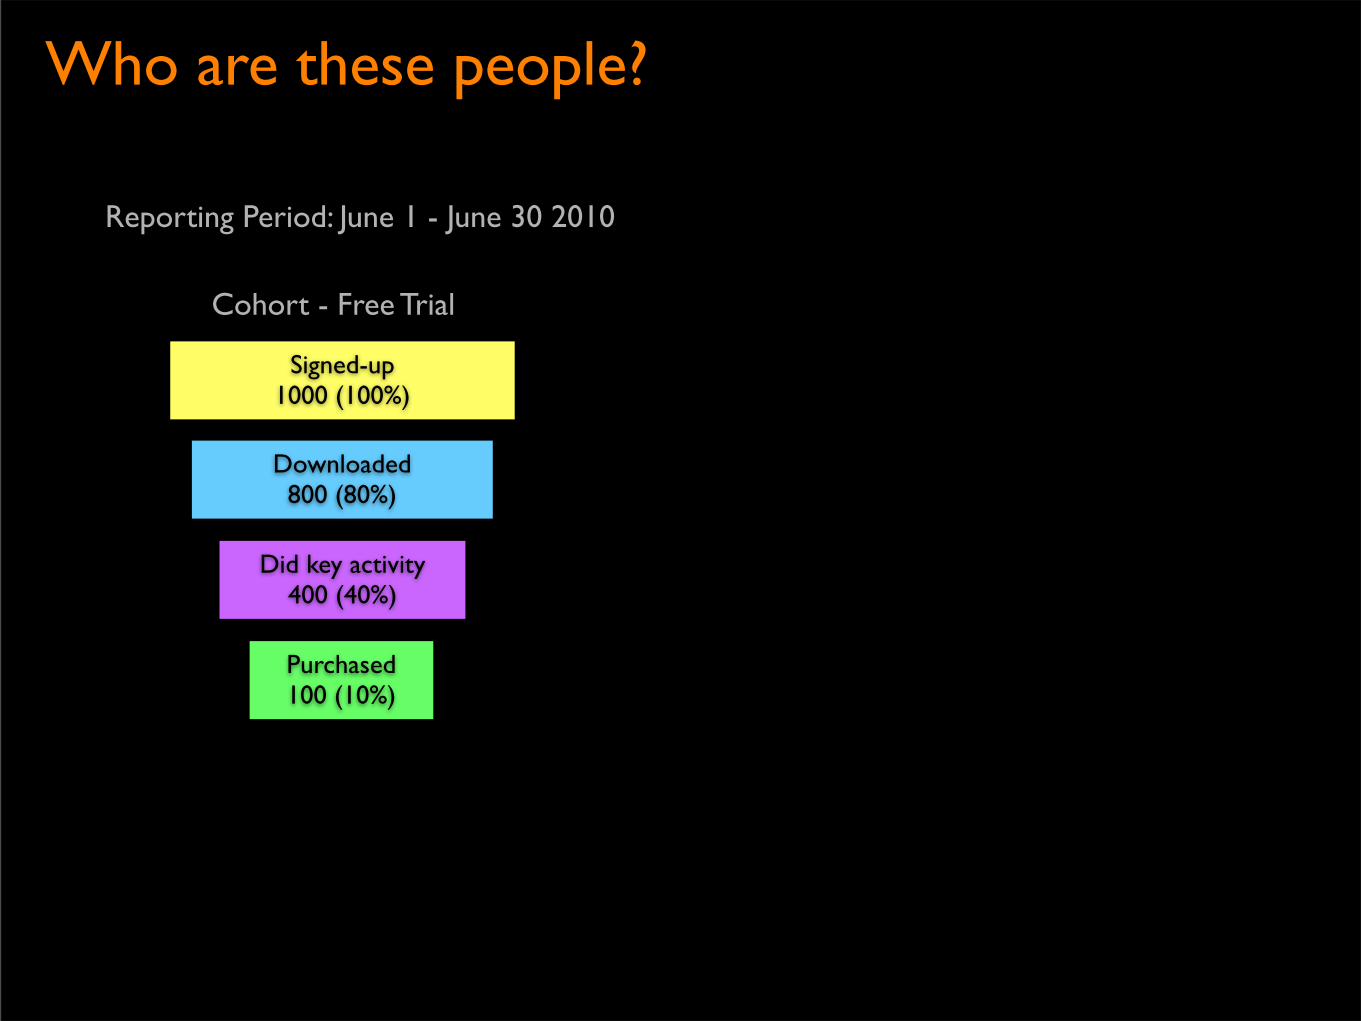
Reporting Period: June 1 - June 30 2010
Who are these people?
Cohort - Free Trial
Signed-up 1000 (100%)
Downloaded 800 (80%)
Did key activity 400 (40%)
Purchased 100 (10%)
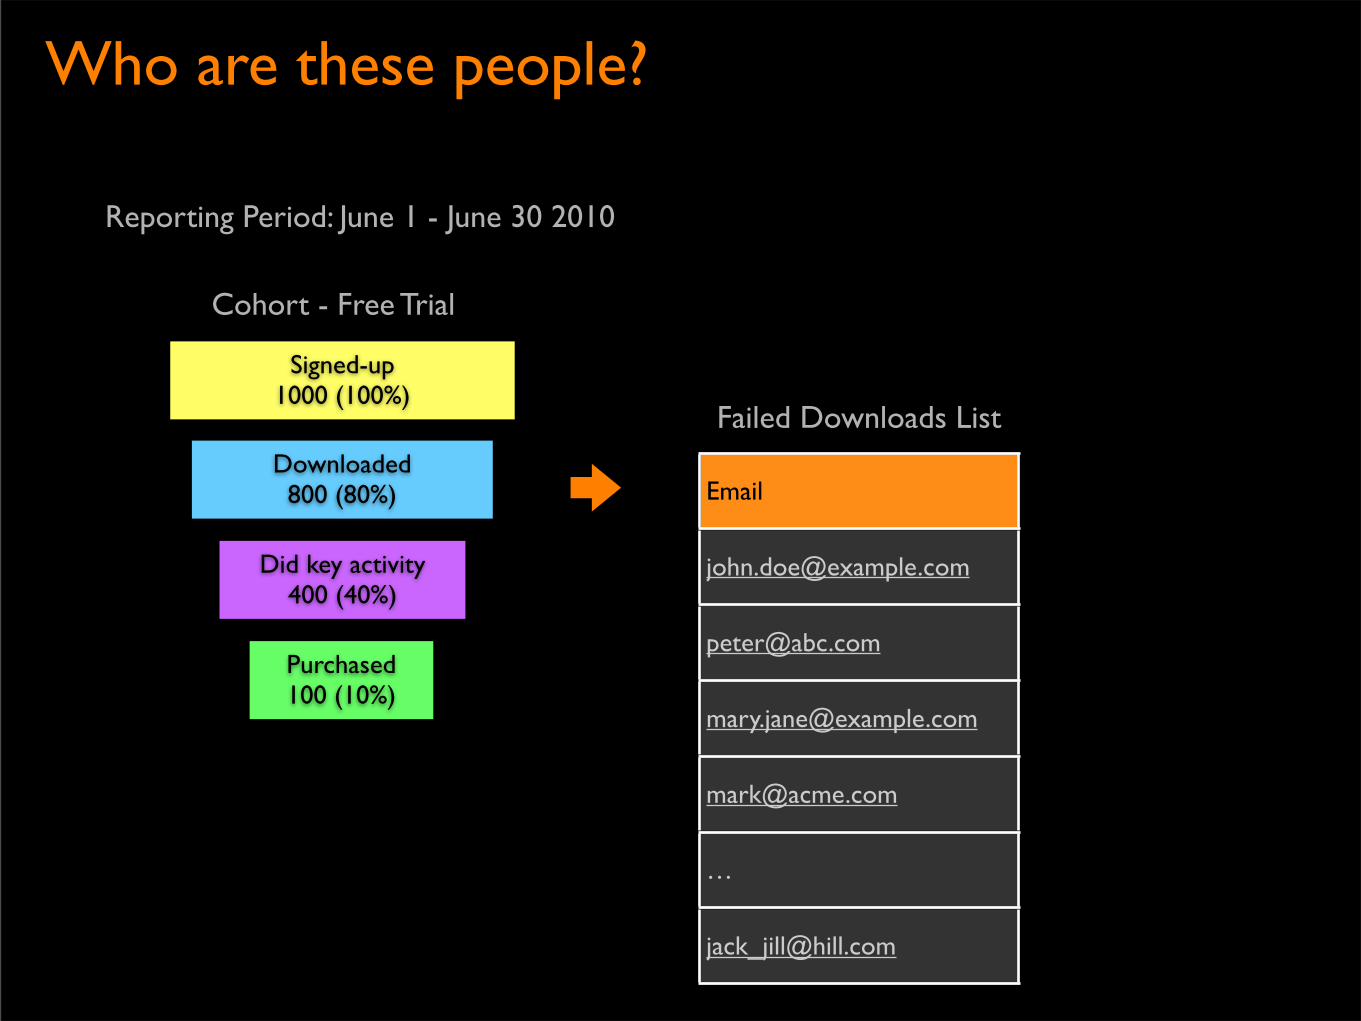
Reporting Period: June 1 - June 30 2010
…
Failed Downloads List
How do I create these reports?

3rd Party Tools versus Homegrown
3rd PartyFunnel
AnalysisRetention Cohorts
FunnelCohorts
Metrics to People
KISSMetrics Ad-hoc No No Not easy
MixPanel Static Yes No Not easy
Google Analytics
Static/Limited No No No

3rd Party Tools versus Homegrown
3rd PartyFunnel
AnalysisRetention Cohorts
FunnelCohorts
Metrics to People
KISSMetrics Ad-hoc No No Not easy
MixPanel Static Yes No Not easy
Google Analytics
Static/Limited No No No
Homegrown Comments
Index Cards Manual and time consuming process
SQL + Excel Complex queries and pivot tables
Events Database Separate database plus additional code
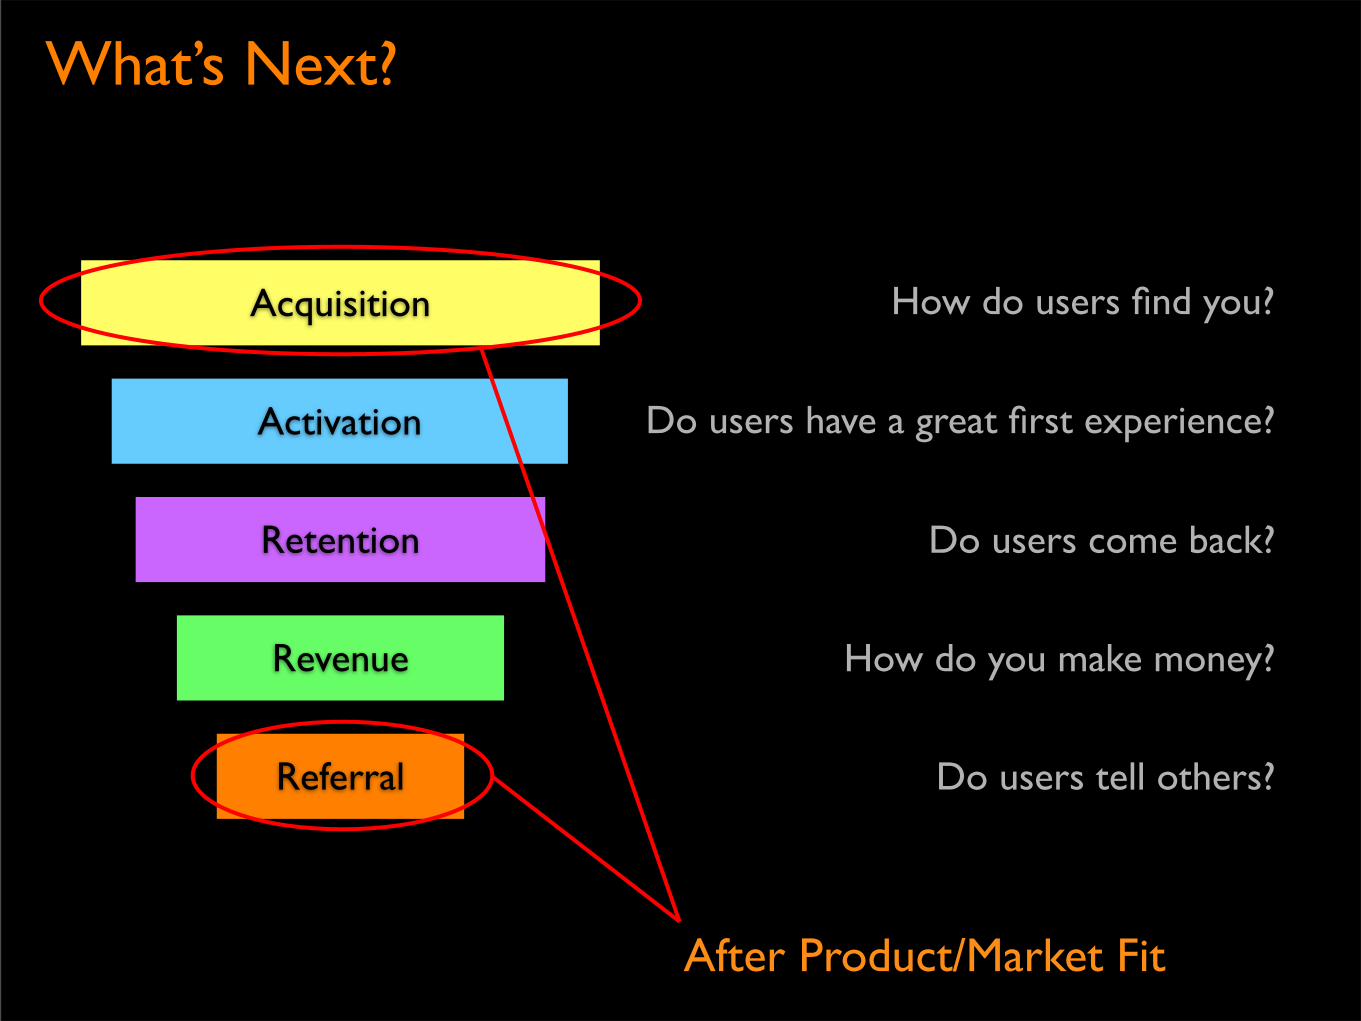
What’s Next?
Acquisition
Activation
Retention
Revenue
Referral
How do users find you?
Do users have a great first experience?
Do users come back?
How do you make money?
Do users tell others?
After Product/Market Fit