activated carbon from north dakota lignite
TRANSCRIPT

University of North DakotaUND Scholarly Commons
Theses and Dissertations Theses, Dissertations, and Senior Projects
2-1-1970
Activated Carbon from North Dakota LigniteJohn R. McNally
Follow this and additional works at: https://commons.und.edu/theses
This Thesis is brought to you for free and open access by the Theses, Dissertations, and Senior Projects at UND Scholarly Commons. It has beenaccepted for inclusion in Theses and Dissertations by an authorized administrator of UND Scholarly Commons. For more information, please [email protected].
Recommended CitationMcNally, John R., "Activated Carbon from North Dakota Lignite" (1970). Theses and Dissertations. 609.https://commons.und.edu/theses/609

ACTIVATED CARBON FROM
NORTH DAKOTA LIGNITE
by
John R0 McNally Bachelor of Science,
University of North Dakota 1968
A ThesisSubmitted to the Faculty
of theUniversity of North Dakota
in partia l fulfillm ent of the requirements for the degree of Master of Science
Grand Forkss North Dakota
February1970

This Thesis submitted by John R0 MeNally in partia l fulfillment of the requirements for the degree of Master of Science from the University of North Dakota is hereby approved by the Faculty Advisory Committee under whom the work has been done0
/s/ Wayne R. Kube "T5h airman]
/s/ Robert C. Ellman
/sf Thomas J. C lifford
/s/ A. Wo Johnson Dean of the Graduate School
i i

< 1 ^q O
Title Activated Carbon from
Department Chemical Engineering
Degree Master of Science
Permission
North Dakota Lignite
In presenting this thesis in partia l fulfillment of the requirments for a graduate degree from the University of North Dakota* I agree that the Library of this University shall make it freely available for inspection,, I further agree that permission for extensive copying for scholarly purposes may be granted by the professor who supervised my thesis work or* in his absence, by the Chairman of the Department or the Dean of the Graduate School, It is understood that any copyirg or publication or other use of this thesis or part thereof for f i naneial gain shall not be allowed without my written permission. It is also understood that due recognition shall be given to me and to the University of North Dakota in any scholarly use which may be made of any material in my thesis.
Signature Is/ John R. McNally
Date . September. 12 ,,, 1,969..
i i i
563750

ACKNOWLEDGEMENTS
The author wishes to express appreciation to the United States Department of Interior, Bureau of Mines, Grand Forks, North Dakota, and the University of North Dakota, Grand Forks, North Dakota, for the fellowship un4et which this work was done.
The author also wishes to express his appreciation to Professor W. R, Kube, Robert C„ Ellman, and Dean T. J, C lifford for their patience and guidance throughout this investigation.
Special acknowledgement is given to Mr, R. Porter for his aid in assembling a workable apparatus, and to Messrs. J. Larsien, C. Freidt, and P. Hattern for their assistance in constructing this apparatus.
The author wishes to thank Mr. Donald J. Winge and Mr. Francis Schanilec for work done on illustrations and Misses Lois Voelker and Rosemary Honek for typing this thesis, and the other employees of the Bureau of Mines who assisted in this investigation.
i v

TABLE OF CONTENTS
> 0 0 0 0 0 0 0 0 0 0 0 0 0 0 0 0 0 0 0 0 0 0 0 0 0 0 0 0 0 0 0 0 0 0 0 0 0 0 0 0 0 0 0 0 0 0 0
> 0 0 0 0 0 0 0 0 0 0 0 0 0 0 0 0 0 0 0 0 0 0 0 0 0 0 0 0 0 0 0 0 0 0 0 0 0 0 0 0 0 0 0 0 0 0 0 0 0
• o o o o o o o o o o o o o o o o o o o o o o o o o o o o o o o o o o o o o o o o o o o o o o o o o o o o o o o
o o o o o o o o o o o o o o o o o o o o o o o o o o o o o o o o o o o o o o o o o o o o
* 0 0 0 0 0 0 0 0 0 0 0 0 0 0 0 0 0 0 0 0 0 0 0 0 0 0 0 0 0
ACKNOWLEDGEMENTS,
LIST OF TABLES,
LIST OF ILLUSTRATIONS,,00000000000000000000000000000000000000000
ABSTRACT,
INTRODUCTIONo 0 0 0 0 0 0
HISTORICAL AND GENERAL INFORMATION,
THEORETICAL ASPECTS OF ACTIVATING CARBON00000000000000000000000
METHODS OF ANALYSIS00000000000000000000000000000000000000000000
EQUIPMENT DESIGN00000000000000000000000000000000000000000000000
Superheated steam generator Reactor heater Fluidized bed reactor Charging device Product collection
OPERATING PROCEDUREo O O O O O O O O O O O O O O O O O O O O O O O O O O O O O O O O O O O O O O O O O O O
MATERIALS TESTED00000000000000000000000000000000000000000000000
ANALYSIS OI1 ACTIVITY -OF PRODUCT 00000000000000000000000000000
Iodine adsorption test Colorimeter test
DESIGN OF EXPERIMENT o o o o o o o e o o o o e o o o o o o o o o o o o o o o o o o o o o o o o o o o o o o
RESULTS AND DISCUSSION o o o o o o o o o o o o e e o o o o o o o o o o o o o o o o o o o o o o o o o e o
CONCLUSIONS o e o o o o o o o o e o o o o o o o o o o o o o o e o o o o o o o e o o o o o o o o o o o o o o o e e o
RECOMMENDATIONS o o o o o o o o o o o o o o o o o o o o o o o o o o o o o o e o e o o o o o o o o o o o o o o o
APPENDIX Ao 0000000000000000000000000000000000000000000000000000
APPENDIX B o O O O O O O O O O O O O O O O O O O O O O O O O O O O O O O O O O O O O O O O O O O O O O O O O O O O O
BIBLIOGRAPHY O O O O O O O O O O O O O O O O O O O O O O O O O O O O O O O O O O O O O O O O O O O O O O O O O O O
iv
vi
vi
viii
1
1
2
4
4
9
9
13
15
15
29
29
31
35
45
V

LIS T OP TABLES
Table
O O O O O O O O O O O O O O O O O O O O l
► o o o o o o o o o o o o o <
1 Analysis of Beulah lign ite and eharc
2 Latin square design and level of variablesc
3 Two-way classification design and levels of variables,,,
it Analysis of variance for iodine test— Latin squared e S 1 g n O O O O O O O O O O O O 0 O O O O O O 0 O 0 O O O O O O O 0 O O O O O 0 O 0 O O 0 0 O O O 0 O O O l
5 Analysis of variance for colorimeter test— LatinSquare desxgno o o o o o o o o o o o o o o o o o o o o o o o o o o o o o o o o o o o o o o o o o ,
6 Analysis of variance for iodine test— two-wayclassifxcation designoooooooooooooooeoooooo,ooooooooooo<
7 Analysis of variance for colorimeter test—two-wayc l a s s X f i C a t X O n d e s i g n 0 , 0 0 0 0 0 0 0 0 0 , 0 , 0 0 0 0 0 0 0 0 0 0 0 0 0 0 0 0 0 0 0 0 ,
» o o o o o o o o o o o o o o o o o o o o o o o o o o o o o o o o o o o o o o o o <
■ o o o o o o o o o o o o o o o o o o o o o o <
8 Summary of data,
9 Data and calculations for table H,
10 Data and calculations for table 5.,
11 Data and calculations for table 6 0
12 Data and calculations for table 7ooooooooooo,oooooooooo,
' O O O O O O O O O O O O O O Q O O O O O O O <
' O O O O O O O O O O O O O O O O O O O O O O *
o o o o o o o o o o o o o o o o i
LIST OF ILLUSTRATIONSFigure
1 Details of superheated steam generator,,
2 Details of reactor heater00000000000, 00000000000000000,
3 Details of fluidized bed reactor,, , , , , , , , o, , o, , , o , , , , , , ,
U Details of charging device,,
5 Details of cyclone and product receiver,
6 Equipment flow diagram,
7 Results of iodine test for Latin square d e s i g n , ,
i o o o o o o e o o o o o o o o 0 o « o o o o o o o o o <
e o o o o e o o o o o o o o e i
l o o o o o o o o o o o o o o o o o o o e o o e o o o o o o o o o '
Page
,o 13
,, 16
,, 17
,, 21,, 23
., 25
,, 28
0 0 31
oo 35
o o 38
OO 41
.0 43
9 0 6
, , 7
o o 8
.. 10
.. 11
•• 12 •• 18
v i

LIST OF ILLUSTRATIONS Continued
Figure Page
8 Results of iodine test for Latin square de s ign , . . . . . . , . 19
9 Results of colorimeter'test for Latin square d e s i g n . . 22
10 Results of iodine test for two-way classificationdesign.. . . . . . . . . . . . . . . . . . . . . . . . . . . . . . . . . . . . . . . . . . . . . . . . 24
11 Results of colorimeter test for two-way classificationdesign.. . . . . . . . . . . . . . . . . . . . . . . . . . . . . . . . . . . . . . . . . . . . . . . . 27
v i i

A B S T M C T
Activated carbon was produced by reacting lignite char with steam in a fluidi£ed°bed reactor which was designed and constructed for this study. Effects of three variablesp temperature j, residence time and particle si^e^, at four levels were studied statistica lly using a Latin square design. When the analysis of variance indicated that only two of the variabless temperature and residence time; were significant^, a two-way classification design was used to investigate optimum activation conditions.
Activated carbon with adsorptive powers which were equal to or superior to Darco active carbon^ as shown by the iodine test and the color adsorption test; were produced in this study. The best active carbons had an iodine adsorption of ,725 grams per gram of carbon while Darco was only ,55 grams of iodine per gram of carbon, Darco removed only 4 percent of the color from a stock solution of malachite green indicator while many of the products of this investigation removed 75 to 85 percent.
The analysis of variance of the results of the two designs used indicate that the effects of residence time between 6 minutes to 24 minutes is greater than that of temperature from 1450® F to 1750a F,
v i i i

1
INTRODUCTION
An economical process for the production of activated carbon from lign ite would be advantageous to the State of North Dakota which has abundant deposits of lign ite but only a limited market. Between 1910 and 196 29 the last year for which data was available, the consumption of activated carbon has risen from X09000 to 65,000 tons per year,-*- The increased emphasis on pollution and environment control w ill create an even greater demand in the future. The value of 65,000 tons of activated carbon was approximately $32 million in 196 2 ,
Heat and mass transfer characteristics indicate that a fluidized bed could he used in activating lign ite with steam, Thelen^ and Singh^ attempted to produce activated carbon in a partia lly fluidized bed withsome success, but they did not investigate one of the important variables, residence time. Some of their carbons compared favorably with Dareo, an activated carbon made from Texas lign ite by the Atlas Chemical Company8 for gas adsorption, but no attempt was made to test for liquid system adsorption.
The present study is concerned with steam activation of a char derived from North Dakota lign ite in a true fluidized bed with emphasis on the effects residence time, particle size, and temperature have on activity of the carbon in a liquid system. It was also desired that the equipment be viable enough that later workers could continue the study,
HISTORICAL AND GENERAL INFORMATION
In the past8 adsorbent carbonaceous materials have been referred to as decolorizing carbon9 bone ehars blood char, coconut char, as well as by various trade names, 11 Such nomenclature came about by the association with the function the carbon performed or by the source of raw material. At the present time, any specially prepared carbonaceous material which has significant adsorptive properties is referred to as active carbon or activated carbon.
According to Hassler,^ Scheele discovered the ab ility of carbon to adsorb gases in 1773, and Lowitz, in 1785, observed that charcoal would decolorize many solutions, but activated carbon was not commercially important until l808„ In that year activated carbon was used to c larify beet sugar. From 1808 until 1915 nearly a l l research was directed toward finding a better carbon for sugar decolorization. During World War I , the use of chlorine gas prompted research that led not only to gas masks but also to development of gas adsorbing activated carbon for research and industry.
1

1
3o Processes depending solely on heat to eliminate the hydro- carbons. This process, when carried out in the absence of a ir , is called carbonization,,
h0 Processes depending on selective oxidation to break down and remove the hydrocarbons and later to increase the porosity of the carbon,
Todays only selective oxidation and the action of metallic chlorides are vised extensively9 although carbonization is used to prepare material, such as lign ite , for activation, Hassler^ points out that zinc, calcium and magnesium chlorides are used primarily to improve the decolorization ab ility of the carbon while selective oxidation enhances the ab ility of the carbon to adsorb gases, color or odor, or any combination of the three depending on the combination of startine materials, pretreatment, and method of activation.
Generally, the metal chlorides are used by mixing the carbonaceous material with the salt and then wetting thoroughly with water. This mixture is then dried and carbonized p+ temperatures between 800° and 1,200° F. The product is then washed to remove excess salts and activated with steam or some other oxidizing gas.
In addition to the effect of starting material, the adsorptive powers of an active carbon which have been produced by oxidation are influenced bys -̂5
1. The chemical nature and concentration of the oxidizing gas;
2. The temperature of the reaction;
3. The reaction time; and
h0 Presence of minerals in the material.
Some of the more common oxidizing gases for activation are steam, carbon dioxide and oxygen, which are passed over, through, around or released from a compound added to the material to be activated. Steam is the mdst commonly used of the oxidizing gases. Active carbon has been produced from lign ite and other materials by contacting it with steam using various schemes. The reactions, which are endothermic and occur at appreciable rates only at high temperatures, are%
H2° - h2 + CO H . -569UOO-£^_- g Mole
2H20 - C02 + 2H2 H » -38,750 calg Mole
3

necessary to construct a device to heat the reactor„ A product collection system and a charging device were necessary also0 A ll of the temperatures were measured by ehromel-alumel thermocouples and recorded by a four point Bristol recorder,, A description of the various pieces of equipment follows o
Superheated Steam Generator - It was necessary to deliver steam at l s900s FJtothe reactor "to'activate char at 1,750° F0 This was accomplished using a pair of gas heated coils followed in series by an electrically-heated furnace0 Steam was superheated using gas-fired burners to 900° F in the f irs t two coils and to 1,900° F in the electric furnace,, A reciprocal pump, which was calibrated and set to deliver 2„2 pounds per hour, was used to feed the steam generator, and a 10 amp powerstat was used to control the temperature□ A schematic drawing of the steam heating system is shown in figure 1 „
Reactor Heater = A heater which was capable of maintaining a reactor temperature of at least 1,750° F was needed,, The heat requirements, which included a l l radiation, convection, and conduction losses as well as any heat energy used by the reaction, were estimated to be less than i*-kw„ It was found that the heater, which had a power capability of 6-kw, was more than adequate,, The heat was provided by passing e lectrical current through four silicon carbide resistance bars,, These bars were contained in a well-insulated box, and two 25 amp powerstats were used to control the temperatures.
An electrical resistance wire heating system was originally used, but was abandoned after operating d ifficu lties became apparent.
Fluidized Bed Reactor - A 30 inch section of three-inch O.D. stainless steel pipe formed the reactor body,, A one-inch sintered alumina plate was imbedded in the walls of the reactor about one and one ha lf inches above the bottom,. This served to disperse the entering steam evenly over the bed to promote fluidization,, There were three openings in the bottom chamber, one for the superheated steam, one for inert gas, and one for a thermocouple which was just below the alumina plateo A thermocouple extended from the top of the reactor to within one inch of the alumina p late„ This thermocouple was adjustable to any desired height above the plate to make possible a temperature pro file of the fluidized bed„ The thermocouple was also removable, since i t entered the reactor through the reactor feed port. Details are given in figure 3o
Charging Device - A method of charging 400 grams of heated char quickly and effic iently was required. The following device worked s at i s f act or i ly „
5

/ Reciprocal pump2 f od Stainless steel tube3 Steam generator4 Steam superheater5 Fisher burner6 Rock wool insulation
Fig I Details of superheated steam generator

7
c '» „4 - f x 41 Silicon carbide heatingbars, 2 on each side connected in series.Infrax brick insulation
25 amp powerstat
powerstat
Fig 2 Details of reactor heater.

8
*» To temperature recorder
//— ... = -* — From superheated steamgenerator
2
/ Stainless steel reactor, 3" o d2 Stainless steel tube,3 Adjustable thermocouple4 Sintered alumina plate, l" thick5 Thermocouple
= - * — N2 (pressurized) To temperature recorder
Fig 3 Details of fluidized bed reactor.
®|O
J

A two=dneh 0,D„ steel pipe was fitted with a cover and a nipple as shown in figure A threaded bottom with a 23~ineh section of three fourths inch 0,C, stainless steel tube was attached., When the charger was attached to the top of the reactor and a pressurized nitrogen line attached to the nipple * 1+00 grams of char could be charged in about 20 seconds0
Product Collection - The product was collected from the reactor by applying nitrogen pressure in the chamber below the sintered alumina plateo A high flow of nitrogen through the reaction zone carried the product out of the reactor into a cyclone separator., The separator allowed the gases to pass to the atmosphere while the solids f e l l into the collection chamber,, Details can be seen on figure 5°
OPERATING PROCEDURE
The steam generators and the reactor heater were started about 2k hours before the tests were to be run. The temperatures were raised slowly over that period of time to 1*700® F, When they reached 1*700° F, the reciprocal pump and the steam preheaters were started. The system was then allowed to heat until the steam in the reaction chamber was about 170° F higher than the desired reaction temperature and the system was stabilized. At 1*700° F* the linear flow rate of steam in the reactor was about ,31 ft per second. This velocity went up or down with temperature differences, since the mass of steam fed was held constant.
To charge the reactor* the flow of steam was stopped* the thermocouple was removed* and the charger installed. After the valve of the charger was opened* a steel rod was used to tap the sides to prevent material from clinging to the walls. The charger was then removed* the thermocouple replaced* the feed pump turned on* and time measurements were begun.
During charging* about 10 percent of the material was blown out of the bed by steam and vo latile matter released from the char. This material was immediately removed from the collection chamber so that it would not he mixed with the product. Generally* the bed temperature would reach the desired value by the time the collection chamber had been emptied. It then took only slight changes to the power supply to achieve uniform control of temperature. When the run was completed* nitrogen pressure was applied to the bottom to carry the product to the cyclone* which had been previously purged with nitrogen. The product was collected and placed in sealed jars to cool and await testing, A flow diagram is shown in figure 6 ,
MATERIALS TESTED
A char* which had been produced by carbonizing Beulah lign ite
9

N2 pressure
CM
/2345
Removable cap Charging chamber Gate valve Threaded cap3 11f o d Stainless steel tube
Fig 4 Details of charging device.

Gases out
Fig 5 Details of cyclone and product receiver.

/23456
Steam generator Steam superheater Reactor heater Reactor CycloneProduct receiver
Water in
Superheated steam
Fig 6 Equipment flow diagram.
Gases to atmosphere

at approximately 1,200° F, in an entrainment type earbonizer, was used as the starting materials for a l l tests„ The proximate analysis of lign ite and the char follows„
TABLE 1Analysis o f Beulah lign ite and char, percent
ash moisture volatile matter fixed carbon
Beulahlign ite 6.6 3 6,6 26.6 30.1
char 16.9 1 . 8 16.3 65.0
The char was screened into four different size fractions for use in the f ir s t design, but only one size was used in the second design.
Before charging, each char sample was heated at 500° F for 1 hour to remove any moisture that may have been adsorbed during storage and handling. In addition, the temperature d ifferentia l between the char and the heated reactor was reduced somewhat.
ANALYSIS OF ACTIVITY OF PRODUCT
As liquid system carbons were to be the product, two liquid system tests were selected to evaluate activity. The iodine adsorption test-*-9 and the colorimeter t e s t ,^ using malachite green, were chosen. The iodine test gives a good indication of an active carbon8s odor adsorbing capacity and the colorimeter test determines its decolonization ab ility .
Iodine Adsorption Test - A stock solution of iodine containing 2 .7 grams of iodine and U .l grams of potassium iodide per lit e r of solution was prepared. Actual concentration was determined and frequently checked by titrating , using sodium thiosulfate with a starch indicator.The reaction iss
2 S203= + I 3~ - SU06- + 31"
with the I “ complexing with the starch to form a deep blue color which gives a sharp end point when the I 3~ disappears.
Three weighed samples of each carbon were added to different erlenmeyer flasks each containing 100 ml. of stock iodine solution.These samples were 1 g, ,6 g, and ,2 g respectively. The flasks were then shaken for five minutes and the mixture filte red through
13

Colorimeter Test - One l it e r of absolute ethanol was mixed with ,86 grams of malachite green indicator. This mixture was then divided into 50 ml<> aliquots and placed in 250 ml, erlenmeyer flasks. One gram of carbon product was added to one of the flasks and the flask was shaken for 20 minutes. The solution was then filte red through 12 cm No, 5 Whatman f i l t e r paper. Each filtra te was then tested using a Bausch and Lombs Spectronic colorimeter for light transmission at U82 millimicrons. These data are shown in appendix A9 table 8 , and in figures 9 and 1 1 ,
DESIGN OF EXPERIMENT
A Latin square is an experimental design used to determine which variables are significant in relatively few tests* and is usually used in preliminary testing to screen variables. The analysis of variance of the Latin square design only shows i f a variable affects the results, not how. The advantage of this design is that three variables can be tested in the same number of tests as two variables* and an experimental error term is obtained having sufficient degrees of freedom to establish a reasonable c ritica l mF” value at the significance level chosen. This design and subsequent calculations are discussed by Wine. 22
The design showing the levels of variables for the f ir s t series of tests is shown in table 2 ,
Results from the original Latin square design was used to indicate the significant variables and levels that give optimum test conditions. Another test series was run to establish the best levels of the two variables found to be significant. This series was run using a two-way, three-level c lassification ,2 ̂ The design and levels are shown in table 3,
RESULTS AND DISCUSSION
Figures 7 and 8 indicate that three of the active carbons produced during the f ir s t series had isotherms which were above the Darco isotherm. These carbons were prepared at 1,1*50° F and 2h minutes residence time, as shown on figure 7; and 1,750° F and 20 minutes, and 1,750° and 2k minutes residence time as shown in figure 8 . A ll three of these carbons appear, from the plots, to be better than Darco, especially at lower concentrations. Raw lign ite and lign ite char had isotherms which were much lower than Darco or the active carbons produced during this study. The char isotherm is shown in figures 7 and 8 while the raw lign ite isotherm is not shown because i t is so low.
15

I
TABLE 3Two-way classification design and levels of variables
RowVariable Column Variable (Temperature,, °F )Residence Time* Min. 1650 1700 1750
16 1 k 7
20 2 5 8
2k 3 6 9
A ll tests were run with ->28 + HO char particle size.►
17

ABS
OR
PTIO
N ,
gra
ms
of
iodi
ne
per
gram
of
car
bon
18
.01 .1 1.0 1.5
IO D IN E CO N CEN TRATIO N , grams per liter
Fig. 7.--Results of iodine test for Latin square design grouped bytem peratures.

ABS
OR
PTIO
N ,
gr
ams
of
iodi
ne
per
gram
of
car
bon
19
Fig. 8.--Results of iodine test for Latin square design grouped bytem peratures.

Figures 7 and 8 also indicate that activ ity„ as measured by the iodine adsorption te s t9 increases with increasing temperature and increasing residence time. This observation is confirmed by the statistica l analysis of variance which is shown in table **, The table shows that the effects of temperature and o f residence time were significant in the 95 percent confidence interval while the effects of^partiele size were insignificant. The value of is greater than ° indicating that residence time has a greater affect than temperature. The data used and the calculations made for this analysis are shown in appendix B9 table 9°
Total suns for particle size indicate that activity is somewhat influenced by particle s lz e 8 but analysis of variance does not confirm this observation at the 95 percent confidence interval. It is possible that there is some effects, which did not show in the present tests because of the limited degrees of freedom making it d ifficu lt to indicate a small effect. Additional testing might indicate significances, but the effect is small in comparison to that of the other variables.
The three results o f the colorimeter test shown in figure 9 agree with the results depicted in figures 7 and 8 , A general increase in transmittance as either temperature or residence time increased was noted. A ll of the carbons produced at temperatures greater than 15,650° F or at residence times longer than 12 minutes were superior to Darco for decolorization purposes.
An analysis of variance9 as shown in table 59 agrees with the observations made about figure 9, It shows that9 while particle size was insignificant9 temperature was significant in the 95 percent confidence interval and residence time was significant at the 99 percent confidence interval9 and again residence time had the greater
As a result of analysis of variance9 particle size was omitted as a variable in the second design. Temperature and residence time were studied at higher residence temperatures and longer residence times as these conditions were indicated to give the best activity.
Figure 10 shows the results of the second series of tests as measured by the iodine adsorption test. These plots do not indicate any definite trend as far as temperatures are concerned9 even though the changes were statistica lly significant. There does seem to be a relationship between residence time and activity.
The analysis of variance in table 6 shows significance at the 95 percent confidence interval and residence time at the 99 percent confidence interval. A ll of the carbon produced at residence times greater than 16 minutes surpassed Darco in iodine adsorption at some concentration. Several were superior to Darco at a l l concentrations.
20

TR
AN
SMIT
TA
NC
E, p
erce
nt2 2
1 0 0
80
60 -
4 0 -
20
• Darco Residence time orSi Starting char • tem perature not▲ Stock applicable.o 1750 ° Fo 1650 ° F /A 1550 ° F i
/□ 1450 ° F
_L
0 6 12 18 24
R E S ID E N C E T IM E , minutes
30
Fig. 9 .--Results of colorim eter test for Latin square design.

TABLE 5A n a ly s is o f v a r ia n c e
F or c o lo r im e te r t e s t = L a t i n sq u a re d e s ig n
Source D of F M,S, Feale F.05(396)26 F. o i( 3 96 )
h3
f
1 o 1
^
f o
j
1,856.19 3 618.73 5 o22 1+.76 9.78
Residence Time (R) 5s6Q2,72 3 1,867.57 15o75 U0j 6 9o78
Particle Size (Tr) 2^3o19 3 81.06 0 o\ 00 U.76 9.78
Error 711o3i+ 6 118.55 QBXacws>s=:
Total 8 9 H l 3 o M + 1 5

ABS
OR
PTIO
N24
Fig. IO.--Results of iodine test for two-way c la ss ifica tion designgrouped by tem peratures.

TABLE 6A n a ly s is o f v a r ia n c e
f o r io d in e t e s t - « t v o -v a y c l a s s i f i c a t i o n d e s ign A '
Source SoS, D of P M.S, Fcalc F,05(2sU)28 F,0lC2 ,U)29o2
1
Temperature(co l) .78 2 ,39 9 ,18 6,9U 18,0 . 1 2 x 10~2
Residence time (row) 9 067 2 U,8U 113,88 6,9^ 18 ,0
- -2 1,60 x 10
Error ,17 k .0U25
Total 10,62 b
1/ Data values x 10,

TR
AN
SMIT
TA
NC
E,
perc
ent
i
27
Fig. II.--Results of co lo rim eter test for two-way classification design.

TABLE 7A n a ly s is o f v a r ia n c e
f o r c o lo r im e te r— tw o-w ay c l a s s i f i c a t i o n d e s ig n
Source S o S o D of F M.S. P.a l=F 30
»°5(294)F 31
. q i (2 ,it ro 2
i
Temperature(co l) 13.6 2 7.8 .28 6.94 18 .0
Residence time (Row! 357.6 2 17 8 ,8 6,43 6,94 18 ,0 50.6
Error 108, ̂ It 27,1
Total 47 9.6 8 .

size on activity,, Optimum conditions of each should be determined,
(5) Activating lign ite below the indicated optimum temperature, but for longer residence times should be attempted,
( 6 ) Differences in the ab ility of coal ftrom different mines to be activated should be studied.
(7) Steam is not the only activating gas. Oxygen, carbon dioxide, and a ir should be used as activating agents.
( 8 ) Pre-treatment of carbons with metalic chlorides often affects the product. This could be tried on lign ite .
(9) An attempt should be made to activate raw lignite and dried lign ite .
i
30

TABLE 8 con tin ued
Residence & I 2 PercentRun Carbon Activation Time s Particle Percent Percent g carbon ColorNo, NOo Tempo Minutes Size Ash Moisture at ,3 g/1 Removed
1 5 1550 6 =20 + 28 10„22 6o78 0ol90 3
1 6 1550 12 =28 + Ho 23o 36 5=19 »220 10
1 7 1550 18 -Ho + 50 25 = 22 7=92 = 3H5 37 «
1 8 1550 2k -6 + 20 31=51 3 = 65 oH05 H7
1 9 1650 6 =28 + HO 23=66 5 = 12 = 255 H
1 10 I 65O 12 =Ho + 50 280H7 Ho 89 = 395 32
1 11 1650 18 -6 + 20 26o 73 1,17 = 280 30
1 12 1650 2k -20 + 28 29 = 01 3=3H .H20 67

TABLE 8 con tin u ed
RunNo.
CarbonNo,
ActivationTemp,
ResidenceTime9
MinutesParticle
SizePercent
AshPercent
Moisture
« Z2 g carbon at ,3 g/1
PercentColor
Removed
2 5 1700 20 -28 + 1+0 36,22 ,78 0,550 73
2 6 1700 2k -28 + »+0 29o36 1,19 ,660 85
2 7 1750 1 6 -28 + kO 1+3,22 1,92 ,i+6o 65
2 8 1750 20 -28 + 1+0 51,51 o G\ VJ1
o ■*=- H V
Jl 80
2 9 1750 2k -28 + 1+0 1+8,21 2,69 ,725 82
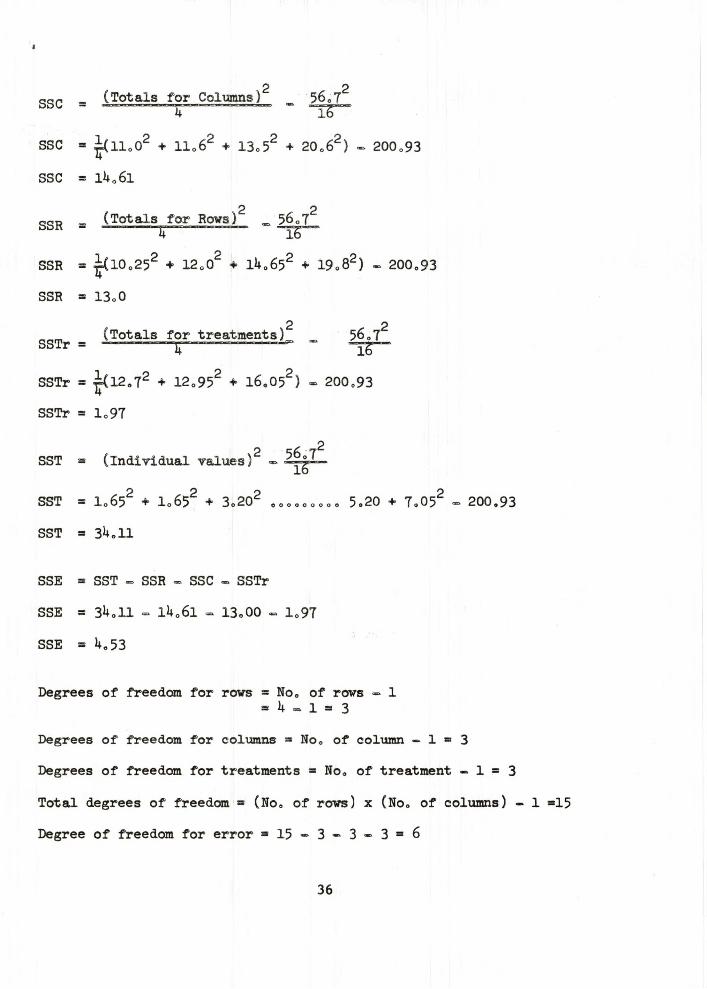
2 2_ (Totals for Columns) 56,7SSC - ........... -V---------------- ~ "T T “
SSC = ̂ ( l l .O 2 + l lo 6 2 + 13o52 + 20„62) - 200„93
SSC = lU .6 l
SSR =2 2(Totals for Rows) _ 5607
3T “l b ..
SSR = ^(10o252 + 12o02 + lU.652 + 19.82) - 200,93
SSR = 13o0
(Totals for treatments)!
. 2 . „ „ 2 ,
56,7"SSTr =
SSTr = ^(12.72 + 120952 + 16.052) - 200,93
SSTr = 1,97
t2SST = (individual values) 2 «
SST = 1o652 + 1o652 + 3,202 . . . . . . . . . 5,20 + 7,05 - 200.93
SST = 3U.11
SSE = SST - SSR - SSC - SSTr
SSE = 3U.11 - lit.61 - 13.00 - 1,97
SSE = U.53
Degrees of freedom for rows = No. of rows - 1- U - 1 - 3
Degrees of freedom for columns = No. of column - 1 = 3
Degrees of freedom for treatments = No. of treatment - 1 = 3
Total degrees of freedom = (No. of rows) x (No. of columns) - 1 =15
Degree of freedom for error = 1 5 - 3 - 3 * 3 = 6
36

TABLE 10 Data for table 5
RowVariable Column variable ( Temperature„ °F )Residence Time9 Min, 12*50 1550 1650 1750 Totals
6 2 3 k 30 39A B C D
12 3 10 32 16 6lB C D A
18 10 37 30 1*3 120c D A B
2k 38 U7 67 81 233D A B C
Totals 53 97 133 170 2+53
calculations for table 5 Total A = 2 + 2*7 + 30 + 16 = 95
Total B = 3 + 3 + 6 7 + ^ 3 =116
Total C - 10 + 10 + U + 81 =105
Total D = 38 + 37 + 32 + 30 = 137
BSC (temp) . l £ + 972 ♦ 1332 + 10T21*5 32~TT
2809 + 9^09 +17.689 + 28,900 . 12,825.56
= lU»68lo75 - 12s825<.56
SSC = 1,856.19
SSR = ^(392 + 6l2 + 1202 + 2332 ) - 12,825c56
38

4
a2 = 118.55
a2 = MSC - 2 = 6l8o73 - l l8 0 55 _C " T " **
a2 = MSR - 2 = 1,867o57 - ll8o53R !+ 4
125oOU
= 1+37o25
40

SSR = 302,08 - 292,1+1 = 9,67
SST = 15.21 + 33,64 + 38,44 + 18,49 + 42,25 + 43,56 + 21.16 + 37082 + 52„56 - 292,1+1
= 010,62
SSE = 10,72 - 9067 - ,78 = ,17
2
FR(calc)
* 4,84/„0425 » 113,88
F(̂ (calc) - .
° 2 = 4,25 x 10“^
1,2 x 10“ 3
42

SST = U.U89 + 5*1+76 + Us225
7*225 + 5*329 + 6,1+00
7*056 + 7*225 + 6 j2 k - 53*669,1+
= 5fc#ll+9 - 53*669,1+
= 1+79,6
SSE = 1+79,6 - 357,6 - 13,6
SSE = 108o 1+
2° = 27,1
44

20. Ib id a p. 321„
21, Daniels, R, K ,, and Alberty, F. Physical Chemistry,New Yorks John Wiley and Sons, Inc7, 1961, p, 610
22, Wine, R0 L0, Statistics for S c ie n tis ts and Engineers, Englewood C lif fs , New Jerseys Prentice Hall, Inc,, 1961+,
23. Ib id , p0 638,
2k. Ib id , p„ 6380
25. Ib id , p0 61+2,
26' Ib id , p. 638„
27o Ib id , p, 61+2,
28. Ib id , p. 638,
29. Ib id , p. 6h2„
30. Ib id , p, 638,
31. Ibid , p, 6k2.
p. 61+2,
46