active lives adult survey november 16/17 report
TRANSCRIPT
1
active livesadult survey
November 16/17report
Published March 2018

welcome contents
▪ Levels of activity
▪ Types of activity
▪ Volunteering
key information
This report presents data from the
Active Lives Adult Survey for the
period mid-November 2016 to mid-
November 2017. Data is presented
for adults aged 16+ in England.
release dates
This release: 22 March 2018
Next release: 11 October 2018
Find out moreFor further information on the data
presented in this report, please visit the
Active Lives section of our website.
3
10
12
2
Welcome to the third Active Lives Adult Survey Report summarising activity levels
in England from November 2016 to November 2017.
With only two full years of data it is too early to meaningfully talk about trends
over time, but based on these results, it is fair to say that the picture is one of
stability.
Alongside presenting the latest national picture of engagement in sport and
physical activity, we have included references to where there have been
statistically significant changes in the last year, which you will see indicated with
arrows. Where there is no change, or it is within the margin of error and therefore
too small to be confident there is a genuine difference, it is recorded as ‘no
change’.
The intention of this report is to give the big picture in an easily digestible format.
For those who want to explore the data further, there are links in this report to the
data tables. If you would like to carry out your own analysis of the data, I would
recommend you take a look at our Active Lives Analysis Tool, which can be found
at activelives.sportengland.org. The tool will enable you to explore the data and
focus on your own areas of interest.
Finally, the fourth Active Lives Adult Survey Report (May 2017 to 2018) will be
released in October 2018, when two full years of volunteering data will enable us
to draw comparisons and shed light on how levels of volunteering to support sport
and physical activity are changing.
Lisa O’Keefe
Insight Director
▪ Notes 18
▪ Local level data 16
▪ Definitions 17
▪ Wellbeing 14

3
levelsof activity
this chapter presents information on three levels of activity:
• inactive (less than 30
minutes a week)
• fairly active(30-149 minutes a week)
• active (at least 150
minutes a week)
definition
Note: We count most sport and physical activity, but exclude gardening.
However, Public Health England does include gardening in its local level
physical activity data. You can view the PHE data here. This will be
updated in early April to include the November 2016/17 data.
THE GRAPHICS BELOW SHOW THE ACTIVITIES WE INCLUDE – AND WHEN THEY COUNT (FOR ADULTS AGED 16+):
WHAT DO WE MEAN BY PHYSICAL ACTIVITY?

4
levels of activity
headlinesOur data shows that 6 in 10 adults (27.7m) are getting the health benefits from achieving 150+ minutes of activity a week.
12.5% 61.8%25.7%
25.7% of people (11.5M)do less than 30 minutes a week
12.5% (5.6M) are fairlyactive but don’t reach150 minutes a week
61.8% (27.7m) do 150 minutesor more a week

5
12-month comparisonActivity levels have not changed in the last 12 months.
levels of activity
how we measure changeActive Lives figures are based on the
response of 200,000 adults, which we
then scale up to provide an England-
wide picture. That means there will
naturally be small fluctuations when we
compare the figures we have now with
12 months ago.
In accordance with Government
Statistical Service good practice
guidance, we highlight changes within
the report where we are confident that
there are genuine differences. If the
data is showing only small differences
which are within the margin of error,
they are noted as “no change”.

6
levels of activity
socio-economic groupsOur data shows there are significant disparities between different socio-economic groups.
• People who are long term unemployed or have never worked (NS-SEC 8) are the most likely to be inactive (38%) and the least
likely to be active (49%)
• People who are in managerial, administrative and professional occupations (NS-SEC 1-2) are the least likely to be inactive (17%)
and the most likely to be active (71%).
There have been no changes compared to 12 months ago for any of these groups.
Note: Full details of what the NS-SEC categories mean can be found on the definitions page.

7
levels of activity
genderActivity levels have not changed
compared to 12 months ago for either
men or women, so we continue to
observe the same gap between them.
Men (64% or 14.0m) are more likely to
be active than women (60% or 13.7m).
8
levels of activity
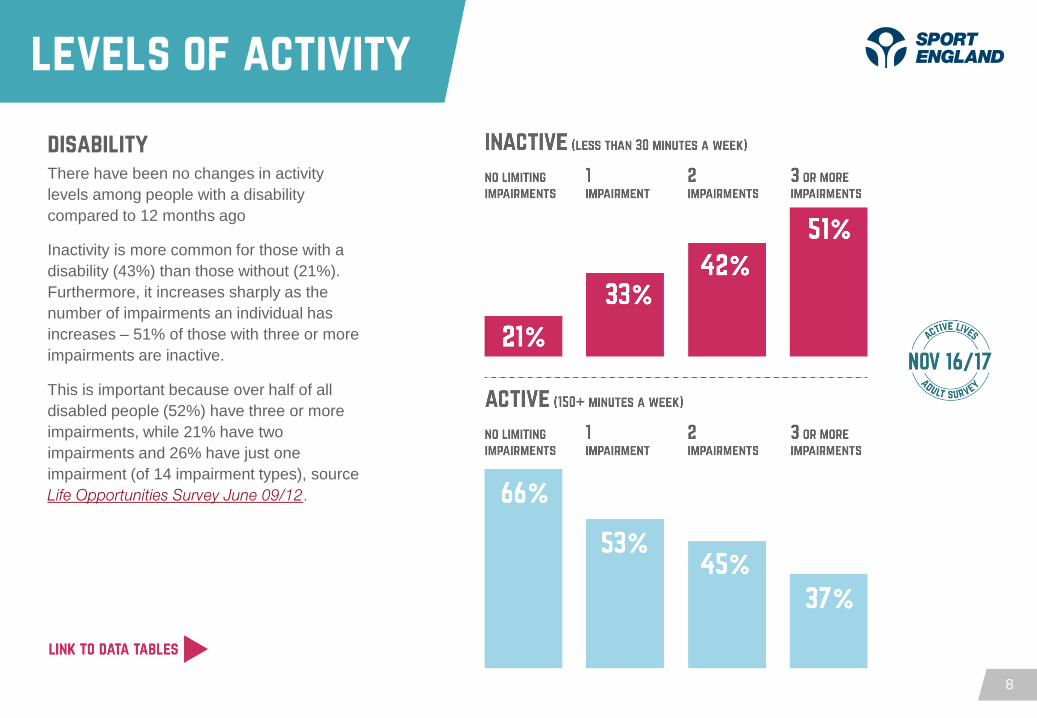
disabilityThere have been no changes in activity
levels among people with a disability
compared to 12 months ago
Inactivity is more common for those with a
disability (43%) than those without (21%).
Furthermore, it increases sharply as the
number of impairments an individual has
increases – 51% of those with three or more
impairments are inactive.
This is important because over half of all
disabled people (52%) have three or more
impairments, while 21% have two
impairments and 26% have just one
impairment (of 14 impairment types), source
Life Opportunities Survey June 09/12.

9
levels of activity
ageInactivity levels generally increase with age, but the sharpest increase comes between ages 75 and 84 (48%) and age 85+ (71%).
Whilst activity levels have fallen slightly among the two age groups covering 16-34 year olds, with fewer achieving 150+ minutes a
week, 75% of young people reman active.
In contrast, activity levels have increased slightly among the 55-64 and 65-74 age groups.
inactive (less than 30 minutes a week) active (150+ minutes a week)

10
types of activity
this chapter presents data broken down by activity group and looks at those who have participated at least twice in the last 28 days.
looking at participation at least twice in the last 28
days provides:
• an entry level view of participation overall
• a useful measure of engagement in different sports
and physical activities
• an understanding of the contribution of activities to
achievement of 150+ minutes a week
participation – our definition

11
Types of activity
adults achieving 150+ minutes of activity a week do so through a blend of activities
see the notes page for more details.
Whist overall activity levels
remain stable, we have seen
some changes in the amount
of people taking part in some
of these activities.
Analysis of numbers engaging in activities at least twice in the last 28 days helps us understand the
contribution of different activities.
12
Creating a lifelong sporting habit
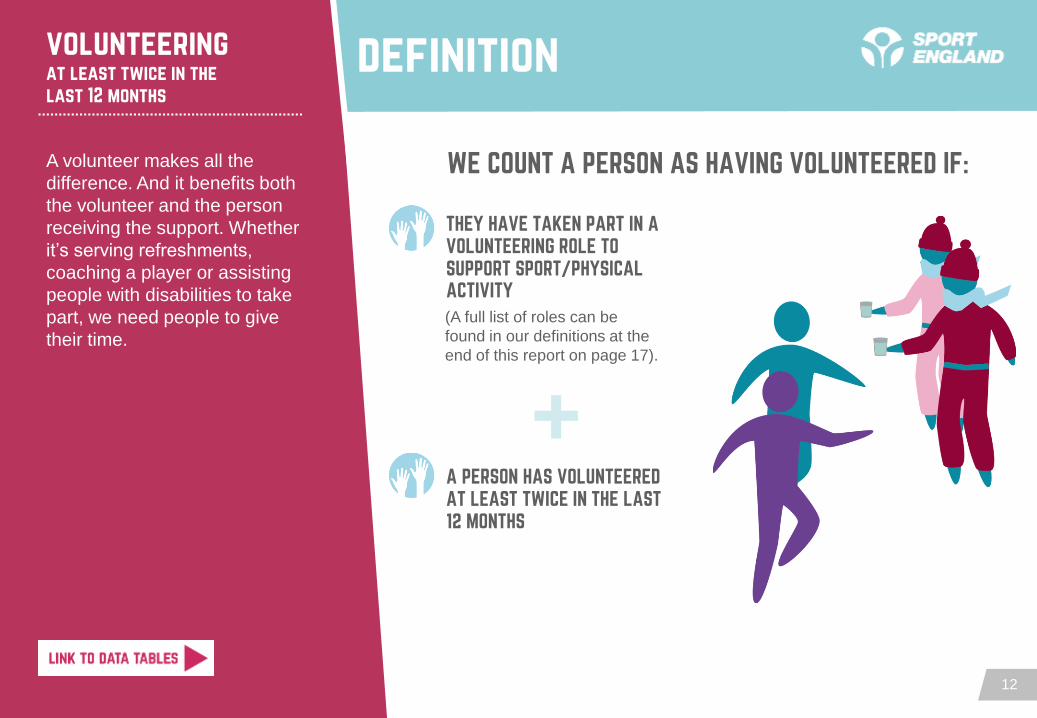
definitionvolunteering at least twice in thelast 12 months
A volunteer makes all the
difference. And it benefits both
the volunteer and the person
receiving the support. Whether
it’s serving refreshments,
coaching a player or assisting
people with disabilities to take
part, we need people to give
their time.
THEY HAVE TAKEN PART IN A VOLUNTEERING ROLE TO SUPPORT SPORT/PHYSICAL ACTIVITY
WE COUNT A PERSON AS HAVING VOLUNTEERED IF:
A PERSON HAS VOLUNTEERED AT LEAST TWICE IN THE LAST 12 MONTHS
(A full list of roles can be
found in our definitions at the
end of this report on page 17).

13
Further breakdowns on the profile
of volunteers can be found in the
data tables linked to this report
volunteering

14
Creating a lifelong sporting habit
definitionwellbeing, individual and community development
Data linked to the following
metrics for different levels of
engagement in sport and
physical activity can be found in
the data tables linked to this
report:
• Mental wellbeing
• Individual development
• Social and community
development

15
wellbeing, individual and community development
some activity is good, more is better
in terms of mental wellbeing
volunteering is positively associated
with individual development
Further breakdowns across all six metrics linked to both activity levels
and volunteering can be found in the data tables linked to this report

16
Data for local areas, including,
nine regions, 44 County Sports
Partnerships, and 353 local
authorities are available for the
following measures:
• levels of activity
• participating at least twice in the last 28 days
• volunteering at least twice in the last 12 months
Details of change in the last 12
months can be found in the tables.
Overall
local level data
activity across england

17
definitions moderate activity is defined as activity
where you raise your heart rate.
vigorous activity is where you’re out of
breath or are sweating (you may not be
able to say more than a few words
without pausing for breath).
NS-SEC groups are defined as:
• NS-SEC 1-2: Managerial,
administrative and professional
occupations (e.g. chief executive,
doctor, actor, journalist)
• NS-SEC 3: Intermediate
occupations (e.g. auxiliary nurse,
secretary)
• NS-SEC 4: Self employed and small
employers
• NS-SEC 5: Lower supervisory and
technical occupations (e.g. plumber,
gardener, train driver)
• NS-SEC 6-7: Semi-routine and
routine occupations (e.g. shop
assistant, bus driver)
• NS-SEC 8: Long term unemployed
or never worked
• NS-SEC 9: Students and other.
limiting disability is defined as an
individual reporting they have a
physical or mental health condition or
illness that has lasted or is expected to
last 12 months or more, and that this
has a substantial effect on their ability
to do normal daily activities.
volunteering roles are defined as:
• Provided transport: To help people
other than family members take part
in sport
• Coached or instructed: For an
individual or team(s) in a sport or
recreational physical activity (other
than solely for family members)
• Refereed, umpired, or officiated: At a
sports match, competition or event
• Administrative or committee role: For
a sports organisation, activity or
event (e.g. chairman, treasurer,
social secretary, first aider, welfare
officer)
• Stewarded or marshalled: At a
sports activity or event
• Provided any other help: For a sport
or recreational physical activity (e.g.
helping with refreshments, sports kit
or equipment).
Link to more information onmeasures and demographics

18
notes
link to more information onmeasures and demographics
the achieved sample was 198,911 (16+).
data have been weighted to Office for National Statistics (ONS) population measures for
geography and key demographics.
confidence intervals can be found in the linked tables. These indicate that if repeated
samples were taken and confidence intervals computed for each sample, 95% of the
intervals would contain the true value. Only significant differences are reported within
the commentary. Where results are reported as being the same for two groups, any
differences fall within the margin of error.
significance tests can be found in the linked tables. The tests indicate that if repeated
samples were taken, 95% of the time we would get similar findings, i.e. we can be
confident that the differences seen in our sampled respondents are reflective of the
population. When sample sizes are smaller, confidence intervals are larger, meaning
differences between estimates need to be greater to be considered statistically
significant.
population totals are estimated values and have been calculated using ONS mid-2016
estimates. Confidence intervals also apply to these. More detail can be found here.
fitness Activities
During the first six months of surveying, a number of respondents were double counting
a gym session and the individual activities that they did within the gym. We resolved this
problem by re-wording the question, however, this means the first point at which we can
report this data is May 16/17. We can however show 12 month change for fitness
classes and interval sessions which were unaffected by this.
revisions to the Nov 15/16 data relating to levels of activity are presented as part of this
release with full breakdowns available in the tables. For more details please see our
website.
sport spectatingWhile not covered in this report,
data tables showing the number of
people attending live sports events
form part of this release.
the active lives adult survey
is a push-to-web surveyCarried out by Ipsos MORI, it
involves postal mailouts inviting
participants to complete the
survey online. The survey can be
completed on mobile or desktop
devices. A paper questionnaire is
also sent out to maximise
response rates. More information
on the survey can be found here.