active military life skills (amls) an active relationships ... amls program is designed to improve...
TRANSCRIPT

© 2006, Preston Dyer & Kim Kotrla. All Rights Reserved. Do Not Copy or Reproduce By Any Means Without the Written Permission of the authors. Any unauthorized reproduction is unethical as well as a violation of copyright law.
Active Military Life Skills (AMLS)
An Active Relationships Program
AMLS Final Evaluation Report Analyzed and Prepared by
Preston Dyer, Ph.D., LCSW
Kim Kotrla, Ph.D., LCSW Baylor University
School of Social Work Waco, Texas
TM
AMLS Final Report Page 1
© 2006, Preston Dyer & Kim Kotrla. All Rights Reserved. Do Not Copy or Reproduce By Any Means Without the Written Permission of the Authors. Any unauthorized reproduction is unethical as well as a violation of copyright law.
Evaluation of Active Military Life Skills Final Report
Executive Summary
The primary goal of the Active Military Life Skills (AMLS) program is to build healthy, stable marriages among military personnel who choose marriage for themselves. AMLS is a marriage education workshop specifically designed to improve the ability of military personnel and their spouses/partners to respond to, and cope with, the situations and stressors that often accompany life in the armed forces. Participants who complete the workshop are expected to achieve the following objectives:
I. Increase marital satisfaction II. Increase hope for success of present relationship
III. Increase positive communication
IV. Increase conflict resolution
V. Decrease negative interaction
VI. Increase commitment to present relationship
Baylor School of Social Work researchers used a pre-test, post-test, follow-up research design to evaluate these outcome objectives with a self-selected, non random sample. The original sample consisted of 25 active duty Air Force personnel and their spouses/partners (N = 50) who attended an AMLS workshop. Participants completed questionnaires just prior to the beginning of the workshop (pretest) and at the conclusion of the workshop (posttest). Follow-up data was collected from 37 participants (18 couples plus one individual) 2 months after the workshop. Pretest questionnaires asked participants to answer questions about themselves, their spouses/partners, and their current relationship. For posttest questionnaires, participants were asked to answer questions about themselves, their spouses/partners, and their current relationship as they believed they would be in the coming weeks and months. Follow-up questions focused on how respondents viewed their relationship 2 months later. Based on responses to questions before and after the workshop, as well as at 2 month follow-up, participants reported the following:
AMLS Final Report Page 2
© 2006, Preston Dyer & Kim Kotrla. All Rights Reserved. Do Not Copy or Reproduce By Any Means Without the Written Permission of the Authors. Any unauthorized reproduction is unethical as well as a violation of copyright law.
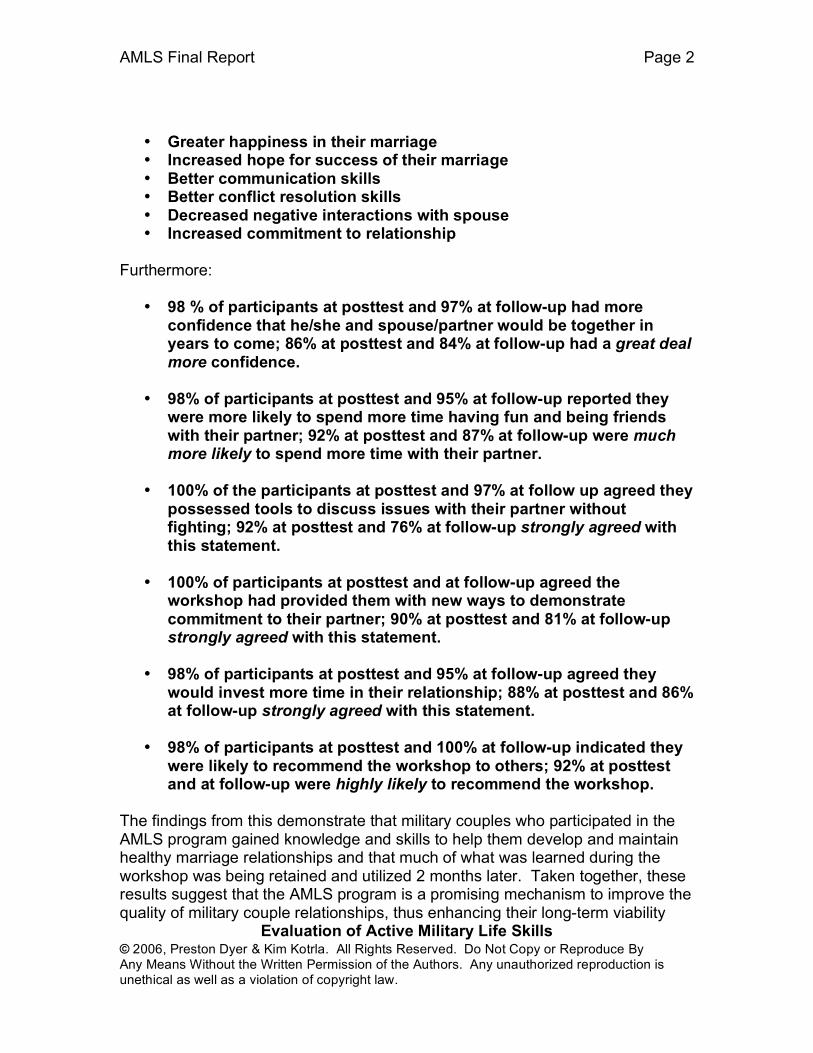
• Greater happiness in their marriage • Increased hope for success of their marriage • Better communication skills • Better conflict resolution skills • Decreased negative interactions with spouse • Increased commitment to relationship
Furthermore:
• 98 % of participants at posttest and 97% at follow-up had more confidence that he/she and spouse/partner would be together in years to come; 86% at posttest and 84% at follow-up had a great deal
more confidence. • 98% of participants at posttest and 95% at follow-up reported they
were more likely to spend more time having fun and being friends with their partner; 92% at posttest and 87% at follow-up were much more likely to spend more time with their partner.
• 100% of the participants at posttest and 97% at follow up agreed they
possessed tools to discuss issues with their partner without fighting; 92% at posttest and 76% at follow-up strongly agreed with this statement.
• 100% of participants at posttest and at follow-up agreed the
workshop had provided them with new ways to demonstrate commitment to their partner; 90% at posttest and 81% at follow-up strongly agreed with this statement.
• 98% of participants at posttest and 95% at follow-up agreed they
would invest more time in their relationship; 88% at posttest and 86% at follow-up strongly agreed with this statement.
• 98% of participants at posttest and 100% at follow-up indicated they
were likely to recommend the workshop to others; 92% at posttest and at follow-up were highly likely to recommend the workshop.
The findings from this demonstrate that military couples who participated in the AMLS program gained knowledge and skills to help them develop and maintain healthy marriage relationships and that much of what was learned during the workshop was being retained and utilized 2 months later. Taken together, these results suggest that the AMLS program is a promising mechanism to improve the quality of military couple relationships, thus enhancing their long-term viability
Evaluation of Active Military Life Skills

AMLS Final Report Page 3
© 2006, Preston Dyer & Kim Kotrla. All Rights Reserved. Do Not Copy or Reproduce By Any Means Without the Written Permission of the Authors. Any unauthorized reproduction is unethical as well as a violation of copyright law.
Final Report Background Information
Introduction The benefits to healthy marriages are well documented and include safety, security, and emotional well-being (Stanley, 2004). Just as well documented are the serious negative consequences that can result when marriages are marked by conflict and disharmony. Marriages in which there is significant discord can result in an increased risk for:
• divorce (Stanley & Markman, 1997; U.S. Bureau of the Census, 1992); • mental and physical problems in both adults and children (Cherline &
Furstenburg, 1994; Coi et al., 1993; Cowan, Kahn, & Gotlib, 1992; Coyne, Kahn, & Gotlib, 1987; Fincham, Grych & Osborne, 1993); and
• negative impacts on children (Stanley & Markman, 1997; Gottman, 1994;
Clements et al., 1997; Gottman & Silver, 1994). Military marriages face unique challenges that increase the risk of disharmony. Issues related to deployment, including long absences from home and threats to personal safety introduce potential for increased tension and strain in military relationships. Stress related to marriage and family conflict is known to affect work performance and productivity on the job. In the case of military personnel, decreased performance on the job may increase the potential of an individual and/or his associates being killed or injured. Therefore, improving the health and stability of military marriages takes on special importance. Program The purpose of this study was to examine the effectiveness of the Active Military Life Skills (AMLS) program at improving the quality of military couple relationships. The AMLS program is designed to improve the ability of military couples to address the stressors of daily life through improved communication skills, conflict resolution skills, management of emotional triggers, and awareness of financial responsibilities. Sample The research team collected pretest and posttest data from 50 individuals (25 Air Force personnel and their spouses/partners) who participated in an AMLS workshop held at Spangdahlem Air Force Base in Germany in February 2006.

AMLS Final Report Page 4
© 2006, Preston Dyer & Kim Kotrla. All Rights Reserved. Do Not Copy or Reproduce By Any Means Without the Written Permission of the Authors. Any unauthorized reproduction is unethical as well as a violation of copyright law.
The weekend workshop was facilitated by Kelly Simpson, MA, a Licensed Marriage and Family Therapist and author of the AMLS program. Thirty-seven (37) of the study participants (18 couples and one individual) completed follow-up surveys 2 months following the workshop. Collecting data at this stage was complicated by deployment and other issues related to military life styles. Even so, 74% of the original sample completed follow-up assessments. Methodology The study utilized a pretest, retrospective-pretest, posttest, and 2-month follow-up design. Pretest data were collected prior to the presentation of the AMLS materials and posttest data collected at the conclusion of the workshop. Follow-up data were collected 2 months following the workshop. All participants agreed to be part of the study and signed informed consent forms prior to any data being collected. All data were collected via self-report survey instruments. Before each assessment was completed, participants were reminded that the information they provided would be kept confidential. Workshop facilitators provided instructions to participants as a group on completing the instrument using sample questions and spouses/partners were instructed to sit apart from each other while completing the surveys. Measures and Objectives For this evaluation, the program developer and research team opted to focus on the broader outcome objectives associated with healthy marriages rather than only examining specific educational content of the program. To measure the objectives, researchers selected scales that had established reliability and validity or that had been used in a major study. Life Innovations’ ENRICH inventory has well established norms and has been utilized in a number of studies establishing its reliability and validity (Fowlers & Olsen, 1989). For this study, participants completed the marriage satisfaction scale from the ENRICH inventory, which includes communication and conflict resolution subscales. Negative interaction was measured by eleven items that have been used in this capacity in previous large scale studies (Science Applications International Corporation, & PREP, Inc., 2004; Stanley, Markman, & Whitton, 2002). For commitment, twelve items from the commitment scale developed by Stanley (1986) were used with his permission. This scale has good internal consistently with a range of samples (Adams & Jones, 1997; Stanley & Markman, 1992). The team developed additional questions specifically for this study to provide additional data, as well as a measure of participant satisfaction.

AMLS Final Report Page 5
© 2006, Preston Dyer & Kim Kotrla. All Rights Reserved. Do Not Copy or Reproduce By Any Means Without the Written Permission of the Authors. Any unauthorized reproduction is unethical as well as a violation of copyright law.
The six outcome objectives and the scale and questions used to measure them are listed below:
I. Increase marital satisfaction • ENRICH Overall Marital Satisfaction Scale • ENRICH Marital Satisfaction Subscale • Happiness with present relationship question • Spend more time being friends with spouse/partner question
II. Increase hope for success of present relationship
• Believe still be together in 10 years question • Confidence in future of relationship question
III. Increase positive communication
• ENRICH Communication Subscale
IV. Improve conflict resolution skills • ENRICH Conflict Resolution Scale
V. Decrease negative interaction
• Negative Interaction Scale questions • Have tools to talk without fighting question
VI. Increase commitment to present relationship
• Commitment Scale • Commitment to present relationship question • Time investment in relationship question • New ideas to show commitment question
Data Analysis SPSS was used to conduct analysis of data. For descriptive analysis, means, standard deviations and/or frequency distributions were calculated. To assess whether the differences between pretest, posttest, and follow up responses (e.g., change in scores) were significant, repeated measures ANOVA tests were conducted. When statistical significance was detected (p < .05), protected t-tests were conducted using paired sample t-tests and a significance level of .017 (.05/3) to address the issue of inflated Type I errors (risk of detecting significance when it does not exist). Where significant positive changes were detected, effect sizes were calculated to assess the magnitude of the change. Effect sizes were interpreted according to Cohen’s (1992) typology: .2 is considered small, .5 medium, and .8 or higher is large.
Evaluation of Active Military Life Skills
AMLS Final Report Page 6
© 2006, Preston Dyer & Kim Kotrla. All Rights Reserved. Do Not Copy or Reproduce By Any Means Without the Written Permission of the Authors. Any unauthorized reproduction is unethical as well as a violation of copyright law.
Final Report Data Analysis
Description of Study Sample Gender/Age
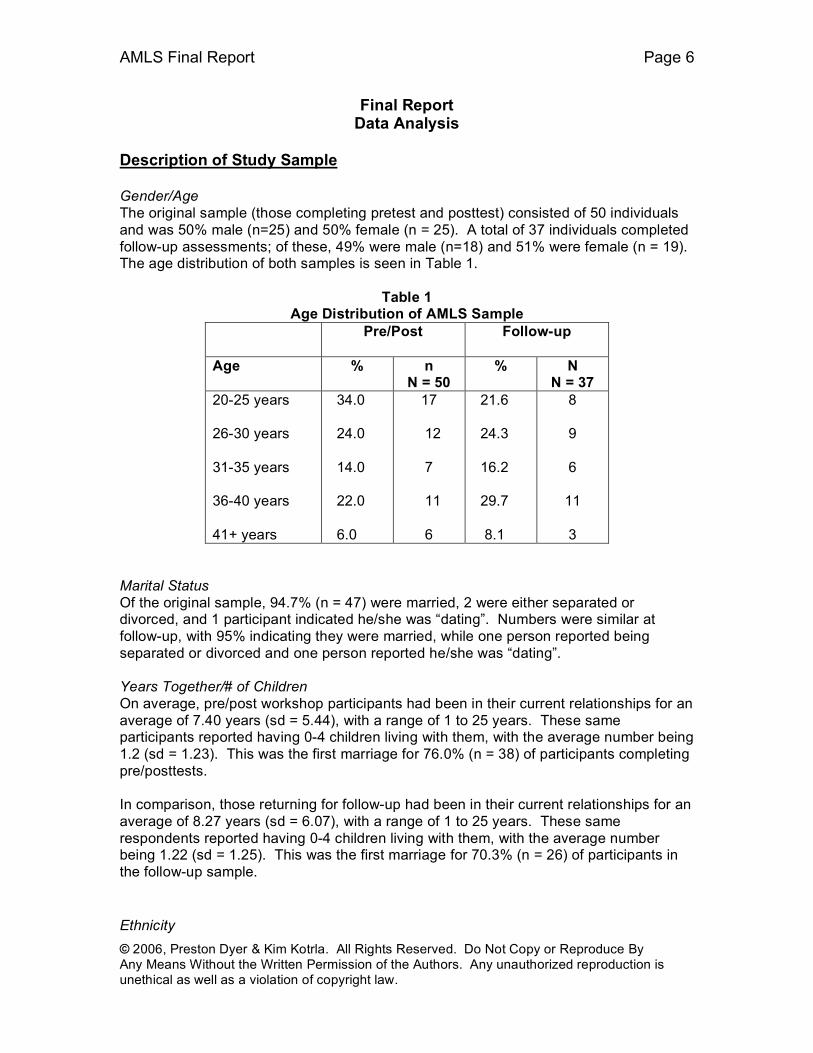
The original sample (those completing pretest and posttest) consisted of 50 individuals and was 50% male (n=25) and 50% female (n = 25). A total of 37 individuals completed follow-up assessments; of these, 49% were male (n=18) and 51% were female (n = 19). The age distribution of both samples is seen in Table 1.
Table 1 Age Distribution of AMLS Sample
Pre/Post Follow-up
Age % n N = 50
% N N = 37
20-25 years 26-30 years 31-35 years 36-40 years 41+ years
34.0 24.0 14.0 22.0 6.0
17
12 7 11 6
21.6 24.3 16.2 29.7 8.1
8
9
6
11
3 Marital Status
Of the original sample, 94.7% (n = 47) were married, 2 were either separated or divorced, and 1 participant indicated he/she was “dating”. Numbers were similar at follow-up, with 95% indicating they were married, while one person reported being separated or divorced and one person reported he/she was “dating”. Years Together/# of Children
On average, pre/post workshop participants had been in their current relationships for an average of 7.40 years (sd = 5.44), with a range of 1 to 25 years. These same participants reported having 0-4 children living with them, with the average number being 1.2 (sd = 1.23). This was the first marriage for 76.0% (n = 38) of participants completing pre/posttests. In comparison, those returning for follow-up had been in their current relationships for an average of 8.27 years (sd = 6.07), with a range of 1 to 25 years. These same respondents reported having 0-4 children living with them, with the average number being 1.22 (sd = 1.25). This was the first marriage for 70.3% (n = 26) of participants in the follow-up sample.
Ethnicity

AMLS Final Report Page 7
© 2006, Preston Dyer & Kim Kotrla. All Rights Reserved. Do Not Copy or Reproduce By Any Means Without the Written Permission of the Authors. Any unauthorized reproduction is unethical as well as a violation of copyright law.
Table 2, which contains the ethnic distribution of both samples, reveals that both the original and the follow-up sample were primarily Caucasian/White, followed by African-American.
Table 2
Ethnic Distribution of AMLS Sample
Pre/Post Follow-up
Ethnicity % N N = 50
% n N = 37
African-American Asian-American Caucasian/White Hispanic/Latino Mixed
12.0 4.0 74.0 4.0 6.0
6
2
37
2
3
13.5
5.4
70.3
5.4
5.4
5
2
26
2
2
Education Table 3 shows the highest level of education reached by workshop participants, indicating that there were persons in attendance with a wide range of educational backgrounds, but the majority of participants had at least some college or technical training.
Table 3
Education Levels of AMLS Sample
Pre/Post Follow-up
Education % n
N = 50
% n
N = 37
Junior High High School/GED Some college/technical Four year college Graduate/professional
4.0
16.0
68.0
10.0
2.0
2
8
34
5
1
2.7
21.6
64.9
8.1
2.7
1
8
24
3
1
Income

AMLS Final Report Page 8
© 2006, Preston Dyer & Kim Kotrla. All Rights Reserved. Do Not Copy or Reproduce By Any Means Without the Written Permission of the Authors. Any unauthorized reproduction is unethical as well as a violation of copyright law.
Finally, Table 4 illustrates that AMLS workshops were attended by individuals from a wide range of socioeconomic backgrounds, but no participants reported incomes below $10,000.
Table 4
Income Levels of AMLS Sample Pre/Post Follow-up
Income % n N = 50
% n N = 36
10,000-19,999 20,000-29,999 30,000-39,999 40,000-49,999 50,000-74,999 75,000-99,999 100,000+
8.0
26.0
24.0
8.0
16.0
14.0
2.0
4
13
12
4
8
7
1
8.3
27.8
22.2
8.2
13.9
16.7
2.8
3
10
8
3
5
6
1
Program Outcomes

AMLS Final Report Page 9
© 2006, Preston Dyer & Kim Kotrla. All Rights Reserved. Do Not Copy or Reproduce By Any Means Without the Written Permission of the Authors. Any unauthorized reproduction is unethical as well as a violation of copyright law.
Objective I: Increase Marital Satisfaction
• The ENRICH Marital Satisfaction Scale Workshop participants were asked to rate their level of agreement on 35 items measuring marital satisfaction, communication, and conflict resolution. Example items included “I am happy with most of my partner’s personality characteristics or personal habits” and “I am happy with our communication and feel my partner does understand me”. The 5-point rating scale used for these items is shown below.
1 2 3 4 5
Strongly Disagree Undecided Agree Strongly
Disagree Agree
A one-way repeated measures ANOVA comparing the participants’ scores at the three time points (Figure 1) was significant (F(2,42) = 73.258, p < .001). Follow-up protected t-tests revealed that scores changed significantly from:
• pretest (m = 109.60, sd = 16.51) to posttest (m = 145.15, sd = 19.85),
• pretest (m = 109.60, sd = 16.51) to follow-up (m = 141.59, sd = 19.33).
• The ENRICH Marital Satisfaction Subscale
109.60
145.15 141.59
0
20
40
60
80
100
120
140
160
pretest posttest follow up
Figure 1: Overall Marital Satisfaction

AMLS Final Report Page 10
© 2006, Preston Dyer & Kim Kotrla. All Rights Reserved. Do Not Copy or Reproduce By Any Means Without the Written Permission of the Authors. Any unauthorized reproduction is unethical as well as a violation of copyright law.
Workshop participants were asked to rate their level of agreement on nine items regarding various aspects of their marriage.
Example items included “I am happy with our financial position and the way we make financial decisions” and “I am pleased with how we express affection and relate sexually”. The same 5-point response scale was utilized for these items. A one-way repeated measures ANOVA comparing the participants’ scores at the three time points (Figure 2) was significant (F(2,44) = 66.381, p < .001). Follow-up protected t-tests revealed that scores changed significantly from:
• pretest (m = 27.86, sd = 5.29) to posttest (m = 37.44, sd = 5.35), • pretest (m = 27.86, sd = 5.29) to follow-up (m = 36.90, sd = 4.92).
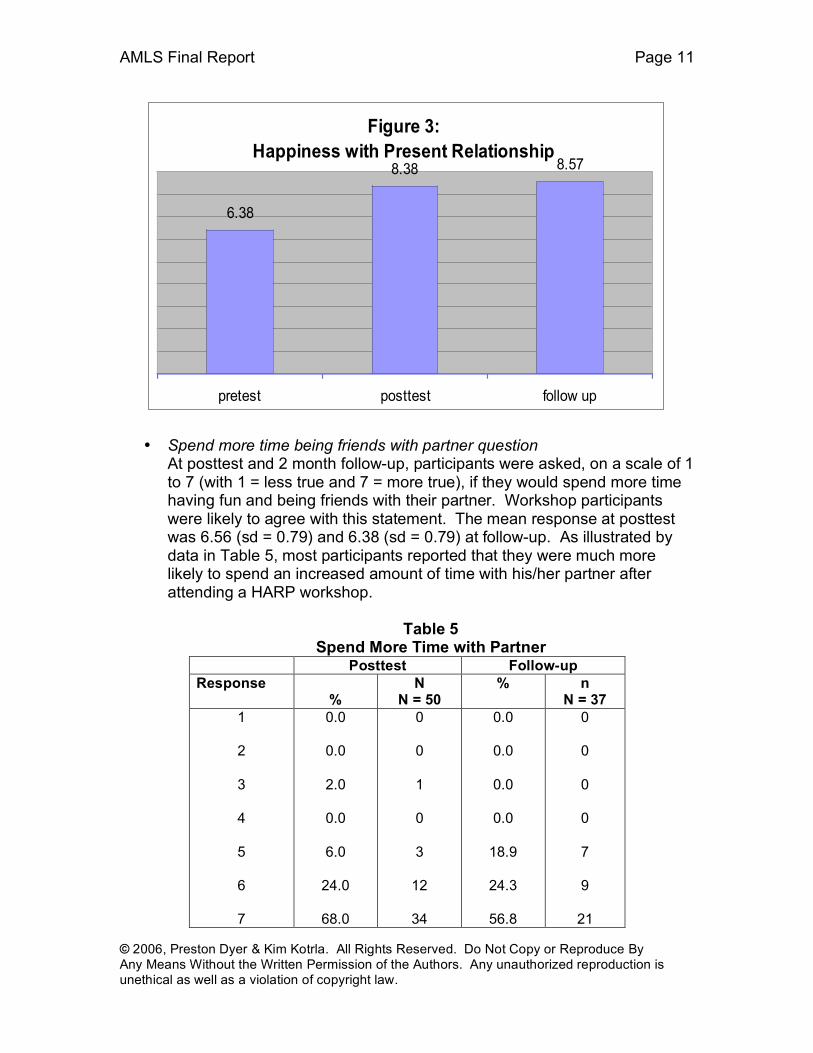
• Happiness with present relationship question At all three time points (Figure 3), respondents were asked, on a scale of 1 to 10 (with 1 = very unhappy and 10 = perfectly happy) to rate the degree of happiness with their present relationship. A one-way repeated measures ANOVA comparing the participants’ scores at the three time points was significant (F(2,72) = 23.533, p < .001). Follow-up protected t-tests revealed there was statistically significant change from:
• pretest (m= 6.38, sd = 2.03) to posttest (m= 8.38, sd = 1.32) and • pretest (m= 6.38, sd = 2.03) to follow-up (m = 8.57, sd = 1.52).
Figure 2
Marital Satisfaction Subscale
27.86
37.44 36.90
0
5
10
15
20
25
30
35
40
pretest posttest follow up
AMLS Final Report Page 11
© 2006, Preston Dyer & Kim Kotrla. All Rights Reserved. Do Not Copy or Reproduce By Any Means Without the Written Permission of the Authors. Any unauthorized reproduction is unethical as well as a violation of copyright law.
Figure 3:
Happiness with Present Relationship
6.38
8.38 8.57
pretest posttest follow up
• Spend more time being friends with partner question
At posttest and 2 month follow-up, participants were asked, on a scale of 1 to 7 (with 1 = less true and 7 = more true), if they would spend more time having fun and being friends with their partner. Workshop participants were likely to agree with this statement. The mean response at posttest was 6.56 (sd = 0.79) and 6.38 (sd = 0.79) at follow-up. As illustrated by data in Table 5, most participants reported that they were much more likely to spend an increased amount of time with his/her partner after attending a HARP workshop.
Table 5 Spend More Time with Partner
Posttest Follow-up
Response %
N N = 50
% n N = 37
1 2 3 4 5 6 7
0.0
0.0
2.0
0.0
6.0
24.0
68.0
0 0 1 0 3
12
34
0.0
0.0
0.0
0.0
18.9
24.3
56.8
0
0
0
0
7
9
21

AMLS Final Report Page 12
© 2006, Preston Dyer & Kim Kotrla. All Rights Reserved. Do Not Copy or Reproduce By Any Means Without the Written Permission of the Authors. Any unauthorized reproduction is unethical as well as a violation of copyright law.
Objective I – Summary of Outcome Analysis In addition to indicating that they would likely spend more time with their partners, which participants did at both posttest and follow-up (Table 5), statistical analysis of the three pre, post, and follow-up measures used to evaluate this program objective (overall marital satisfaction, marital satisfaction subscale, happiness in present relationship question) indicated statistically significant positive change immediately after the workshop and that the change was maintained over a two month period (Figures 1, 2 & 3). These findings suggest that the AMLS program was successful in increasing participants’ marital satisfaction.
Objective II: Increase Hope for Success of Present Relationship
• Believe still be together in 10 years question Workshop participants were asked (on a scale of 1 to 10, with 1 = unlikely and 10 = most definitely) how strongly they believed they and their partner would still be together in 10 years?” The pretest score mean was 8.44 (sd = 2.68), the posttest mean was 9.16 (sd = 1.69) and follow-up mean was 9.27 (sd = 1.17) and a one-way repeated measures ANOVA examining participants’ scores at these three times found no significance (F(2,70) = 1.671, p > .05.
• Confidence in future of relationship question
At posttest and follow-up, participants were asked, on a scale of 1 to 7 (with 1 = less true and 7 = more true), if they feel more confident that he/she and partner will stay together in the years to come. As seen in the response distributions at posttest and follow-up shown in Table 6, workshop participants were likely to agree with this statement. The mean posttest response was 6.42 (sd = 0.86) and 6.32 (sd = 0.92) at follow-up.
Table 6 Confidence in Future of Relationship
Posttest Follow-up
Response
%
n
N = 50
% n
N = 37
1 2 3 4 5 6 7
0.0
0.0
2.0
0.0
12.0
26.0
60.0
0 0 1 0 6
13
30
0.0
0.0
2.7
0.0
13.5
29.7
54.1
0
0
1
0
5
11
20
AMLS Final Report Page 13
© 2006, Preston Dyer & Kim Kotrla. All Rights Reserved. Do Not Copy or Reproduce By Any Means Without the Written Permission of the Authors. Any unauthorized reproduction is unethical as well as a violation of copyright law.
Objective II – Summary of Outcome Analysis Although the first measure did not achieve statistical significance, both posttest (9.16) and follow-up (9.27) mean scores were higher than pretest (8.92). With such a high pretest mean, the bar was set high for achieving significance. Furthermore, participants appeared to be more confident in the future of their relationship (Table 6). Based on these findings, it is believed Objective 2 was largely achieved. Objective III: Increase Positive Communication
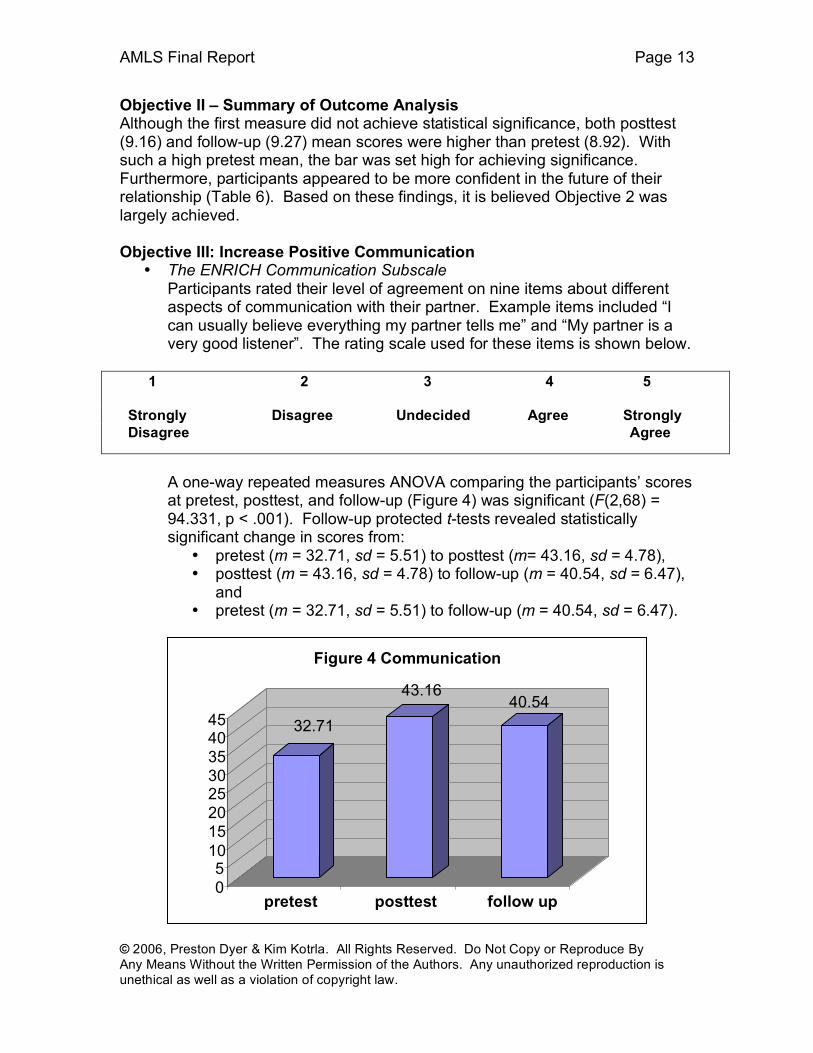
• The ENRICH Communication Subscale Participants rated their level of agreement on nine items about different aspects of communication with their partner. Example items included “I can usually believe everything my partner tells me” and “My partner is a very good listener”. The rating scale used for these items is shown below.
1 2 3 4 5
Strongly Disagree Undecided Agree Strongly
Disagree Agree
A one-way repeated measures ANOVA comparing the participants’ scores at pretest, posttest, and follow-up (Figure 4) was significant (F(2,68) = 94.331, p < .001). Follow-up protected t-tests revealed statistically significant change in scores from:
• pretest (m = 32.71, sd = 5.51) to posttest (m= 43.16, sd = 4.78), • posttest (m = 43.16, sd = 4.78) to follow-up (m = 40.54, sd = 6.47),
and • pretest (m = 32.71, sd = 5.51) to follow-up (m = 40.54, sd = 6.47).
32.71
43.16 40.54
0
5
10
15
20
25
30
35
40
45
pretest posttest follow up
Figure 4 Communication

AMLS Final Report Page 14
© 2006, Preston Dyer & Kim Kotrla. All Rights Reserved. Do Not Copy or Reproduce By Any Means Without the Written Permission of the Authors. Any unauthorized reproduction is unethical as well as a violation of copyright law.
Objective III – Summary of Outcome Analysis Analysis of data from the ENRICH communication subscale indicates that participants increased their positive communication skills and maintained those skills over the follow-up period, suggesting that Objective 3 was achieved. Objective IV: Increase Conflict Resolution
• The ENRICH Conflict Resolution Subscale Participants rated their level of agreement on 10 conflict resolution items. Example items included “My partner and I have very similar ideas about the best way to solve our disagreements” and “My partner usually takes our disagreements very seriously”. The 5-point scale depicted above was utilized for these items. A one-way repeated measures ANOVA comparing the participants’ scores at pretest, posttest, and follow-up (Figure 5) was significant (F(2,68) = 75.579, p < .001). Follow-up protected t-tests revealed statistically significant change in scores from:
• pretest (m = 31.04, sd = 5.20) to posttest (m = 39.83, sd = 5.28) and
• pretest (m = 31.04, sd = 5.20) to follow-up (m = 38.30, sd = 5.42).
Objective IV – Summary of Outcome Analysis Analysis of data from the ENRICH conflict resolution scale indicates that participants in the AMLS workshop increased their ability to manage conflict in their relationships to a statistically significant degree and to maintain that skill level for two months. These findings support the conclusion that participants in the AMLS program achieved objective four.
31.04
39.83 38.30
0
5
10
15
20
25
30
35
40
pretest posttest follow up
Figure 5: Conflict Resolution

AMLS Final Report Page 15
© 2006, Preston Dyer & Kim Kotrla. All Rights Reserved. Do Not Copy or Reproduce By Any Means Without the Written Permission of the Authors. Any unauthorized reproduction is unethical as well as a violation of copyright law.
Objective V: Decrease Negative Interaction
• Negative Interaction Scale questions Participants rated (on scale of 1 to 3, with 1 = almost never or never, 2 = once in a while, and 3 = frequently) how often they and their partner experienced various forms of negative interaction. Example items included “Little arguments escalate into ugly fights with accusations, criticisms, name-calling, or bringing up past hurts” and “My partner shouts or yells at me”. A one-way repeated measures ANOVA comparing the participants’ scores at the three time points (Figure 6) was significant (F(2,70) = 49.315, p < .001). Follow-up protected t-tests revealed that scores changed significantly from:
• pretest (m = 19.46, sd = 4.69) to posttest (m = 13.04, sd = 2.60), • posttest (m = 13.04, sd = 2.60) to follow-up (m = 15.08, sd = 4.12),
and • pretest (m = 19.46, sd = 4.69) to follow-up (m = 15.08, sd = 4.12).
• Have tools to talk without fighting question
At posttest and follow-up, participants were asked, on a scale of 1 to 7 (with 1 = less true and 7 = more true), if they believed they would have the tools to talk without fighting. Workshop participants were likely to agree with this statement. The mean response at posttest was 6.60 (SD = 0.64 ) and 6.08(SD = 0.83) at follow-up.
19.46
13.04
15.08
0
5
10
15
20
pretest posttest follow up
Figure 6 Negative Interaction Scale

AMLS Final Report Page 16
© 2006, Preston Dyer & Kim Kotrla. All Rights Reserved. Do Not Copy or Reproduce By Any Means Without the Written Permission of the Authors. Any unauthorized reproduction is unethical as well as a violation of copyright law.
The response distributions seen in Table 7 indicate that after attending the AMLS workshop most respondents felt they had acquired tools to talk without fighting.
Table 7 Have Tools to Talk without Fighting
Posttest Follow-up
Response % N
N = 50
% n
N = 37
1 2 3 4 5 6 7
0.0
0.0
0.0
0.0
8.0
24.0
68.0
0 0 0 0 4
12
34
0.0
0.0
0.0
2.7
21.6
40.5
35.1
0
0
0
1
8
15
13
Objective V – Summary of Outcome Analysis Statistically significant positive change was achieved from pretest to posttest on the negative interaction scale, as well as from posttest to follow-up, although not in the desired direction. However, follow-up scores were still lower than pretest scores, and while not achieving significance, were still indicative of improved interactions with partners (Figure 6). At both posttest and follow-up, participants agreed that they had tools to talk with their partners without fighting (Table 7). Taken together, there is sufficient support that program objective V was met. Objective VI: Increase Commitment to Present Relationship
• Commitment Scale Participants answered 12 items from the Stanley Commitment Inventory using a 7-point rating guide. Example items included “My relationship with my partner is more important to me than almost anything else in my life” and “I want this relationship to stay strong no matter what rough times we may encounter”. A one-way repeated measures ANOVA comparing the participants’ scores at the three time points (Figure 7) was significant (F(2,70) = 7.353, p = .001). Follow-up protected t-tests revealed that scores changed significantly from:
• pretest (m = 69.48, sd = 10.31) to posttest (m = 74.73, sd = 9.96).

AMLS Final Report Page 17
© 2006, Preston Dyer & Kim Kotrla. All Rights Reserved. Do Not Copy or Reproduce By Any Means Without the Written Permission of the Authors. Any unauthorized reproduction is unethical as well as a violation of copyright law.
Figure 7:
Commitment Scale
69.46
74.7374.16
pretest posttest follow up
• Commitment to present relationship question
Workshop participants were asked (on a scale of 1 to 10, with 1 = not committed at all and 10 = absolutely committed) the degree of commitment they have to staying in their present relationship. A one-way repeated measures ANOVA comparing the participants’ scores at pretest, posttest, and follow-up (Figure 8) was significant (F(2,72) = 7.381, p = .001). Follow-up protected t-tests revealed statistically significant change in scores from:
• pretest (m = 8.46, sd = 2.00) to posttest (m = 9.30, sd = 1.36) and • posttest (m = 9.30, sd = 1.36) to follow-up (m = 9.14, sd = 1.23).
Figure 8 Commitment to Present Relationship
8.46
9.30 9.14
0
2
4
6
8
10
pretest posttest follow up

AMLS Final Report Page 18
© 2006, Preston Dyer & Kim Kotrla. All Rights Reserved. Do Not Copy or Reproduce By Any Means Without the Written Permission of the Authors. Any unauthorized reproduction is unethical as well as a violation of copyright law.
• Time investment in relationship question Workshop participants were asked, at posttest and 2 months later, on a scale of 1 to 7 (with 1 = less true and 7 = more true), if they would invest more time in their relationship. The response distributions are shown in Table 8. As indicated by mean responses of 6.56 (sd = 0.84) at posttest and 6.35 (sd = 0.95) 2 months later, respondents were likely to agree with this statement.
Table 8 Invest More Time in Relationship
Posttest Follow-up
Response % n
N = 50
% N
N = 37
1 2 3 4 5 6
7
0.0
0.0
2.0
0.0
10.0
16.0
72.0
0 0 1 0 5 8
36
0.0
0.0
2.7
2.7
8.1
29.7
56.8
0
0
1
1
3
11
21
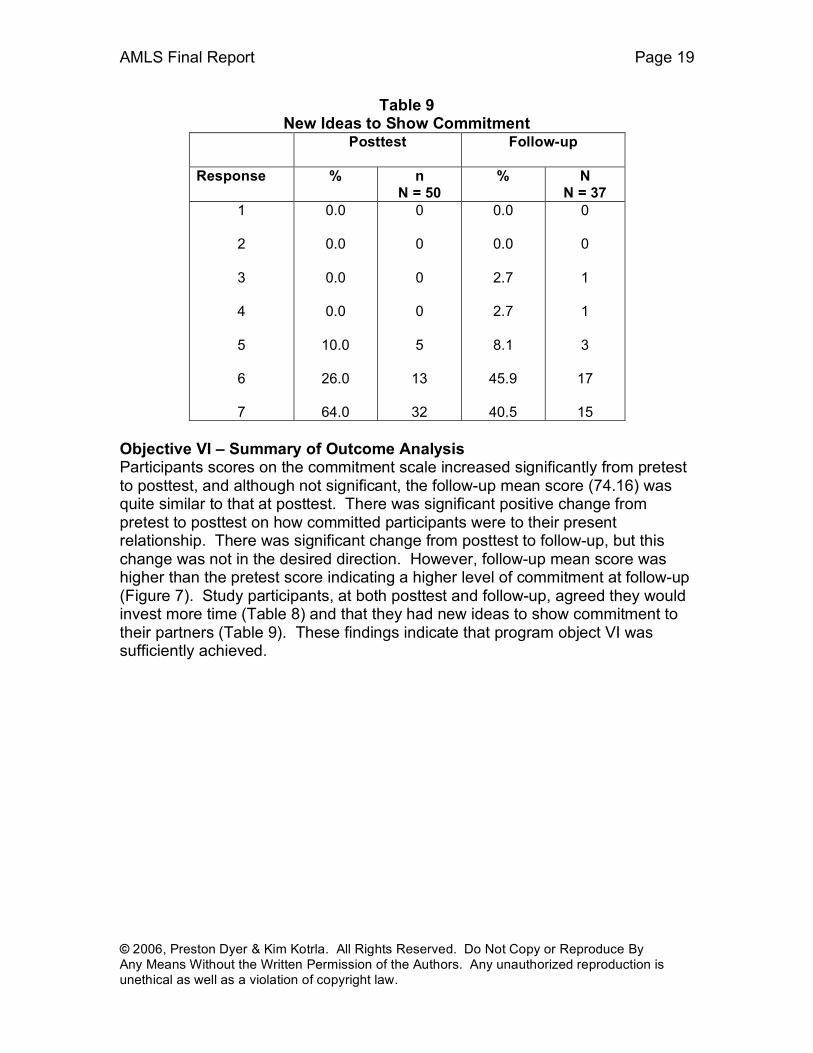
• New ideas to show commitment question After the workshop and at follow up participants were asked, on a scale of 1 to 7 (with 1 = less true and 7 = more true), if they now had new ideas for how to show their commitment to their partner. Table 9 includes these response distributions. The posttest mean was 6.54 (sd = 0.68) and follow-up mean of 6.32 (sd = 0.91), indicating that most participants felt this statement to be true.
AMLS Final Report Page 19
© 2006, Preston Dyer & Kim Kotrla. All Rights Reserved. Do Not Copy or Reproduce By Any Means Without the Written Permission of the Authors. Any unauthorized reproduction is unethical as well as a violation of copyright law.
Table 9 New Ideas to Show Commitment
Posttest Follow-up
Response % n
N = 50
% N
N = 37
1 2 3 4 5 6 7
0.0
0.0
0.0
0.0
10.0
26.0
64.0
0 0 0 0 5
13
32
0.0
0.0
2.7
2.7
8.1
45.9
40.5
0
0
1
1
3
17
15
Objective VI – Summary of Outcome Analysis Participants scores on the commitment scale increased significantly from pretest to posttest, and although not significant, the follow-up mean score (74.16) was quite similar to that at posttest. There was significant positive change from pretest to posttest on how committed participants were to their present relationship. There was significant change from posttest to follow-up, but this change was not in the desired direction. However, follow-up mean score was higher than the pretest score indicating a higher level of commitment at follow-up (Figure 7). Study participants, at both posttest and follow-up, agreed they would invest more time (Table 8) and that they had new ideas to show commitment to their partners (Table 9). These findings indicate that program object VI was sufficiently achieved.

AMLS Final Report Page 20
© 2006, Preston Dyer & Kim Kotrla. All Rights Reserved. Do Not Copy or Reproduce By Any Means Without the Written Permission of the Authors. Any unauthorized reproduction is unethical as well as a violation of copyright law.
Workshop Satisfaction In addition to analyzing how well the program objectives were met, participants were surveyed regarding their satisfaction with the AMLS workshop.
• At posttest and follow-up, participants were asked how likely they were to recommend (on a scale of 1 to 7, with 7 being the most likely) this workshop to a friend. The response distribution is displayed in Table 10. At posttest, 98% of participants agreed they would recommend the workshop, with 92% highly likely to recommend it (as indicated by a score of “6” or “7”). At follow-up, 100% of the participants said they would recommend the workshop, with 92% highly likely to recommend.
Table 10 Workshop Satisfaction
Posttest Follow-up
Response % n
N = 50
% n
N = 37
1 2 3 4 5 6 7
0.0
2.0
6.0
0.0
6.0
6.0
86.0
0 1 3 0 3 3
43
0.0
0.0
0.0
0.0
8.1
10.8
81.1
0
0
0
0
3
4
30

AMLS Final Report Page 21
© 2006, Preston Dyer & Kim Kotrla. All Rights Reserved. Do Not Copy or Reproduce By Any Means Without the Written Permission of the Authors. Any unauthorized reproduction is unethical as well as a violation of copyright law.
Discussion
The findings from this study demonstrate that military couples who attended the AMLS workshop gained knowledge and skills to help them develop and maintain healthy marriages and that two months after the workshop, much of what was learned was being retained and utilized. Participants’ scores were high at both posttest and follow-up on a series of questions regarding their feelings toward their relationship, as well as what they had learned in the workshop that might benefit their relationship. At posttest, participants were asked to respond how they “thought” their relationship would be in the coming weeks and months (e.g., having now been through the AMLS workshop), while follow-up responses were to reflect how participants perceived their relationship to actually “be” two months after the workshop. Table 11 summarizes mean response scores on these questions, to which participants could answer from 1 to 7, with 7 being the highest level of agreement. Although follow-up scores did tend to drop slightly, this is not unexpected given participants had just completed the workshop and therefore had fresh knowledge and possibly inflated expectations of how the new knowledge would translate once they returned to their daily routines. The fact that the two month follow-up means remained so high is more impressive than the high posttest scores.
Table 11
Mean Scores of Posttest and Follow-up Questions Question
Posttest Mean SD
Follow-up Mean SD
Spend more time being friends w/partner Confidence in future of relationship Have tools to talk without fighting Time investment in relationship New ideas to show commitment
6.56 0.79 6.42 0.86 6.60 0.64 6.56 0.84 6.54 0.68
6.38 0.79 6.32 0.92 6.08 0.83 6.35 0.95 6.32 0.91

AMLS Final Report Page 22
© 2006, Preston Dyer & Kim Kotrla. All Rights Reserved. Do Not Copy or Reproduce By Any Means Without the Written Permission of the authors. Any unauthorized reproduction is unethical as well as a violation of copyright law.
Even more compelling evidence for the efficacy of the program is found in the data seen in Tables 12 and 13. Table 12 summarizes findings of the ANOVA’s that were conducted on the eight outcome measures that were utilized to examine the effect of AMLS over time. The impact of AMLS was significant on seven of the eight outcome measures, suggesting that the impact of this program with the participants was quite strong. The only variable which was not statistically significant was one in which the respondent was asked whether he/she believed that he/she and partner would still be together in 10 years. Respondents were asked to answer this question on a 10 point scale. With a pretest mean was 8.44 – e.g., already quite high, it is not surprising that the posttest mean of 9.16 and follow-up mean of 9.27, although both higher than the pretest, did not reach statistical significance. Even though not statistically significant, it is substantively significant that two months after the study, participants held stronger beliefs that he/she and partner would be together 10 years later than before the AMLS workshop.
Table 12 Means, Standard Deviations, and ANOVA for Effects of AMLS on Eight Outcome Measures
Outcome Measure
Pretest Mean sd
Posttest Mean sd
Follow-up Mean sd
df ANOVA
ENRICH Marital Satisfaction Scale ENRICH Marital Satisfaction Subscale Happiness with present relationship Believe still be together in 10 years ENRICH Communication Subscale ENRICH Conflict Resolution Subscale BSRF Negative Interaction Scale Commitment Scale Commitment to present relationship
109.60 16.51 27.86 5.29 6.38 2.03 8.44 2.68 32.71 5.51 31.04 5.20 19.46 4.69 69.48 10.38 8.46 2.00
145.15 19.85 37.44 5.35 8.38 1.32 9.16 1.69 43.16 4.78 39.83 5.28 13.04 2.60 74.73 9.96 9.30 1.36
141.59 19.33 36.90 4.92 8.57 1.52 9.27 1.17 40.54 6.47 38.30 5.42 15.08 4.12 74.16 8.86 9.14 1.23
2,42 2.44 2.72 2,70 2,68 2,68 2,70 2,70 2,72
73.258*** 66.381*** 23.533*** 1.671
94.331*** 75.579*** 49.315*** 7.353** 7.31***
***p < .001, ** p < .01

AMLS Final Report Page 23
© 2006, Preston Dyer & Kim Kotrla. All Rights Reserved. Do Not Copy or Reproduce By Any Means Without the Written Permission of the authors. Any unauthorized reproduction is unethical as well as a violation of copyright law.
After determining which outcome measures were significant (p < .05), protected t-tests were then conducted using paired sample t-tests and a significance level of .017 (.05/3) to examine where the significant changes occurred (e.g., pretest to posttest, pretest to follow-up, posttest to follow-up), the direction of the changes and whether they were in the desired direction. Table 13 summarizes the information on those findings that were significant (p < .017).
Table 13 Summary of Paired t-test Results
Outcome Measure
Significant time frame Desired
direction?
ENRICH Overall Marital Satisfaction Scale
ENRICH Marital Satisfaction Subscale
Happiness with present relationship
ENRICH Communication Subscale
ENRICH Conflict Resolution Subscale
BSRF Negative Interaction Scale
Commitment Scale
Commitment to present relationship
pretest-posttest***
pretest-follow up***
pretest-posttest***
pretest-follow up***
pretest-posttest***
pretest-follow up***
pretest-posttest***
posttest-follow up**
pretest-follow up***
pretest-posttest***
pretest-follow up***
pretest-posttest***
posttest-follow up***
pretest-follow up***
pretest-posttest***
pretest-posttest***
posttest-follow up***
yes
yes
yes
yes
yes
yes
yes
no
yes
yes
yes
yes
no
yes
yes
yes
no ***p < .001, ** p < .01
Interpretation of paired sample t-test findings Although it is relatively simple to interpret pretest to posttest changes (p < .017) in the desired direction as positive, other significant changes may need to be understood in light of other factors such as pretest mean scores. Of the 17 time points for which the AMLS program produced significant results (p < .017), 14 of these were positive. Participants’ scores on the two ENRICH Marital Satisfaction Scales, the ENRICH Conflict Resolution Scale, and the happiness with present relationship question clearly improved from pretest to both posttest and follow-up. These findings alone offer solid evidence in support of AMLS.
AMLS Final Report Page 24
© 2006, Preston Dyer & Kim Kotrla. All Rights Reserved. Do Not Copy or Reproduce By Any Means Without the Written Permission of the Authors. Any unauthorized reproduction is unethical as well as a violation of copyright law.
Significance was achieved in an unanticipated direction on only 3 occasions, including the commitment to present relationship question, where the posttest to follow-up change was opposite of expected. However, the posttest mean (9.30) was still higher than that of the pretest (8.46), so participants actually reported a higher level of commitment to the relationship twp months after the AMLS workshop than at pretest, but the decrease from the posttest score mask this result. The other two unanticipated significant findings occurred from posttest to follow-up with the ENRICH Communication subscale and the BSRF Negative Interaction Scale. However, with these two scales, positive significant change in participants’ scores was actually achieved from both pretest to posttest and pretest to follow-up. In other words, participants did actually improve overall in communication and negative interaction skills, but their scores were not reflective of this from posttest to follow-up. For both of these findings, it is possible that at posttest, participants were overly optimistic in rating themselves on how they would perform in the coming weeks in these areas. It is also possible that a “booster” teaching session of these skills after the workshop would be beneficial. To summarize, the pretest to posttest and the pretest to follow-up mean score changes were significant in the desired direction for 6 outcome measures (ENRICH Overall Marital Satisfaction, ENRICH Marital Satisfaction subscale, Happiness with present relationship question, ENRICH Communication subscale, ENRICH Conflict Resolution subscale, BSRF Negative Interaction Scale). Such findings speak to the impact of the AMLS program with this group of military couples.

AMLS Final Report Page 25
© 2006, Preston Dyer & Kim Kotrla. All Rights Reserved. Do Not Copy or Reproduce By Any Means Without the Written Permission of the Authors. Any unauthorized reproduction is unethical as well as a violation of copyright law.
Effect Sizes Finally, to further assess the magnitude of the changes that occurred, effect sizes were calculated at all points for which statistically significant positive improvements were detected. These findings are seen in Table 14.
Table 14
Effect Sizes for Significant Positive Score Changes
Outcome Measure/Change Point Cohen’s d
ENRICH Overall Marital Satisfaction Scale/pre-post ENRICH Overall Marital Satisfaction Scale/pre-follow up ENRICH Marital Satisfaction Subscale/pre-post ENRICH Marital Satisfaction Subscale/pre-follow up Happiness with present relationship question/pre-post Happiness with present relationship question/pre-follow up ENRICH Communication Subscale/pre-post ENRICH Communication Subscale/pre-follow up ENRICH Conflict Resolution Subscale/pre-post ENRICH Conflict Resolution Subscale/pre-follow up BSRF Negative Interaction Scale/pre-post BSRF Negative Interaction Scale/pre-follow up Commitment Scale/pre-post Commitment to present relationship question/pre-post
2.11
1.99
1.89
1.96
1.14
.75
2.00
1.59
1.58
1.55
1.53
1.03
.61
.56
An effect size of .2 is considered weak, with a finding of.5 considered moderate and.8 or larger interpreted as strong. All 14 effect sizes were at least moderate, with 11 meeting the criteria of strong. These findings speak to the magnitude of the impact that the AMLS program had with the military couples who attended this marriage/relationship education program.

AMLS Final Report Page 26
© 2006, Preston Dyer & Kim Kotrla. All Rights Reserved. Do Not Copy or Reproduce By Any Means Without the Written Permission of the Authors. Any unauthorized reproduction is unethical as well as a violation of copyright law.
Summary Results of pretest/posttest data collected from 25 Air Force personnel and their spouses/partners and 37 of this same group at 2 month follow-up indicate that the AMLS program had a strong impact on military relationships, as demonstrated by positive change on several program objective measures. Study findings indicated that after participating in the AMLS workshop, program participants reported greater happiness in their relationship, increased confidence in the future of their relationship, and improved communication and conflict resolution skills. In addition, participants reported having new skills and ideas for improving their relationship, a greater willingness to invest more time in it, as well as high levels of satisfaction with the workshop itself. Finally, effect sizes calculated on significant positive findings were all moderate to strong. Taken together, these results suggest that the AMLS program is a promising mechanism for improving the quality of military couple relationships, thus enhancing their long-term viability.

AMLS Final Report Page 27
© 2006, Preston Dyer & Kim Kotrla. All Rights Reserved. Do Not Copy or Reproduce By Any Means Without the Written Permission of the Authors. Any unauthorized reproduction is unethical as well as a violation of copyright law.
References
Cherlin, A. J., & Furstenberg, F. F. J. (1994). Step families in the United States: A reconsideration. Annual Review of Sociology, 359.
Cohen, J. (1992). A power primer. Psychological Bulletin 112, 155-159. Coi, J., Watt, N., West, S. G., Hawkins, J. D., Asarnow, J. R., & Markman, H. J.
(1993). The science of prevention: A conceptual framework and some directions for a national research program. American Psychologist , 1013.
Cowan, J. C., Kahn, J., & Gotlib, I. H. (1992). When partners become parents: The
big life change for couples. New York: Harper Collins. Coyne, J. C., Kahn, J., & Gotlib, I. H. (1987). Depression. family interaction and
psychopathology: Theories, methods, and findings. New York: Plenum Press. Fincham, F., Grych, J., & Osborne, L. (1993). Marital conflict and child adjustment: A
longitudal analysis. Paper presented at the biennial meeting at the Society for Research in Child Development, New Orleans, LA.
Fowers, B. J., & Olson, D. H. (1989). ENRICH marital inventory: A discriminant
validity and cross-validity assessment. Journal of Marital and Family Therapy, 15(1), 65--79.
Gottman, J. (1994). Why marriages succeed or fail. New York: Simon & Schuster. Gottman, J. M., & Silver, N. (1994). Why marriages succeed or fail... and how you
can make yours last. New York, NY: Fireside. Science Applications International Corporation, & PREP, Inc. (2004). Building strong
and ready families. Army Studies Contract. Stanley, S. M. (1986). Commitment and the maintenance and enhancement of
relationships. Dissertation Abstracts International, 47(4-), 1794. Stanley, S. M., & Markman, H. J. (1997). Marriage in the 90s: A nationwide
random phone survey. Denver, Colorado: PREP, Inc. U.S. Bureau of the Census. (1992). Marriage, divorce, and remarriage in the 1990s:
Current population reports (pp. 23). Washington, D.C.: U.S. Government Printing Office.