active sites of copper-complex catalytic materials for...
TRANSCRIPT
ARTICLE
Active sites of copper-complex catalytic materialsfor electrochemical carbon dioxide reductionZhe Weng 1,2,3, Yueshen Wu2,3, Maoyu Wang4, Jianbing Jiang2,3, Ke Yang2,3, Shengjuan Huo2,3,5,
Xiao-Feng Wang6, Qing Ma7, Gary W. Brudvig2,3, Victor S. Batista2,3, Yongye Liang1,
Zhenxing Feng4 & Hailiang Wang 2,3
Restructuring-induced catalytic activity is an intriguing phenomenon of fundamental impor-
tance to rational design of high-performance catalyst materials. We study three copper-
complex materials for electrocatalytic carbon dioxide reduction. Among them, the copper(II)
phthalocyanine exhibits by far the highest activity for yielding methane with a Faradaic
efficiency of 66% and a partial current density of 13 mA cm−2 at the potential of – 1.06 V
versus the reversible hydrogen electrode. Utilizing in-situ and operando X-ray absorption
spectroscopy, we find that under the working conditions copper(II) phthalocyanine under-
goes reversible structural and oxidation state changes to form ~ 2 nm metallic copper clus-
ters, which catalyzes the carbon dioxide-to-methane conversion. Density functional
calculations rationalize the restructuring behavior and attribute the reversibility to the strong
divalent metal ion–ligand coordination in the copper(II) phthalocyanine molecular structure
and the small size of the generated copper clusters under the reaction conditions.
DOI: 10.1038/s41467-018-02819-7 OPEN
1 Department of Materials Science and Engineering, South University of Science and Technology of China, Shenzhen 518055, China. 2 Department ofChemistry, Yale University, New Haven, CT 06511, USA. 3 Energy Sciences Institute, Yale University, West Haven, CT 06516, USA. 4 School of Chemical,Biological, and Environmental Engineering, Oregon State University, Corvallis, OR 97331, USA. 5Department of Chemistry, Science Colleges, ShanghaiUniversity, Shanghai 200444, China. 6 School of Chemistry and Chemical Engineering, University of South China, Hengyang, Hunan 421001, China. 7 DND-CAT, Synchrotron Research Center, Northwestern University, Evanston, IL 60208, USA. Zhe Weng, Yueshen Wu and Maoyu Wang contributed equally tothis work. Correspondence and requests for materials should be addressed to Y.L. (email: [email protected])or to Z.F. (email: [email protected]) or to H.W. (email: [email protected])
NATURE COMMUNICATIONS | (2018) 9:415 |DOI: 10.1038/s41467-018-02819-7 |www.nature.com/naturecommunications 1
1234
5678
90():,;
E lectrochemical conversion of CO2 using electricity gener-ated from renewable energy sources could provide viablesolutions to the development of carbon-neutral fuels.
However, CO2 electroreduction is a kinetically slow and divergingreaction that requires a significant magnitude of overpotentialand generates a myriad of products1–3. Among all the electro-catalyst materials studied thus far for CO2 reduction metalcomplexes are of distinct importance, because they possess well-defined structures that can be tailored on the molecular level4–10.Therefore, there is a significant interest in the development ofelectrocatalytic materials by deposition of molecules with highcatalytic activity and selectivity for electrochemical CO2 reduc-tion6,11–14. Cu-based metal organic frameworks (MOFs) havebeen found to be electrocatalytically active for reducing CO2 toalcohols14. Recently, we discovered a Cu porphyrin based het-erogeneous electrocatalyst that can reduce CO2 to methane (CH4)and ethylene (C2H4) in a neutral aqueous electrolyte15. Althoughpostmortem analysis reveals that the Cu porphyrin molecularstructure remains unchanged after electrolysis, the actual activespecies responsible for catalyzing CO2 to hydrocarbon conversionhas yet to be established.
Many catalyst materials change their structures under reactionconditions16–18. The restructuring can be induced by physicalconditions such as temperature, pressure, and electrical potential,as well as chemical conditions such as adsorbates and reactants17–25. The formed structures with reduced thermodynamic energyunder the reaction conditions are responsible for the observedcatalytic properties. Metal surfaces are known to alter theiratomic arrangements, compositions, and oxidation states underthe influences of gas atmosphere and temperature21. Numerousstudies have been reported on molecular complexes of earth-abundant metals as pre-catalysts for water oxidation26. Recently,transition metal sulfides, selenides, and phosphides have beenfound to reconstruct themselves to the corresponding oxides or(oxy)hydroxides and effectively catalyze electrochemical oxygenevolution27,28. Examining the restructuring of catalyst materials iscrucial to understanding structure-reactivity correlations and todesigning better catalysts.
In situ and operando characterization techniques are highlyuseful in uncovering catalyst restructuring phenomena, as theycan provide chemical and physical information under reactionconditions29–33. Under certain circumstances where the recon-structed catalysts are subject to further structural changes whenthe reaction conditions are removed, operando characterization isnecessary to identify the real catalytically active species. In thisregard, in-situ and operando X-ray absorption spectroscopy(XAS) is particularly powerful, as the X-ray absorption near edgestructure (XANES) can reveal the oxidation state of the elementof interest, and extended X-ray absorption fine structure (EXAFS)is capable of probing the influence from the local coordinationenvironment. For example, sub-monolayer VOx anchored on anα-Fe2O3 powder surface undergoes redox-induced dynamicchanges of atomic structure and oxidation state, as revealed step-by-step with in-situ XAS34. In another study, XAS is used todetermine the cation occupation of the octahedral and tetrahedralsites in spinel oxides35, which is then identified as a propertydescriptor of the catalytic activity of these materials for theoxygen reduction and evolution reactions36.
Here we report the restructuring of three molecularly struc-tured Cu catalysts under electrochemical CO2 reduction condi-tions as probed by in-situ and operando XAS, and the correlationof the catalyst structures to the observed catalytic properties. Thethree Cu-complex materials, namely copper(II) phthalocyanine(CuPc), copper(II) benzene-1,3,5-tricarboxylate (btc) MOF(HKUST-1), and copper(II) 1,4,8,11-tetraazacyclotetradecanechloride ([Cu(cyclam)]Cl2), all show catalytic activity toward CO2
reduction to CH4, working as heterogeneous catalysts in 0.5 MKHCO3 aqueous electrolyte. Among them, the CuPc catalystexhibits the highest activity and selectivity; the partial currentdensity and Faradaic efficiency of the CH4 product reach 13 mAcm−2 and 66% at – 1.06 V vs the reversible hydrogen electrode(RHE), respectively. Thus, CuPc represents one of the mostefficient catalysts for electrochemical reduction of CO2 to CH4. Insitu and operando XANES and EXAFS studies reveal that theCuPc molecules restructure to metallic Cu clusters with a size of~ 2 nm under the working conditions and the Cu nanoclustersconvert back to the original CuPc structure upon release of thenegative electrode potential. In contrast, HKUST-1 and[Cu(cyclam)]Cl2 irreversibly decompose to form much larger Cunanostructures. These comparisons indicate that the good per-formance of the CuPc catalyst originates from the reversibleformation of Cu nanoclusters. Further analysis provides deeperunderstanding toward designing metal-complex molecularstructures for controllably generating active species under reac-tion conditions to catalyze desirable chemistry.
ResultsElectrocatalytic measurements. CuPc is a molecular complexwith the Cu2+ ion coordinated by the conjugated planar Pc2–
ligand (Fig. 1a). HKUST-1 is a MOF with Cu(II) nodes coordi-nated by negatively charged btc linkers (Fig. 1b). [Cu(cyclam)]Cl2features a Cu2+ ion coordinated by a non-conjugated charge-neutral ligand (Fig. 1c). The three materials were each mixed withmildly oxidized multi-wall carbon nanotubes (CNTs)20,37,38 toform a catalyst layer on electrodes for electrocatalytic measure-ments in CO2-saturated 0.5 M KHCO3 aqueous solution.Controlled-potential electrolysis was performed with the workingelectrode potential being varied in the range between – 0.76 and– 1.36 V vs RHE at 0.1 V intervals. At relatively lower over-potentials, the major CO2 reduction products over the CuPccatalyst are formic acid (HCOOH), C2H4, and CO (Fig. 1d), withthe Faradaic efficiencies being 25, 13, and 6% at – 0.86 V,respectively. As the electrode potential goes to – 0.96 V, CH4
becomes the dominant CO2 reduction product. At – 1.06 V, amaximum Faradaic efficiency of 66% together with a partialcurrent density of 13 mA cm−2 is achieved for CO2 conversion toCH4 (Fig. 1d, e), corresponding to a CH4 formation rate of 0.36mmol s−1 gCuPc−1 and 0.86 µmol C−1. The HKUST-1 and[Cu(cyclam)]Cl2 catalysts are also active for catalyzing CO2
electroreduction to CH4. However, the onset potentials are100 ~ 200 mV more negative than that of the CuPc catalyst.HKUST-1 reaches a maximum Faradaic efficiency of 27% at– 1.16 V with a partial current density of 4.4 mA cm−2 (Supple-mentary Fig. 1), whereas [Cu(cyclam)]Cl2 electrodes does so at– 1.26 V with the Faradaic efficiency and partial current densitybeing 15% and 2.8 mA cm−2 (Supplementary Fig. 2). The Faradaicefficiencies and partial current densities of the gas-phase productsover the three catalyst electrodes at – 1.06 V are compared inFig. 1f, g. It can be clearly discerned that CuPc is a much moreactive and selective electrocatalyst than HKUST-1 and[Cu(cyclam)]Cl2 for CO2 reduction to CH4.
In situ and operando XANES measurements. To probe thestructural and oxidation state changes of these Cu-complexelectrocatalysts as they perform CO2 reduction, we carried out in-situ XAS measurements (Supplementary Fig. 3) under the sameelectrochemical conditions. During the measurements, theworking electrode potential was first deceased in steps from theopen circuit voltage (OCV, ~ 0.8 V vs RHE) to – 1.06 V vs RHE,and then increased back to 0.64 V. Each potential was held for atleast 1 h until the XAS spectra were recorded. Thus, the results
ARTICLE NATURE COMMUNICATIONS | DOI: 10.1038/s41467-018-02819-7
2 NATURE COMMUNICATIONS | (2018) 9:415 |DOI: 10.1038/s41467-018-02819-7 |www.nature.com/naturecommunications

reflect stable states under the electrochemical conditions. Underthe initial OCV conditions, all the three catalysts show a char-acteristic Cu(II) peak (1 s → 3d transition) at ~ 8,985 eV in thecorresponding normalized Cu K-edge XANES spectrum (Fig. 2a,d,g). As the potential applied to the CuPc electrode is decreased to– 0.66 V, a small absorption peak appears at ~ 8,981 eV in thespectrum (Fig. 2a), indicating the formation of Cu(I). Anotherpeak at ~ 8,980 eV starts to develop at – 0.86 V, which corre-sponds to Cu(0). At – 1.06 V, where the highest Faradaic effi-ciency for CO2 reduction to CH4 is reached, the XANES isdominated by the Cu(0) feature. The spectral evolution andabsorption peaks can be discerned more clearly in the derivativecurves of the XANES spectra (Fig. 2b). It is worth noting that theCu(II) peak persists throughout all the applied potentials (Fig. 2a,b), which means that not all the Cu(II) centers are converted tolower oxidation states under the CO2 reduction conditions. Uponswitching the electrode potential back to 0.64 V, the Cu(0) peakdisappears and the XANES spectrum is almost restored to thatunder the initial OCV conditions (Fig. 2a, b), suggesting that thepotential-induced oxidation state changes for the CuPc catalystare reversible. In contrast, neither the HKUST-1 nor the [Cu(cyclam)]Cl2 exhibits such a reversibility, though both of them areconverted to Cu(0) at –1.06 V (Fig. 2d,e,g,sh). The cycled
HKUST-1 electrode mainly contains Cu(I) species while the [Cu(cyclam)]Cl2 electrode is dominated by metallic Cu (Fig. 2d,e,g,hand Supplementary Fig. 4).
In situ and operando EXAFS measurements. To examine thelocal coordination environment changes, we performed in-situEXAFS measurements. At the working potential of – 1.06 V, allthe three catalysts exhibit a characteristic metallic Cu–Cu bondpeak at R = ~ 2.2 Å in the corresponding Fourier-transformedEXAFS spectrum (Fig. 2c, f, i), which is consistent with theappearance of Cu(0) observed in the XANES spectra. In parti-cular, the EXAFS spectra of HKUST-1 and [Cu(cyclam)]Cl2 at– 1.06 V are similar to that of the Cu metal standard in the entireR and k ranges (Fig. 2f, i and Supplementary Figs 4, 5), suggestingformation of bulk Cu metal. As the electrode potential returns to0.64 V, the metallic Cu originated from HKUST-1 is oxidized toCu2O, which is supported by the similarity to the EXAFS spec-trum of the Cu2O standard (Fig. 2f and Supplementary Fig. 5).The Cu(0) species derived from [Cu(cyclam)]Cl2 form a reddishmetallic sheen on the electrode (Supplementary Fig. 6), whichresults in reduced and noisy signals in the XAS spectrum recor-ded at – 1.06 V (Supplementary Fig. 4). In contrast, the CuPc
Far
adai
c ef
ficie
ncy
(%)
100
90
80
70
60
50
40
30
20
10
0
Far
adai
c ef
ficie
ncy
(%)
Cur
rent
den
sity
(m
A c
m–2
)
100
90
80
70
60
50
40
30
20
10
0
Potential (V vs RHE)
CuPc HKUST-1 [Cu(cyclam)]CI2 CuPc HKUST-1 [Cu(cyclam)]CI2
–1.4 –1.3 –1.2 –1.1 –1.0 –0.9 –0.8
80
70
60
50
40
30
20
10
0
Potential (V vs RHE)
Cur
rent
den
sity
(m
A c
m–2
)
–1.4 –1.3 –1.2 –1.1 –1.0 –0.9 –0.8
H2
CO
CH4
C2H4
NH NH
HN
2CI–
HN
Cu
H2
CO
CH4
C2H4
H2
CO
CH4
C2H4
HCOOH
H2
CO
CH4
C2H4
Cu
O
C
HCOOH
18
16
14
12
10
8
6
4
2
0
Cu N
N
N
N
N
N
N
N
a b c
d e
f g
Fig. 1 Molecular structures of three Cu-complex materials and their electrocatalytic performance for CO2 reduction. Molecular structures of a CuPc,b HKUST-1, and c [Cu(cyclam)]Cl2. Potential-dependent d Faradaic efficiencies and e partial current densities of products for CO2 electroreductionreaction catalyzed by CuPc. Comparison of f Faradaic efficiency and g partial current density distributions among CO2 electroreduction reactions catalyzedby the three materials at – 1.06 V vs RHE. Error bars represent the SD from multiple measurements
NATURE COMMUNICATIONS | DOI: 10.1038/s41467-018-02819-7 ARTICLE
NATURE COMMUNICATIONS | (2018) 9:415 |DOI: 10.1038/s41467-018-02819-7 |www.nature.com/naturecommunications 3
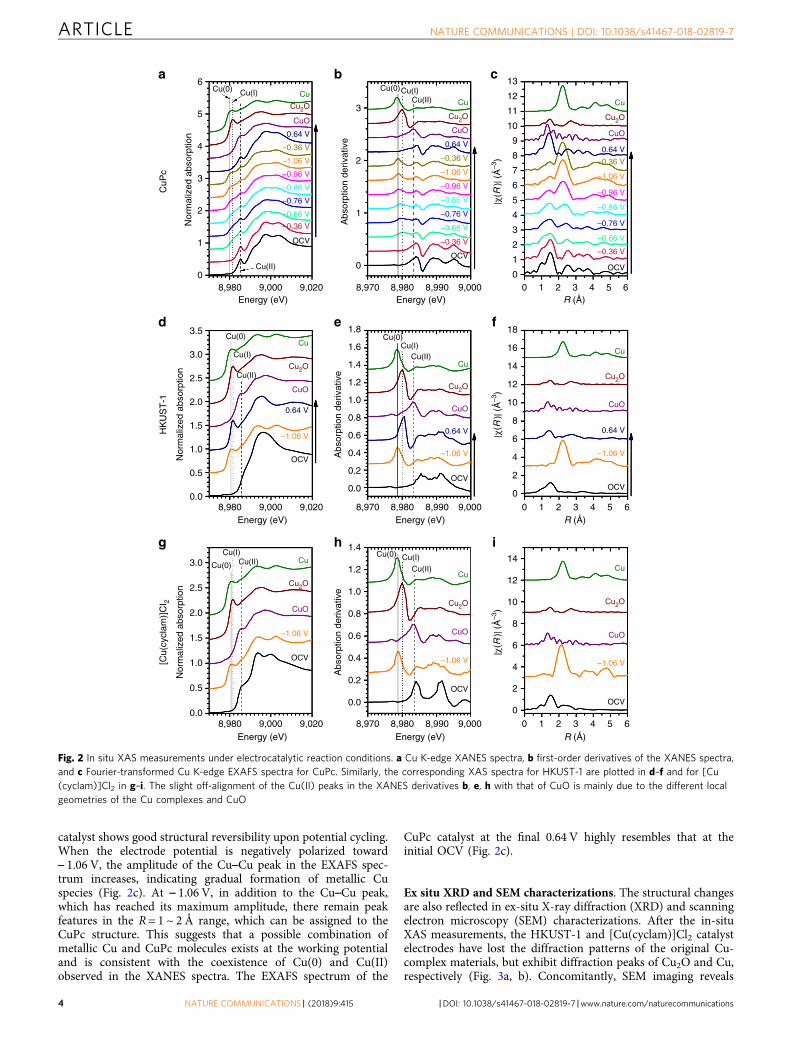
catalyst shows good structural reversibility upon potential cycling.When the electrode potential is negatively polarized toward– 1.06 V, the amplitude of the Cu–Cu peak in the EXAFS spec-trum increases, indicating gradual formation of metallic Cuspecies (Fig. 2c). At – 1.06 V, in addition to the Cu–Cu peak,which has reached its maximum amplitude, there remain peakfeatures in the R = 1 ~ 2 Å range, which can be assigned to theCuPc structure. This suggests that a possible combination ofmetallic Cu and CuPc molecules exists at the working potentialand is consistent with the coexistence of Cu(0) and Cu(II)observed in the XANES spectra. The EXAFS spectrum of the
CuPc catalyst at the final 0.64 V highly resembles that at theinitial OCV (Fig. 2c).
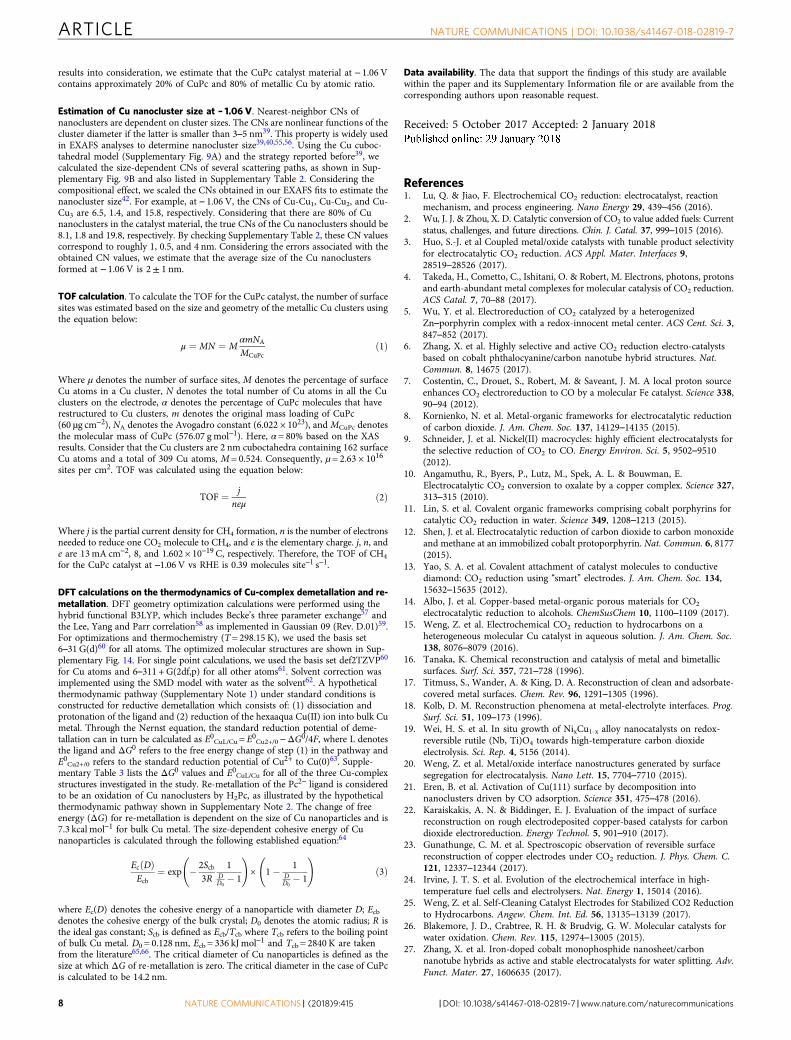
Ex situ XRD and SEM characterizations. The structural changesare also reflected in ex-situ X-ray diffraction (XRD) and scanningelectron microscopy (SEM) characterizations. After the in-situXAS measurements, the HKUST-1 and [Cu(cyclam)]Cl2 catalystelectrodes have lost the diffraction patterns of the original Cu-complex materials, but exhibit diffraction peaks of Cu2O and Cu,respectively (Fig. 3a, b). Concomitantly, SEM imaging reveals
Cu(0) Cu(0)Cu(I) Cu(I)
Cu(II)Cu
Cu2O
CuO
0.64 V
–0.36 V
–1.06 V
–0.96 V
–0.86 V
–0.76 V
–0.66 V
–0.36 V
OCV
Cu
Cu
Cu
Cu2O
Cu2OCu2O
CuO
CuO CuO0.64 V
0.64 V 0.64 V–1.06 V
–1.06 V –1.06 VOCV
OCVOCV
Cu
Cu2O
CuO
0.64 V
–0.36 V
–1.06 V
–0.96 V
–0.86 V
–0.76 V
–0.66 V
–0.36 V
OCV
Cu
Cu2O
CuO
0.64 V
–0.36 V
–1.06 V
–0.96 V
–0.86 V
–0.76 V
–0.66 V
–0.36 V
OCVCu(II)
6
5
4
3
2
1
0
13
12
11
10
9
8
7
6
5
4
3
2
1
0
3
2
1
0
18
16
14
12
10
8
6
4
2
0|χ
(R)|
(Å–3
)|χ
(R)|
(Å–3
)|χ
(R)|
(Å–3
)
14
12
10
8
6
4
2
0
3.5
3.0
2.5
2.0
1.5
1.0
0.5
0.0
3.0
2.5
2.0
1.5
1.0
0.5
0.0
Abs
orpt
ion
deriv
ativ
e
[Cu(
cycl
am)]
CI 2
Nor
mal
ized
abs
orpt
ion
Nor
mal
ized
abs
orpt
ion
HK
US
T-1
Nor
mal
ized
abs
orpt
ion
CuP
c
Abs
orpt
ion
deriv
ativ
eA
bsor
ptio
n de
rivat
ive
Cu(I)
Cu(0) Cu(II)
8,980 9,000 9,020 9,0008,9908,9808,970Energy (eV)
0 1 2 3 4 5 6R (Å)Energy (eV)
8,980 9,000 9,020 9,0008,9908,9808,970Energy (eV)
0 1 2 3 4 5 6R (Å)Energy (eV)
8,980 9,000 9,020 9,0008,9908,9808,970Energy (eV)
0 1 2 3 4 5 6R (Å)Energy (eV)
1.8
1.6
1.2
1.4
1.0
0.8
0.6
0.4
0.2
0.0
1.2
1.4
1.0
0.8
0.6
0.4
0.2
0.0
Cu
CuCu
Cu2O
Cu2O Cu2OCuO
CuO CuO–1.06 V
–1.06 V –1.06 VOCV
OCV
OCV
Cu(II)Cu(I)Cu(0)
Cu(I)
Cu(0)
Cu(II)
Cu(II)Cu(I)
Cu(0)
a b c
d e f
g h i
Fig. 2 In situ XAS measurements under electrocatalytic reaction conditions. a Cu K-edge XANES spectra, b first-order derivatives of the XANES spectra,and c Fourier-transformed Cu K-edge EXAFS spectra for CuPc. Similarly, the corresponding XAS spectra for HKUST-1 are plotted in d–f and for [Cu(cyclam)]Cl2 in g–i. The slight off-alignment of the Cu(II) peaks in the XANES derivatives b, e, h with that of CuO is mainly due to the different localgeometries of the Cu complexes and CuO
ARTICLE NATURE COMMUNICATIONS | DOI: 10.1038/s41467-018-02819-7
4 NATURE COMMUNICATIONS | (2018) 9:415 |DOI: 10.1038/s41467-018-02819-7 |www.nature.com/naturecommunications

morphological changes from the original submicron-sized parti-cles (Fig. 3d, e) to the final dendritic nanostructures (Fig. 3g, h).Unlike HKUST-1 and [Cu(cyclam)]Cl2, the CuPc catalyst elec-trode shows no existence of Cu2O or Cu (Fig. 3c), agreeing withthe in-situ XAS results that the CuPc structure is recovered afterthe working electrode potential is returned to 0.64 V. Theremaining CuPc diffraction peaks are likely due to the remainingCuPc crystals that have not experienced restructuring. It isinteresting to note that the cycled CuPc electrode features amicrostructure of ~ 10 nm-sized nanoparticles well dispersed onthe surface of CNTs (Fig. 3i), obviously different from that of theoriginal CuPc (Fig. 3f). The observed morphological changes are aresult of the restructuring processes taking place during thepotential cycle even though the original CuPc molecular structureis recovered after the cycle.
EXAFS modeling and analysis. To gain further insights into therestructuring of the CuPc catalyst under the electrochemical CO2
reduction reaction conditions, we performed model-based ana-lysis to quantify the in-situ EXAFS results. The fitted spectra areshown in Fig. 4a, b and Supplementary Fig. 7, and the fittingparameters related to the major scattering paths (SupplementaryFig. 8) are listed in Supplementary Table 1. Independent para-meters of coordination number (CN) are assigned to everyscattering path for each spectrum separately. As shown in Sup-plementary Table 1, the Cu–N and Cu–C (belonging to CuPc)CNs decrease quickly while the Cu–Cu (belonging to metallic Cu)CNs gradually increase with the decrease of the applied potential.
Negligible changes in the scattering path lengths are found. NoCu metal components can be fitted into the EXAFS spectrarecorded at potentials of – 0.36 V or higher. At – 0.66 and– 0.76 V, small Cu–Cu CNs are obtained. Much larger Cu–CuCNs are obtained as the potential is switched to – 0.86 V or lower.As the potential is switched back to 0.64 V, the CuPc componentstarts to dominate the spectrum again with the CNs recovered tothe values obtained under the initial OCV conditions. Thepotential-dependent first-shell Cu–Cu CNs are plotted in Fig. 4c.In combination with the above XANES analysis, the EXAFS fit-ting results can be rationalized as follows. The CuPc structure ispredominant at OCV and – 0.36 V. At – 0.66 and – 0.76 V, theCuPc structure starts to change with the Cu(II) partially reducedto Cu(I) and thus the CuPc CNs decrease but almost no Cu(0)component is observed. At – 0.86 V or lower potentials, Cu(II)and Cu(I) are converted to Cu(0) and the metallic Cu phasenucleates and grows as evidenced by the increasing Cu–Cu CNs.The overall consistency between the XANES and EXAFS analysisdemonstrates the validity of our results on the restructuring of theCuPc electrocatalyst under the CO2 reduction conditions.
We further determine the size of the metallic Cu speciesreversibly generated by CuPc under the electrochemical condi-tions. As CNs are sensitive to particle size in the nanometerregime39,40, it is possible to estimate the size of the formedmetallic Cu species based on the Cu–Cu CNs. Following thestrategy in the previous reports39,40, we built a cuboctahedralmodel (typically adopted for face-centered cubic metal nanopar-ticles)41 to obtain the size-dependent Cu-Cu CNs (Supplementary
Inte
nsity
(a.
u.)
Inte
nsity
(a.
u.)
Inte
nsity
(a.
u.)
HK
US
T-1
[Cu(
cycl
am)]
CI 2
CuP
c
2� (°)
FreshAfter electrocatalysisBackground
Cu2O HKUST-1
10 20 30 40 50 60
2� (°)10 20 30 40 50 60
2� (°)10 20 30 40 50 60
FreshAfter electrocatalysisBackground
[Cu(cyclam)]CI2Cu
FreshAfter electrocatalysisBackground
CuPc
Before Aftera
d
b
c
e
f
g
h
i
Fig. 3 XRD and SEM characterizations of the three catalyst materials before and after electrolysis. XRD patterns of a HKUST-1, b [Cu(cyclam)]Cl2, and cCuPc before and after electrocatalysis. The background diffraction patterns are from carbon paper substrates. SEM images of the d, g HKUST-1, e, h [Cu(cyclam)]Cl2, and f, i CuPc catalyst materials d–f before and g–i after electrocatalysis. Scale bars: d, e, g, h 200 nm and f, i 100 nm
NATURE COMMUNICATIONS | DOI: 10.1038/s41467-018-02819-7 ARTICLE
NATURE COMMUNICATIONS | (2018) 9:415 |DOI: 10.1038/s41467-018-02819-7 |www.nature.com/naturecommunications 5

Fig. 9, Supplementary Table 2). As metallic Cu and CuPc coexiston the electrode, the compositional change would also affect thenominal Cu–Cu CNs derived from the XAS analysis42. We thusperformed linear combination fitting for the XAS spectra at– 1.06 V using the reference spectra of Cu foil and CuPc powder.(Supplementary Fig. 10). It shows that there are approximately20% of CuPc and 80% of metallic Cu in atomic ratio at – 1.06 V.The measured CNs were then corrected using this ratio for thecompositional effect. By comparing the CNs of the cuboctahedralmodel nanoparticles with the corrected CNs, we are able toestimate the size of the metallic Cu species formed at – 1.06 V vsRHE to be 2± 1 nm. Taken together, our results depict a clearpicture for the restructuring-induced electrocatalytic activity ofCuPc. At – 0.86 V, Cu nanoclusters start to form from CuPcdemetallation. At the optimum working potential of – 1.06 Vwhere the highest CO2-to-CH4 Faradaic efficiency is achieved, theCu nanoclusters reach an average size of ~ 2 nm. The corre-sponding CH4 production rate and turnover frequency (TOF) are3.2 mmol s−1 gCu−1 and 0.39 molecules s−1 site−1, respectively.Given the known properties of metallic Cu for electrochemicallyreducing CO2 to hydrocarbons, it is reasonable to believe that theCu nanoclusters generated from CuPc under the workingconditions are most likely the active species for the catalysis.The small size of the Cu nanoclusters generated in-situ appears tobe a major contributor to the high current density and selectivityof the CuPc catalyst for electrochemical CO2 conversion to CH4.Although the size dependence of electrochemical CO2 reductioncatalyzed by Cu nanoparticles is still under some debate, morestudies appear to support the conclusion that smaller particlesizes and more low-coordination surface sites favor CO2
reduction to CH443–45. Shape could be another structural factor
responsible for the observed catalytic properties44,46–50, althoughat the current stage analyzing the shape of the 2 nm-sized Cuclusters existing under electrochemical conditions is beyond ourcapability.
DiscussionCuPc exhibits a different restructuring behavior and thus differ-ent catalytic properties from HKUST-1 and [Cu(cyclam)]Cl2.CuPc reversibly forms Cu nanoclusters under the reaction con-ditions, whereas the latter two irreversibly decompose to formdendritic Cu nanostructures with much larger sizes. Conse-quently, the CuPc catalyst shows a lower overpotential, higherselectivity, and larger current density for electrochemical CO2
conversion to CH4. We also find that our previously reported Cuporphyrin catalyst operates following a similar reversiblerestructuring scheme as the CuPc (Supplementary Fig. 11)15. Tounderstand more about the distinct restructuring behavior ofCuPc, we performed density functional theory (DFT) calculationson the thermodynamics of the reductive demetallation andrecovery of the molecular CuPc structure. Plausible thermo-dynamic pathways (Supplementary Note 1, 2) are constructed forthe two processes. The calculation results reveal that the standardreduction potential of CuPc demetallation is 0.23 ~ 0.35 and 0.53V more negative than those for [Cu(cyclam)]2+ and HKUST-1,respectively (Supplementary Table 3), pointing to the higherthermodynamic stability of the CuPc structure than the other Cucomplexes. The reversible Cu nanocluster formation in the CuPccase is rationalized on the basis of the intrinsic instability of thesmall nanoclusters. The critical diameter of a Cu nanocluster,below which the reverse reaction of the CuPc demetallationprocess can be spontaneous under OCV conditions, is calculatedto be 14 nm. These thermodynamic calculations suggest that themetal ion-ligand binding affinity of a Cu complex influences thethreshold potential as well as the reversibility of the reductivedemetallation process. Although these results are qualitativelyconsistent with our experimental observations, we note that therestructuring process may involve other important factors such asthe solubility of the demetallated ligand and the electronicstructure of the complex. With the speculation that the deme-tallated phthalocyanine ligands must be in the vicinity of the Cunanoclusters, we sketched a schematic model (Fig. 4c lower rightinset) to qualitatively illustrate a possible spatial configuration ofthe active species derived from CuPc (Fig. 4c upper left inset)under the working conditions. The presence of the ligands may bean important contributor to the observed reversible restructuringbehavior and high catalytic activity for CO2 conversion toCH4
51,52.Restructuring of Cu complexes in electrocatalytic materials for
CO2 reduction to CH4 has been elucidated by in-situ and oper-ando XAS characterization of representative Cu complex struc-tures (CuPc, HKUST-1 and [Cu(cyclam)]Cl2) probed underelectrochemical reaction conditions. The highest activity andselectivity of CuPc for catalyzing CO2-to-CH4 conversion amongthe three structures has been explained by its reversible restruc-turing to form ~ 2 nm metallic Cu nanoclusters, which areidentified as the active sites for the electrocatalysis. Our findingssuggest the possibility of controlling catalytic active sites through
0.64 V
–0.36 V
–1.06 V
–0.96 V
–0.86 V
–0.76 V–0.66 V
–0.36 V
OCV
0.64 V
–0.36 V
–1.06 V
–0.96 V
–0.86 V
–0.76 V
–0.66 V
–0.36 V
OCV
8
6
4
2
0
20
15
10
5
0
15
10
5
0
|χ(R
)| (Å
–3)
k2 χ(
k)
(Å–2
)
CN
of C
u-C
u 1
0 5 10 –0.6 –0.7 –0.8 –0.9 –1.0 –1.1Potential (V vs RHE)k (Å–1)R (Å)
0 1 2 3 4 5
a b c
Fig. 4 Fitting results of the EXAFS spectra of the CuPc catalyst at different potentials in CO2-saturated 0.5M aqueous KHCO3. Fitted a R-space and b k-space EXAFS spectra (red traces) of the CuPc catalyst. The experimental data are also plotted for comparison. c First-shell Cu–Cu CNs of the CuPc catalystat different potentials. The upper left inset shows the CuPc crystal structure, and the lower right inset illustrates a possible configuration of the Cunanoclusters generated under the electrocatalytic conditions. Color key: green—C; blue—N; pink—Cu. Error bars represent the uncertainty of CNdetermination from the EXAFS analysis
ARTICLE NATURE COMMUNICATIONS | DOI: 10.1038/s41467-018-02819-7
6 NATURE COMMUNICATIONS | (2018) 9:415 |DOI: 10.1038/s41467-018-02819-7 |www.nature.com/naturecommunications

molecular structure design, providing insights into strategies fordeveloping high-performance electrocatalyst materials.
MethodsMaterials. Nafion perfluorinated resin solution (5 wt% in lower aliphatic alcoholsand water), KHCO3 (ACS Reagent 99.7%), and H3PO4 (ACS Reagent ≥85%) werepurchased from Sigma Aldrich. Graphite rod (99.9995%) and Ti foil (0.127 mm,99.99%) were purchased from Alfa Aesar. CuPc (dye content 99.13%) was pur-chased from Acros Organics. HCl (ACS Reagent 36.5 ~ 38%) was purchased fromJ.T. Baker. All materials were used as obtained without further purification.Deionized water (Milli-Q Millipore 18.2 MΩ cm–1) was used throughout all theexperiments.
HKUST-1 synthesis. To synthesize HKUST-1, a solution of 0.252 g of H3btc (1.2mmol) in 12 ml of water/ethanol (volume ratio = 2:1) was rapidly added into asolution of Cu(NO3)2·3H2O (0.145 g, 0.6 mmol) in 12 ml of water under vigorousmagnetic stirring (1200 rpm). The mixture was kept under the stirring conditionfor 120 min at room temperature. The product was collected by repeated ethanolwash and centrifugation for more than five times until the supernatant was col-orless. The final product was lyophilized. XRD pattern of HKUST-1 powder isshown in Supplementary Fig. 12.
[Cu(cyclam)]Cl2 synthesis. The preparation of [Cu(cyclam)]Cl2 is shown inSupplementary Note 3. The copper salt was used in slightly less amount (0.93 eqrelative to cyclam), to ensure the complete consumption of copper ion, thus toensure the absence of copper ion in the final product. The excess cyclam wasremoved by recrystallization from isopropanol. To synthesize [Cu(cyclam)]Cl2, Asolution of 1,4,8,11-tetraazacyclotetradecane (cyclam, 150 mg, 0.75 mmol) inethanol (20 ml) was added CuCl2·2H2O (121 mg, 0.70 mmol, 0.93 eq) in oneportion. The color changed immediately from colorless to purple. The resultingsolution was stirred at 80 °C under nitrogen atmosphere. After 5 h, the solution wascooled to room temperature and then filtered through a filter paper to remove theinsoluble material, whereupon ethanol was removed by rotary evaporation. Iso-propanol (~ 40 ml) was then added to the purple residue and the mixture washeated to reflux to completely dissolve the solid. The resulting purple solution wasplaced in a freezer (– 20 °C) overnight, and the precipitated solid was collected bycentrifugation and dried under high vacuum to afford [Cu(cyclam)]Cl2 (228 mg,90% yield) as a purple powder. The UV–Vis absorption spectrum of [Cu(cyclam)]Cl2 in CH3OH is shown in Supplementary Fig. 13. High-resolution MS(electrospray) m/z (M – 2Cl)2+ calcd for C12H28CuCl2N4 146.58, found 146.56;λmax(CH3OH) 260, 528 nm.
Characterizations. SEM measurements were performed with a Hitach SU8230cold field emission SEM microscope. XRD patterns were collected with a RigakuSmartLab X-ray Diffractometer equipped with a Cu-target X-ray tube(λ = 0.154 nm) and operated at 40 mA and 44 kV. Absorption spectra wererecorded on a Varian Cary 50 Bio UV-visible spectrophotometer. The massspectral data were obtained from a Thermo Scientific LTQ Orbitrap ELITE massspectrometer. The sample was directly infused into the mass spectrometry via asyringe pump at 5 μl min−1.
Electrochemical measurements. Electrochemical experiments were performed ona Bio-Logic VMP3 Multi Potentiostat using a home-made gas-tight two-compartment electrochemical cell. Two milligrams of catalyst materials and 2 mgof mildly oxidized multi-wall CNTs were mixed with 12 µl of 5 wt% Nafion solu-tion and 2 ml of methanol by sonication for more than 30 min to form homo-geneous inks. The CNTs were prepared following a modified Hummers method asdescribed in our previous work20. For each material, 7.5 µl of the ink was droppedonto a well-polished glassy carbon disk electrode (diameter: 4 mm) and allowed todry. The catalyst mass loading was 60 µg cm−2. A graphite rod and a Ag/AgClelectrode were used as the counter and reference electrodes. The working electrodecompartment and the counter electrode compartment were separated by an anionexchange membrane (Selemion DSV). Each compartment contained 12 ml ofelectrolyte and ~ 18 ml of gas headspace. Pre-purified 0.5 M KHCO3 aqueoussolution was used as the electrolyte for all experiments. The electrolyte was purifiedfollowing a method described in our previous work15. Before measurement, theelectrolyte was pre-saturated with CO2 by bubbling the gas for 15 min. Duringmeasurement, CO2 was continuously bubbled into the electrolyte at a flow rate of10 s.c.c.m. Current densities were normalized to the geometric area of the glassycarbon electrode. All potentials were referred to the RHE and were recorded withiR compensation.
Product quantification. Gas products of electrocatalysis were analyzed by a GC(SRI Multiple Gas Analyzer #5) equipped with molecular sieve 5A and HayeSep Dcolumns with N2 as the carrier gas. Hydrogen was analyzed by a thermal con-ductivity detector, and carbon monoxide, methane, and ethylene were determinedusing a flame ionization detector. The peak areas were converted to gas volumesusing calibration curves. Liquid products were quantified after electrocatalysis by
1H NMR (V600a Varian VNMRS 600MHz NMR). Electrolyte (700 µl) was mixedwith 35 µl of 10 mM dimethyl sulfoxide and 50 mM phenol as internal standards inD2O for the 1H NMR analysis.
In-situ and operando XAS measurements. In-situ XANES and EXAFS experi-ments were carried out at beamline 5BM-D of DND-CAT, Advanced PhotonSource, Argonne National Laboratory. The working electrodes were prepared bydepositing catalysts on ~ 100 μm-thick carbon fiber paper. For HKUST-1 andCuPc, 6.4 mg of material and 1.6 mg of CNTs were mixed with 48 µl of 5 wt%Nafion solution and 2 ml of methanol by sonication for more than 30 min to forma homogeneous ink, and then 140 µl of the ink was drop-dried onto a 2.5 × 1.5 cm2
carbon fiber paper (Toray030–30%PTFE) to form a 0.5 × 1 cm2 active area (cor-responding to a catalyst mass loading of 1.8 mg cm−2). For [Cu(cyclam)]Cl2, 140 µlof a CNT ink (1.6 mg of CNTs mixed with 6.4 µl of 5 wt% Nafion solution and 2 mlof methanol by sonication for more than 30 min) was drop-dried onto a 2.5 × 1.5cm2 carbon fiber paper (GDS1120) to form a 0.5 × 1 cm2 area, and then 140 µl of3.2 mg ml−1 methanol solution of [Cu(cyclam)]Cl2 was drop-dried onto the CNTarea (corresponding to a catalyst mass loading of 1.8 mg cm−2). The catalystelectrode was mounted onto a custom-designed in-situ XAS fluorescence cell(Supplementary Fig. 3), as described in our previous study5,35. The cell which cancontain up to 30 mL of electrolyte was set in a three-electrode configuration. Agraphite rod and a Ag/AgCl electrode were used as the counter and referenceelectrodes, respectively. The same electrolyte was used as described in the Elec-trochemical measurements session. During the in-situ and operando XAS mea-surements, CO2 was constantly bubbled at a flow rate of 30 s.c.c.m. All data werecollected in a fluorescence mode under various applied potentials controlled by aGamry Reference-600 electrochemical workstation. A Vortex ME4 detector wasused to collect the Cu K fluorescence signal while a Si(111) monochromatorscanned the incident X-ray photon energy through the Cu K absorption edge. Themonochromator was detuned to 65% of the maximum intensity at the Cu K edge tominimize the presence of higher harmonics. Each selected potential (iR compen-sated) was held until enough data statistics of XAS were achieved. The X-ray beamwas calibrated using a Cu metal foil. Data reduction, data analysis, and EXAFSfitting were performed with the Athena, Artemis, and IFEFFIT software packages.Standard procedures were used to extract the EXAFS data from the measuredabsorption spectra. The pre-edge background was linearly fitted and subtracted.The post-edge background was determined using a cubic-spline-fit procedure andthen subtracted. Normalization was performed by dividing the data by the height ofthe absorption edge at 50 eV. For quantitative analysis, phase shifts and back-scattering amplitudes were generated by the FEFF calculations based on crystalstructures of Cu and CuPc, and were then calibrated through performing theFEFFIT of the EXAFS data of the reference samples, mainly to obtain the ampli-tude reduction factor (S02) values. With S02 known, the EXAFS data of the catalystmaterials were fitted with such generated phase shifts and amplitudes. Accuraciesof the obtained results presented here are as follows: ΔN (± 10%), ΔR (± 1%), Δσ2(± 10%), and ΔE0 (± 10%)34,53,54.
EXAFS modeling and analysis. The EXAFS data of Cu foil and CuPc powder werefitted (Supplementary Fig. 7) and the obtained S02 values were used as references tocalculate the CNs in the analysis of the in-situ EXAFS data. As the in-situ XANESand EXAFS spectra of CuPc show coexistence of Cu(0) and Cu(II) at severalapplied potentials, it is natural to use the scattering paths from Cu metal and CuPccrystal structures to fit the in-situ EXAFS spectra. To reduce the number of fittingparameters and to increase the information content, co-refinement of a total of 9EXAFS data sets was performed. Many parameters such as mean-square disorder(σ2), energy shift (E0), and scattering path length change (ΔR or α in α*R) areshared across all the data sets, and only the CNs for each scattering path in eachdata set are independent and separated. This results in 50 fitting parameters for atotal of 175 independent variables. For each data set, there is an average of less than6 fitting parameters, much less than what is used in conventional EXAFS fitting. Allof these fitting parameters were used without any particular constraints. Fitting wasdone through three shells by taking into account multiple-scattering paths but onlythe major single scattering paths, namely Cu-N1, Cu-C1, and Cu-N2 for CuPc, aswell as Cu-Cu1, Cu-Cu2, and Cu-Cu3 for Cu, illustrated in Supplementary Fig. 8,are listed in Supplementary Table 1.
Linear combination fit. Owing to the ensemble average nature of XAS measure-ments, it is possible to perform a linear combination fit34 using the referencespectra of Cu foil and CuPc powder to obtain the percentages of Cu nanoclustersand remaining CuPc in the catalyst material. A fit of the XANES spectrum at –1.06 V overestimates the content of CuPc as the characteristic Cu(II) peak of thefitted spectrum is much higher in intensity than that of the measured spectrum(Supplementary Fig. 10A). A fit of the EXAFS spectrum (Supplementary Fig. 10B)gives 13% of CuPc and 87% of metallic Cu. This might have slightly overestimatedthe metallic Cu content as in our case there are Cu nanoclusters which have smalleraverage CNs compared with bulk Cu metal. Furthermore, the CNs of bulk mate-rials in a mixture can reflect their concentrations42. The EXAFS analysis show thatat – 1.06 V the CN of Cu-N1 is 1.2± 0.5, which suggests that the CuPc content is30% ± 12.5% as the theoretical first shell CN of CuPc is 4. Having taken all the
NATURE COMMUNICATIONS | DOI: 10.1038/s41467-018-02819-7 ARTICLE
NATURE COMMUNICATIONS | (2018) 9:415 |DOI: 10.1038/s41467-018-02819-7 |www.nature.com/naturecommunications 7
results into consideration, we estimate that the CuPc catalyst material at – 1.06 Vcontains approximately 20% of CuPc and 80% of metallic Cu by atomic ratio.
Estimation of Cu nanocluster size at – 1.06 V. Nearest-neighbor CNs ofnanoclusters are dependent on cluster sizes. The CNs are nonlinear functions of thecluster diameter if the latter is smaller than 3–5 nm39. This property is widely usedin EXAFS analyses to determine nanocluster size39,40,55,56. Using the Cu cuboc-tahedral model (Supplementary Fig. 9A) and the strategy reported before39, wecalculated the size-dependent CNs of several scattering paths, as shown in Sup-plementary Fig. 9B and also listed in Supplementary Table 2. Considering thecompositional effect, we scaled the CNs obtained in our EXAFS fits to estimate thenanocluster size42. For example, at – 1.06 V, the CNs of Cu-Cu1, Cu-Cu2, and Cu-Cu3 are 6.5, 1.4, and 15.8, respectively. Considering that there are 80% of Cunanoclusters in the catalyst material, the true CNs of the Cu nanoclusters should be8.1, 1.8 and 19.8, respectively. By checking Supplementary Table 2, these CN valuescorrespond to roughly 1, 0.5, and 4 nm. Considering the errors associated with theobtained CN values, we estimate that the average size of the Cu nanoclustersformed at – 1.06 V is 2± 1 nm.
TOF calculation. To calculate the TOF for the CuPc catalyst, the number of surfacesites was estimated based on the size and geometry of the metallic Cu clusters usingthe equation below:
μ ¼ MN ¼ MαmNA
MCuPcð1Þ
Where µ denotes the number of surface sites, M denotes the percentage of surfaceCu atoms in a Cu cluster, N denotes the total number of Cu atoms in all the Cuclusters on the electrode, α denotes the percentage of CuPc molecules that haverestructured to Cu clusters, m denotes the original mass loading of CuPc(60 µg cm−2), NA denotes the Avogadro constant (6.022 × 10²³), and MCuPc denotesthe molecular mass of CuPc (576.07 g mol−1). Here, α = 80% based on the XASresults. Consider that the Cu clusters are 2 nm cuboctahedra containing 162 surfaceCu atoms and a total of 309 Cu atoms, M = 0.524. Consequently, µ = 2.63 × 10¹⁶
sites per cm2. TOF was calculated using the equation below:
TOF ¼ jneμ
ð2Þ
Where j is the partial current density for CH4 formation, n is the number of electronsneeded to reduce one CO2 molecule to CH4, and e is the elementary charge. j, n, ande are 13mA cm−2, 8, and 1.602 × 10⁻¹⁹ C, respectively. Therefore, the TOF of CH4
for the CuPc catalyst at –1.06 V vs RHE is 0.39 molecules site−1 s−1.
DFT calculations on the thermodynamics of Cu-complex demetallation and re-metallation. DFT geometry optimization calculations were performed using thehybrid functional B3LYP, which includes Becke’s three parameter exchange57 andthe Lee, Yang and Parr correlation58 as implemented in Gaussian 09 (Rev. D.01)59.For optimizations and thermochemistry (T = 298.15 K), we used the basis set6–31 G(d)60 for all atoms. The optimized molecular structures are shown in Sup-plementary Fig. 14. For single point calculations, we used the basis set def2TZVP60
for Cu atoms and 6–311 + G(2df,p) for all other atoms61. Solvent correction wasimplemented using the SMD model with water as the solvent62. A hypotheticalthermodynamic pathway (Supplementary Note 1) under standard conditions isconstructed for reductive demetallation which consists of: (1) dissociation andprotonation of the ligand and (2) reduction of the hexaaqua Cu(II) ion into bulk Cumetal. Through the Nernst equation, the standard reduction potential of deme-tallation can in turn be calculated as E0CuL/Cu = E0Cu2+/0 −ΔG0/4F, where L denotesthe ligand and ΔG0 refers to the free energy change of step (1) in the pathway andE0Cu2+/0 refers to the standard reduction potential of Cu2+ to Cu(0)63. Supple-mentary Table 3 lists the ΔG0 values and E0CuL/Cu for all of the three Cu-complexstructures investigated in the study. Re-metallation of the Pc2− ligand is consideredto be an oxidation of Cu nanoclusters by H2Pc, as illustrated by the hypotheticalthermodynamic pathway shown in Supplementary Note 2. The change of freeenergy (ΔG) for re-metallation is dependent on the size of Cu nanoparticles and is7.3 kcal mol−1 for bulk Cu metal. The size-dependent cohesive energy of Cunanoparticles is calculated through the following established equation:64
EcðDÞEcb
¼ exp � 2Scb3R
1DD0
� 1
!´ 1� 1
DD0
� 1
!ð3Þ
where Ec(D) denotes the cohesive energy of a nanoparticle with diameter D; Ecbdenotes the cohesive energy of the bulk crystal; D0 denotes the atomic radius; R isthe ideal gas constant; Scb is defined as Ecb/Tcb where Tcb refers to the boiling pointof bulk Cu metal. D0 = 0.128 nm, Ecb = 336 kJ mol−1 and Tcb = 2840 K are takenfrom the literature65,66. The critical diameter of Cu nanoparticles is defined as thesize at which ΔG of re-metallation is zero. The critical diameter in the case of CuPcis calculated to be 14.2 nm.
Data availability. The data that support the findings of this study are availablewithin the paper and its Supplementary Information file or are available from thecorresponding authors upon reasonable request.
Received: 5 October 2017 Accepted: 2 January 2018
References1. Lu, Q. & Jiao, F. Electrochemical CO2 reduction: electrocatalyst, reaction
mechanism, and process engineering. Nano Energy 29, 439–456 (2016).2. Wu, J. J. & Zhou, X. D. Catalytic conversion of CO2 to value added fuels: Current
status, challenges, and future directions. Chin. J. Catal. 37, 999–1015 (2016).3. Huo, S.-J. et al Coupled metal/oxide catalysts with tunable product selectivity
for electrocatalytic CO2 reduction. ACS Appl. Mater. Interfaces 9,28519–28526 (2017).
4. Takeda, H., Cometto, C., Ishitani, O. & Robert, M. Electrons, photons, protonsand earth-abundant metal complexes for molecular catalysis of CO2 reduction.ACS Catal. 7, 70–88 (2017).
5. Wu, Y. et al. Electroreduction of CO2 catalyzed by a heterogenizedZn–porphyrin complex with a redox-innocent metal center. ACS Cent. Sci. 3,847–852 (2017).
6. Zhang, X. et al. Highly selective and active CO2 reduction electro-catalystsbased on cobalt phthalocyanine/carbon nanotube hybrid structures. Nat.Commun. 8, 14675 (2017).
7. Costentin, C., Drouet, S., Robert, M. & Saveant, J. M. A local proton sourceenhances CO2 electroreduction to CO by a molecular Fe catalyst. Science 338,90–94 (2012).
8. Kornienko, N. et al. Metal-organic frameworks for electrocatalytic reductionof carbon dioxide. J. Am. Chem. Soc. 137, 14129–14135 (2015).
9. Schneider, J. et al. Nickel(II) macrocycles: highly efficient electrocatalysts forthe selective reduction of CO2 to CO. Energy Environ. Sci. 5, 9502–9510(2012).
10. Angamuthu, R., Byers, P., Lutz, M., Spek, A. L. & Bouwman, E.Electrocatalytic CO2 conversion to oxalate by a copper complex. Science 327,313–315 (2010).
11. Lin, S. et al. Covalent organic frameworks comprising cobalt porphyrins forcatalytic CO2 reduction in water. Science 349, 1208–1213 (2015).
12. Shen, J. et al. Electrocatalytic reduction of carbon dioxide to carbon monoxideand methane at an immobilized cobalt protoporphyrin. Nat. Commun. 6, 8177(2015).
13. Yao, S. A. et al. Covalent attachment of catalyst molecules to conductivediamond: CO2 reduction using “smart” electrodes. J. Am. Chem. Soc. 134,15632–15635 (2012).
14. Albo, J. et al. Copper-based metal-organic porous materials for CO2
electrocatalytic reduction to alcohols. ChemSusChem 10, 1100–1109 (2017).15. Weng, Z. et al. Electrochemical CO2 reduction to hydrocarbons on a
heterogeneous molecular Cu catalyst in aqueous solution. J. Am. Chem. Soc.138, 8076–8079 (2016).
16. Tanaka, K. Chemical reconstruction and catalysis of metal and bimetallicsurfaces. Surf. Sci. 357, 721–728 (1996).
17. Titmuss, S., Wander, A. & King, D. A. Reconstruction of clean and adsorbate-covered metal surfaces. Chem. Rev. 96, 1291–1305 (1996).
18. Kolb, D. M. Reconstruction phenomena at metal-electrolyte interfaces. Prog.Surf. Sci. 51, 109–173 (1996).
19. Wei, H. S. et al. In situ growth of NixCu1-x alloy nanocatalysts on redox-reversible rutile (Nb, Ti)O4 towards high-temperature carbon dioxideelectrolysis. Sci. Rep. 4, 5156 (2014).
20. Weng, Z. et al. Metal/oxide interface nanostructures generated by surfacesegregation for electrocatalysis. Nano Lett. 15, 7704–7710 (2015).
21. Eren, B. et al. Activation of Cu(111) surface by decomposition intonanoclusters driven by CO adsorption. Science 351, 475–478 (2016).
22. Karaiskakis, A. N. & Biddinger, E. J. Evaluation of the impact of surfacereconstruction on rough electrodeposited copper-based catalysts for carbondioxide electroreduction. Energy Technol. 5, 901–910 (2017).
23. Gunathunge, C. M. et al. Spectroscopic observation of reversible surfacereconstruction of copper electrodes under CO2 reduction. J. Phys. Chem. C.121, 12337–12344 (2017).
24. Irvine, J. T. S. et al. Evolution of the electrochemical interface in high-temperature fuel cells and electrolysers. Nat. Energy 1, 15014 (2016).
25. Weng, Z. et al. Self-Cleaning Catalyst Electrodes for Stabilized CO2 Reductionto Hydrocarbons. Angew. Chem. Int. Ed. 56, 13135–13139 (2017).
26. Blakemore, J. D., Crabtree, R. H. & Brudvig, G. W. Molecular catalysts forwater oxidation. Chem. Rev. 115, 12974–13005 (2015).
27. Zhang, X. et al. Iron-doped cobalt monophosphide nanosheet/carbonnanotube hybrids as active and stable electrocatalysts for water splitting. Adv.Funct. Mater. 27, 1606635 (2017).
ARTICLE NATURE COMMUNICATIONS | DOI: 10.1038/s41467-018-02819-7
8 NATURE COMMUNICATIONS | (2018) 9:415 |DOI: 10.1038/s41467-018-02819-7 |www.nature.com/naturecommunications
28. Xu, X., Song, F. & Hu, X. L. A nickel iron diselenide-derived efficient oxygen-evolution catalyst. Nat. Commun. 7, 12324 (2016).
29. Feng, Z. X. et al. Catalytic activity and stability of oxides: the role of near-surfaceatomic structures and compositions. Acc. Chem. Res. 49, 966–973 (2016).
30. Liu, X. S., Yang, W. L. & Liu, Z. Recent progress on synchrotron-based in-situsoft X-ray spectroscopy for energy materials. Adv. Mater. 26, 7710–7729 (2014).
31. Stoerzinger, K. A., Hong, W. T., Crumlin, E. J., Bluhm, H. & Shao-Horn, Y.Insights into electrochemical reactions from ambient pressure photoelectronspectroscopy. Acc. Chem. Res. 48, 2976–2983 (2015).
32. Feng, Z. X. et al. Catalysts transform while molecules react: An atomic-scaleview. J. Phys. Chem. Lett. 4, 285–291 (2013).
33. Nilsson, A. et al. Catalysis in real time using X-ray lasers. Chem. Phys. Lett.675, 145–173 (2017).
34. Feng, Z. et al. Atomic-scale cation dynamics in a monolayer VOx/α-Fe2O3
catalyst. RSC Adv. 5, 103834–103840 (2015).35. Wei, C. et al. Valence change ability and geometrical occupation of
substitution cations determine the pseudocapacitance of spinel ferrite XFe2O4
(X=Mn, Co, Ni, Fe). Chem. Mater. 28, 4129–4133 (2016).36. Zhang, Y. Q. et al. A rational design for enhanced oxygen reduction: Strongly
coupled silver nanoparticles and engineered perovskite nanofibers. NanoEnergy 38, 392–400 (2017).
37. Liu, W. et al. A highly active and stable hydrogen evolution catalyst based onpyrite-structured cobalt phosphosulfide. Nat. Commun. 7, 10771 (2016).
38. Fan, Q., Liu, W., Weng, Z., Sun, Y. M. & Wang, H. L. Ternary hybrid materialfor high-performance lithium-sulfur battery. J. Am. Chem. Soc. 137,12946–12953 (2015).
39. Frenkel, A. I. Solving the structure of nanoparticles by multiple-scatteringEXAFS analysis. J. Synchrotron Radiat. 6, 293–295 (1999).
40. Frenkel, A. I., Yevick, A., Cooper, C. & Vasic, R. Modeling the structure andcomposition of nanoparticles by extended X-ray absorption fine-structurespectroscopy. Annu. Rev. Anal. Chem. 4, 23–39 (2011).
41. Li, Y. M. et al. A Pt-cluster-based heterogeneous catalyst for homogeneouscatalytic reactions: X-ray absorption spectroscopy and reaction kinetic studiesof their activity and stability against leaching. J. Am. Chem. Soc. 133,13527–13533 (2011).
42. Carta, D. et al. Structural characterization study of FeCo alloy nanoparticles ina highly porous aerogel silica matrix. J. Chem. Phys. 127, 204705 (2007).
43. Tang, W. et al. The importance of surface morphology in controlling theselectivity of polycrystalline copper for CO2 electroreduction. Phys. Chem.Chem. Phys. 14, 76–81 (2012).
44. Manthiram, K., Beberwyck, B. J. & Aivisatos, A. P. Enhanced electrochemicalmethanation of carbon dioxide with a dispersible nanoscale copper catalyst. J.Am. Chem. Soc. 136, 13319–13325 (2014).
45. Kas, R., Kortlever, R., Yilmaz, H., Koper, M. T. M. & Mul, G. Manipulating thehydrocarbon selectivity of copper nanoparticles in CO2 electroreduction byprocess conditions. Chemelectrochem 2, 354–358 (2015).
46. Li, Y. F. et al. Structure-sensitive CO2 electroreduction to hydrocarbons onultrathin 5-fold twinned copper nanowires. Nano Lett. 17, 1312–1317 (2017).
47. Loiudice, A. et al. Tailoring copper nanocrystals towards C2 products inelectrochemical CO2 reduction. Angew. Chem. Int. Ed. 55, 5789–5792 (2016).
48. Roberts, F. S., Kuhl, K. P. & Nilsson, A. High selectivity for ethylene fromcarbon dioxide reduction over copper nanocube electrocatalysts. Angew.Chem. Int. Ed. 54, 5179–5182 (2015).
49. Reske, R., Mistry, H., Behafarid, F., Cuenya, B. R. & Strasser, P. Particle sizeeffects in the catalytic electroreduction of CO2 on Cu nanoparticles. J. Am.Chem. Soc. 136, 6978–6986 (2014).
50. Raciti, D., Livi, K. J. & Wang, C. Highly dense Cu nanowires for low-overpotential CO2 reduction. Nano Lett. 15, 6829–6835 (2015).
51. Alfonso, D. R., Kauffman, D. & Matranga, C. Active sites of ligand-protectedAu-25 nanoparticle catalysts for CO2 electroreduction to CO. J. Chem. Phys.144, 184705 (2016).
52. Fang, Y. X. & Flake, J. C. Electrochemical reduction of CO2 at functionalizedAu electrodes. J. Am. Chem. Soc. 139, 3399–3405 (2017).
53. Keller, D. E., Koningsberger, D. C. & Weckhuysen, B. M. Elucidation of themolecular structure of hydrated vanadium oxide species by X-ray absorptionspectroscopy: Correlation between the V…V coordination number anddistance and the point of zero charge of the support oxide. Phys. Chem. Chem.Phys. 8, 4814–4824 (2006).
54. Li, G. G., Bridges, F. & Booth, C. H. X-ray-absorption fine-structure standards:A comparison of experiment and theory. Phys. Rev. B 52, 6332–6348 (1995).
55. Rockenberger, J. et al. EXAFS studies on the size dependence of structural anddynamic properties of CdS nanoparticles. J. Phys. Chem. B. 101, 2691–2701(1997).
56. Jentys, A. Estimation of mean size and shape of small metal particles byEXAFS. Phys. Chem. Chem. Phys. 1, 4059–4063 (1999).
57. Becke, A. D. Density-functional thermochemistry. III. The role of exactexchange. J. Chem. Phys. 98, 5648–5652 (1993).
58. Lee, C. T., Yang, W. T. & Parr, R. G. Development of the Colle-Salvetticorrelation-energy formula into a functional of the electron-density. Phys. Rev.B 37, 785–789 (1988).
59. Frisch, M. et al. Gaussian 09, Revision D. 01 (Gaussian, Inc., Wallingford CT,2009).
60. Weigend, F. & Ahlrichs, R. Balanced basis sets of split valence, triple zetavalence and quadruple zeta valence quality for H to Rn: Design andassessment of accuracy. Phys. Chem. Chem. Phys. 7, 3297–3305 (2005).
61. Krishnan, R., Binkley, J. S., Seeger, R. & Pople, J. A. Self-consistent molecular-orbital methods. XX. A basis set for correlated wave-functions. J. Chem. Phys.72, 650–654 (1980).
62. Marenich, A. V., Cramer, C. J. & Truhlar, D. G. Universal solvation modelbased on solute electron density and on a continuum model of the solventdefined by the bulk dielectric constant and atomic surface tensions. J. Phys.Chem. B. 113, 6378–6396 (2009).
63. Bard, A. J., Parsons, R. & Jordan, J. Standard Potentials in Aqueous Solution(CRC Press, New York, 1985).
64. Jiang, Q., Li, J. C. & Chi, B. Q. Size-dependent cohesive energy of nanocrystals.Chem. Phys. Lett. 366, 551–554 (2002).
65. Greenwood, N. N. & Earnshaw, A. Chemistry of the Elements 2nd edn(Butterworth-Heinemann, Oxford, 1997).
66. Kittel, C. Introduction to Solid State Physics 8th edn (John Wiley & Sons, NewYork, 2004).
AcknowledgementsThe work is supported by the National Science Foundation (Grant CHE-1651717), theDoctoral New Investigator grant from the ACS Petroleum Research Fund, the GlobalInnovation Initiative from Institute of International Education, and the Callahan FacultyScholar Endowment Fund from Oregon State University. The synthetic work was sup-ported by the U.S. Department of Energy, Chemical Sciences, Geosciences, and Bios-ciences Division, Office of Basic Energy Sciences, Office of Science (Grant DEFG02-07ER15909). Additional support was provided by a generous donation from the TomKatFoundation. V.S.B. acknowledges support from the Air Force Office of ScientificResearch grant FA9550-13-1-0020 and supercomputing time from the NERSC. Y.L.acknowledges financial support from Shenzhen Fundamental Research Funding(JCYJ20160608140827794) and Peacock Plan (KQTD20140630160825828). XAS mea-surements were done at 5-BM-D of DND-CAT at Advanced Photon Source (APS) ofArgonne National Laboratory (ANL). DND-CAT is supported through E. I. duPont deNemours & Co., Northwestern University, and The Dow Chemical Company. The use ofAPS of ANL is supported by DOE under Contract Number DE-AC02-06CH11357.
Author contributionsZ.W., Y.L., Z.F., and H.W. conceived the project. J.J. and X.-F.W. synthesized thematerials. Z.W. and S.H. carried out the electrochemical measurements and materialcharacterization. Z.W., M.W., Q.M., and Z.F. carried out the in-situ and operando XASmeasurements. Y.W. and K.Y. performed cluster size analysis and DFT calculations.M.W. and Z.F. analyzed the XAS data. Z.W., Y.W., Z.F., and H. W. wrote the manuscript.G.W.B, V.S.B, Y.L., Z.F., and H.W. supervised the project. All authors discussed theresults and commented on the manuscript.
Additional informationSupplementary Information accompanies this paper at https://doi.org/10.1038/s41467-018-02819-7.
Competing interests: The authors declare no competing financial interests.
Reprints and permission information is available online at http://npg.nature.com/reprintsandpermissions/
Publisher's note: Springer Nature remains neutral with regard to jurisdictional claims inpublished maps and institutional affiliations.
Open Access This article is licensed under a Creative CommonsAttribution 4.0 International License, which permits use, sharing,
adaptation, distribution and reproduction in any medium or format, as long as you giveappropriate credit to the original author(s) and the source, provide a link to the CreativeCommons license, and indicate if changes were made. The images or other third partymaterial in this article are included in the article’s Creative Commons license, unlessindicated otherwise in a credit line to the material. If material is not included in thearticle’s Creative Commons license and your intended use is not permitted by statutoryregulation or exceeds the permitted use, you will need to obtain permission directly fromthe copyright holder. To view a copy of this license, visit http://creativecommons.org/licenses/by/4.0/.
© The Author(s) 2018
NATURE COMMUNICATIONS | DOI: 10.1038/s41467-018-02819-7 ARTICLE
NATURE COMMUNICATIONS | (2018) 9:415 |DOI: 10.1038/s41467-018-02819-7 |www.nature.com/naturecommunications 9