active tectonics of utah - purdue...
TRANSCRIPT

1
Active tectonics of Utah
Version 1.0, March 2002 – E. Calais
The transition between the Basin and Range and the Colorado Plateau Utah is located at the transition between the Colorado plateau and the Basin and Range province (Figure 1). The Colorado Plateau is made of relatively undeformed Mesozoic sedimentary rocks (Figure 2). The Basin and Range is a succession of roughly NS-trending depressions and ranges essential made of Jurassic and Cretaceous rocks, affected by the Laramide orogeny (Upper Cretaceous to Eocene). Following that orogeny, the Basin and Range province was dissected by normal faults in an NE-SW to E-W extensional regime. These normal faults bound a series of basin and topographic highs, that have been developing since the Oligocene (Figure 2). Extension in the Basin and Range is still active today, as evidenced by the seismicity and recent geodetic measurements (see below). The Wasatch fault forms the core of the structural transition between the Basin and Range and the Colorado Plateau (Figure 1). It extends from Malda City, Idaho, on the north, to Fayette, Utah, on the south, over a distance of 380 km. The Wasatch fault is marked by large scarps cutting through glacial, lacustrine, colluvial, and alluvial deposits of middle to late Pleistocene age (30-50 m high) and smaller (3-10 m high) scarps on Holocene deposits.
Figure 1. Topography of Utah.
Figure 2. Geological map of Utah.
2
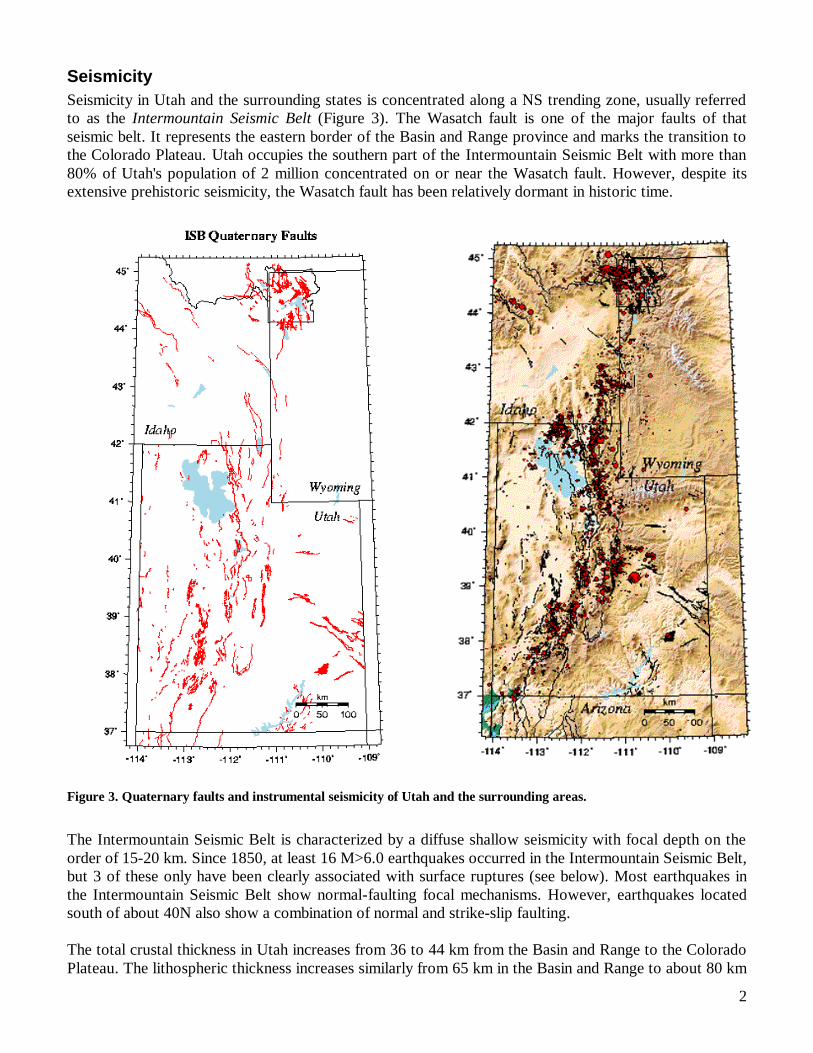
Seismicity Seismicity in Utah and the surrounding states is concentrated along a NS trending zone, usually referred to as the Intermountain Seismic Belt (Figure 3). The Wasatch fault is one of the major faults of that seismic belt. It represents the eastern border of the Basin and Range province and marks the transition to the Colorado Plateau. Utah occupies the southern part of the Intermountain Seismic Belt with more than 80% of Utah's population of 2 million concentrated on or near the Wasatch fault. However, despite its extensive prehistoric seismicity, the Wasatch fault has been relatively dormant in historic time.
Figure 3. Quaternary faults and instrumental seismicity of Utah and the surrounding areas.
The Intermountain Seismic Belt is characterized by a diffuse shallow seismicity with focal depth on the order of 15-20 km. Since 1850, at least 16 M>6.0 earthquakes occurred in the Intermountain Seismic Belt, but 3 of these only have been clearly associated with surface ruptures (see below). Most earthquakes in the Intermountain Seismic Belt show normal-faulting focal mechanisms. However, earthquakes located south of about 40N also show a combination of normal and strike-slip faulting. The total crustal thickness in Utah increases from 36 to 44 km from the Basin and Range to the Colorado Plateau. The lithospheric thickness increases similarly from 65 km in the Basin and Range to about 80 km
3
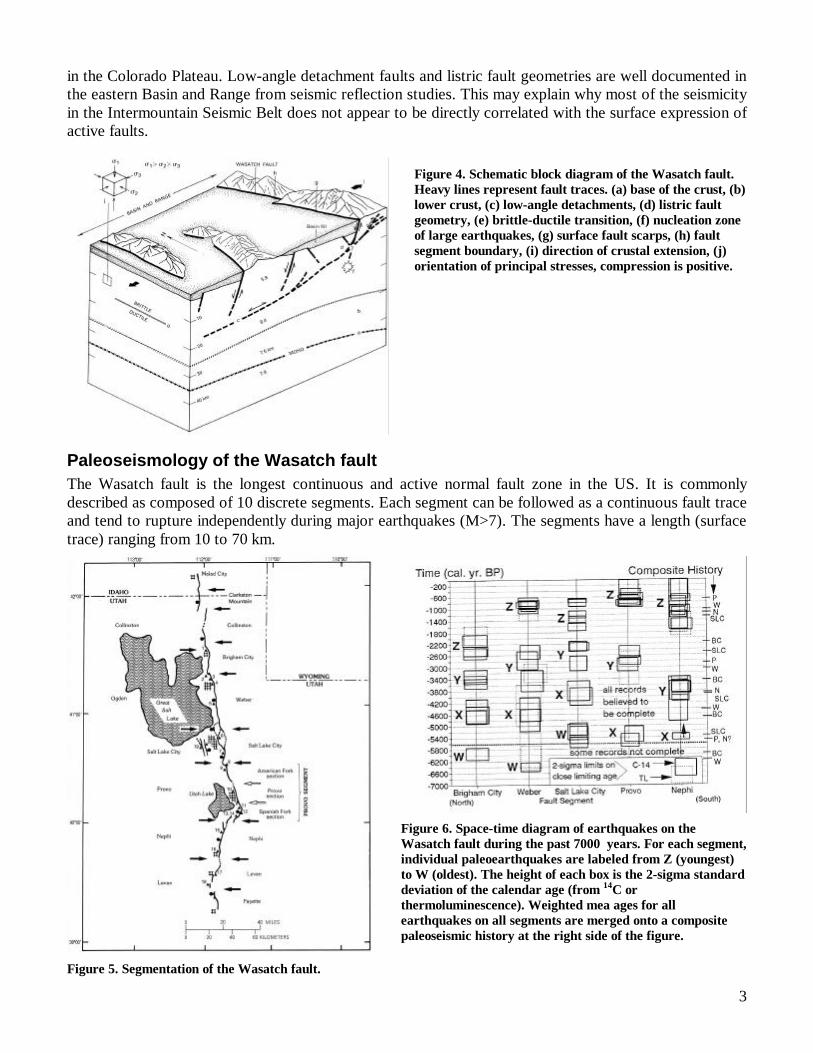
in the Colorado Plateau. Low-angle detachment faults and listric fault geometries are well documented in the eastern Basin and Range from seismic reflection studies. This may explain why most of the seismicity in the Intermountain Seismic Belt does not appear to be directly correlated with the surface expression of active faults.
Figure 4. Schematic block diagram of the Wasatch fault. Heavy lines represent fault traces. (a) base of the crust, (b) lower crust, (c) low-angle detachments, (d) listric fault geometry, (e) brittle-ductile transition, (f) nucleation zone of large earthquakes, (g) surface fault scarps, (h) fault segment boundary, (i) direction of crustal extension, (j) orientation of principal stresses, compression is positive.
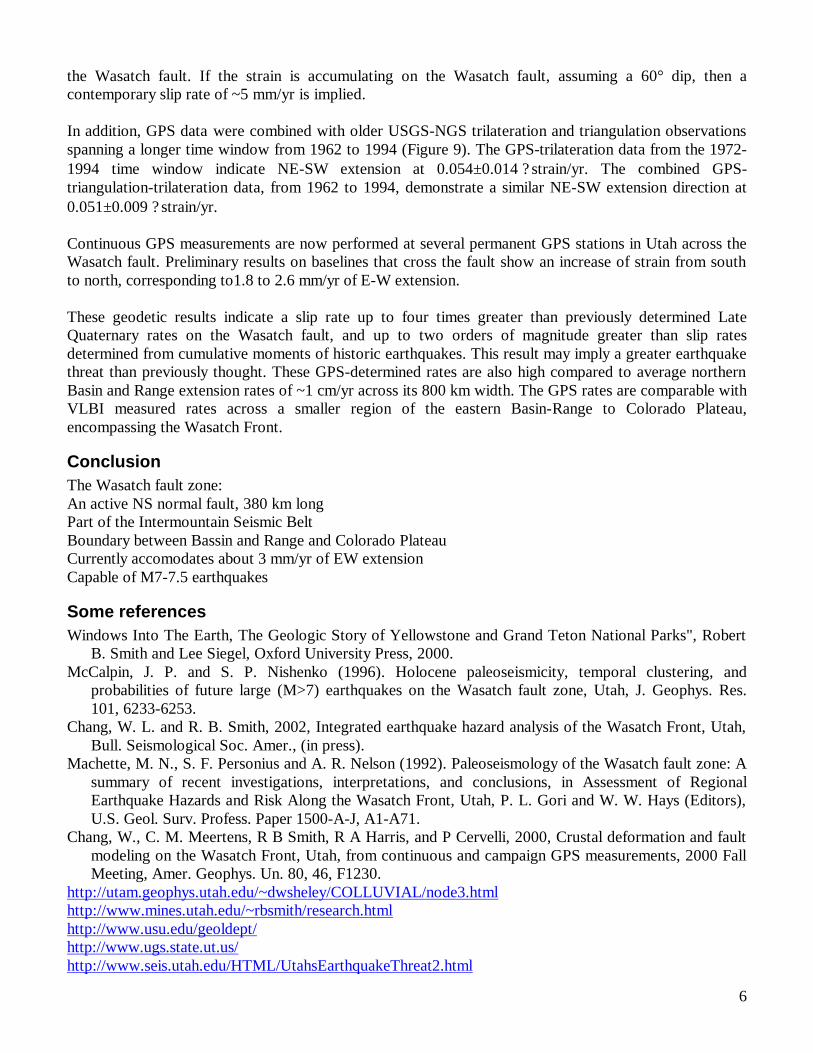
Paleoseismology of the Wasatch fault The Wasatch fault is the longest continuous and active normal fault zone in the US. It is commonly described as composed of 10 discrete segments. Each segment can be followed as a continuous fault trace and tend to rupture independently during major earthquakes (M>7). The segments have a length (surface trace) ranging from 10 to 70 km.
Figure 5. Segmentation of the Wasatch fault.
Figure 6. Space-time diagram of earthquakes on the Wasatch fault during the past 7000 years. For each segment, individual paleoearthquakes are labeled from Z (youngest) to W (oldest). The height of each box is the 2-sigma standard deviation of the calendar age (from 14C or thermoluminescence). Weighted mea ages for all earthquakes on all segments are merged onto a composite paleoseismic history at the right side of the figure.

4
A precise definition of fault segments is important because their length places an upper bound on maximum earthquake size. In other words, each segment corresponds to the extent of surface rupturing that is expected during a large magnitude earthquake. The longer the segment, the larger the earthquake magnitude. Things get more complicated because earthquakes can break several segments at the same time (like the Landers earthquake in 1992, that ruptured 3 contiguous fault segments), resulting in far greater magnitude that expected from the rupture of any of the individual segments alone.Since the late 1970’s, extensive trenching studies have been performed along the Wasatch fault. Trenches across active fault segments are used to identify and date pre-historical earthquakes, also called paleo-earthquakes. Repeated Holocene movement has been documented along several segments of the Wasatch fault. On the basis of a series of trenches across the Wastach fault, Machette et al. (1991) showed that the average reccurence interval for segments having repeated Holocene movement is about 1980±310 years. However, that value varies widely from one segment to the next (Figure 6). For instance, the recurrence interval for the Weber segment is about 500 years, whereas it is about 4000 years for the Salt Lake City segment. The combined average repeat time for large earthquakes (magnitude greater than 7) on any of the five central segments (Brigham City, Weber, Salt Lake City, Provo, and Nephi segments) of the Wasatch fault zone is 350 years. The average repeat time on any single segment ranges from about 1,200 to 2,600 years. The time since the last earthquakes on the five central segments ranges from 620 to 2,120 years. Based on geologic studies and assuming earthquakes are random, the probability of a large earthquake on the central segments of the Wasatch fault alone is 13 percent in 50 years and 25 percent in 100 years. On the Salt Lake City segment, the probability may be as high as 57 percent in 100 years (McCalpin and Nishenko, 1996).
Figure 7. Surface rupture caused by the Ms=7.3 Bora Peak earthquake, October 1983, Idaho. A man holding a measuring pole gives the scale.
Figure 8. Fault scarp caused by the Ms=7.5 Hebgen Lake earthquake.
Only 3 ground rupturing historical (= recorded by humans) earthquakes occurred on the Intramountain Seismic Belt:

5
? ? The Ms=7.5, 1959, Hebgen Lake earthquake in southern Montana. It was a normal faulting event along reactivated Laramide faults, with about 2 m of surface offset along two faults having a total length of about 35 km. This earthquake is sometimes considered to represent the maximum earthquake for the Intramountain Seismic Belt.
? ? The Ms=7.3, 1983, Borah Peak earthquake in central Idaho (Figure 7). The earthquake was associated with about 1 m of surface offset along a 37 km surface rupture. The earthquake mechanism shows a combination of left-lateral slip (30%) and dip-slip motion.
? ? The M=6.6, 1934, Hansel valley earthquake in northern Utah. It produced an average offset of about 0.5 m along an 11 km long rupture.
Geodetic measurements across the Wasatch fault The University of Utah is conducting precise Global Positioning System (GPS) measurements along the 370 km long Wasatch fault in Utah in order to assess slip rate and strain accumulation on this major Quaternary fault. The GPS measurements are performed using repeated campaigns and continuous measurements at permanent sites.
Figure 9. Summary of geodetic measurements in the Salt Lake City area, Utah.
Figure 10. Velocity at permanent GPS stations with respect to stable North America.
Several GPS surveys between 1992 and 2000 occupied about 90 sites spread over the Wasatch zone. Uncertainties for the campaigns average 2-3 mm for the N-S and E-W components, and 8-9 mm for the vertical component. Results from 1992 to 1995 GPS surveys at 30 sites reveal east-west extensional strain at 0.049±0.023 ? strain/yr. These rates correspond to 2.7±1.3 mm/yr across a 55 km wide region spanning
6
the Wasatch fault. If the strain is accumulating on the Wasatch fault, assuming a 60° dip, then a contemporary slip rate of ~5 mm/yr is implied. In addition, GPS data were combined with older USGS-NGS trilateration and triangulation observations spanning a longer time window from 1962 to 1994 (Figure 9). The GPS-trilateration data from the 1972-1994 time window indicate NE-SW extension at 0.054±0.014 ? strain/yr. The combined GPS-triangulation-trilateration data, from 1962 to 1994, demonstrate a similar NE-SW extension direction at 0.051±0.009 ? strain/yr. Continuous GPS measurements are now performed at several permanent GPS stations in Utah across the Wasatch fault. Preliminary results on baselines that cross the fault show an increase of strain from south to north, corresponding to1.8 to 2.6 mm/yr of E-W extension. These geodetic results indicate a slip rate up to four times greater than previously determined Late Quaternary rates on the Wasatch fault, and up to two orders of magnitude greater than slip rates determined from cumulative moments of historic earthquakes. This result may imply a greater earthquake threat than previously thought. These GPS-determined rates are also high compared to average northern Basin and Range extension rates of ~1 cm/yr across its 800 km width. The GPS rates are comparable with VLBI measured rates across a smaller region of the eastern Basin-Range to Colorado Plateau, encompassing the Wasatch Front.
Conclusion The Wasatch fault zone: An active NS normal fault, 380 km long Part of the Intermountain Seismic Belt Boundary between Bassin and Range and Colorado Plateau Currently accomodates about 3 mm/yr of EW extension Capable of M7-7.5 earthquakes
Some references Windows Into The Earth, The Geologic Story of Yellowstone and Grand Teton National Parks", Robert
B. Smith and Lee Siegel, Oxford University Press, 2000. McCalpin, J. P. and S. P. Nishenko (1996). Holocene paleoseismicity, temporal clustering, and
probabilities of future large (M>7) earthquakes on the Wasatch fault zone, Utah, J. Geophys. Res. 101, 6233-6253.
Chang, W. L. and R. B. Smith, 2002, Integrated earthquake hazard analysis of the Wasatch Front, Utah, Bull. Seismological Soc. Amer., (in press).
Machette, M. N., S. F. Personius and A. R. Nelson (1992). Paleoseismology of the Wasatch fault zone: A summary of recent investigations, interpretations, and conclusions, in Assessment of Regional Earthquake Hazards and Risk Along the Wasatch Front, Utah, P. L. Gori and W. W. Hays (Editors), U.S. Geol. Surv. Profess. Paper 1500-A-J, A1-A71.
Chang, W., C. M. Meertens, R B Smith, R A Harris, and P Cervelli, 2000, Crustal deformation and fault modeling on the Wasatch Front, Utah, from continuous and campaign GPS measurements, 2000 Fall Meeting, Amer. Geophys. Un. 80, 46, F1230.
http://utam.geophys.utah.edu/~dwsheley/COLLUVIAL/node3.html http://www.mines.utah.edu/~rbsmith/research.html http://www.usu.edu/geoldept/ http://www.ugs.state.ut.us/ http://www.seis.utah.edu/HTML/UtahsEarthquakeThreat2.html
7
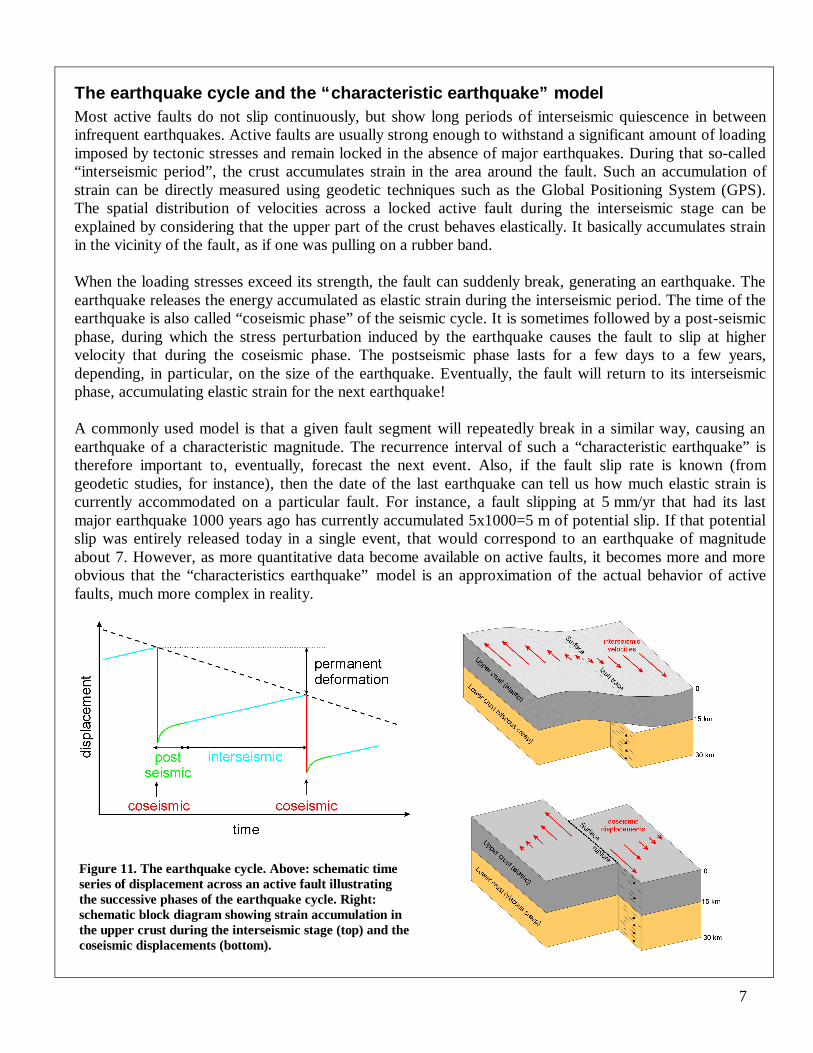
The earthquake cycle and the “characteristic earthquake” model Most active faults do not slip continuously, but show long periods of interseismic quiescence in between infrequent earthquakes. Active faults are usually strong enough to withstand a significant amount of loading imposed by tectonic stresses and remain locked in the absence of major earthquakes. During that so-called “interseismic period”, the crust accumulates strain in the area around the fault. Such an accumulation of strain can be directly measured using geodetic techniques such as the Global Positioning System (GPS). The spatial distribution of velocities across a locked active fault during the interseismic stage can be explained by considering that the upper part of the crust behaves elastically. It basically accumulates strain in the vicinity of the fault, as if one was pulling on a rubber band. When the loading stresses exceed its strength, the fault can suddenly break, generating an earthquake. The earthquake releases the energy accumulated as elastic strain during the interseismic period. The time of the earthquake is also called “coseismic phase” of the seismic cycle. It is sometimes followed by a post-seismic phase, during which the stress perturbation induced by the earthquake causes the fault to slip at higher velocity that during the coseismic phase. The postseismic phase lasts for a few days to a few years, depending, in particular, on the size of the earthquake. Eventually, the fault will return to its interseismic phase, accumulating elastic strain for the next earthquake! A commonly used model is that a given fault segment will repeatedly break in a similar way, causing an earthquake of a characteristic magnitude. The recurrence interval of such a “characteristic earthquake” is therefore important to, eventually, forecast the next event. Also, if the fault slip rate is known (from geodetic studies, for instance), then the date of the last earthquake can tell us how much elastic strain is currently accommodated on a particular fault. For instance, a fault slipping at 5 mm/yr that had its last major earthquake 1000 years ago has currently accumulated 5x1000=5 m of potential slip. If that potential slip was entirely released today in a single event, that would correspond to an earthquake of magnitude about 7. However, as more quantitative data become available on active faults, it becomes more and more obvious that the “characteristics earthquake” model is an approximation of the actual behavior of active faults, much more complex in reality.
Figure 11. The earthquake cycle. Above: schematic time series of displacement across an active fault illustrating the successive phases of the earthquake cycle. Right: schematic block diagram showing strain accumulation in the upper crust during the interseismic stage (top) and the coseismic displacements (bottom).
8
The Global Positioning System The Global Positioning System (GPS) is a space geodetic technique based on a constellation of 24 satellites that permanently broadcast a radio signal on two frequencies in the L-band. Using antennas and receivers set up on geodetic benchmarks that collect phase and code data on those two frequencies, and assuming a proper processing of the data, one can determine the relative position of these benchmarks with a precision of about 2-3 millimeters horizontally and 5-10 mm vertically (Figure 12). Consequently, repeated measurements every year of a network of geodetic benchmarks that cover a region of active deformation allows for the direct estimation of the displacements for typical rates of crustal deformation (a few millimeters to a few centimeters per year over 10 to 500 km). GPS is becoming a widely used technique in geophysics because of its accuracy, its relative ease of use, and its versatility. GPS measurements provide direct estimates of motion and strain in the Earth’s crust, which are essential constraints to the coming generation of crustal deformation models, that will be 3-dimensional, multi-layered, and will include realistic dynamics. The question of how stress is transferred in the lithosphere, as a result of long-term processes such as plate motions, gravitational potential energy distribution, or lithosphere/asthenosphere interactions, is indeed a central issue in solid earth science, with direct implications for fundamental geological processes such as the development of mountains and sedimentary basins, inter- and intra- plate deformation, and the triggering of earthquakes. Over the past 5 years, GPS measurements have led to major advances in these areas of geophysics. They have confirmed the validity of rigid global plate motion models and are now able to detect intraplate deformation and recent variations of plate motions. They are widely used to estimate slip rate on active seismogenic faults and invert for the kinematics of earthquake ruptures. Because GPS measurements provide a direct estimate of the total strain rate over a seismogenic zone, they are now a standard part of seismic risk assessment studies. GPS is also used to constrain crust and mantle viscosity from measurements of post-seismic relaxation and post-glacial isostatic adjustment. Recently, permanent GPS measurements at continuously recording sites have led to the discovery of “quiet” slip-events at subduction zones, i.e. rapid aseismic interplate motion.
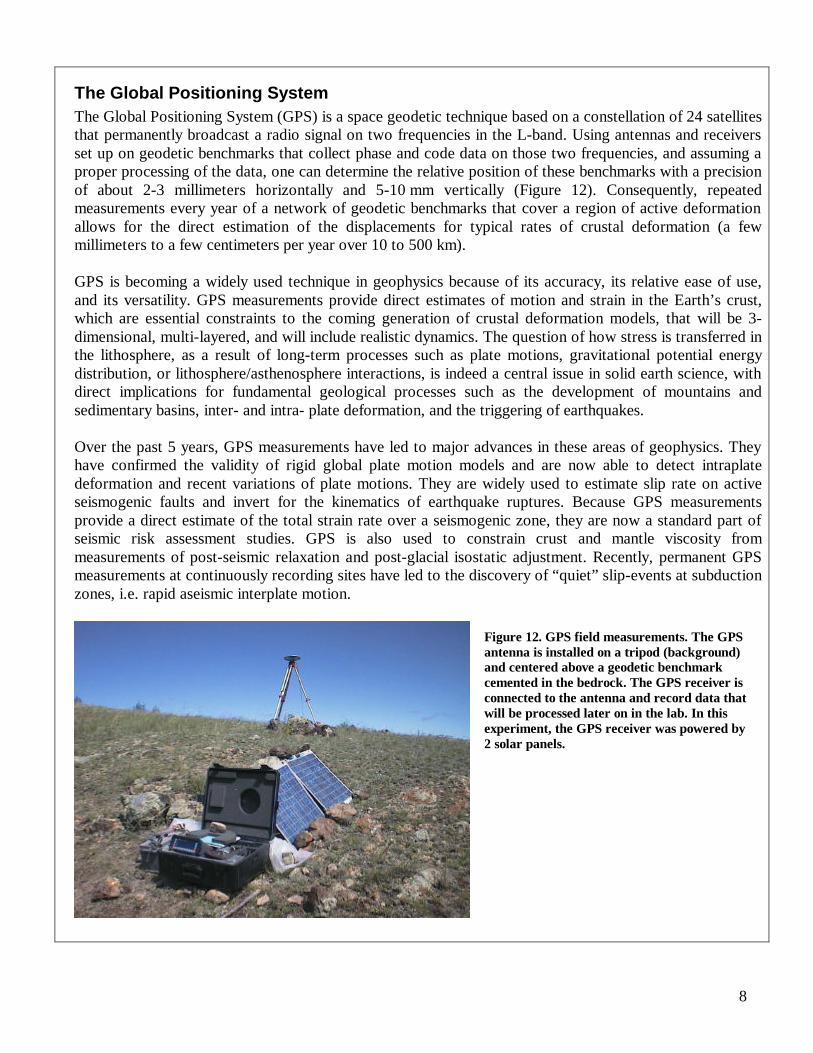
Figure 12. GPS field measurements. The GPS antenna is installed on a tripod (background) and centered above a geodetic benchmark cemented in the bedrock. The GPS receiver is connected to the antenna and record data that will be processed later on in the lab. In this experiment, the GPS receiver was powered by 2 solar panels.

9
Trenching active faults A common method in the study of paleoearthquakes consists of excavating exposures of recent sediments cut by an active fault. The excavation is made with a backhoe, a bulldozer, sometimes just with a shovel (Figure 14). The objective of a trench across an active fault is to find and date earthquakes that occurred in the past 100 000 years or so. Sites for trenching are chosen using careful geologic and geomorphologic observations. In addition, boreholes are sometimes excavated prior to trenching in order to determine, for instance, the depth of the water table. Geologists look for fault scarps, that are the eroded remnants of earthquake surface ruptures. They also look for places where the fault scarp may have been covered by sediments after the earthquake. Once the trench has been excavated and stabilized with shoring, geologists clean the trench walls to remove smearing of the stratigraphy by the excavation process. Then the trench wall is gridded for mapping, using horizontal and vertical strings spaced ~1 m apart. Each grid square is then carefully logged. The objective is (1) to record a precise stratigraphic succession and to date as many horizons as possible, (2) to map the geometry of the faults affecting the sedimentary layers. Once this data has been recorded, one can restore the history of earthquake rupture at that particular trench site by “retro-deforming” the logged section (Figure 13). Finding material suitable for datation is essential. Dating techniques include for instance 14C, and thermoluminescence.
Figure 13. Stratigraphy of the Argyll trench site, New Zealand. (a) actual trench log, (b-e) sequential retrodeformation back trough 4 earthquakes during the past 12 to 25 ky.
Figure 14. Excavation of a trench site in the Philippines.