active vehicle stabilization for reconnaissance and
TRANSCRIPT

2011 NDIA GROUND VEHICLE SYSTEMS ENGINEERING AND TECHNOLOGY
SYMPOSIUM POWER AND MOBILITY (P&M) MINI-SYMPOSIUM
AUGUST 9-11 DEARBORN, MICHIGAN
ACTIVE VEHICLE STABILIZATION FOR RECONNAISSANCE AND COMMAND CONTROL ON THE MOVE
Joseph Beno, PhD
Adam Bryant Damon Weeks
Center for Electromechanics The University of Texas at Austin
Austin, TX
ABSTRACT
Reconnaissance of distant targets with long reaching sensor technology demands a stable
platform upon which to operate. Traditionally this requires vehicles deploying mast mounted
sensors to remain stationary while collecting data. Pairing electronically controlled active
Electromechanical Suspension System (EMS) technology developed by The University of Texas
Center for Electromechanics (UT-CEM) with current reconnaissance vehicle platforms creates
highly mobile intelligence gathering systems capable of operating on the move over rough and
unimproved terrain. This report documents the establishment of criteria by which to judge sensor
platform stabilizing performance of EMS and then uses these metrics to evaluate performance
improvements over conventional passive vehicles. Based on this analysis it may be possible to
operate effectively over cross-country terrains at speeds of 10 to 15 mph while collecting useful
reconnaissance data.
INTRODUCTION Reconnaissance of distant targets with long reaching
sensor technology demands a stable platform upon which to
operate, traditionally this requires vehicles deploying mast
mounted sensors to remain stationary while collecting data.
This opens the possibility of the recon teams lagging from
their optimal positions to be able to best collect the most
relevant and current data on targets of interest. Giving
intelligence gathering equipment operators the ability to
collect data while on the move opens the possibility of
seeking out targets otherwise missed due to terrain or other
obstacles, while at the same time evading detection from
adversaries. Pairing electronically controlled active
Electromechanical Suspension System (EMS) technology
developed by The University of Texas Center for
Electromechanics (UT-CEM) with current reconnaissance
vehicle platforms creates highly mobile intelligence
gathering systems capable of operating on the move over
rough and unimproved terrain. This report documents the
establishment of criteria by which to judge sensor platform
stabilizing performance of EMS and then uses these metrics
to evaluate performance improvements over conventional
passive vehicles. Based on this analysis it may be possible to
operate effectively over cross-country terrains at speeds of
10-15 mph while collecting useful reconnaissance data.
This study was performed by first modifying models
previously developed during a Phase I Office of Naval
Research (ONR) funded effort to design EMS for the LAV
25 to represent the Coyote Reconnaissance Vehicle based on
unclassified information available on the internet. This
involved adding a mast and representative sensor suite
payload, in addition to modifying weight distribution and
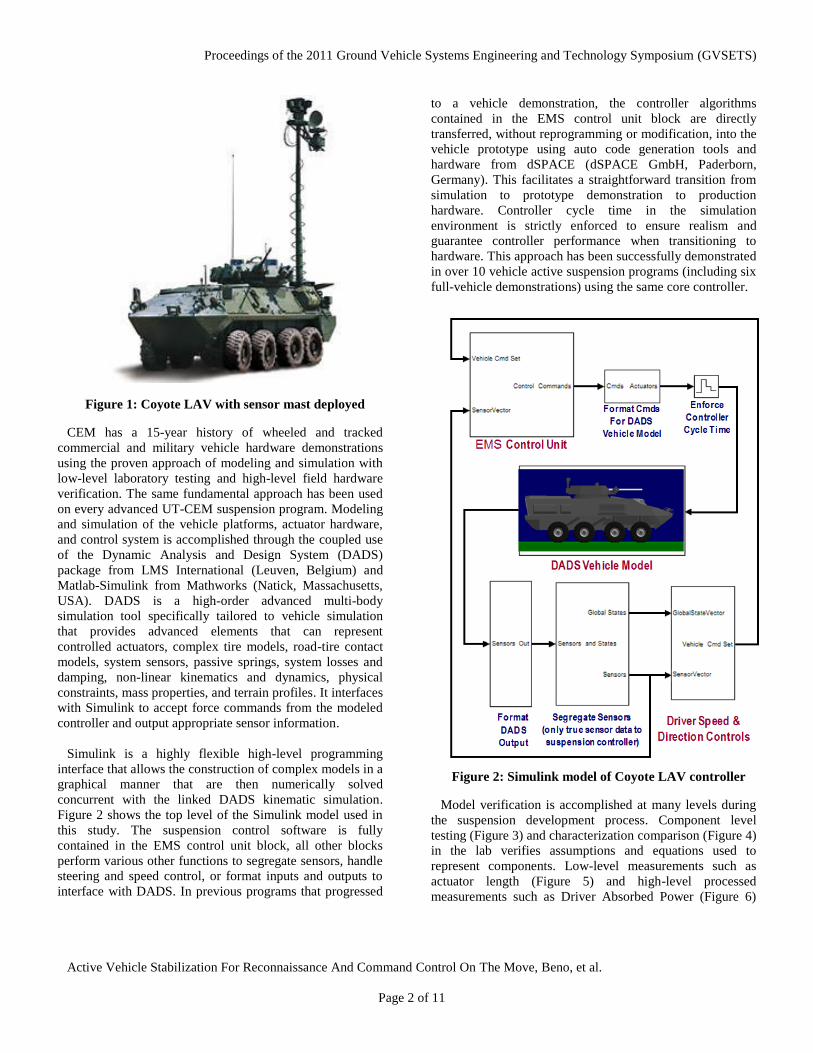
chassis mass to match available information. Figure 1 shows
a representative image used in developing the model and
identifying components to include for illustrative purposes.
Proceedings of the 2011 Ground Vehicle Systems Engineering and Technology Symposium (GVSETS)
Active Vehicle Stabilization For Reconnaissance And Command Control On The Move, Beno, et al.
Page 2 of 11
Figure 1: Coyote LAV with sensor mast deployed
CEM has a 15-year history of wheeled and tracked
commercial and military vehicle hardware demonstrations
using the proven approach of modeling and simulation with
low-level laboratory testing and high-level field hardware
verification. The same fundamental approach has been used
on every advanced UT-CEM suspension program. Modeling
and simulation of the vehicle platforms, actuator hardware,
and control system is accomplished through the coupled use
of the Dynamic Analysis and Design System (DADS)
package from LMS International (Leuven, Belgium) and
Matlab-Simulink from Mathworks (Natick, Massachusetts,
USA). DADS is a high-order advanced multi-body
simulation tool specifically tailored to vehicle simulation
that provides advanced elements that can represent
controlled actuators, complex tire models, road-tire contact
models, system sensors, passive springs, system losses and
damping, non-linear kinematics and dynamics, physical
constraints, mass properties, and terrain profiles. It interfaces
with Simulink to accept force commands from the modeled
controller and output appropriate sensor information.
Simulink is a highly flexible high-level programming
interface that allows the construction of complex models in a
graphical manner that are then numerically solved
concurrent with the linked DADS kinematic simulation.
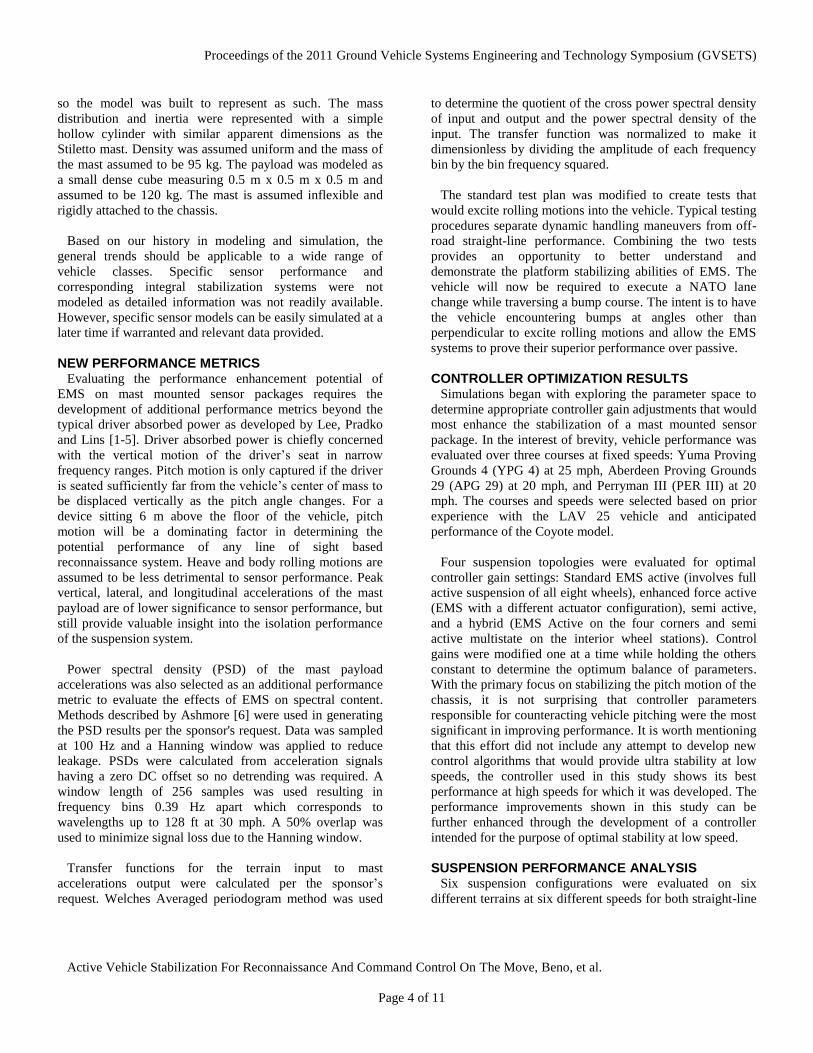
Figure 2 shows the top level of the Simulink model used in
this study. The suspension control software is fully
contained in the EMS control unit block, all other blocks
perform various other functions to segregate sensors, handle
steering and speed control, or format inputs and outputs to
interface with DADS. In previous programs that progressed
to a vehicle demonstration, the controller algorithms
contained in the EMS control unit block are directly
transferred, without reprogramming or modification, into the
vehicle prototype using auto code generation tools and
hardware from dSPACE (dSPACE GmbH, Paderborn,
Germany). This facilitates a straightforward transition from
simulation to prototype demonstration to production
hardware. Controller cycle time in the simulation
environment is strictly enforced to ensure realism and
guarantee controller performance when transitioning to
hardware. This approach has been successfully demonstrated
in over 10 vehicle active suspension programs (including six
full-vehicle demonstrations) using the same core controller.
Figure 2: Simulink model of Coyote LAV controller
Model verification is accomplished at many levels during
the suspension development process. Component level
testing (Figure 3) and characterization comparison (Figure 4)
in the lab verifies assumptions and equations used to
represent components. Low-level measurements such as
actuator length (Figure 5) and high-level processed
measurements such as Driver Absorbed Power (Figure 6)

Proceedings of the 2011 Ground Vehicle Systems Engineering and Technology Symposium (GVSETS)
Active Vehicle Stabilization For Reconnaissance And Command Control On The Move, Beno, et al.
Page 3 of 11
demonstrate very comparable results and provide a high
level of confidence in the accuracy of the modeling results.
Figure 3: Rotary actuator testing with quarter car
simulator rig
Figure 4: Actuator hystersis comparison
Figure 5: Comparison of actuator length between
simulation and collected data
Figure 6: Comparison of driver absorbed power
between simulation and collected data
The model began with the partially validated CEM model
for the 40,000 lb gross vehicle weight (GVW) LAV 25.
Based on information obtained from the internet, the
following assumptions were made regarding the construction
of the Coyote Reconnaissance vehicle: the stock passive
vehicle is modeled with a 28,000 lb GVW, weight scaled
torsion bars in the rear, weight scaled coil springs in the
front, stock shock absorbers on all 8 wheel stations, and a
Will-Burt Stiletto 6 m mast. The mast was mounted to the
floor of the vehicle 4.30 m back from the center of the front
tire contact patch, 0.56 m left of the vehicle centerline, and
0.75 m from the ground at nominal ride height. It was
assumed that full extension would be the worst-case scenario
Proceedings of the 2011 Ground Vehicle Systems Engineering and Technology Symposium (GVSETS)
Active Vehicle Stabilization For Reconnaissance And Command Control On The Move, Beno, et al.
Page 4 of 11
so the model was built to represent as such. The mass
distribution and inertia were represented with a simple
hollow cylinder with similar apparent dimensions as the
Stiletto mast. Density was assumed uniform and the mass of
the mast assumed to be 95 kg. The payload was modeled as
a small dense cube measuring 0.5 m x 0.5 m x 0.5 m and
assumed to be 120 kg. The mast is assumed inflexible and
rigidly attached to the chassis.
Based on our history in modeling and simulation, the
general trends should be applicable to a wide range of
vehicle classes. Specific sensor performance and
corresponding integral stabilization systems were not
modeled as detailed information was not readily available.
However, specific sensor models can be easily simulated at a
later time if warranted and relevant data provided.
NEW PERFORMANCE METRICS Evaluating the performance enhancement potential of
EMS on mast mounted sensor packages requires the
development of additional performance metrics beyond the
typical driver absorbed power as developed by Lee, Pradko
and Lins [1-5]. Driver absorbed power is chiefly concerned
with the vertical motion of the driver’s seat in narrow
frequency ranges. Pitch motion is only captured if the driver
is seated sufficiently far from the vehicle’s center of mass to
be displaced vertically as the pitch angle changes. For a
device sitting 6 m above the floor of the vehicle, pitch
motion will be a dominating factor in determining the
potential performance of any line of sight based
reconnaissance system. Heave and body rolling motions are
assumed to be less detrimental to sensor performance. Peak
vertical, lateral, and longitudinal accelerations of the mast
payload are of lower significance to sensor performance, but
still provide valuable insight into the isolation performance
of the suspension system.
Power spectral density (PSD) of the mast payload
accelerations was also selected as an additional performance
metric to evaluate the effects of EMS on spectral content.
Methods described by Ashmore [6] were used in generating
the PSD results per the sponsor's request. Data was sampled
at 100 Hz and a Hanning window was applied to reduce
leakage. PSDs were calculated from acceleration signals
having a zero DC offset so no detrending was required. A
window length of 256 samples was used resulting in
frequency bins 0.39 Hz apart which corresponds to
wavelengths up to 128 ft at 30 mph. A 50% overlap was
used to minimize signal loss due to the Hanning window.
Transfer functions for the terrain input to mast
accelerations output were calculated per the sponsor’s
request. Welches Averaged periodogram method was used
to determine the quotient of the cross power spectral density
of input and output and the power spectral density of the
input. The transfer function was normalized to make it
dimensionless by dividing the amplitude of each frequency
bin by the bin frequency squared.
The standard test plan was modified to create tests that
would excite rolling motions into the vehicle. Typical testing
procedures separate dynamic handling maneuvers from off-
road straight-line performance. Combining the two tests
provides an opportunity to better understand and
demonstrate the platform stabilizing abilities of EMS. The
vehicle will now be required to execute a NATO lane
change while traversing a bump course. The intent is to have
the vehicle encountering bumps at angles other than
perpendicular to excite rolling motions and allow the EMS
systems to prove their superior performance over passive.
CONTROLLER OPTIMIZATION RESULTS Simulations began with exploring the parameter space to
determine appropriate controller gain adjustments that would
most enhance the stabilization of a mast mounted sensor
package. In the interest of brevity, vehicle performance was
evaluated over three courses at fixed speeds: Yuma Proving
Grounds 4 (YPG 4) at 25 mph, Aberdeen Proving Grounds
29 (APG 29) at 20 mph, and Perryman III (PER III) at 20
mph. The courses and speeds were selected based on prior
experience with the LAV 25 vehicle and anticipated
performance of the Coyote model.
Four suspension topologies were evaluated for optimal
controller gain settings: Standard EMS active (involves full
active suspension of all eight wheels), enhanced force active
(EMS with a different actuator configuration), semi active,
and a hybrid (EMS Active on the four corners and semi
active multistate on the interior wheel stations). Control
gains were modified one at a time while holding the others
constant to determine the optimum balance of parameters.
With the primary focus on stabilizing the pitch motion of the
chassis, it is not surprising that controller parameters
responsible for counteracting vehicle pitching were the most
significant in improving performance. It is worth mentioning
that this effort did not include any attempt to develop new
control algorithms that would provide ultra stability at low
speeds, the controller used in this study shows its best
performance at high speeds for which it was developed. The
performance improvements shown in this study can be
further enhanced through the development of a controller
intended for the purpose of optimal stability at low speed.
SUSPENSION PERFORMANCE ANALYSIS Six suspension configurations were evaluated on six
different terrains at six different speeds for both straight-line

Proceedings of the 2011 Ground Vehicle Systems Engineering and Technology Symposium (GVSETS)
Active Vehicle Stabilization For Reconnaissance And Command Control On The Move, Beno, et al.
Page 5 of 11
and NATO lane change simulations. This required 432
simulations to fully populate the test permutation matrix.
The simulated suspension configurations were stock passive
28k Lb GVW, passive 40 klb GVW with soft air suspension,
8 Wheel Active (Standard EMS) 40 klb GVW, hybrid active
– semi active 40 klb GVW, enhanced force active 40 klb
GVW, and semi active 40 klb GVW. The two passive
models are the stock 28k Lb with stock springs and a 40K
Lb vehicle with very low frequency air springs. The standard
EMS system is an eight-wheeled fully active system. The
hybrid active has active actuators on the front and rear axles
and Semi-Active multi discrete state actuators on the second
and third axle. The enhanced force active is a similar system
to the standard EMS Active with a different actuator porting
that provides for higher extension force with reduced
retraction force. The semi active system was modeled with
limitations representative of a MagnetoRheological fluid
based actuator. All active systems were set with an arbitrary
bi-directional force limit of 3000 Lbs in addition to any
other force limit imposed by the air spring design and burst
pressure capabilities. Due to the proprietary nature of the
modeled suspension systems and ITAR controls governing
their use and distribution, further technical discussion
regarding the specifics of actuator topology and detailed
comparisons with conventional passive suspension hardware
are not permissible given the potential audience of this
paper. The courses simulated were YPG #3, YPG #4, APG
#29, and Random Wave Spectrum courses “Washboard and
Pothole”, Trail, and Cross Country. Speeds ranged from 5 to
30 mph in 5 mph increments.
Rather than present hundreds of plots comparing various
performance parameters across the six vehicle
configurations negotiating individual courses at various
speeds, representative averaged plots will be shown as many
of the trends from course to course are fairly similar. Results
will be given in the following order: max pitch angle, driver
absorbed power, absorbed power at rear crew station, and
peak payload acceleration. These will be presented in and
along the X, Y, and Z directions where X corresponds to
longitudinally with the direction of travel, Y laterally across
the vehicle width, and Z vertically. Results will be presented
for both the straight-line and NATO lane change runs, peak
roll angle and yaw angle will only be presented for the
NATO lane change runs.
Figure 7: Averaged peak pitch angle for all straight
courses
Figure 8: Averaged driver absorbed power for all
straight courses

Proceedings of the 2011 Ground Vehicle Systems Engineering and Technology Symposium (GVSETS)
Active Vehicle Stabilization For Reconnaissance And Command Control On The Move, Beno, et al.
Page 6 of 11
Figure 9: Averaged passenger absorbed power for all
straight courses
Figure 10: Averaged peak longitudinal (X) payload
accelerations for all straight courses
Figure 11: Averaged peak lateral (Y) payload
accelerations for all straight courses
Figure 12: Averaged peak vertical (Z) payload
accelerations for all straight courses

Proceedings of the 2011 Ground Vehicle Systems Engineering and Technology Symposium (GVSETS)
Active Vehicle Stabilization For Reconnaissance And Command Control On The Move, Beno, et al.
Page 7 of 11
Figure 13: Averaged peak roll angle for all NATO LC
courses
Figure 14: Averaged peak pitch angle for all NATO LC
courses
Figure 15: Averaged peak yaw angle for all NATO LC
courses
Figure 16: Averaged driver absorbed power for all
NATO LC courses
Proceedings of the 2011 Ground Vehicle Systems Engineering and Technology Symposium (GVSETS)
Active Vehicle Stabilization For Reconnaissance And Command Control On The Move, Beno, et al.
Page 8 of 11
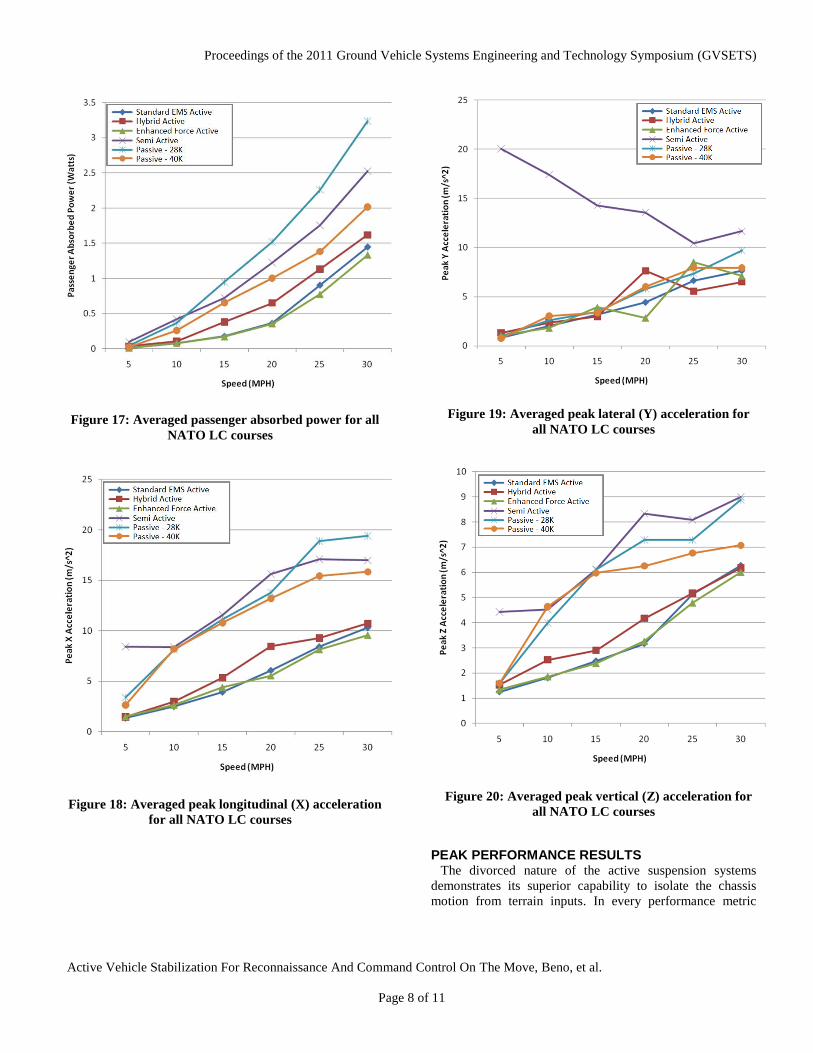
Figure 17: Averaged passenger absorbed power for all
NATO LC courses
Figure 18: Averaged peak longitudinal (X) acceleration
for all NATO LC courses
Figure 19: Averaged peak lateral (Y) acceleration for
all NATO LC courses
Figure 20: Averaged peak vertical (Z) acceleration for
all NATO LC courses
PEAK PERFORMANCE RESULTS The divorced nature of the active suspension systems
demonstrates its superior capability to isolate the chassis
motion from terrain inputs. In every performance metric
Proceedings of the 2011 Ground Vehicle Systems Engineering and Technology Symposium (GVSETS)
Active Vehicle Stabilization For Reconnaissance And Command Control On The Move, Beno, et al.
Page 9 of 11
other than peak yaw angle during the NATO lane change
and peak lateral (Y) acceleration, the active suspension
systems significantly outperformed the stock passive
vehicles. In the metrics where performance was not
improved, it was not diminished from stock capacity as
factors other than suspension performance likely dominate
its intensity. Steering harshness proved to be a significant
source for lateral acceleration and yaw angle variability. The
highest performing system was the enhanced force active; its
higher extension force authority provides for more control in
the most aggressive terrains. The standard EMS was the next
best performing and in most of the lower amplitude courses
was indistinguishable from the enhanced EMS. Hybrid
active was next in line performance wise, typically coming
within 10% to 20% of the standard and enhanced systems.
The semi active performance split the difference between
the passive and full active systems for pitch control and
driver absorbed power. In other metrics it was only slightly
better or approximately the same as passive. In the lateral
(Y) acceleration, it was significantly worse than passive.
This is due to the manner by which the controller was
operating to represent the semi-active actuator. There was no
attempt to design a controller to avoid the potential for harsh
high frequency switching near zero speed operation where
the commanded force is rapidly changing sign to account for
the inability of the actuator to generate positive powers in
the system. This can lead to a magnification of minor
harshness that would otherwise be insignificant. In this case
the minor corrections the steering controller was constantly
making were reflected in the recorded lateral acceleration
data and contributed to this apparent performance
degradation.
The heavy passive with soft air springs performed nearly
identical to the stock passive with stock springs, only in peak
Z acceleration and driver and passenger absorbed power was
there any improvement.
The results of the deviation from the normal test plan to
include a NATO lane change over the bump course were
less significant than initially hoped. Minor differences in
body roll angles were noted but were less significant than
expected. This is another area where further test
development would be worthwhile.
PSD AND TRANSFER FUNCTION ANALYSIS Discussion of the PSD results will be focused on YPG #3
while traveling at speeds of 10 mph. This will provide a
lower bound to improvements offered by EMS since EMS
improvements increase with speed. Higher speeds are
interesting for consideration, but concerns of overhead
obstacle avoidance may provide speed limitations aside from
sensor performance capabilities.
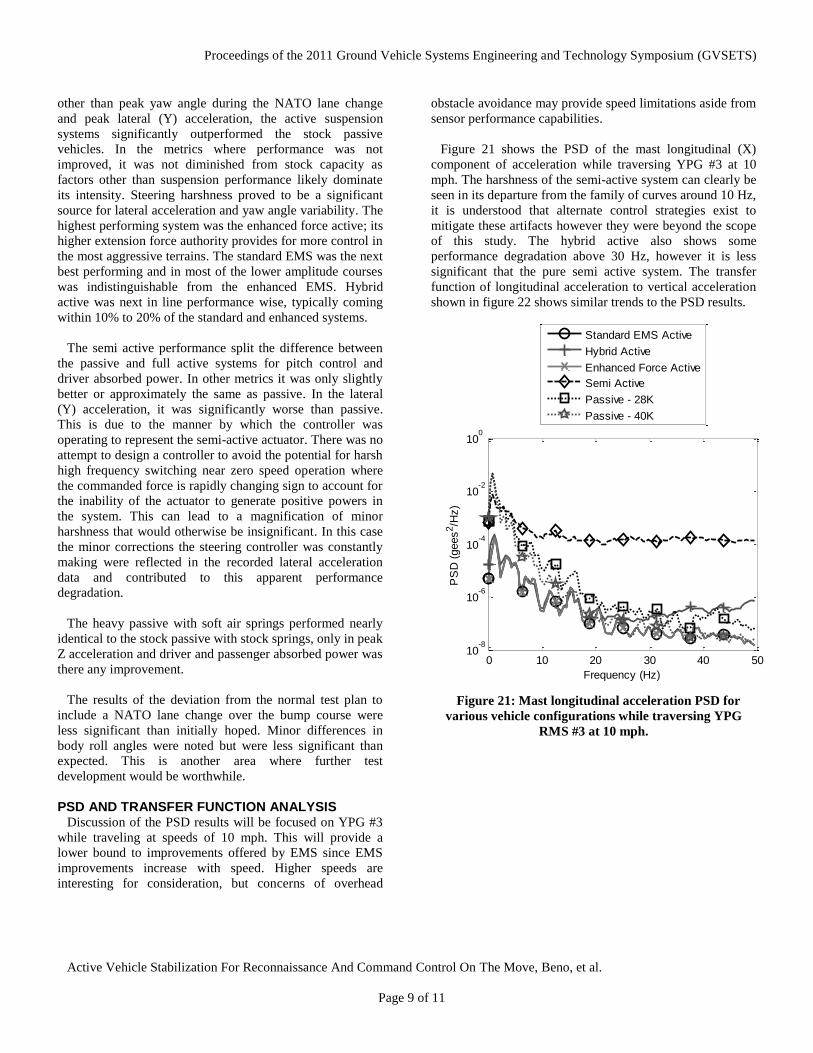
Figure 21 shows the PSD of the mast longitudinal (X)
component of acceleration while traversing YPG #3 at 10
mph. The harshness of the semi-active system can clearly be
seen in its departure from the family of curves around 10 Hz,
it is understood that alternate control strategies exist to
mitigate these artifacts however they were beyond the scope
of this study. The hybrid active also shows some
performance degradation above 30 Hz, however it is less
significant that the pure semi active system. The transfer
function of longitudinal acceleration to vertical acceleration
shown in figure 22 shows similar trends to the PSD results.
Figure 21: Mast longitudinal acceleration PSD for
various vehicle configurations while traversing YPG
RMS #3 at 10 mph.
0 10 20 30 40 5010
-8
10-6
10-4
10-2
100
Frequency (Hz)
PS
D (
gees
2/H
z)
Standard EMS Active
Hybrid Active
Enhanced Force Active
Semi Active
Passive - 28K
Passive - 40K
Proceedings of the 2011 Ground Vehicle Systems Engineering and Technology Symposium (GVSETS)
Active Vehicle Stabilization For Reconnaissance And Command Control On The Move, Beno, et al.
Page 10 of 11
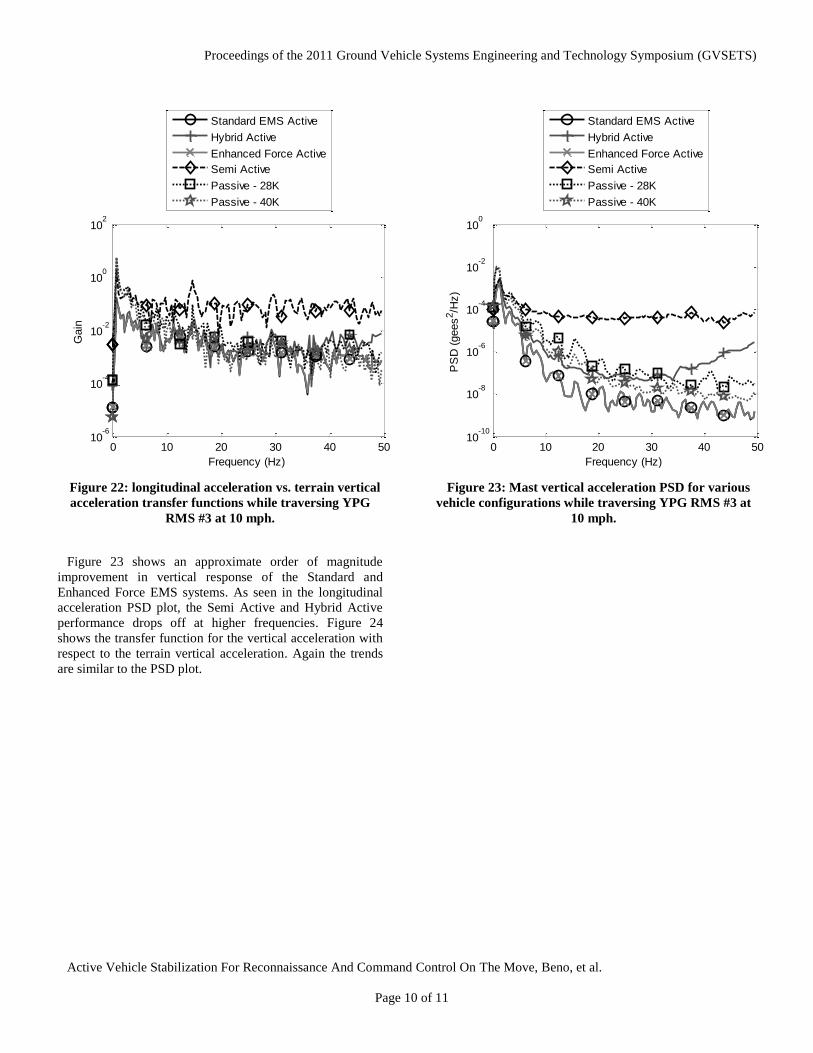
Figure 22: longitudinal acceleration vs. terrain vertical
acceleration transfer functions while traversing YPG
RMS #3 at 10 mph.
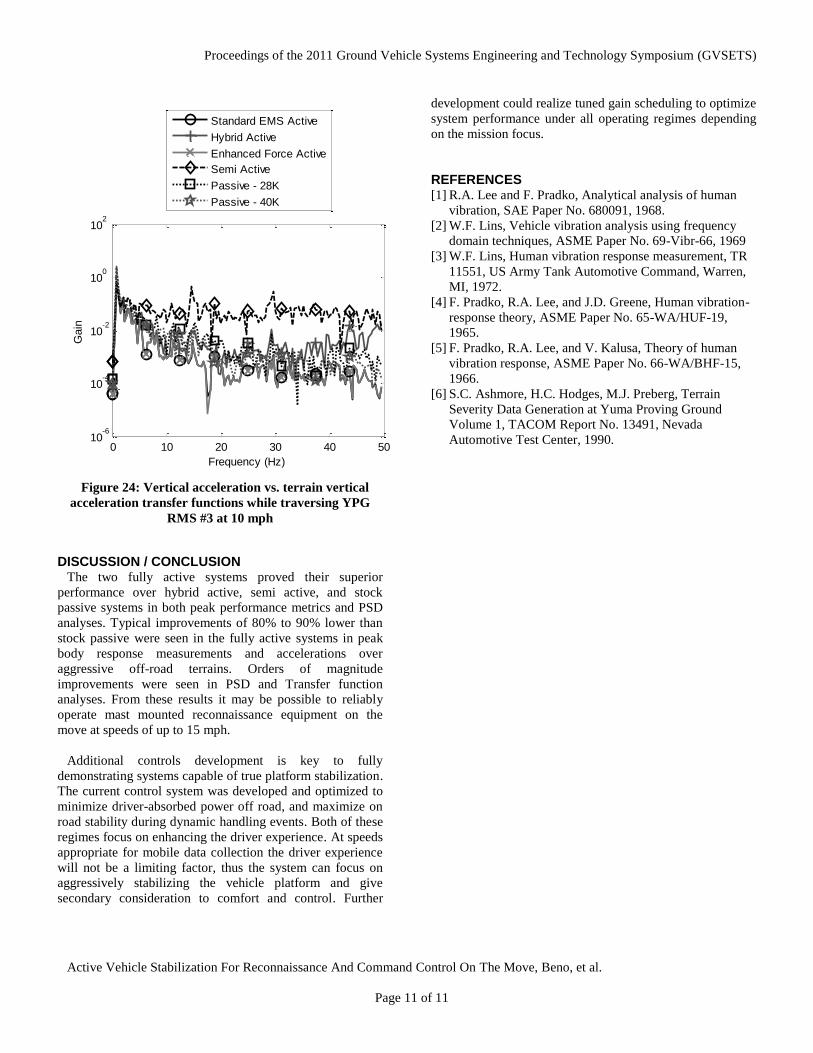
Figure 23 shows an approximate order of magnitude
improvement in vertical response of the Standard and
Enhanced Force EMS systems. As seen in the longitudinal
acceleration PSD plot, the Semi Active and Hybrid Active
performance drops off at higher frequencies. Figure 24
shows the transfer function for the vertical acceleration with
respect to the terrain vertical acceleration. Again the trends
are similar to the PSD plot.
Figure 23: Mast vertical acceleration PSD for various
vehicle configurations while traversing YPG RMS #3 at
10 mph.
0 10 20 30 40 5010
-6
10-4
10-2
100
102
Frequency (Hz)
Gain
Standard EMS Active
Hybrid Active
Enhanced Force Active
Semi Active
Passive - 28K
Passive - 40K
0 10 20 30 40 5010
-10
10-8
10-6
10-4
10-2
100
Frequency (Hz)P
SD
(gees
2/H
z)
Standard EMS Active
Hybrid Active
Enhanced Force Active
Semi Active
Passive - 28K
Passive - 40K
Proceedings of the 2011 Ground Vehicle Systems Engineering and Technology Symposium (GVSETS)
Active Vehicle Stabilization For Reconnaissance And Command Control On The Move, Beno, et al.
Page 11 of 11
Figure 24: Vertical acceleration vs. terrain vertical
acceleration transfer functions while traversing YPG
RMS #3 at 10 mph
DISCUSSION / CONCLUSION The two fully active systems proved their superior
performance over hybrid active, semi active, and stock
passive systems in both peak performance metrics and PSD
analyses. Typical improvements of 80% to 90% lower than
stock passive were seen in the fully active systems in peak
body response measurements and accelerations over
aggressive off-road terrains. Orders of magnitude
improvements were seen in PSD and Transfer function
analyses. From these results it may be possible to reliably
operate mast mounted reconnaissance equipment on the
move at speeds of up to 15 mph.
Additional controls development is key to fully
demonstrating systems capable of true platform stabilization.
The current control system was developed and optimized to
minimize driver-absorbed power off road, and maximize on
road stability during dynamic handling events. Both of these
regimes focus on enhancing the driver experience. At speeds
appropriate for mobile data collection the driver experience
will not be a limiting factor, thus the system can focus on
aggressively stabilizing the vehicle platform and give
secondary consideration to comfort and control. Further
development could realize tuned gain scheduling to optimize
system performance under all operating regimes depending
on the mission focus.
REFERENCES [1] R.A. Lee and F. Pradko, Analytical analysis of human
vibration, SAE Paper No. 680091, 1968.
[2] W.F. Lins, Vehicle vibration analysis using frequency
domain techniques, ASME Paper No. 69-Vibr-66, 1969
[3] W.F. Lins, Human vibration response measurement, TR
11551, US Army Tank Automotive Command, Warren,
MI, 1972.
[4] F. Pradko, R.A. Lee, and J.D. Greene, Human vibration-
response theory, ASME Paper No. 65-WA/HUF-19,
1965.
[5] F. Pradko, R.A. Lee, and V. Kalusa, Theory of human
vibration response, ASME Paper No. 66-WA/BHF-15,
1966.
[6] S.C. Ashmore, H.C. Hodges, M.J. Preberg, Terrain
Severity Data Generation at Yuma Proving Ground
Volume 1, TACOM Report No. 13491, Nevada
Automotive Test Center, 1990. 0 10 20 30 40 50
10-6
10-4
10-2
100
102
Frequency (Hz)
Gain
Standard EMS Active
Hybrid Active
Enhanced Force Active
Semi Active
Passive - 28K
Passive - 40K