activities - · pdf fileused diet cola/so˚ drinks in past 7 days 22% 186 ... i’d...
TRANSCRIPT

Guideposts consumers lead active lives.
Activities
Source: 2017 MRI Doublebase
Base: Adults, Women who in the Past 12 months...* % Comp. Index
Attended Adult Education Classes 6% 126
Attended Music Performances (Country/Rock/Classical/Opera/Other) 17% 139
Baking 26% 154
Board Games 12% 135
Book Clubs 4% 158
Collected Antiques 7% 215
Collected Figurines 4% 307
Crossword Puzzles 15% 221
Dined Out 39% 142
Entertained at Home 28% 139
Go to Live Theater 11% 156
Home Decorating and Furnishing 11% 137
Indoor Gardening and Plants 12% 182
Listen to Music 29% 152
Outdoor Gardening 31% 173
PC Computer Games (play online) 14% 209
Photography 9% 137
Picnic 8% 146
Play Cards 15% 162
Play Musical Instrument 6% 164
Read Books 38% 176
Sudoku Puzzles 10% 195
Walked for Exercise 24% 155
Went Bird Watching 5% 179
Word Games 17% 224
11/17
* In the past 12 months unless otherwise noted.

Guideposts audience enjoys a wide array of beverages.
Beverages
11/17
Source: 2017 MRI Doublebase
Base: Adults, Women who... % Comp. Index
Used 1+ Quarts Fresh Milk in Past 7 Days 62% 158
Used Non Frozen Orange Juice in an Average Day 34% 165
Used Tomato & Vegetable Juices in an Average Day 16% 217
Used Regular Tea in an Average Day 39% 176
Used Ready to Drink Iced Tea in Past 7 Days 20% 151
Used Ground Co� ee in an Average Day 42% 164
Used Powdered Fruit & So� Drinks in Past 7 Days 18% 175
Used Other Fruit Juices & Drinks in an Average Day 33% 153
Used So� Drinks, Not Diet, in Past 7 Days 23% 146
Used Diet Cola/So� Drinks in Past 7 Days 22% 186
Used Other Regular Carbonated So� Drinks in Past 7 Days 23% 162
Used Bottled Water & Seltzer in Past 7 Days 45% 140
Used Drink Additives & Hot Cocoa in Past 7 Days 22% 195
11/17
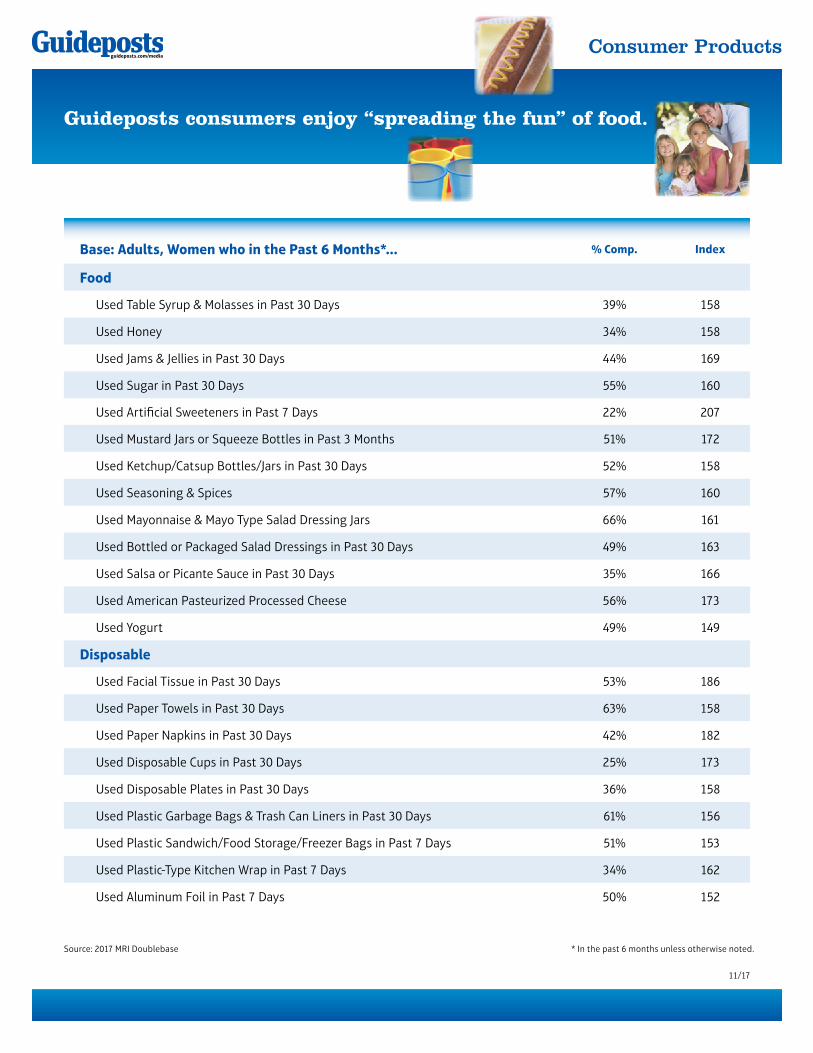
Guideposts consumers enjoy “spreading the fun” of food.
Consumer Products
Base: Adults, Women who in the Past 6 Months*... % Comp. Index
Food
Used Table Syrup & Molasses in Past 30 Days 39% 158
Used Honey 34% 158
Used Jams & Jellies in Past 30 Days 44% 169
Used Sugar in Past 30 Days 55% 160
Used Artifi cial Sweeteners in Past 7 Days 22% 207
Used Mustard Jars or Squeeze Bottles in Past 3 Months 51% 172
Used Ketchup/Catsup Bottles/Jars in Past 30 Days 52% 158
Used Seasoning & Spices 57% 160
Used Mayonnaise & Mayo Type Salad Dressing Jars 66% 161
Used Bottled or Packaged Salad Dressings in Past 30 Days 49% 163
Used Salsa or Picante Sauce in Past 30 Days 35% 166
Used American Pasteurized Processed Cheese 56% 173
Used Yogurt 49% 149
Disposable
Used Facial Tissue in Past 30 Days 53% 186
Used Paper Towels in Past 30 Days 63% 158
Used Paper Napkins in Past 30 Days 42% 182
Used Disposable Cups in Past 30 Days 25% 173
Used Disposable Plates in Past 30 Days 36% 158
Used Plastic Garbage Bags & Trash Can Liners in Past 30 Days 61% 156
Used Plastic Sandwich/Food Storage/Freezer Bags in Past 7 Days 51% 153
Used Plastic-Type Kitchen Wrap in Past 7 Days 34% 162
Used Aluminum Foil in Past 7 Days 50% 152
* In the past 6 months unless otherwise noted.Source: 2017 MRI Doublebase

11/17
Guideposts consumers enjoy cooking and baking.
Food
* In the past 12 months unless otherwise noted.
Base: Adults, Women who in the Past 12 months*... % Comp. Index
Baked 27% 154
Heavy Cooking 29% 160
Looked for Recipes Online Past 30 Days 39% 139
Entertained Friends at Home 28% 139
Shopped at Food Stores in Past 6 Months 74% 153
Shopped Warehouse/Club Stores in Past 6 Months 34% 148
Made 2+ Grocery Shopping Trips in Average Week 36% 162
Prepared Food from Scratch in Past 30 Days 43% 171
Food Attitudes/Activities (Agree)
I Try to Eat Healthy and Pay Attention To My Nutrition 73% 166
During a Given Week, I Cook Meals Frequently 65% 160
Dinners in My Home are Usually Planned Ahead of Time 53% 154
Frozen Dinners are a Convenient Alternative For A Meal 38% 165
I Indulge My Cravings For Sweets 52% 153
I Try to Eat a Healthy Breakfast Every Day 60% 169
When I Find a Food I Like, I Typically Recommend It to People I Know 57% 146
I Enjoy Trying Di� erent Types of Food 64% 159
Source: 2017 MRI Doublebase
11/17
Source: 2017 MRI Doublebase
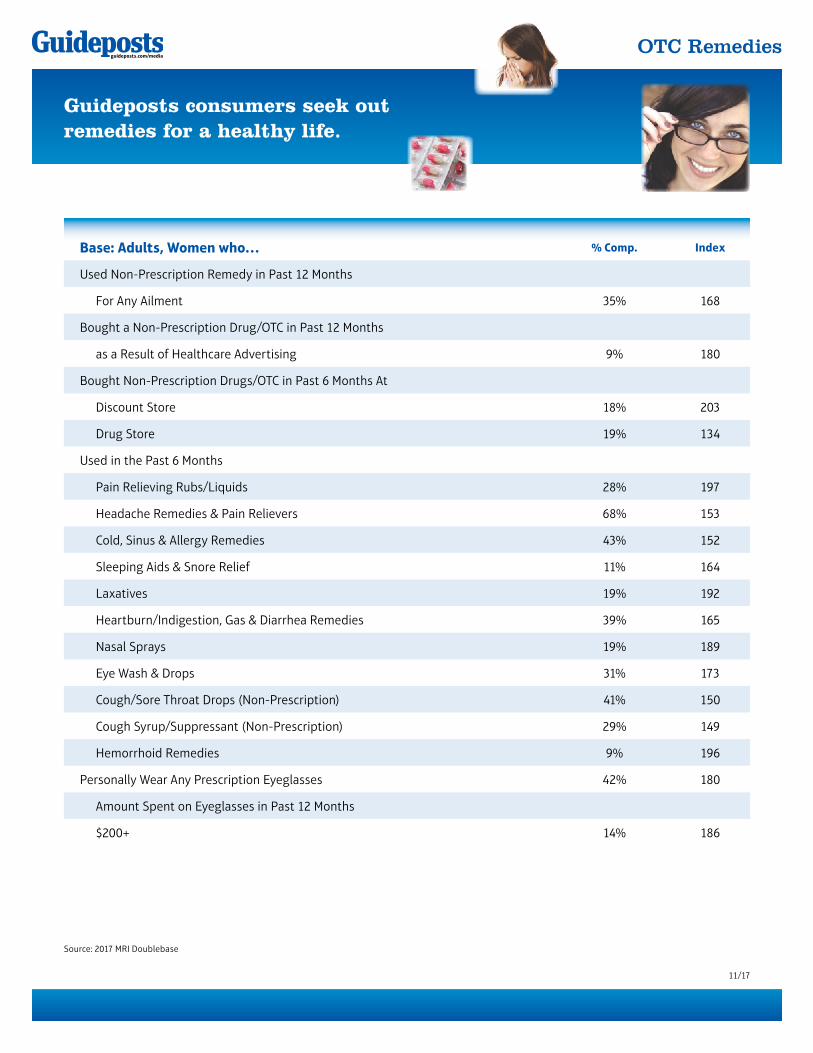
Guideposts consumers seek out remedies for a healthy life.
OTC Remedies
Base: Adults, Women who… % Comp. Index
Used Non-Prescription Remedy in Past 12 Months
For Any Ailment 35% 168
Bought a Non-Prescription Drug/OTC in Past 12 Months
as a Result of Healthcare Advertising 9% 180
Bought Non-Prescription Drugs/OTC in Past 6 Months At
Discount Store 18% 203
Drug Store 19% 134
Used in the Past 6 Months
Pain Relieving Rubs/Liquids 28% 197
Headache Remedies & Pain Relievers 68% 153
Cold, Sinus & Allergy Remedies 43% 152
Sleeping Aids & Snore Relief 11% 164
Laxatives 19% 192
Heartburn/Indigestion, Gas & Diarrhea Remedies 39% 165
Nasal Sprays 19% 189
Eye Wash & Drops 31% 173
Cough/Sore Throat Drops (Non-Prescription) 41% 150
Cough Syrup/Suppressant (Non-Prescription) 29% 149
Hemorrhoid Remedies 9% 196
Personally Wear Any Prescription Eyeglasses 42% 180
Amount Spent on Eyeglasses in Past 12 Months
$200+ 14% 186

Pets are family members in Guideposts homes.
11/17
Source: 2017 MRI Doublebase
Pets & Pet Foods
Base: Adults, Women who… % Comp. Index
Total Adults
Have a Cat or Dog 45% 150
Used Flea & Tick Care Products for Dogs & Cats in Past Year 29% 138
Any Trips to Veterinarian in Past 12 Months 31% 136
Bought Flea Control Products through Veterinarian in Past 12 Months 10% 136
Dogs
Total Number of Dogs: 3,154,000
Have any Dogs 34% 144
Have 2+ Dogs 16% 153
Used in Past 6 Months
Dog Food—Treats/Canned/Packaged Dry 36% 145
Canned/Wet Dog Food 14% 147
Packaged Dry Dog Food 33% 144
Dog Biscuits or Treats 26% 136
Cats
Total Number of Cats: 1,880,000
Have any Cats 21% 160
Have 2+ Cats 10% 158
Used in Past 6 Months
Cat Food—Treats/Canned/Packaged Dry 21% 160
Cat Treats 12% 158
Canned/Wet Cat Food 12% 161
Packaged Dry Cat Food 21% 163
Cat Litter 19% 162

11/17
Source: 2017 MRI Doublebase
Guideposts consumers seek medicines to improve their lives.
Prescription Drugs & Healthcare
(CONTINUES, next page)
Base: Adults, Women who... % Comp. Index
Have been a Primary Caregiver/Caretaker in the Last 12 Months 12% 245
Have/Had Any Ailments in the Last 12 Months
Allergy/Hay Fever 16% 174
Anxiety/Panic 11% 175
Arthritis/Rheumatoid 9% 281
Arthritis/Osteoarthritis 16% 311
Asthma 8% 234
Backache 24% 200
Chronic/Severe Pain 6% 262
Constipation 9% 197
Depression 13% 228
Diabetes (insulin dependent) 5% 341
Diabetes (non-insulin dependent) 7% 249
Dry Eyes 15% 255
Hair Loss 6% 267
Heart Attack/Heart Disease 4% 327
Heartburn/Acid Refl ux 16% 189
Hearing Loss 6% 388
High Cholesterol 18% 284
Hypertension/High Blood Pressure 23% 271
Insomnia 10% 217
Irritable Bowel Syndrome 5% 239
Obesity/Overweight 14% 256
Osteoporosis 7% 374
Overactive Bladder 6% 422

11/17
Source: 2017 MRI Doublebase
Base: Adults, Women who... % Comp. Index
Have/Had Any Ailments in the Last 12 Months (continued)
Sinus Congestion/Headache 15% 182
Urinary Tract Infection 5% 135
Wrinkles 10% 218
Obtained Info About an Ailment or Prescription Through
Magazine Advertisement 4% 243
Doctor/Health Care Professional 43% 191
Pamphlets or Brochures 5% 275
Pharmacist 9% 160
Average Out of Pocket Amount Spent Per Month on Prescription Medicine: $100+ 8% 232
Number of Prescriptions Filled for Self in Past 30 Days: 5+ 17% 306
Where Prescription was Filled in the Last 12 Months
Drug Store/Pharmacy 39% 177
Supermarket 7% 165
Mail Order 11% 259
Any Doctor’s Visits in the Last 12 Months 69% 160
Health Attitudes (Agree)
I Go to the Doctor Regularly for Check-ups 69% 167
In General, I Feel I Eat Right 67% 160
I Am Always Looking for New Ways to Live a Healthier Life 67% 162
I’m O� en First to Try the Most Advanced Medicines 21% 157
I Prefer Popular Brand-Name Drugs, Even if They Cost More 27% 162
Medication has Improved the Quality of My Life 58% 176
Prescription Drugs & Healthcare

Source: 2017 MRI Doublebase
Guideposts consumers enjoy a wide variety of snacks.
Snack Foods
Base: Adults, Women who in the Past 30 Days*... % Comp. Index
Used Nuts 55% 173
Used Cookies (Ready to Eat) 51% 158
Used Doughnuts (Ready to Eat) 30% 152
Used Gelatin & Gelatin Desserts 24% 184
Used Snack Cakes 26% 163
Used Crackers 63% 164
Used Corn, Tortilla Chips, Other Chips & Cheese Snacks 46% 142
Used Popping Corn & Popcorn Snacks 40% 149
Used Breakfast, Cereal and Granola bars (1+ bars) 37% 151
Used Dried Fruit 32% 182
Used Ice Cream, Ice Milk, Sherbet 58% 162
Used Baking Mixes 32% 198
Used Candy 60% 155
11/17

11/17
Source: 2017 MRI Doublebase
Guideposts consumers are going places.
Travel
Base: Adults, Women who... % Comp. Index
Took Domestic Trip in Past Year 41% 149
Spent 7+ Nights Away on Domestic Trip in Past Year 9% 149
Spent $1,000+ on Domestic Vacations in Past Year 14% 136
Any Domestic Vacation/Personal Trips in Past Year 36% 147
Means of Domestic Travel – Personal Vehicle or Motor Home/RV 21% 160
Go to Beach on Domestic Vacation 7% 148
Go Shopping on Domestic Vacation 9% 134
Go Sightseeing on Domestic Vacation 14% 142
500+ Miles Travelled from Home (Round Trip) 23% 136
1000+ Miles Travelled from Home (Round Trip) 14% 160
Took a Cruise in Past 3 Years 6% 137
Took 3+ Domestic Round Trips in Past Year 15% 149
Travel Attitudes (Agree)
I’d Rather Take a Few Weekend Vacations Than One Long Vacation 45% 168
Group Tours Are Fun and A Good Way to Meet People 50% 181
When I Learn About A Great Vacation, I Typically Recommend It to People I Know 53% 142
Packaged Deals Are Great, Because I Don’t Have To Plan Out The Details Too Much 50% 146
I Prefer Guided Tours to Traveling Independently 37% 180
I’d rather travel in the U.S. than to a Foreign Location 51% 181

Vitamins & Minerals & Diet Control
11/17
Source: 2017 MRI Doublebase
Guideposts consumers have healthy, active lives.
Base: Adults, Women who... % Comp. Index
Used Vitamin & Dietary Supplements in Past 7 Days 49% 181
Engaged in Regular Physical Fitness Program 31% 141
Currently Controlling Diet 38% 175
Reason for Diet Control
Maintain Weight 13% 198
Weight Loss 14% 166
Blood Sugar Level 15% 329
Cholesterol Level 13% 304
Salt Restriction 5% 333
When Dieting, Buy Foods Specifi cally Labeled As
Low Cholesterol 7% 263
Fat Free 11% 199
High Fiber 9% 208
High Protein 8% 195
Low Sodium 13% 239
Low Carb 9% 223
Natural or Organic 11% 149
Diet Control Method Used
Exercise Program 6% 141
Vitamin Supplements Improve One’s Health 63% 155
Buy Food Labeled as Sugar-Free 12% 241
Buy Food Labeled as Low-Calorie 10% 195
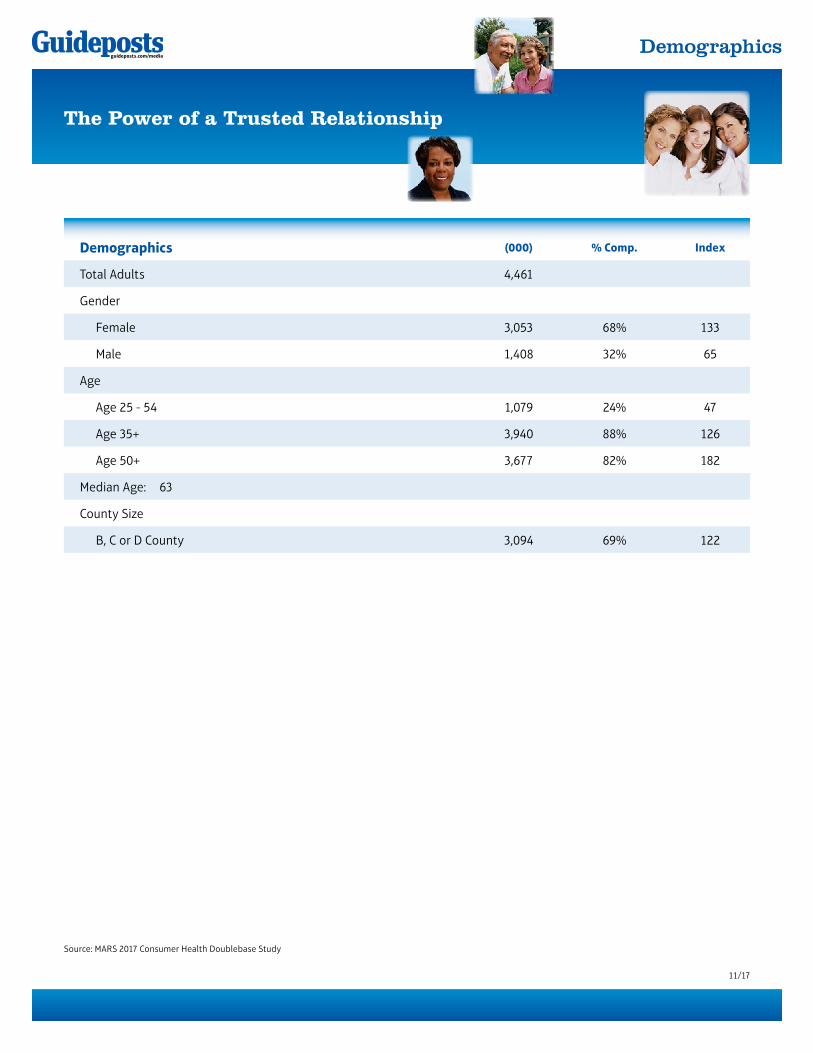
The Power of a Trusted Relationship
Demographics
Demographics (000) % Comp. Index
Total Adults 4,461
Gender
Female 3,053 68% 133
Male 1,408 32% 65
Age
Age 25 - 54 1,079 24% 47
Age 35+ 3,940 88% 126
Age 50+ 3,677 82% 182
Median Age: 63
County Size
B, C or D County 3,094 69% 122
Source: MARS 2017 Consumer Health Doublebase Study
11/17

The Power of a Trusted Relationship
Demographic Profi le: Total Adults
11/17
Base: Total Adults % Comp. Index
Total Audience: 5,058,000
Gender
Female 80% 154
Male 20% 42
Age
Age 25 - 54 34% 66
Age 35+ 95% 136
Age 50+ 77% 171
Median Age: 62
Median Household Income: $56,456
County Size
B, C or D County 72% 124
Source: 2017 MRI Doublebase
11/17
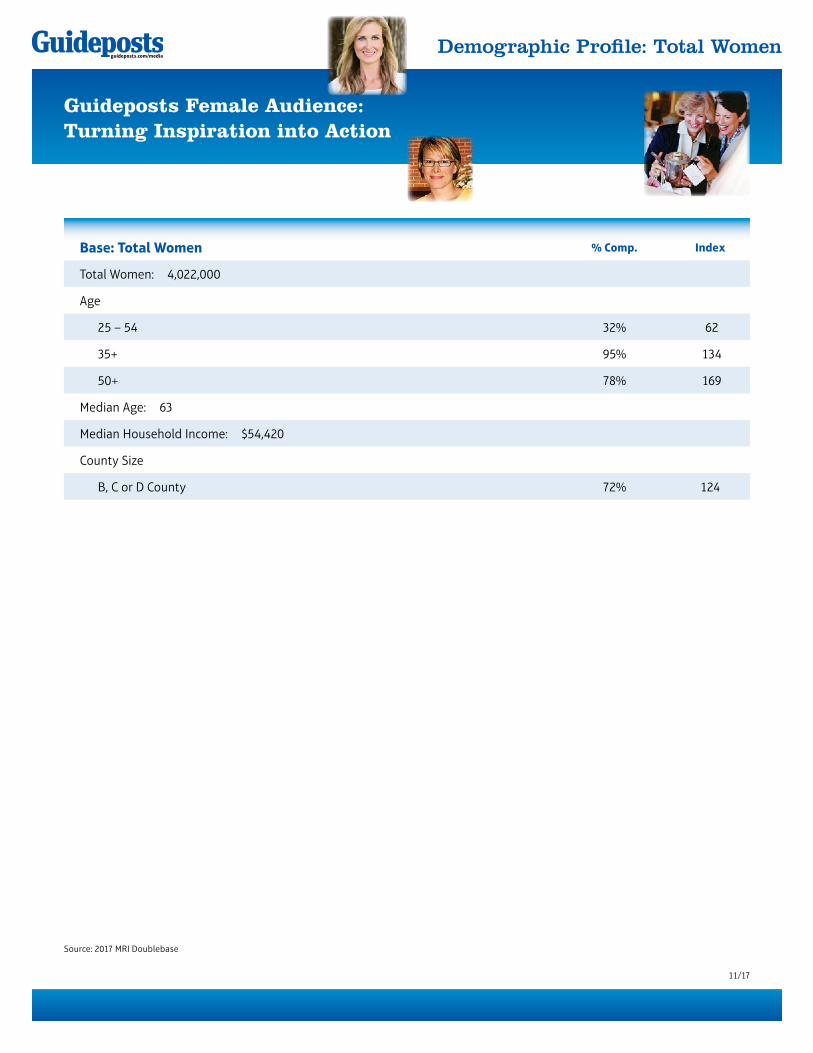
Guideposts Female Audience: Turning Inspiration into Action
Demographic Profi le: Total Women
Base: Total Women % Comp. Index
Total Women: 4,022,000
Age
25 – 54 32% 62
35+ 95% 134
50+ 78% 169
Median Age: 63
Median Household Income: $54,420
County Size
B, C or D County 72% 124
Source: 2017 MRI Doublebase