activities in the homestake mine
TRANSCRIPT
Activities in the Homestake mine
07-20-2008/09-19-2008
LIGO-G080475-00-R
Angelo Sajeva
Jan Harms
Riccardo De Salvo
Vuk Mandic

The three minesketeers!
and D’Artagnan
Jan Riccardo Angelo Vuk
Who?
• Jan Harms, studying for his second phd, background in teorethic physics in gravitational wave
• Riccardo de Salvo, Caltech professor, eclettic knowledge, experienced in GW, the senior supervisor of the project
• Vuk Mandic, professor in Minneapolis in University of Minnesota, responsible of the project
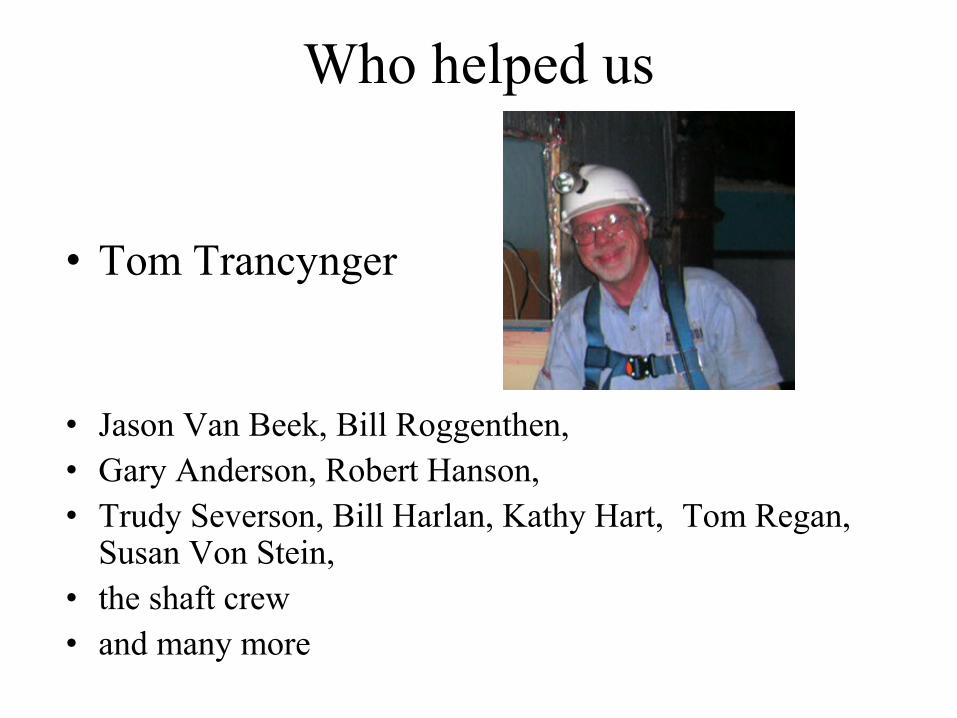
Who helped us
• Tom Trancynger
• Jason Van Beek, Bill Roggenthen, • Gary Anderson, Robert Hanson, • Trudy Severson, Bill Harlan, Kathy Hart, Tom Regan,
Susan Von Stein, • the shaft crew • and many more

What’s Homestake
mine?
• A little bit of history of this mine, former gold mine, for 125 years, then a site for science
• How big it is• How important it is for
local society (symbol)

The big funnel
• The rain collects in this big open cut and flows in the mine
• During the inactivity years the mine filled with water
• Presently the water level is at the4535 feet level.
• Pumps are working to drain water out.
• Draining rate limited by the water processing times

Mine
• Gold mine since 1834, it’s been closed officially in 2001
• In late 60s it hosted neutrino experiments, that showed less solar electronic neutrinos then expected.
Why did we come to Homestake?
• We want to study the seismicity of this mine in order to verify if it can be a good site for an Underground Gravitational Waves Detection Observatory.

Newtonian Noise
• We study the seismicity in order to study the Newtonian Noise (NN)
• NN is a fluctuation of the gravitational field acting the mirror test masses
caused by masses in seismic movement.
• Surface movements and density fluctuations are the two main causes of NN on the GW Interferometer TM
Newtonian Noise
• You cannot stop newtonian noise, because the variation of masses directly couples with your mirror
• Underground the surface effect is strongly attenuated, we have no weather effect and therefore we expect a smaller NN
• If it’s monitorable we can subtract it from our signal
How do we do that?We want to establish:
• a matrix of coherent sensor stations to measure seismic wave propagation
• From a vertical array we expect to measure the attenuation as function of z
• From a horizontal arrays we will study wave propagation
What we’ve done:
• We already set up three seismic stations: 300ft, 800ft, 2000ft
• We got some preliminary data
Seismic• A matrix is necessary because with one instrument you cannot
distinguish between S wave and P wave and you cannot know the direction of propagation of the wave
• Further working with nanometric “guys” we learned that placing more than 1 seismometer in the same location allows you to use correlation to determine the noise
• Attenuation because surface wave have usually larger amplitude then body waves
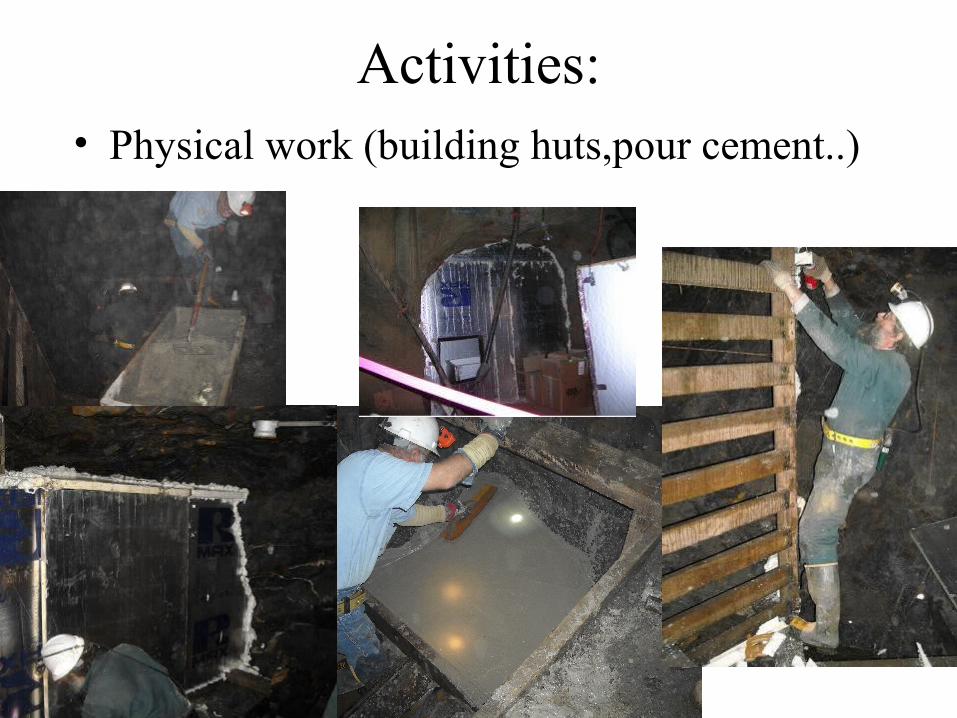
Activities:• Physical work (building huts,pour cement..)
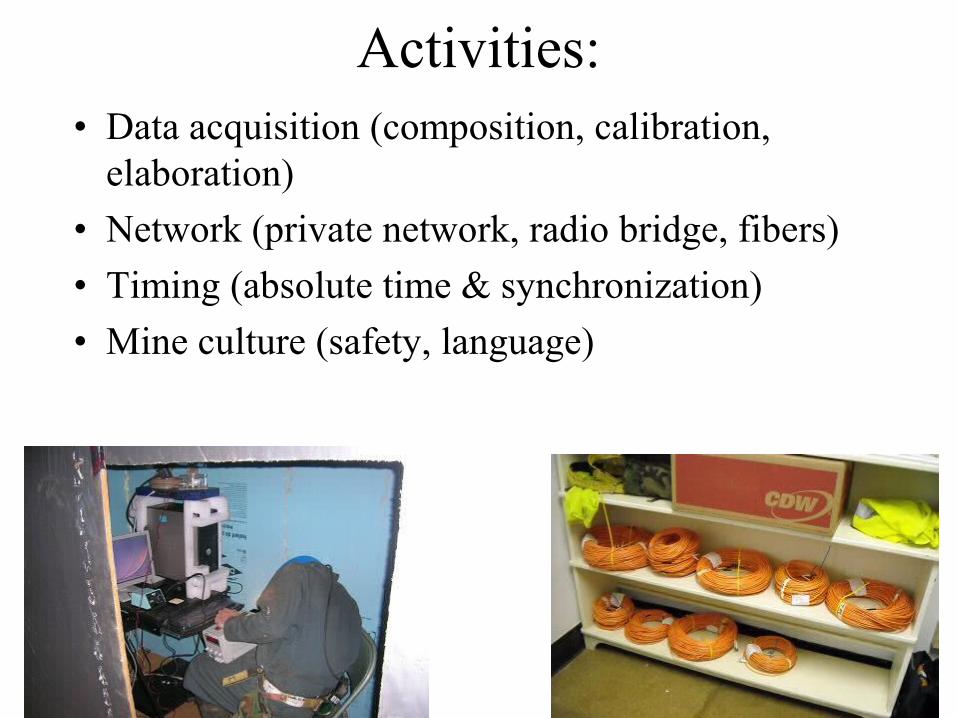
Activities:• Data acquisition (composition, calibration,
elaboration)
• Network (private network, radio bridge, fibers)
• Timing (absolute time & synchronization)
• Mine culture (safety, language)

The rules in the mine:
• An experienced miner always escort us underground
• Safety training necessary to use the shaft
• Appropriate personal protection equipment mandatory: SCSR, helmet, boots, light
• Access to the mine only in miners schedule, usually at 7:30, 12:00, 16:30, 21:00.
• Brass in/out system
• Tag in/out system
Safety
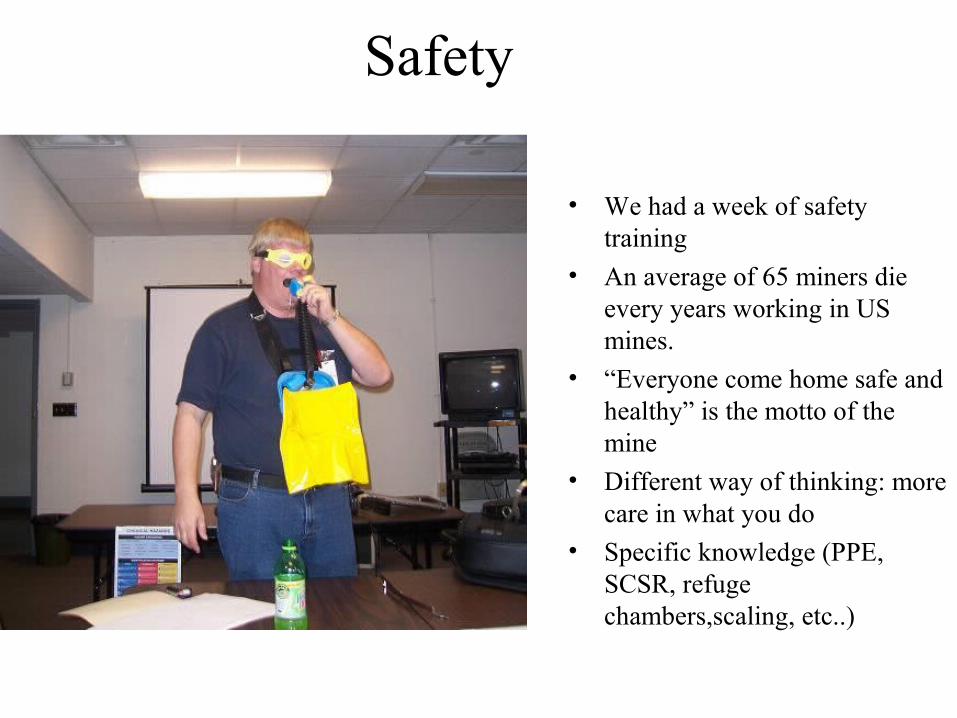
• We had a week of safety training
• An average of 65 miners die every years working in US mines.
• “Everyone come home safe and healthy” is the motto of the mine
• Different way of thinking: more care in what you do
• Specific knowledge (PPE, SCSR, refuge chambers,scaling, etc..)
Some dangers in the mine:
• Rock falling vs scaling
• Fire burning vs fire extinguisher & MSDS
• Poison gases vs SCSR
• Human falling vs falling protections
• Wounds & hits vs PPE
• Alternate evacuation routes vs Mine Rescue Chambers

Scaling
• The rocks gets weaker• because of oxydation
(mainly pyrite turning into limonite [rust] between layers)
• They are loosened by the cycles of the moon that causes low frequency (quasi static) stresses.Scaling of overhanging loose stones
is necessary before passing by

Something more about seismic waves:• Some about attenuation with depth (why does it attenuate?)
– Raleigh and Love waves are only surface waves, and attenuate exponentially with distance from surface
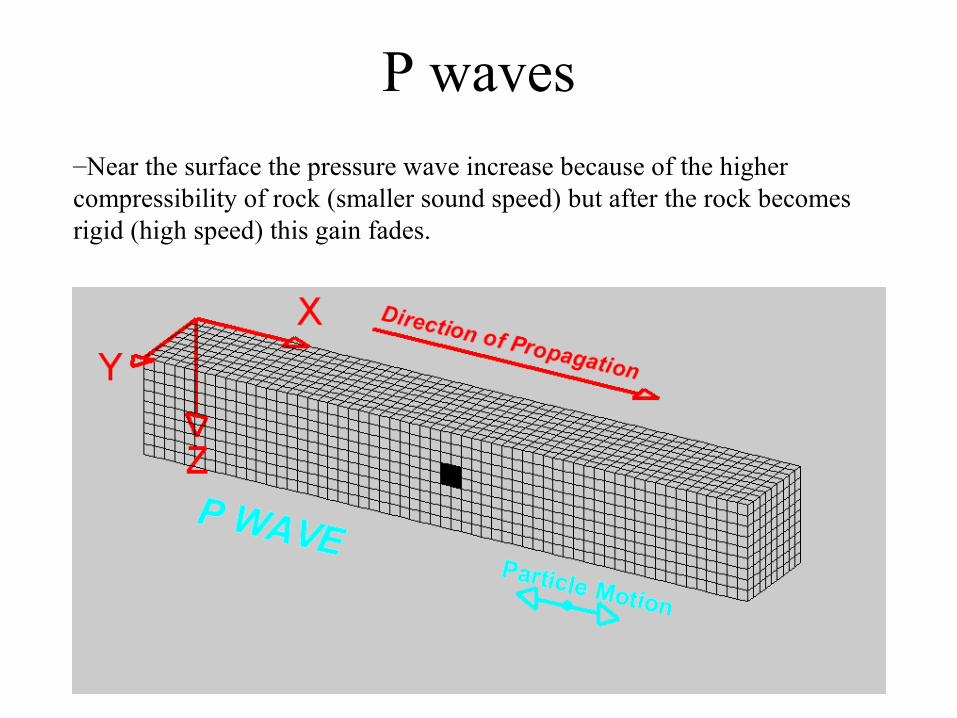
P waves
–Near the surface the pressure wave increase because of the higher compressibility of rock (smaller sound speed) but after the rock becomes rigid (high speed) this gain fades.
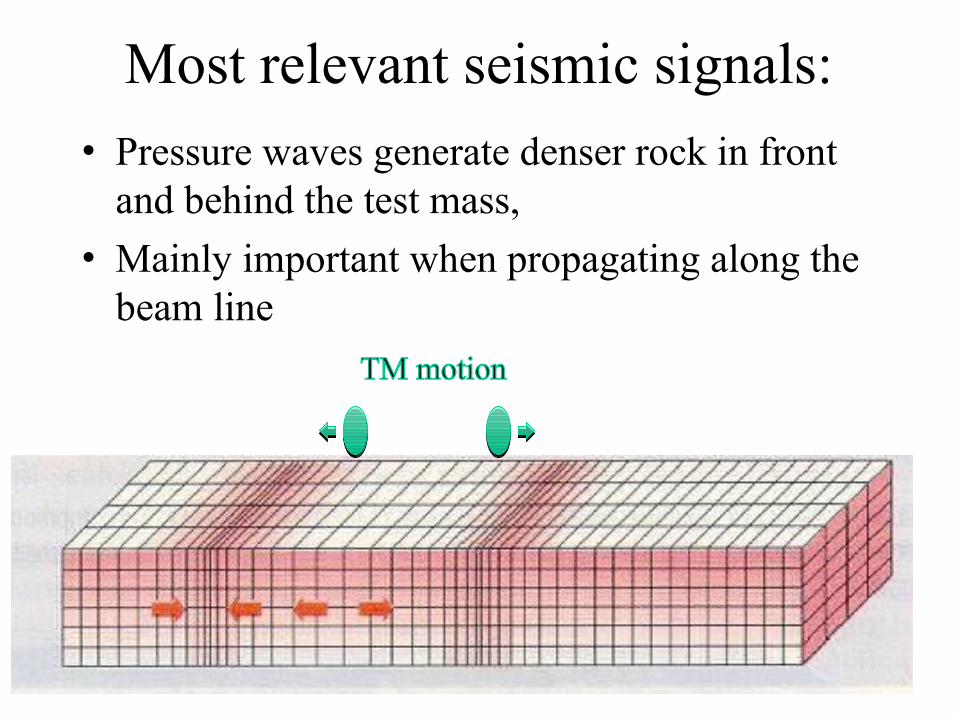
Most relevant seismic signals:• Pressure waves generate denser rock in front
and behind the test mass,
• Mainly important when propagating along the beam line
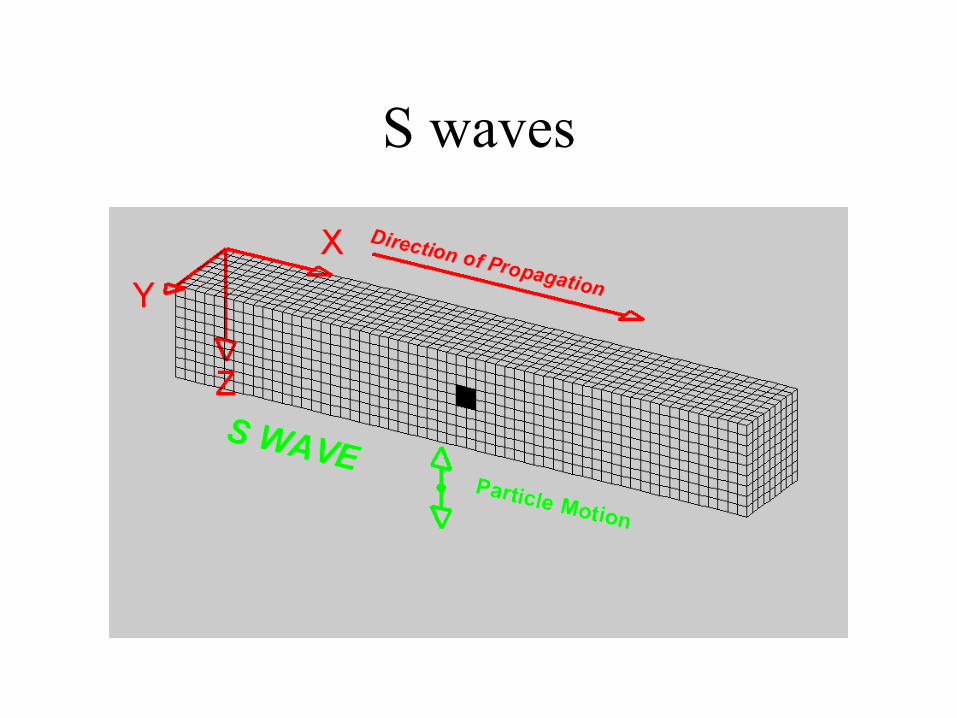
S waves

Most relevant seismic signals:
• Shear waves generate effects by moving the surfaces of the experimental cavern
• Mainly relevant when propagating across the beam line

• P waves comes from below
• Amplitude increases – with reflection,
– for lower rock density – and for lower
propagation speed

Something more about seismic waves:
• Pressure and shear waves eventually dominate at depth
• Optimal depth
Approximately when vsound saturates, the cross over point is close
the surface waves are small, body waves start dominating
All fractures /microfractures in the rock are closed
We don’t need to go any deeper (cost)
Seismic:attenuation with depth
• Less fractures and porosity: rho goes up, v gets bigger
• Z=rho times v
• Waves refracted going up usually gets stronger (T>1)

Subtraction
• Only residual solution is measure seismic activity and subtracting its NN effects
• Models are insufficient and site dependent
• Best to measure rock density and position than its acceleration
• Need local measurements
Best depth
• How much is it? We need to measure!
• Are we sure that’s the best way to proceed? No!
• When we have a certain velocity we know we are at right depth! There is a omogeneus behavior in earth with about spherical simmetry
Seismic sources
• We are interested in seismic activity in quiet periods
• Sum of all noises in the world with arbitrary delays (silent earthquake, tide creak, etc)
Wavelenght
• vsound =5 km f=1 Hz λ=5km
• waves can see only defects comparable or greater then λ /2*π
• Microcracks invisible• Short wavelenghts mass density fluctuation
invisible
wavelenght
• Why 1 Hz? It’s an example, we are interested mainly in the hole in sensitivity of actual GW sensors approximately 0.1-10 HZ.
• Intuitively: small fractures produce no effect• Resolution of mass density?can you see small
density fluctuation with a wave that big

What else can we measure with the seismometers?
• Broadband Seismicity
• Settling activity of the mine as it is pumped dry
• Monitor microseismic peak variations (one of the deep locations farthest from all oceans)
• Etc.

STS-2

• Measure velocity• wide bandwith• remotely controlled• 3 identical obliquely-oriented mechanical sensors• electromagnetic feedback giving high dynamic range in the mid-freq range of 0.1-10 Hz
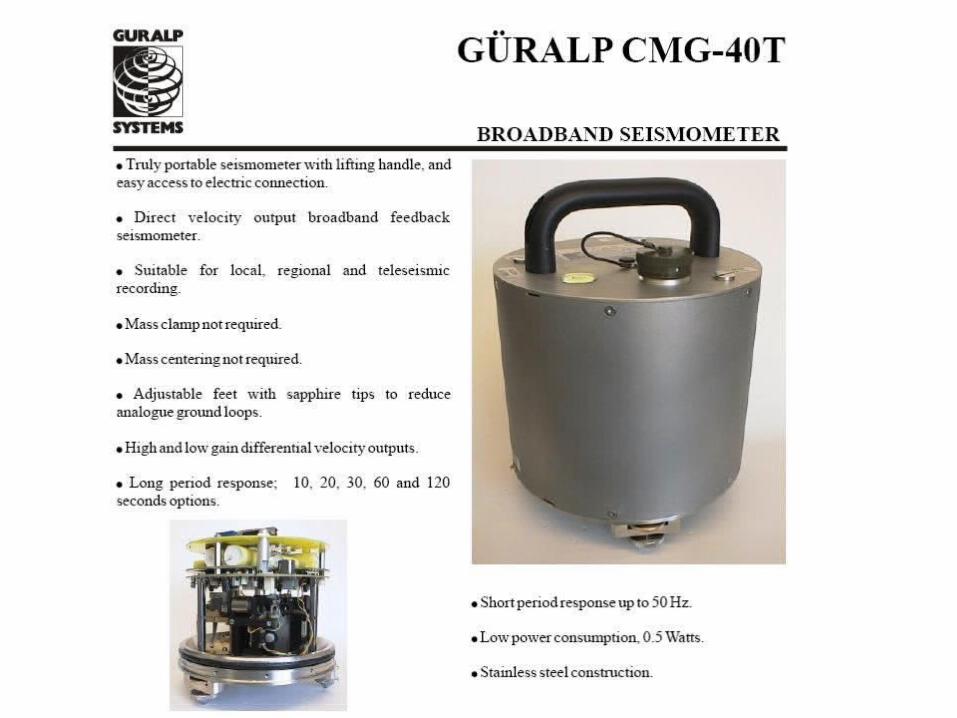
Guralp CMG 40-T

• Broadband (the standard frequency band is 0.033 Hz (30 sec) to 50 Hz)
• Velocity output

Trillium 240
• response flat to velocity from 240 seconds to 35 Hz
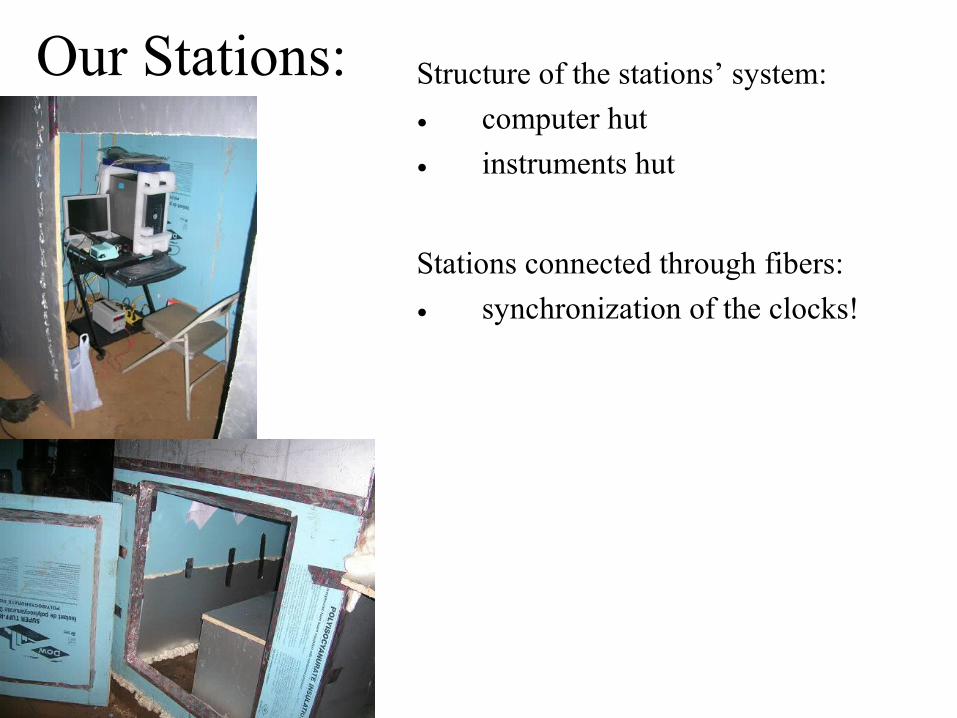
Our Stations: Structure of the stations’ system:
• computer hut
• instruments hut
Stations connected through fibers:
• synchronization of the clocks!
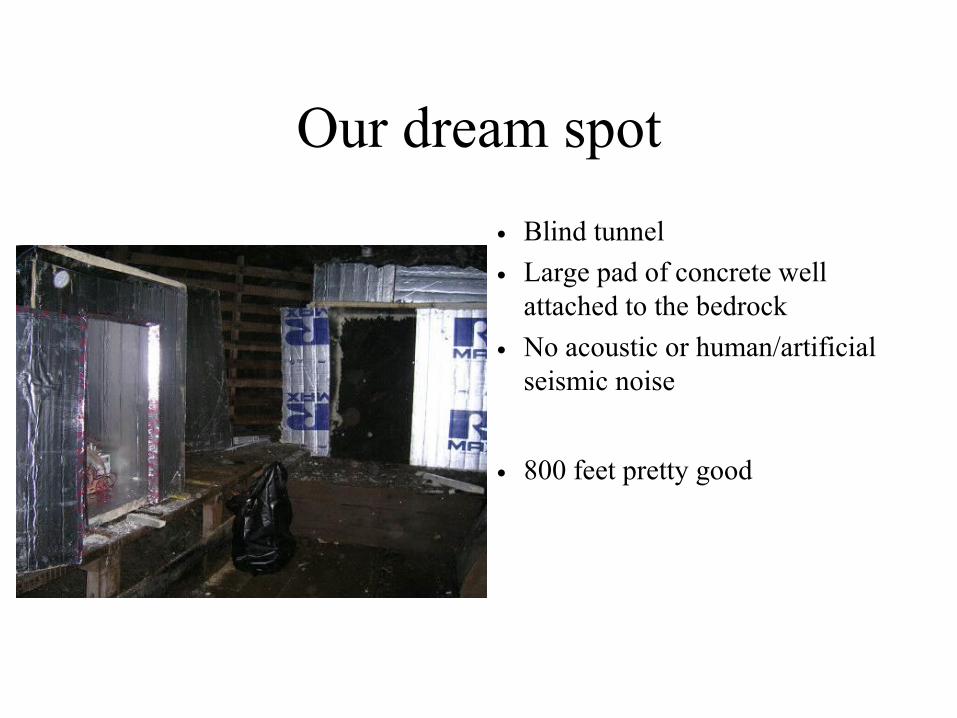
Our dream spot
• Blind tunnel
• Large pad of concrete well attached to the bedrock
• No acoustic or human/artificial seismic noise
• 800 feet pretty good

How did we design a seismic station and why?
• Mechanical Connection to Ground
• Quiet location
• Acoustic insulation
• Power
• Data acquisition
• Connectivity
• Environmental Monitoring
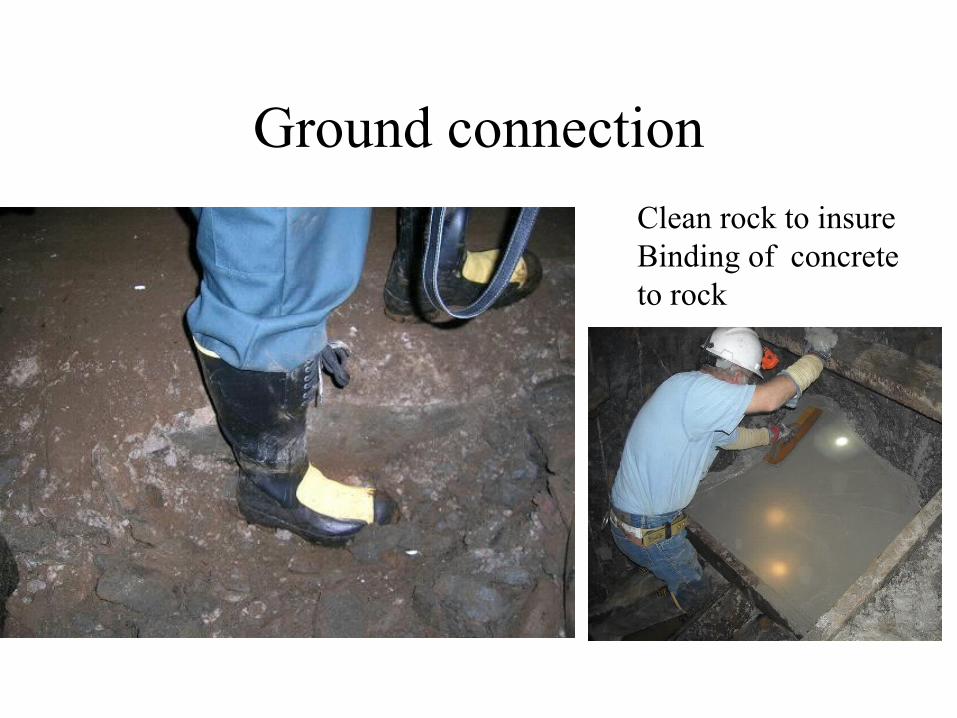
Ground connection
Clean rock to insureBinding of concrete to rock
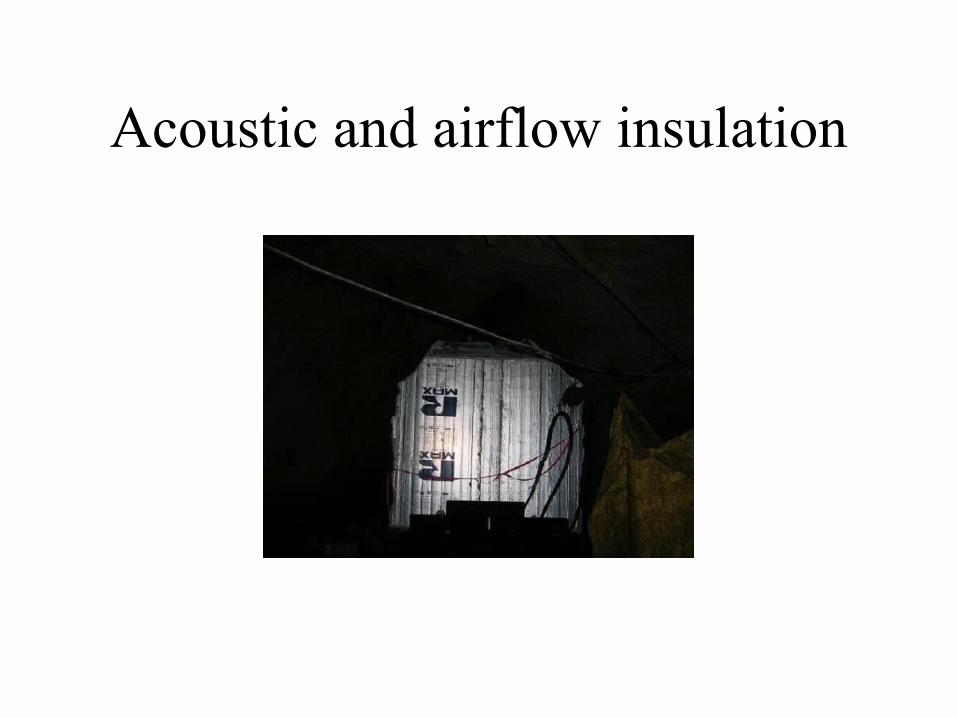
Acoustic and airflow insulation
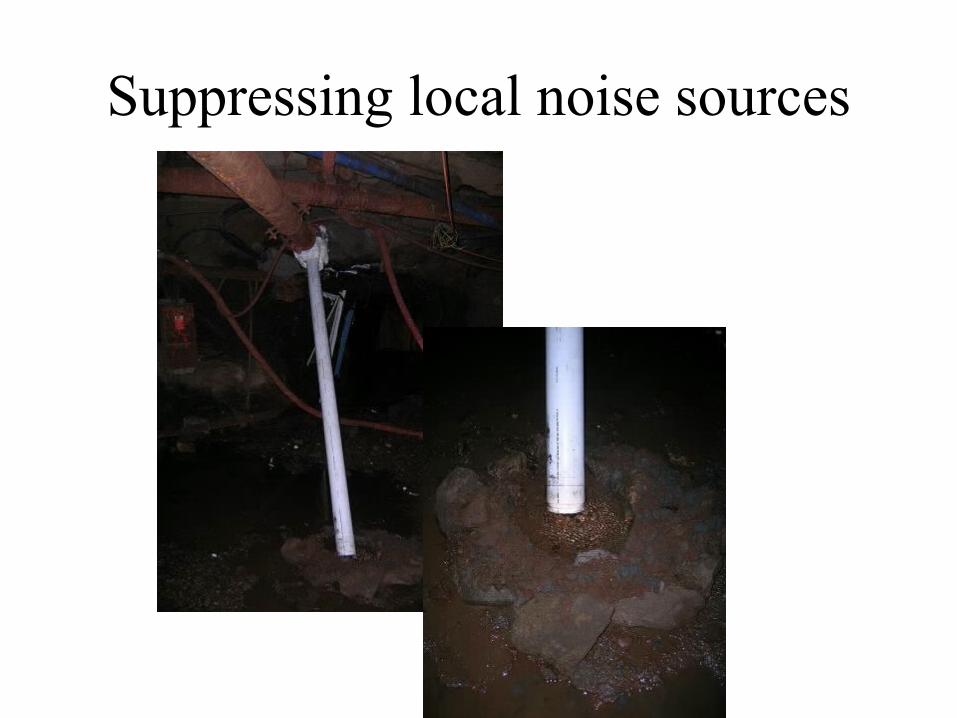
Suppressing local noise sources
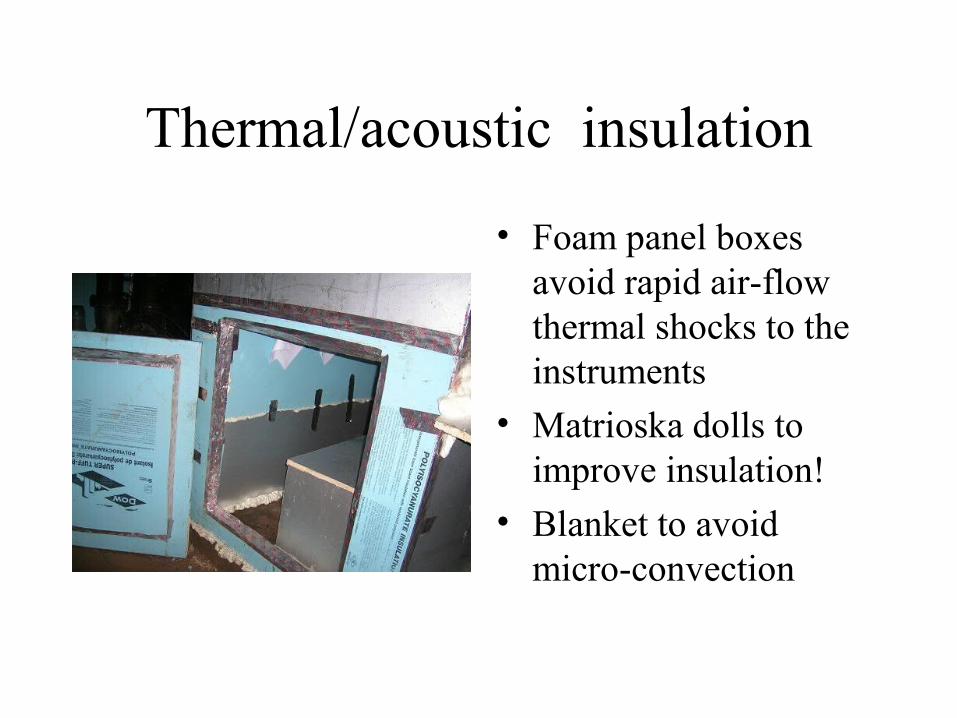
Thermal/acoustic insulation
• Foam panel boxes avoid rapid air-flow thermal shocks to the instruments
• Matrioska dolls to improve insulation!
• Blanket to avoid micro-convection
Data acquisition
Taurus DAQ (from Nanometrics)
PCI DAQ card
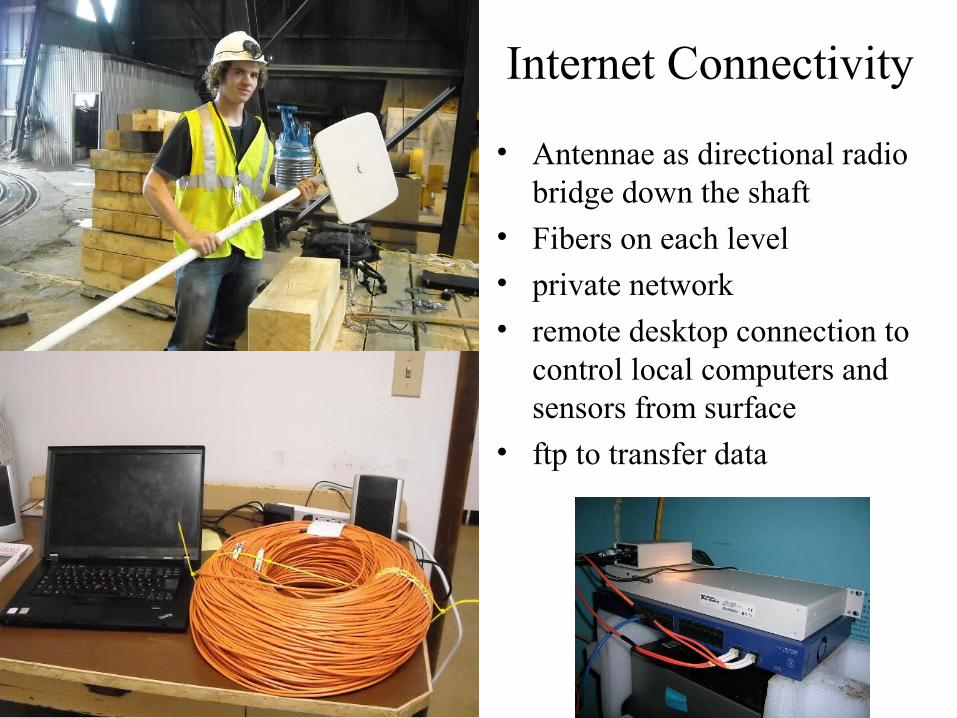
Internet Connectivity
• Antennae as directional radio bridge down the shaft
• Fibers on each level• private network• remote desktop connection to
control local computers and sensors from surface
• ftp to transfer data
Timing issue
• We want synchronized clocks, consistent with the absolute time.
• 10 msec Indetermination in knowledge of absolute time
• .2 ms maximum relative error (surface/300 ft) with antenna and ethernet cable and known average delay of 2.2 msec.
• we did not start yet timing with laser pulses and fibers (which will be with ns errors)

Environmental monitoring
TemperaturePressureHumidityMagnetic field
Soon
MicrophoneCOO2
Micro-anemometer
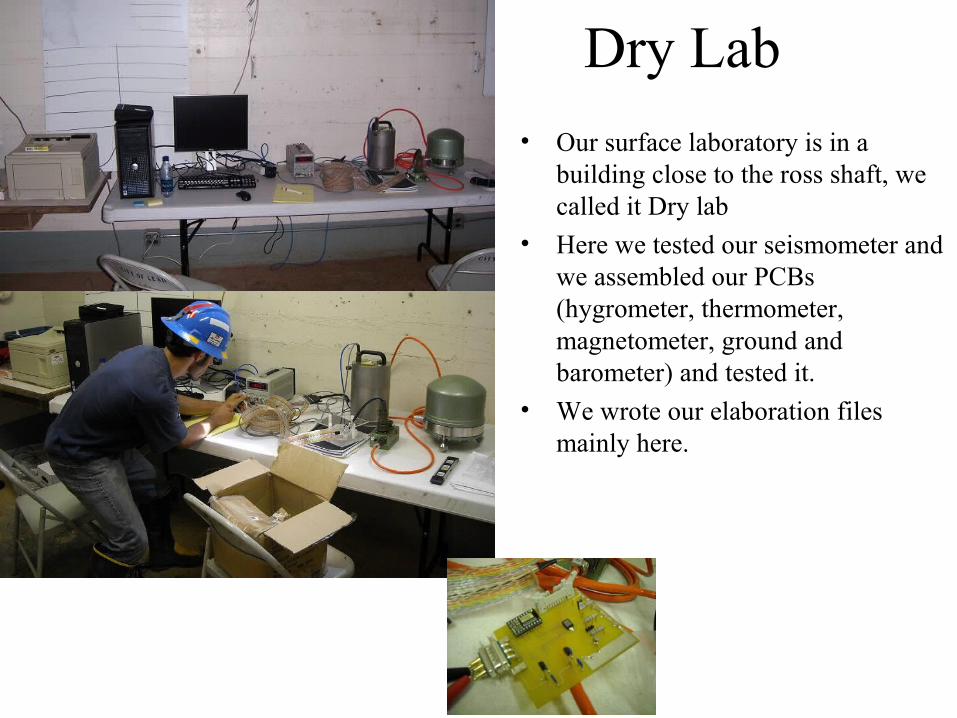
Dry Lab
• Our surface laboratory is in a building close to the ross shaft, we called it Dry lab
• Here we tested our seismometer and we assembled our PCBs (hygrometer, thermometer, magnetometer, ground and barometer) and tested it.
• We wrote our elaboration files mainly here.
Dry lab
• because before it was used for the showers of the miners

300 L
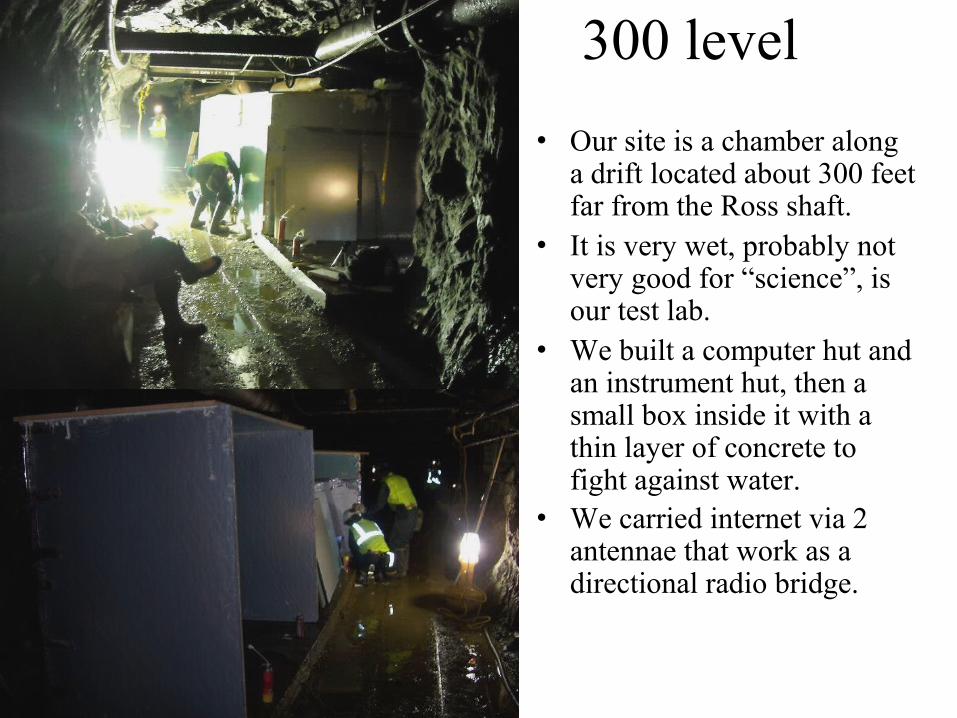
300 level
• Our site is a chamber along a drift located about 300 feet far from the Ross shaft.
• It is very wet, probably not very good for “science”, is our test lab.
• We built a computer hut and an instrument hut, then a small box inside it with a thin layer of concrete to fight against water.
• We carried internet via 2 antennae that work as a directional radio bridge.

First data• We have our first data to deal
with: our instruments are running on the 300 ft site.
• The thermometer, barometer and the other environmental sensors gives reasonable output: they are working!
• Also after some good elaboration work we had some first graphs to show: this figure is a periodogram where each value is averaged with the 100 following values.
Multiple peaks from multiple oceans?
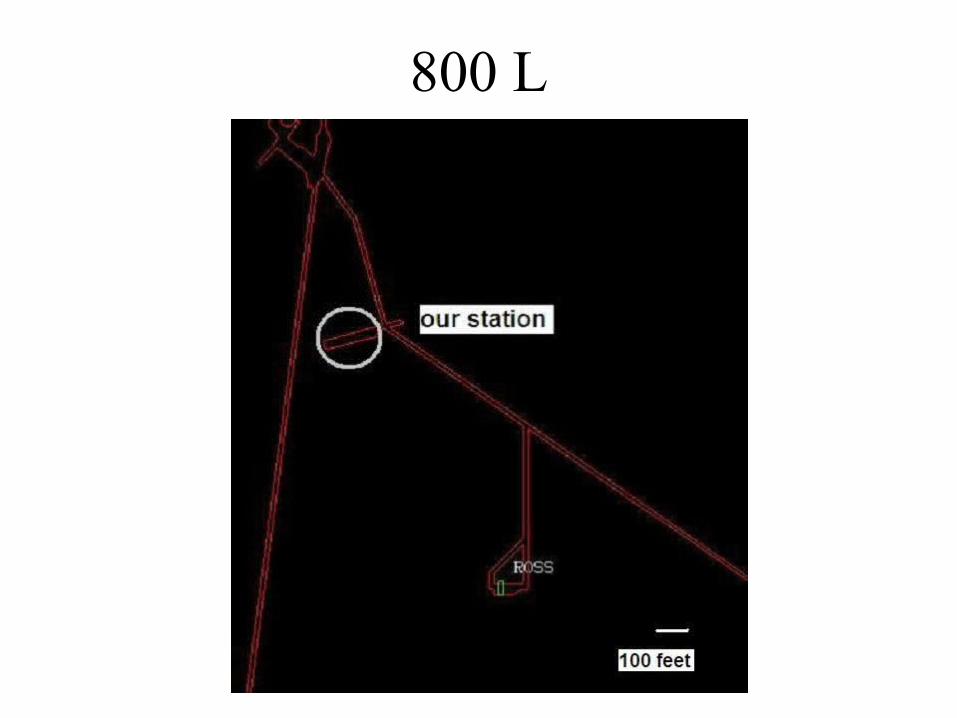
800 L

800 foot level
• Our site here is a nice and dry blind tunnel, almost ideal.
• This room was a dynamite storage, now it has only some timber shelves
• We dugour pit for the instruments, then poured cement and build the hut.
• Since it stays lower we made a nice ladder to get into.

2000 L

2000 level
• Our site at 2000 level is unusual: is a bridge tunnel that joint two bigger tunnels about 2200 ft far from the Ross Shaft.
• We built two walls around that drift in order to stop the air flow.

Eliminating a hanging rock just in front of our site!
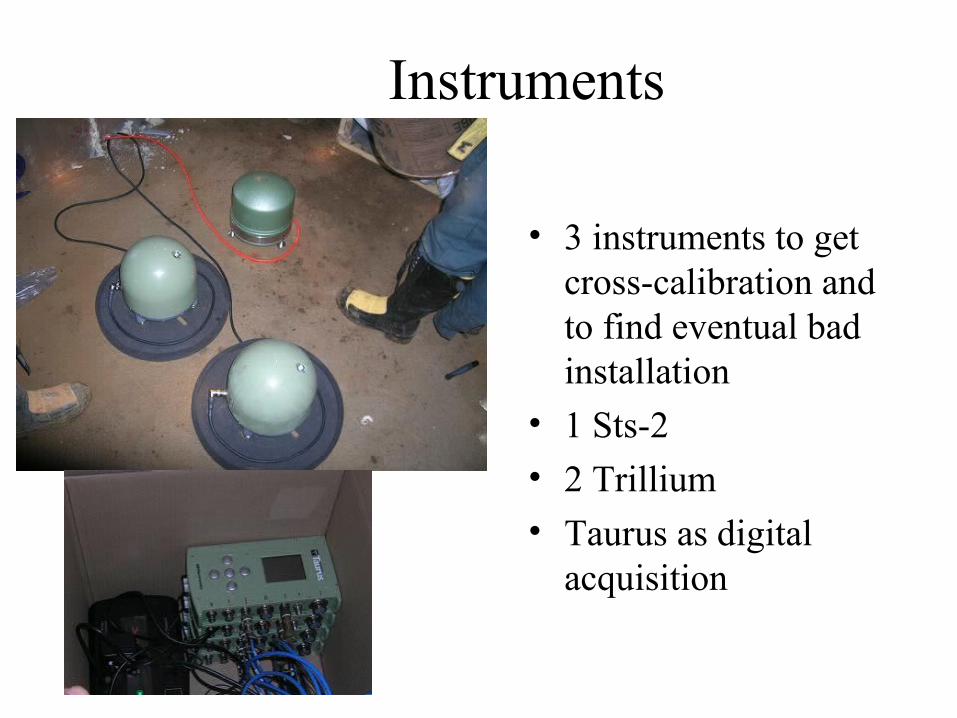
Instruments
• 3 instruments to get cross-calibration and to find eventual bad installation
• 1 Sts-2 • 2 Trillium• Taurus as digital
acquisition

Installation procedure

Trillium 240 data
• First set up
• First two days of acquisition
• Peterson (1993)
• The result on the horizontal is just 10 dB above the NLNM on the E/W channel
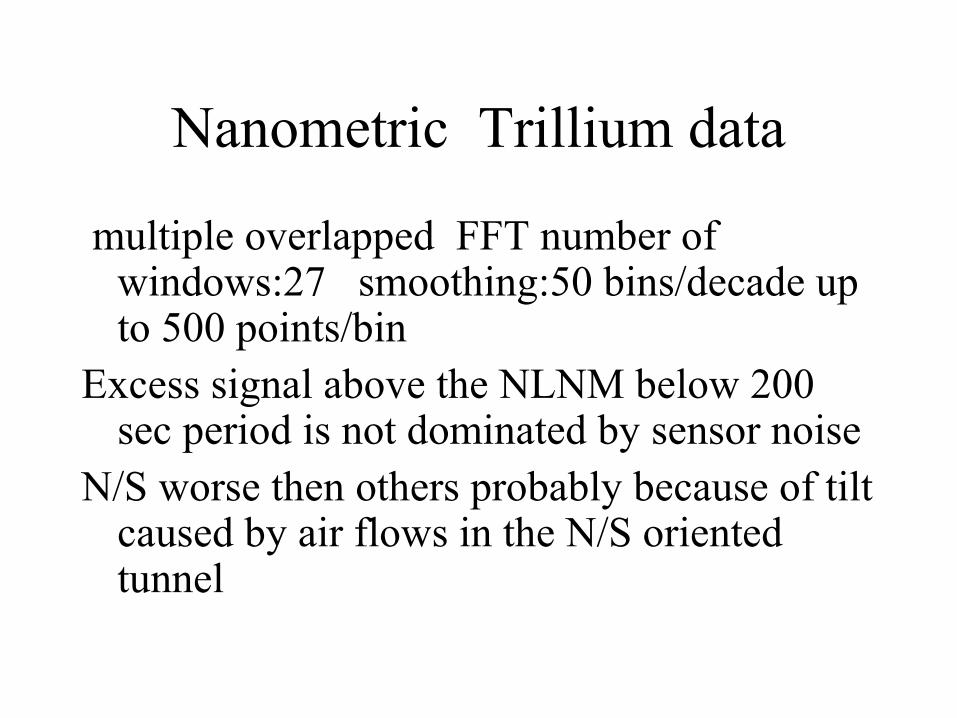
Nanometric Trillium data
multiple overlapped FFT number of windows:27 smoothing:50 bins/decade up to 500 points/bin
Excess signal above the NLNM below 200 sec period is not dominated by sensor noise
N/S worse then others probably because of tilt caused by air flows in the N/S oriented tunnel

Trillium 240 and STS-2 data
• East Pacific • 6 magnitude
event
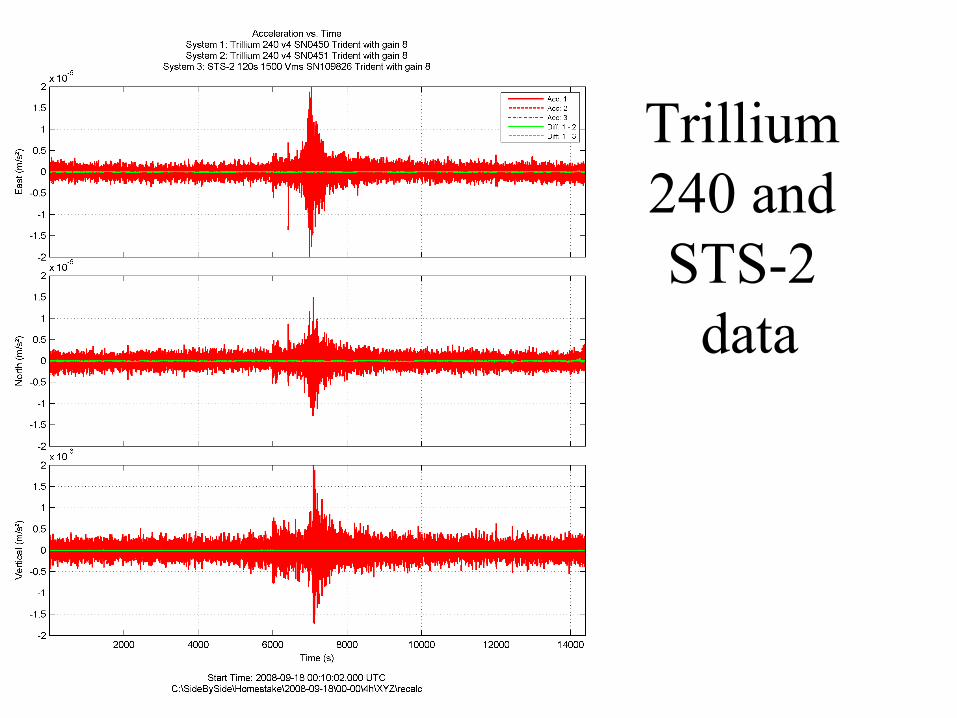
Trillium 240 and STS-2 data

Earthquakedetails
• P and S wave arrivals, surface coda
• From delays we roughly estimated 4100 km away
• To be compared to actual distance of about 5200
• P and S wave arrivals: 2008-9-18 1:49:50 UTC and 240 sec later, then 1500 sec later
• . typical P-wave and S-wave velocities in peridotite at 30 km depth are 8.0 km/s and 4.4 km/s so if the waves traveled only through such a medium its origin would have to be approximately 4100 km away
• Someone unplugged our computer on the 300 level (now automatic restart)
• gives the P-phase arrival as 01:49:45.39. neglecting the difference in longitudes and assuming the earth is a sphere of radius 6378 km, the distance from the epicentre at 4.530°S, 105.978°W to Lead, South Dakota at 44°21′3″N 103°45′57″W is 5277 km. the difference from the crude estimate of 4100 km above is due to the fact that this sort of epicentral distance, the event must be passing through the lower mantle, at depths down to 1800 km

Little drawbacks during the way:
• We could not go deeper then 300 ft in the first several weeks
• Water didn’t want to leave our instruments hut, despite all our efforts
• No power on the antenna on the 300ft for more than one week
• We changed our location (for safety reasons, after starting developing the sites) both on the 800 ft and on the 2000
• Long time spent waiting for the cage to come• et cetera, et cetera, et cetera
What to do, short term
• Switch from Taurus to PC acquisition
• Cross-calibrate instruments
• Migrate to other stations

What in future, over the years
• Establish good arrays of inertial sensors to measure movement of rock
• Develop optical bar for direct measurements of rock deformation (pressure waves)
• Develop optical bars from rock to inertial test mass (shear waves)
Our final product
• Eventually this effort will generate a feasibility study that will tell us:
• Down to what frequency can be sensitive an underground GW interferometer
• What new astronomy will we be able to do
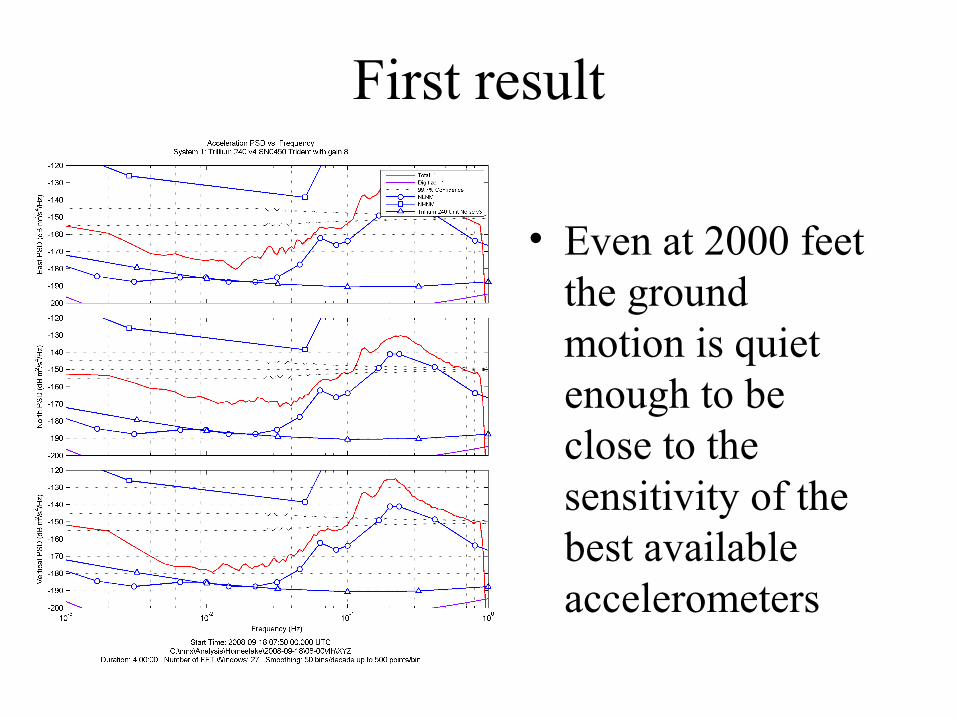
First result
• Even at 2000 feet the ground motion is quiet enough to be close to the sensitivity of the best available accelerometers
Acknowledgements• My mentor Riccardo • my workmate Jan, • Tom Trancynger and Vuk Mandic.• Jason and Virginia for the good time
For the Borrowed seismometers thanks to:•Nelson Christensen (Guralp)•Nanometrics (Trillium)•STS2 LIGO
(We expected to loan 2 or 3 spare STS2 from LIGO, but failures in working units made the additional units unavailable, thanks anyway)
Thanks to INFNFor my summer fellowshipThanks to LIGO and NSFFor the additional support
Borrowed seismometers
Thanks:• guralp Nelson
Christensen• Trillium Nanometrics• Sts2 Ligo
(We expected to loan 2 or 3 spare STS2 from LIGO, but failures in working units made those spares unavailable)