activity patterns in a model for the subthalamopallidal ...rubin/pub/jn2963.pdfactivity patterns in...
TRANSCRIPT

Activity Patterns in a Model for the Subthalamopallidal Network ofthe Basal Ganglia
D. Terman,1 J. E. Rubin,2 A. C. Yew,1 and C. J. Wilson3
1Department of Mathematics, The Ohio State University, Columbus, Ohio 43210, 2Department of Mathematics, TheUniversity of Pittsburgh, Pittsburgh, Pennsylvania 15260, and 3Division of Life Sciences, University of Texas at SanAntonio, San Antonio, Texas 78249
Based on recent experimental data, we have developed aconductance-based computational network model of the sub-thalamic nucleus and the external segment of the globus pal-lidus in the indirect pathway of the basal ganglia. Computersimulations and analysis of this model illuminate the roles of thecoupling architecture of the network, and associated synapticconductances, in modulating the activity patterns displayed bythis network. Depending on the relationships of these couplingparameters, the network can support three general classes ofsustained firing patterns: clustering, propagating waves, andrepetitive spiking that may show little regularity or correlation.Each activity pattern can occur continuously or in discreteepisodes. We characterize the mechanisms underlying theserhythms, as well as the influence of parameters on details such
as spiking frequency and wave speed. These results suggestthat the subthalamopallidal circuit is capable both of correlatedrhythmic activity and of irregular autonomous patterns of ac-tivity that block rhythmicity. Increased striatal input to, andweakened intrapallidal inhibition within, the indirect pathwaycan switch the behavior of the circuit from irregular to rhythmic.This may be sufficient to explain the emergence of correlatedoscillatory activity in the subthalamopallidal circuit after de-struction of dopaminergic neurons in Parkinson’s disease andin animal models of parkinsonism.
Key words: basal ganglia; subthalamic nucleus; globus palli-dus; computational models; oscillations; synchrony; Parkinson’sdisease
Most current models of the basal ganglia are static models, in thatthey represent the inputs and outputs of the component nuclei asfiring rates. For example, the Albin et al. (1989) model, com-monly used to explain the symptoms of Parkinsonism, views theinteractions of the direct and indirect pathway as constant in timeand explains the symptoms of Parkinson’s disease in terms ofchanges in mean rate of the basal ganglia output (Wichmann andDeLong, 1996). In contrast, recent experimental studies have notstrongly confirmed the predicted changes in mean rate in thesestructures under dopamine depletion, but have instead revealedprominent low-frequency periodicity (4–30 Hz) of firing anddramatically increased correlations among neurons in the exter-nal segment of the globus pallidus (GPe) and the subthalamicnucleus (STN) (Bergman et al., 1994; Nini et al., 1995; Magnin etal., 2000; Raz et al., 2000; Brown et al., 2001). It is remarkablethat the changes in firing pattern seen in those structures do notappear to be attributable to comparable changes in the firingpatterns of striatal output cells, although cholinergic striatal in-terneurons show changes comparable with those seen in theglobus pallidus (Raz et al., 1996). The authors of those studieshave proposed that a rate model of the basal ganglia is inadequate
to capture the dynamic interaction of the STN and GPe that maygenerate these pathological changes.
In particular, such dynamic interactions may lead to oscillatoryactivity patterns. Indeed, the connections between GPe and STNneurons show a number of features common to central patterngenerators, which suggests that these nuclei might together becapable of self-sustained oscillatory activity. The GPe cellsproject to the subthalamus and to other basal ganglia structuresand inhibit the cells in those regions via GABAA-receptor medi-ated inhibition. In addition, the GPe cells inhibit each other viarecurrent axon collaterals (Stanford and Cooper, 1999; Oguraand Kita, 2000). Subthalamic cells excite neurons in several basalganglia structures, including the GPe (Kitai and Kita, 1987).Furthermore, these cells show powerful and long-lasting reboundexcitation after episodes of hyperpolarization generated by syn-aptic inhibition from the GPe (Bevan et al., 2000). These prop-erties suggest the possibility for oscillatory rhythms in which GPeneurons are excited by activity in the STN neurons, in turn inhibitthe STN cells, and are again excited by the resulting reboundexcitation of STN cells that follows the inhibition. A mechanismof this kind has been proposed by Plenz and Kitai (1999) on thebasis of their studies of basal ganglia organotypic tissue cultures.
To explore such dynamic interactions, we have performedcomputer simulations of conductance-based models of the sub-thalamopallidal circuit, within the limits of our knowledge of thetopography of the synaptic connections and the cellular proper-ties involved. These simulations reveal a wide variety of oscilla-tory patterns, depending on the arrangements and strengths ofsynaptic connections within and between the cellular populations.We classify these patterns as clustering, propagating waves, andrepetitive spiking (which may show little regularity or correla-
Received Aug. 21, 2001; revised Jan. 15, 2002; accepted Jan. 23, 2002.This work was supported by the National Science Foundation Grants DMS-
0103822 (D.T., A.C.Y.) and DMS-9804447 (J.E.R.) and National Institutes ofHealth, National Institute of Neurological Disorders and Stroke Grant NS26473(C.J.W.). We thank Mark Bevan for providing direct access to his data on STN andGP cell activity.
Correspondence should be addressed to David Terman, Department of Mathe-matics, The Ohio State University, 231 West 18th Avenue, Columbus, OH 43210.E-mail: [email protected] © 2002 Society for Neuroscience 0270-6474/02/222963-14$15.00/0
The Journal of Neuroscience, April 1, 2002, 22(7):2963–2976

tion); each activity pattern can occur continuously or in discreteepisodes. The mechanisms underlying these patterns can be un-derstood in terms of the intrinsic properties and synaptic inter-actions of the cells in our simulations. The network can beswitched from irregular uncorrelated spiking to correlated rhyth-mic patterns through an increase of incoming striatal input to-gether with a weakening of intrapallidal inhibition, suggestingthat these changes may underlie the emergence of correlatedrhythmic activity in the subthalamopallidal circuit in pathologicalstates.
MATERIALS AND METHODSSingle-compartment conductance-based biophysical models of cells fromthe STN and the GPe were developed, based on recent voltage-clamp andcurrent-clamp data (Figs. 1, 2). Simulations of these models and of modelnetworks composed of synaptically coupled STN and GPe cells wereperformed using XPPAUT, developed by G. B. Ermentrout and availableat ftp://ftp.math.pitt.edu/pub/bardware. A copy of the XPPAUT filecontaining the models constructed is available from D.T. on request.
STN cells. The STN model includes a set of currents and correspondingkinetics that are based on recent experimental data (Bevan and Wilson,1999; Bevan et al., 2000). In particular, the model features spike-producing currents (IK and INa), a low-threshold T-type Ca 2� current(IT) and a high-threshold Ca 2� current (ICa) (Song et al., 2000), aCa 2�-activated, voltage-independent “afterhyperpolarization” K � cur-rent (IAHP), and a leak current (IL). The membrane potential of eachSTN neuron obeys the current balance equation:
Cm
dvdt
� �IL � IK � INa � IT � IC a � IAHP � IG3 S .
The leak current is given by IL � gL(v � vL), and the other voltage-dependent currents are described by the Hodgkin–Huxley formalism asfollows: IK � gKn 4(v � vK), INa � gNam�
3 (v)h(v � vNa), IT �gTa�
3 (v)b�2 (r)(v � vCa), and ICa � gCas�
2 (v)(v � vCa). The slowly operatinggating variables n, h, and r are treated as functions of both time andvoltage and have first-order kinetics governed by differential equations ofthe form dX/dt � �X [(X�(v) � X)/�X(v)] (where X can be n, h, or r), with�X(v) � �X
0 � �X1 /[1 � exp[�(v � �X
� )/�X� ]]. Using this formulation,
activation (and inactivation) time constants have a sigmoidal dependenceon voltage, �0/� is the minimum, and (�0 � �1)/� is the maximum timeconstant. The voltage at which the time constant is midway between itsmaximum and minimum values is ��, and �� is the slope factor for thevoltage dependence of the time constant. Activation gating for therapidly activating channels (m, a, and s) was treated as instantaneous. Forall gating variables X � n, m, h, a, r, or s, the steady-state voltagedependence was determined using X�(v) � 1/[1 � exp[�(v � �X)/�X]],where �X is the half activation (or inactivation) voltage for gatingvariable X, and �X is the slope factor for that variable. For the T currentinactivation variable b, we used b�(r) � 1/[1 � exp[(r � �b)/�b]] � 1/[1 �exp[��b /�b]]. The unusual way of modeling T current inactivation here[with b�(r) instead of simply r] was designed to combine the effects of ahyperpolarization-activated inward (sag, or H) current with those of a Tcurrent, making the rebound bursts of an STN cell more prominent.These rebound bursts (see Fig. 1e,f) agree with experimental data (Bevanand Wilson, 1999; Bevan et al., 2001).
As the final intrinsic current, we take IAHP � gAHP(v � vK)([Ca]/([Ca] � k1 )) where [Ca], the intracellular concentration of Ca 2� ions, isgoverned by [Ca]� � �(�ICa � IT � kCa[Ca]). The constant � combinesthe effects of buffers, cell volume, the molar charge of calcium, and is inunits of (mole-sec)/(coulombs-liter). The constant k1 is the dissociationconstant of the calcium-dependent AHP current. The constant kCa is thecalcium pump rate constant and is in units of (coulombs-liter)/(moles-sec). The current IG3S that represents synaptic input from the GPe toSTN is modeled as IG3S � gG3S(v � vG3S)�sj. The summation is takenover the presynaptic GPe neurons, and each synaptic variable sj solves afirst-order differential equation s�j � �H�(vgj � �g )(1 � sj) � sj. Here vgjis the membrane potential of the GPe neuron j, and H�(v) � 1/(1 �exp[�(v � �g
H)/�gH]).
Parameter values for STN cells used in the simulations are given inTable 1. The capacitance Cm was normalized to 1 pF/m 2. Also note thatwe scaled our model such that the currents have units of picoamperes per
square micrometer, to be consistent with the data of Bevan and Wilson(1999) and Bevan et al. (2000).
GPe cells. Our model for single GPe cells is similar in form to that ofthe STN neurons. The equation for the GPe neurons is:
Table 1. Basic set of parameter values for the conductance-based modelSTN cell
Parameter Value
gL 2.25 nS/m 2
gK 45.0 nS/m 2
gNa 37.5 nS/m 2
gT 0.5 nS/m 2
gCa 0.5 nS/m 2
gAHP 9.0 nS/m 2
vL �60.0 mVvK �80.0 mVvNa 55.0 mVvCa 140.0 mV�h
1 500.0 msec�n
1 100.0 msec�r
1 17.5 msec�h
0 1.0 msec�n
0 1.0 msec�r
0 40.0 msec�h 0.75�n 0.75�r 0.2k1 15.0kCa 22.5� 3.75 � 10 �5 msec �1
�m �30.0�h �39.0�n �32.0�r �67.0�a �63.0�b 0.4�s �39.0�h
� �57.0�n
� �80.0�r
� 68.0�g
H �39.0�g 30.0� 5.0 msec �1
vG3S �85.0 mV�m 15.0�h �3.1�n 8.0�r �2.0�a 7.8�b �0.1�s 8.0�h
� �3.0�n
� �26.0�r
� �2.2�g
H 8.0 1.0 msec �1
Parameters in nanosiemans per square micrometer denote maximal conductances ofcorresponding currents in the STN current balance equation. Parameters in milli-volts represent reversal potentials for these currents. Parameters in milliseconds aretime constants relating to the time evolution of the gating variables in the Hodgkin–Huxley representations of these currents, whereas other parameters are associatedconstants.
2964 J. Neurosci., April 1, 2002, 22(7):2963–2976 Terman et al. • Subthalamopallidal Activity Patterns

Cm
dvdt
� �IL � IK � INa � IT � IC a � IAHP � IS3G � IG3G � Iapp ,
where Iapp represents a constant external applied current. IL, IK(Baranauskas et al., 1999; Hernandez-Pineda et al., 1999), INa, ICa (Sur-meier et al., 1994; Stefani et al., 1998), and IAHP are modeled with thesame formulas and equations given above for the STN cells, whereas thelow-threshold calcium current takes a simpler form: IT � gTa�
3 (v)r(v �vCa), where r satisfies a first-order differential equation. Here we assume�r(v) � �r , a constant. This has the effect of reducing the size of theposthyperpolarization rebound in GPe cells compared with STN cells.
The experimental literature suggests that the GPe neurons have sim-ilar ionic currents to STN cells, but in different proportions. Parametervalues for GPe cells used in the simulations are given in Table 2. Inparticular, parameters associated with the GPe potassium channels allowfor fast spiking of GPe cells (Hernandez-Pineda et al., 1999); we have notincluded a second slowly deactivating component of the potassium cur-rent (Baranauskas et al., 1999). These parameters were selected to matchthe data for spontaneous firing patterns, rebound response to offset ofhyperpolarization, spike frequency adaptation, and frequency–intensitycurves obtained from the study of GPe cells in slices (Kita and Kitai,1991; Nambu and Llinas, 1994; Cooper and Stanford, 2000).
Two different synaptic currents are included in the GPe model. IS3Grepresents excitatory input from the STN, and IG3G represents theinhibitory influence coming from other GPe cells. These are modeled bythe same type of expression as used for IG3S, with appropriately re-named synaptic parameters.
The input to the GPe cells from the striatum is represented by aconstant hyperpolarizing current Iapp common to all the GPe cells. Thiscurrent is not specified in Table 2 because in our network simulations itwill be one of the main parameters that we vary. The use of thisunpatterned inhibitory influence as a parameter was not intended as arealistic representation of the pattern of activity in the striatopallidalpathway, but rather as an approximation to the overall effect of greater orlesser striatal inhibition to the GPe.
Synaptic connectivity. Currently, the details of connections betweenSTN and GPe cells are poorly understood. It is known that STN neuronsprovide one of the largest sources of excitatory input to the globuspallidus and that the GPe is a major source of inhibitory afferents to theSTN (Kitai and Kita, 1987). However, the spatial distribution of axons ineach pathway, as well as the number of cells innervated by single neuronsin each direction, are not known to the precision required for a computermodel. Some early reports suggested that the STN cells project to theGPe in a diffuse manner (Hazrati and Parent, 1992), whereas morerecent studies indicate that the two are more tightly interconnected, witha connectivity that may be precisely topographical (Shink et al., 1996) ormore heterogeneous (Sato et al., 2000). It is certain from the existingstudies that the connection is sparse; that is, each GPe neuron makessynaptic contacts with few STN neurons and vice versa. But the numberof synapses made by single neurons or the proportion of neurons con-tacted by an axon within the arborization cannot currently be estimated.Therefore, we consider multiple architectures based on low numbers ofcontacts from STN to GPe cells, from GPe to STN cells, and within theGPe. In the model networks, each GPe neuron sends inhibition to theentire GPe population or some part of it, as well as to one or more STNneurons. Each STN neuron sends excitation to one or more GPe neurons.The intrinsic parameters associated with the STN and GPe cells are thesame for each simulation; these are the parameter values of the individ-ual model STN and GPe neurons given in Tables 1 and 2. We usednetworks of between 8 and 20 cells of each type for the simulationsdescribed in this paper.
RESULTSFiring properties of model STN and GPe neuronsThe model STN neurons were adjusted to exhibit properties thatare characteristic of the firing of STN neurons in experimentalstudies on slices (Bevan and Wilson, 1999; Bevan et al., 2000;Beurrier et al., 2000). The model neurons are spontaneouslyactive with a firing rate of 3 Hz. When current is injected, thecells achieve firing rates on the order of 200 Hz with little changein the voltage range of the membrane potential traversed by theaction potentials. Figure 1a presents currents generated by
voltage-clamp simulations. Figure 1b displays the membrane po-tential of a model STN cell as a function of constant currentinjection, after setting gNa � 0. The frequency–current (f–I)relation for a model STN cell is shown in Figure 1c. Figure 1dshows the duration of the afterhyperpolarization after a 500 msecperiod of high-frequency spikes evoked by different levels ofcurrent pulses. Note that the afterhyperpolarization increasessmoothly over a wide range of firing rates during the pulses.
Table 2. Basic set of GPe parameter values
Parameter Value
gL 0.1 nS/m 2
gK 30.0 nS/m 2
gNa 120.0 nS/m 2
gT 0.5 nS/m 2
gCa 0.15 nS/m 2
gAHP 30.0 nS/m 2
vL �55.0 mVvK �80.0 mVvNa 55.0 mVvCa 120.0 mV�h
1 0.27 msec�n
1 0.27 msec�h
0 0.05 msec�n
0 0.05 msec�r 30.0 msec�h 0.05�n 0.05�r 1.0k1 30.0kCa 20.0� 1 � 10 �4 msec �1
�m �37.0�h �58.0�n �50.0�r �70.0�a �57.0�s �35.0�h
� �40.0�n
� �40.0�g
H �57.0�g 20.0� 2.0 msec �1
vG3G �100.0 mV�m 10.0�h �12.0�n 14.0�r �2.0�a 2.0�s 2.0�h
� �12.0�n
� �12.0�g
H 2.0 0.08 msec �1
vS3G 0.0 mV
Parameters in nanosiemans per square micrometer denote maximal conductances ofcorresponding currents in the GPe current balance equation. Parameters in milli-volts represent reversal potentials for these currents. Parameters in milliseconds aretime constants relating to the time evolution of the gating variables in the Hodgkin–Huxley representations of these currents, whereas other parameters are associatedconstants.
Terman et al. • Subthalamopallidal Activity Patterns J. Neurosci., April 1, 2002, 22(7):2963–2976 2965

Figure 1, e and f, demonstrates that STN neurons generaterebound bursts after the removal of negative current. The dura-tion of the rebound depends on the degree of hyperpolarization.The rebound bursts typically last up to 200 msec and are thenfollowed by spontaneous firing.
Sample responses of model GPe neurons to current injectionsare shown in Figure 2. High-frequency repetitive firing does notshow strong accommodation and is followed by a pronouncedhyperpolarization (Fig. 2). After a hyperpolarizing current pulse,the neuron can exhibit rebound firing. We note, however, that theability of GPe neurons to rebound is not essential for the gener-ation of rhythmic population activity. For weak hyperpolarizingapplied currents, the neuron exhibits oscillations in which anactive spiking phase alternates with a silent phase of near restingbehavior. This activity pattern, which is common to fast-spikingneurons in the GPe (Cooper and Stanford, 2000) and elsewhere,has important implications for the model. In our implementation,it arises because of the slow time course of calcium buildup anddecay in the neurons. At higher levels of current, the model cellsshow continuous firing in response to current pulses. Similardynamics can arise from other mechanisms (Rush and Rinzel,1995), and the mechanism of this kind of firing in GPe neurons is
not known with certainty. The network dynamics that arise fromthis fire-and-pause mode of activity in our model do not dependcritically on the cellular mechanism. We also note that severalpapers have reported various types of neurons within the GPe.Our model GPe neurons, as shown in Figure 2, were adjusted todisplay properties similar to the type 2 neurons describedby Nambu and Llinas (1994), the type A neuron described byCooper and Stanford (2000), and the repetitive firing neuronsdescribed by Kita and Kitai (1991). Recent experiments havesuggested that this is the most dominant type of neuron withinGPe. The episodic firing behavior seen at weakly negative ap-plied currents resembles the high-frequency discharge with pausedescribed by DeLong (1971). In our simulations of the STN–GPenetwork, Iapp is taken to be a small hyperpolarizing (negative)current and, as described in Materials and Methods, will approx-imate input from the striatum.
The prototype networksIn the following sections we shall describe the network activitygenerated by three prototype network architectures, as well ashow this activity depends on the synaptic conductances gS3G,gG3G, and the applied current Iapp to GPe. Each of the three
Figure 1. Properties of STN model neuron. a, Current as a function of voltage. For fixed voltages, steady-state currents were computed with slow gatingvariables set to their limiting values [X3 X�(v); see Materials and Methods]. In this and all subsequent figures, omitted units are as in Tables 1 and 2.b, Membrane potential of a model STN cell under various current injections. The parameter gNa has been set to 0 to mimic the behavior of an STN cellin the presence of sufficient concentration of TTX to block spiking. c, Spike frequency as a function of injected current (solid line, full model; dotted line,gAHP � 0; dashed line, gCa � gT � 0). d, Duration of afterhyperpolarization after high-frequency spiking. A constant current pulse was applied to a modelSTN cell for 500 msec. After this, a prolonged afterhyperpolarization occurred before the cell returned to regular spiking. Its duration is plotted againstthe strength of applied current. e, f, STN rebound bursts after hyperpolarizing injections. e, Model responses of STN cell to currents of varying duration:25 pA/m 2 of current applied for 300 (top), 450 (middle), and 600 (bottom) msec. Longer current application augments deinactivation of IT, enhancingrebound. f, Responses to currents of varying magnitude: 20 (top), 30 (middle), and 40 (bottom) pA/m 2 of current applied for 300 msec. Stronger currentapplication augments deinactivation of IT, enhancing rebound.
2966 J. Neurosci., April 1, 2002, 22(7):2963–2976 Terman et al. • Subthalamopallidal Activity Patterns

prototype architectures includes a distinct type of connectivitybetween STN and GPe cells. In all of these, each cell onlycontacts a small number of other cells. However, within thesimulated networks, the density of connections relative to the sizeof the network varies across architectures, and they are namedaccordingly: in sparsely connected architectures, each cell sendsout connections to a small subset of the STN and GPe popula-tions; in tightly connected architectures, the connectivity patternsyield localized circuits of reciprocally connected GPe and STNcells, in which each cell sends inputs to, and receives inputs from,a relatively large subset of the other cells in the circuit.
Random, sparsely connected architectureThe simplest class of networks consistent with low connectivity isone in which each GPe cell sends inhibitory input to a smallproportion of the STN neurons selected randomly, and the STNcells also make sparse and random connections. The chances ofreciprocal connections between any STN–GPe cell pair is low.This class of networks was represented using the network shownin Figure 3a. The subthalamic neurons could fire spontaneouslyby their usual pacemaker mechanism (Bevan and Wilson, 1999;Beurrier et al., 2000) but the GPe neurons were inhibited by theapplication of Iapp (representing striatal inhibition) to a level justadequate to prevent their spontaneous firing.
The activity patterns that this network displays are summa-rized in Figure 3b–d. In these patterns, the firing of each cell istypically irregular and weakly correlated with the activity of othercells. Dependence of activity on gS3G and gG3G is illustrated inFigure 3b. As with all the architectures, if gS3G is too small, thenthe GPe cells cannot respond to STN firing, and there is nonetwork activity, only the pacemaking of the STN cells. Forlarger values of gS3G, the occasional firing of GPe cells producesan irregular background of inhibition that deregularizes the STNneurons, resulting in sparse irregular firing in both structures(Fig. 3c, first panel). GPe neurons fire in a correlated (but notperfectly one-to-one) way with the single STN neuron to whicheach is connected, but correlations are weak among randomlyselected cell pairs. The correlations that do occur have a verynarrow time scale, with connected GPe and STN cells firingalmost simultaneously as the GPe neuron fires on the EPSPgenerated by the STN neuron or not at all. With still larger valuesof gS3G, the network displays episodic activity, as shown inFigure 3, c and d. During each episode, the cells fire irregularly,and there is an increased synchronization both within and amongnuclei. The episodes of firing involve all neurons in the network.The episodes last for 300 msec, and their durations increasewith increasing gS3G; the silent periods between the episodesremain approximately constant at 500 msec. When gS3G becomessufficiently large, the network activity switches to continuous,irregular spiking as depicted in Figure 3, c and d. There are weakor no within-nuclei correlations of firing in this continuous re-gime, and across-nuclei correlations are rare because they arerestricted to cells receiving direct interconnections (which aresparse). This is shown in Figure 3d, but was also tested bycalculating the cross-correlations among and between the twogroups of cells.
Episodic rhythmsTo understand the neuronal mechanism underlying episodicrhythms, suppose that one or more STN cells fire action poten-tials. The resulting excitation may induce the corresponding GPecells to respond with their own spikes. This leads to hyperpolar-ization of STN cells, which resets the pacemakers of these. Thisis the same mechanism illustrated experimentally by Bevan et al.(2001) after stimulation of inhibitory inputs to the STN. Thepostinhibitory firing of the STN neurons induces another roundof firing in the GPe neurons. So long as there is some divergencein one or both directions (as in the GPe3STN connection of Fig.3a), activity in some neurons will tend to recruit others, and theentire network will ultimately be recruited. This causes T currentswithin the STN cells to deinactivate so that activity during the ep-isode can be sustained through postinhibitory rebound. The ter-mination of an episode of activity is caused by activation of theoutward K� current, IAHP, in the GPe cells as calcium builds upwith each additional spike. This is illustrated in Figure 4. OnceIAHP is sufficiently activated, a GPe neuron is no longer able torespond to excitation from STN. When GPe activity terminates,STN cells may fire one last burst of spikes caused by postinhibi-tory rebound. Activity then recurs when STN cells recoverenough to fire again, by which time the GPe cells can againrespond to the STN.
As described earlier, if the overall current input to a GPe cellis weakly inhibitory, then the calcium of the cell can reach a levelthat inhibits firing (Fig. 2a); thus, the neuron fires in the episodicmode. In our simulations, we assume that the hyperpolarizingapplied current from striatum to GPe (Iapp) is strong enough such
Figure 2. Properties of GPe model neuron. a, Top three time traces showfiring profiles of a model GPe cell under depolarizing, zero, and smallhyperpolarizing input currents (Iapp in pA/m 2), respectively. Bottomtrace shows afterhyperpolarization of a model GPe cell after injection ofa depolarizing current pulse. b, Membrane potential of a model GPe cellas a function of injected current, with gNa � 0. c, Frequency of GPespiking as a function of injected current.
Terman et al. • Subthalamopallidal Activity Patterns J. Neurosci., April 1, 2002, 22(7):2963–2976 2967

Figure 3. Activity patterns in a random, sparsely connected architecture. a, Arrangement of the model network. Each STN neuron excites a single GPeneuron selected at random, and each GPe neuron inhibits three randomly chosen STN cells. GPe cells also inhibit each other through all-to-allconnections. b, Dependence of activity patterns on coupling strengths gG3G and gS3G. Weak STN3GPe excitation or strong GPe3GPe inhibition leadsto sparse irregular firing patterns. Intermediate values yield episodic patterns, whereas high levels of excitation and low levels of GPe mutual inhibitiongive rise to continuous uncorrelated activity. c, Membrane potential (in millivolts) as a function of time (milliseconds) for individual cells in each of theactivity patterns: sparse activity (gG3G � 0.06 nS/m 2; gS3G � 0.03 nS/m 2; gG3S � 2.5 nS/m 2; Iapp � �1.2 pA/m 2), episodic, almost-synchronizedspiking (gG3G � 0 nS/m 2; gS3G � 0.016 nS/m 2; gG3S � 2.5 nS/m 2; Iapp � �1.2 pA/m 2), and continuous, irregular spiking (gG3G � 0.02 nS/m 2;gS3G � 0.1 nS/m 2; gG3S � 2.5 nS/m 2; Iapp � �1.2 pA/m 2). d, Network activity in various patterns. In each plot, 10 rows show the voltage tracesof 10 cells, with time evolving over 2000 msec to the right along each row. Voltage is coded in grayscale as shown. Because they are so brief, individualaction potentials (dark gray line segments) are not prominent, but are more clearly indicated by their afterhyperpolarization (white bars).
2968 J. Neurosci., April 1, 2002, 22(7):2963–2976 Terman et al. • Subthalamopallidal Activity Patterns

that GPe cells are not spontaneously active. When the excitatoryinput from STN to GPe is relatively weak, the total input to GPeis appropriate to trigger calcium-regulated episodic firing. On theother hand, if the excitation from STN to GPe is sufficientlystrong, the calcium-dependent AHP current in GPe cells willachieve an equilibrium level that will slow but no longer terminateGPe firing. GPe cells will always be able to respond to the firingof STN cells in this case, and a continuous rhythm results.Increasing gS3G transforms an episodic rhythm into a continuousone; such a transition may also be achieved by decreasing themagnitude of Iapp from a large hyperpolarizing level.
The duration between active episodes is determined primarilyby the IAHP current in STN neurons. During an episode, STNneurons fire rapid action potentials resulting in an increase oftheir intracellular calcium. Once the event terminates, there is aprolonged afterhyperpolarization before the cells can resumetheir pacemaking spiking activity (Bevan and Wilson, 1999) (Fig.1d) and initiate a new episode. The time between episodes doesnot depend significantly on Iapp or the synaptic parameters gS3G,gG3G.
The duration of each episode is determined by two factors. Thefirst is how long it takes for calcium to build up and hyperpolarizeGPe neurons so that they no longer respond to excitation fromSTN. This depends on the strength of STN3GPe synaptic exci-tation, as well as on Iapp. The second factor is the duration of anyrebound bursting generated by STN neurons at the end of theepisode. Both of these depend on the rate of firing within the ep-isode. Firing rate within the episode is determined by thestrength of synaptic connections and the time between onset of
GPe inhibition in an STN neuron and the postinhibitoryresponse.
All of the above description holds regardless of the action ofthe intra-GPe inhibition. Because it is all-to all, the intra-GPeinhibition in this network acts in proportion to the total activity inthe GPe, and so opposes the STN3GPe excitation. For largervalues of gG3G, the network requires increased STN activity tosupport organized firing. The value of gS3G at which the activityswitches from episodic to continuous firing increases, in an ap-proximately linear manner with gG3G. When gG3G becomes toolarge, the network exhibits asynchronous, irregular activity, asoccurs when gS3G is small.
Structured, sparsely connected architectureWe next consider the off-center architecture depicted in Figure5a. Although the GPe3STN connection is more structured inthis model network, it is so in a way that avoids direct reciprocalconnections between GPe and STN. The nearest-neighbor intra-GPe inhibition is structured to create a lateral inhibition amongGPe neurons that have overlapping projections in the STN.
This network can give rise to more varied network dynamicsthan the unstructured network described above. Most patternsfeature clustering, in which each structure is divided into subsetsof neurons that become highly correlated with each other (Fig.5b–d). The most commonly observed clustered pattern consists oftwo clusters, with alternating pairs of cells belonging to oppositeclusters (Fig. 5c,d). Different clusters alternate firing, and in thispattern, cluster membership is persistent over time. The switch ofactivity from one cluster to another can involve either an overlapof firing or a brief interval of network quiescence, depending onparameters. There is a tight synchrony of firing among cells of thesame cluster.
Clustered rhythmsTo understand the neuronal mechanism underlying clusteredrhythms, consider an example of an activity pattern consisting oftwo clusters. Suppose that one subpopulation of STN neurons,which we denote as S1 , excites its corresponding subpopulation ofGPe neurons, call them G1 , to initiate an episode of firing. If theinhibition from G1 is powerful enough, then it prevents theremaining STN neurons, in a different subpopulation S2 , fromfiring. Eventually, cells in S2 escape from their suppressed stateand fire. This induces the remaining GPe cells, group G2 , to fire,and the resulting inhibition terminates the activity of S1. Theroles of the S1 /G1 and S2 /G2 clusters are now reversed.
The primary reason why cells in S2 are able to escape is thatalthough S2 cells are hyperpolarized, their inward IT currentsdeinactivate. A second reason is that there is some slight adap-tation of firing rates of cells in S1 as their IT currents inactivateand their AHP currents accumulate. Unlike the episodic firingdescribed earlier, cluster alternation is not primarily driven byaccumulation of AHP currents, but by persistent inhibition andthe resulting removal of inactivation of rebound currents. Thesefactors appear in Figure 6. As long as S1 cells maintain a highfiring frequency, then so will cells in G1. This results in a toniclevel of inhibition to cells in S2 , preventing them from firing. Adecrease in the firing rate of S1 caused by adaptation helps allowS2 to become active, and its excitability is enhanced by reboundcurrents accumulated during the persistent inhibition. The lengthof time for which one cluster can fire before another one takesover, and hence the population bursting frequency, is mostly setby the rate of deinactivation of IT in inactive STN cells relative to
Figure 4. Mechanisms underlying episodic activity patterns. The graytrace in the top box shows the evolution of voltage over time for a singleGPe cell in an episodic pattern, whereas the black trace shows the voltagefor a single STN cell. The boxes below show the intracellular calciumconcentration of each cell as a function of time. Initially, GPe spikesclosely follow STN spikes. Here Iapp is sufficiently strong such that thebuild-up of calcium terminates the GPe activity of the cell eventually,after which the STN cell fires one last volley of rebound spikes until about2600 msec. Subsequent decay of calcium allows STN activity to resumeafter time 3200 msec; this recruits the GPe cell again.
Terman et al. • Subthalamopallidal Activity Patterns J. Neurosci., April 1, 2002, 22(7):2963–2976 2969
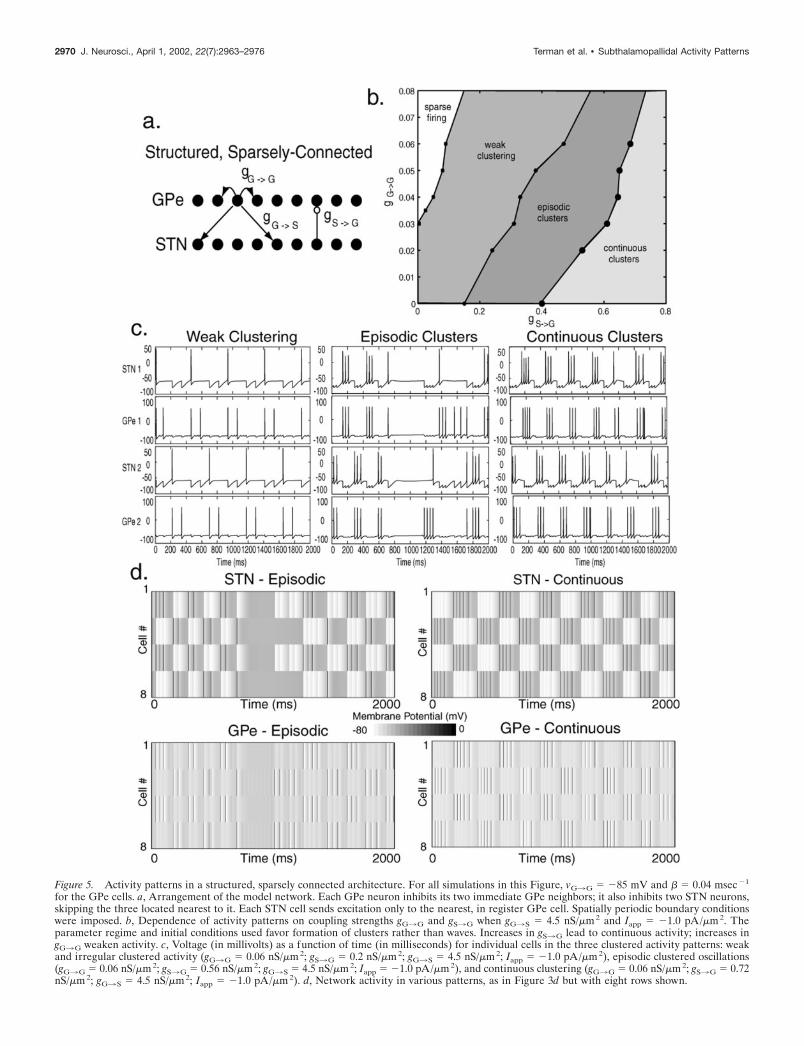
Figure 5. Activity patterns in a structured, sparsely connected architecture. For all simulations in this Figure, vG3G � �85 mV and � 0.04 msec �1
for the GPe cells. a, Arrangement of the model network. Each GPe neuron inhibits its two immediate GPe neighbors; it also inhibits two STN neurons,skipping the three located nearest to it. Each STN cell sends excitation only to the nearest, in register GPe cell. Spatially periodic boundary conditionswere imposed. b, Dependence of activity patterns on coupling strengths gG3G and gS3G when gG3S � 4.5 nS/m 2 and Iapp � �1.0 pA/m 2. Theparameter regime and initial conditions used favor formation of clusters rather than waves. Increases in gS3G lead to continuous activity; increases ingG3G weaken activity. c, Voltage (in millivolts) as a function of time (in milliseconds) for individual cells in the three clustered activity patterns: weakand irregular clustered activity (gG3G � 0.06 nS/m 2; gS3G � 0.2 nS/m 2; gG3S � 4.5 nS/m 2; Iapp � �1.0 pA/m 2), episodic clustered oscillations(gG3G � 0.06 nS/m 2; gS3G � 0.56 nS/m 2; gG3S � 4.5 nS/m 2; Iapp � �1.0 pA/m 2), and continuous clustering (gG3G � 0.06 nS/m 2; gS3G � 0.72nS/m 2; gG3S � 4.5 nS/m 2; Iapp � �1.0 pA/m 2). d, Network activity in various patterns, as in Figure 3d but with eight rows shown.
2970 J. Neurosci., April 1, 2002, 22(7):2963–2976 Terman et al. • Subthalamopallidal Activity Patterns

the level of inhibition they receive. For the parameters used here(based on studies from brain slices) the cluster alternation rateranges from 4 to 6 Hz.
We note that other mechanisms besides deinactivation of the IT
current may also promote escape, thus contributing to the gener-ation of clustered rhythms. For instance, it is possible that short-term synaptic plasticity plays a role in escape mechanisms; in fact,Hanson and Jaeger (2002) have recently demonstrated that theSTN to GPe pathway exhibits short-term depression.
A key point is that network activity segregates cells in such away that at any given time, neurons within silent STN clusters arereceiving more inhibition from active GPe cells than are theactive STN neurons. Hence, inhibition may play the dual role ofmaintaining the active STN bursts (by deinactivating IT), whilesuppressing the silent STN neurons.
Additional clustered patterns also arise from this architecture,as do propagating waves. Many of these patterns are dynamic,with cluster membership changing over time. Examples of alter-native cluster patterns include a two-cluster pattern in whichevery cell is in a different cluster from its two immediate neigh-bors and a four-cluster pattern in which cells in the same clusterare separated by three other cells.
Clustered activity leads to discrete phase differences amongneurons. The range and distribution of those differences is deter-mined by the number of clusters, with the simplest outcome,consisting of two phases, described here. In a larger network ofthis kind, it is feasible that a large number of clusters could arise,giving a wide range of phase relationships. A continuous distri-
bution of phases among STN and GPe neurons, however, wouldrequire traveling waves of activity within the STN and GPe.
As in the less structured architectures, intermediate values ofgS3G give rise to episodic activity in the network as a whole (Fig.5c,d). This occurs for the same reason (accumulation of Ca-dependent K current), and because this is slower than the processresponsible for cluster alternation, it affects all clusters equally. Athigher values of excitation and/or lower levels of intra-GPe inhi-bition, clustered activity becomes continuous, because the effectof the AHP current is overcome (Fig. 5b–d). Episodic clusteringis less robust than continuous clustering, because in a sparselyconnected network, it is difficult for calcium to build up suffi-ciently throughout the GPe population to turn off activity acrossa large segment of the network. In fact, for sparsely connectednetworks in general, episodic rhythms are more robust when thearchitecture is random as opposed to structured (random connec-tions allow activity to spread across the network more quickly).
Structured, tightly connected architectureThe third network to be considered is the structured, tightlyconnected architecture represented by the model system in Figure7a. Figure 7b illustrates regions in the (gS3G, gG3G) parameterplane that support each activity pattern, whereas Figure 7, c andd, shows how cellular activity varies over time in a variety of thesepatterns. Again, Iapp is set at a level so that isolated GPe neuronsare silent.
Let us consider the network behavior at various different levelsof intra-GPe inhibition. First suppose that there is virtually nointra-GPe inhibition (gG3G 0). In this case, if gS3G is verysmall, the STN neurons spike slowly via their pacemaker mech-anism, the GPe neurons are mostly silent, and interaction be-tween the GPe and STN populations is too weak to generate anydiscernible network rhythm. Increasing gS3G gives rise to anepisodic pattern, with every cell participating in events of repet-itive spiking activity, separated by periods of quiescence, thatrepeat periodically at 1–2 Hz. When gS3G gets above a certainlevel, the population activity switches to a continuous mode; allthe STN and GPe cells exhibit tonic spiking, with the spikingfrequency growing to 25 Hz as gS3G is increased. The trans-formation from episodic to continuous activity achieved by in-creasing gS3G can also be observed after decreasing the magni-tude of the hyperpolarizing Iapp. Recall that weakening Iapp
(making it less negative) transforms a GPe neuron from firing inthe episodic mode to spiking continuously. The mechanism un-derlying the transformation from episodic to continuous activityin the network is similar to that in an isolated GPe neuron, andin both of the architectures described earlier.
Higher levels of the intra-GPe inhibition have the effect ofproducing traveling waves, within both the episodic and continu-ous firing modes (Fig. 7c,d). These waves correspond to solitarypulses with no activity in the wake of the wave (note that theappearance of multiple “bands” of activity in Figure 7d is causedby the periodic boundary conditions imposed; at any one time,only one localized group of cells is active). The propagationstructure of a wave was clearly discernible in cross-correllogramscalculated from the simulations (data not shown).
If gG3G is increased to even higher values, the waves lose theirshape and firing activity eventually becomes sparse, irregular, anduncorrelated. For higher levels of excitatory drive from STN toGPe, the intra-GPe synaptic conductance gG3G needs to bestronger before waves are able to form, but these waves exist fora larger interval of gG3G values (Fig. 7b).
Figure 6. Mechanisms underlying clustered activity patterns. The top boxshows the superimposed voltage time courses for an STN cell (dottedtrace) and a GPe cell (solid trace) from a single, tightly synchronized pairbelonging to the same cluster in a clustered rhythm; the middle box showsthe same for a single pair from a different cluster. The bottom box showsthe availability level of the IT currents for the STN cells in the twodifferent pairs (solid curve corresponds to middle box; dashed curve to topbox). When availability of IT becomes sufficiently large, the suppressedcluster is able to escape and fire; this then suppresses the previously activecluster.
Terman et al. • Subthalamopallidal Activity Patterns J. Neurosci., April 1, 2002, 22(7):2963–2976 2971

Figure 7. Activity patterns in the structured, tightly connected architecture. a, Network used for these simulations. Each GPe neuron contacts the fiveclosest STN neurons, as well as all of the GPe cells. Each STN cell sends excitation to the three closest GPe cells. Spatially periodic boundary conditionswere imposed. b, Dependence of activity patterns on coupling strengths gG3G and gS3G when gG3S � 1.0 nS/m 2 and Iapp � �1.2 pA/m 2. Increasesin gS3G lead to continuous activity; increases in gG3G yield a transition to waves followed by sparse, irregular firing. The value of gG3G at which eachof these transitions occurs rises with gS3G. c, Voltage (in millivolts) as a function of time (in milliseconds) for individual cells in various activity patterns:episodic, almost-synchronized spiking (gG3G � 0.0 nS/m 2; gS3G � 0.013 nS/m 2; gG3S � 1.0 nS/m 2; Iapp � �1.2 pA/m 2 for GPe), episodic wave(gG3G � 0.02 nS/m 2; gS3G � 0.013 nS/m 2; gG3S � 1.0 nS/m 2; Iapp � �1.2 pA/m 2), and continuous wave (gG3G � 0.1 nS/m 2; gS3G � 0.03nS/m 2; gG3S � 1.0 nS/m 2; Iapp � �1.2 pA/m 2). d, Network activity in various patterns, featuring STN cells during episodic spiking, episodic wave,continuous wave, and sparse irregular spiking (gG3G � 0.23 nS/m 2; gS3G � 0.03 nS/m 2; gG3S � 1.0 nS/m 2; Iapp � �1.2 pA/m 2). The GPe cellsexhibit voltage patterns very similar to the STN cells.
2972 J. Neurosci., April 1, 2002, 22(7):2963–2976 Terman et al. • Subthalamopallidal Activity Patterns

This network does not exhibit clustered patterns. Moreover,the existence of waves here depends on a rather large GPe3GPesynaptic footprint. If each GPe neuron sends inhibition only to itsimmediate neighbors, then activity becomes distributed through-out the populations rather than localized in the form of waves.
Propagating wavesTo understand the neuronal mechanism underlying propagatingwave activity, we first consider a simple network with each neu-ronal population represented by a one-dimensional array, indexedfrom left to right by i � . . . , �2, �1, 0, 1, 2, 3, . . . Each GPe cellGi sends inhibition to one STN cell Si, as well as every GPe cell,and each STN cell Si sends off-centered excitation to the two GPecells Gi�1 and Gi�1. We assume that a wave has been generatedand is propagating to the right, and we suppose that at some time,say t � 0, the GPe cell G0 starts to burst. We shall describe howthe activity continues to propagate to the right in a lurchingmanner.
As G0 fires, it inhibits the STN cell S0 and deinactivates the Tcurrent in S0. When S0 escapes or becomes released from inhibi-tion, it fires a volley of spikes, in turn exciting the GPe cells G�1
and G1. At this point G1 is more excitable than G�1, because G�1
had recently fired and is still in a partially refractory state. Hence,G1 will tend to fire in response to S0 before G�1 does. Once G1
fires, it sends inhibition to all the other GPe cells. In particular, thisinhibition will prevent G�1 from firing. Furthermore, when G1
fires, it inhibits the STN cell S1 ; thus the entire process repeats,except it is now shifted over by one STN and one GPe cell.
We have explored numerous related architectures and havefound that the existence of propagating waves is a very robustactivity pattern. Waves can exist if the STN3GPe connectivityfootprint is broader than the GPe3STN footprint, and also inthe reverse situation; in addition, both on-centered and off-centered footprints can support propagating waves. The mecha-nism underlying wave activity in various different network archi-tectures is essentially the same as described above. Typically, agroup of STN cells fires synchronously because of postinhibitoryrebound, and this causes excitation to be sent to a correspondinggroup of GPe cells. The GPe cells just ahead of the leading edgeof the wave will be the first cells to fire in response, because othernearby GPe cells have just fired and hence are in a refractorymode. This firing will inhibit the other GPe cells that had re-ceived excitatory input, suppressing their activity; at the sametime, it will inhibit a group of STN cells. This group of STNneurons will eventually fire when they are able to escape, orbecome released from, the inhibitory influence from GPe. Theprocess then continues as before.
We note that to generate a wave, it is important that the GPecells at the leading edge of the wave are able to inhibit those GPecells behind them. It is therefore necessary to have gG3G suffi-ciently large. Decreasing gG3G often transforms wave activity toclustering or rapid spiking (either episodic or continuous). Forsolitary waves to arise, the GPe3GPe footprint should also belarger than the STN3GPe footprint; otherwise, activity spreadsquite rapidly throughout the network and full-population spikingbehavior or spatially periodic waves (data not shown) typicallyresult.
The speed with which the waves propagate is dependent on thesize of the STN3GPe and GPe3STN connectivity footprints.Other synaptic parameters, such as gS3G, also play a role indetermining wave speed. Moreover, the average active (and si-lent) phase duration of STN neurons is directly correlated with
the length of time it takes the wave to travel from one end of thearray to the other, and hence inversely correlated with the speed.We observed that at fixed levels of gS3G, stronger intra-GPeinhibition produces slower waves; whereas at fixed levels of gG3G,varying gS3G has two competing influences on wave speed,caused by different mechanisms coming into play for the releaseor escape from inhibition of inactive STN cells.
Irregular and uncorrelated activityThese computational studies suggest that there are severalsources leading to irregular and uncorrelated activity patterns inthe STN–GPe network. An unstructured and sparsely connectedtopography is one possible source; however, certain choices of thesynaptic parameters and applied currents also promote irregularbehavior regardless of network architecture. For example, weobserved that if gG3G is sufficiently large and Iapp is above (i.e.,less negative than) some fixed hyperpolarizing level, then thenetwork activity is irregular. The implications will be discussed inthe next section. Here we describe both the topographic and theinput-related neuronal mechanisms underlying irregular uncor-related behavior.
We saw earlier (Figs. 5, 7) that a structured architecture isrequired for the generation of both clustered and propagatingwave solutions. In a clustered solution, the network organizesitself so that each STN cell in an inactive cluster receives approx-imately the same degree of inhibitory input. For a wave to bepropagated, the active STN and GPe cells must have structuredfootprints to spread activity to cells ahead of the leading edge.These patterns are not possible in a randomly connected network.In such a topography, the firing of a small number of cells tendsto spread activity (which may be either episodic or continuous)efficiently throughout the network. Once one STN cell fires, itspreads inhibition to other STN cells via connections with theGPe cells, thus delaying or possibly preventing activity of otherSTN cells. Hence, one expects at most a loose synchronizationbetween the firing of STN cells.
We next discuss why weakening striatal inhibition of the GPe(represented here as the magnitude of Iapp) promotes irregularbehavior, especially if gG3G is sufficiently large. Recall thatmaking Iapp less negative allows the GPe cells to fire tonically(Fig. 2a). This leads to tonic inhibitory input to the STN. If thisinput is sufficiently strong, then it will completely suppress STNactivity. For moderate levels of tonic inhibition, the STN cellsmay still be able to fire action potentials caused by deinactivationof IT; however, in the tonic firing regime, the GPe neurons are lesssensitive to excitation from STN. This means that, for bothmoderate and strong levels of striatal inhibition, excitation fromthe STN is too weak to organize the GPe population into distinctclusters or propagating waves. In this case, strong intra-GPeinhibition may further desynchronize oscillations by delaying,weakening, or suppressing the firing of some GPe cells immedi-ately after other GPe cells fire. This type of network behavior isconsistent with that reported in related excitatory–inhibitory net-works (Hansel and Mato, 2001).
DISCUSSIONThe subthalamic nucleus and the globus pallidus are heavilyinterconnected and should have a strong tendency to entrain eachother. Given that neurons in both areas have membrane proper-ties that predispose them to rhythmic firing, it is somewhatsurprising that they are not engaged in rhythmic firing all thetime. All available evidence, however, indicates that these struc-
Terman et al. • Subthalamopallidal Activity Patterns J. Neurosci., April 1, 2002, 22(7):2963–2976 2973

tures do not generate correlated spontaneous rhythmic activity(or even show internally correlated firing) under physiologicalconditions encountered in extracellular recording experiments(Nini et al., 1995; Magill et al., 2000; Raz et al., 2000; Urbain etal., 2000).
After experimental dopamine depletion, and in patients withParkinson’s disease, strongly correlated rhythmic activity can beobserved in both the subthalamic nucleus and in the globuspallidus external segment (Bergman et al., 1994; Nini et al., 1995;Magnin et al., 2000; Raz et al., 2000; Brown et al., 2001). Thesubthalamic nucleus is required for the oscillations in the globuspallidus, as STN lesions abolish pallidal burst firing (Ni et al.,2000); similarly, compromise of GPe interferes with parkinsonianactivity of STN (Chesselet and Delfs, 1996; Hassani et al., 1996).Plenz and Kitai (1999) have shown that in organotypic cultures,correlated activity can arise in both structures and is caused bythe interaction between the STN and GPe rather than beingdriven by an external source. In that reduced preparation, pow-erful excitation from the rebound burst firing of STN neuronsproduced increased activity in the GPe population, which theninhibited the subthalamic cells and set them up for anotherrebound.
We have shown in a biophysical, conductance-based model thatthe cellular properties of STN and GPe cells can give rise to avariety of rhythmic or irregular self-sustained firing patterns,depending on both the arrangement of connections among andwithin the nuclei and the effective strengths of the connections.The model was based on a simplified representation of the prop-erties of STN and GPe neurons in slices and does not include allthe influences that may act in vivo. The dependence on networkarchitecture points out the importance of certain missing piecesof anatomical information. It is critical to know the spatial extentof the recurrent collateral connections among GPe neurons andwhether they are spatially organized or diffuse. Likewise, it is
important to determine the precision of the spatial organizationof GPe3STN and STN3GPe projections and whether the twonuclei project on each other in a reciprocal or out of registermanner. In one anatomical study, dense, precisely reciprocalconnections between the subthalamic nucleus and the globuspallidus was reported (Shink et al., 1996), but when individualaxons are stained, the connectivity pattern has appeared muchmore diffuse (Sato et al., 2000). In the absence of definitiveanatomical information, our model can be of some benefit bycomparing the expected activity patterns emerging from variouslikely connectivity architectures and by characterizing conditionsunder which the network may exhibit either synchronous orasynchronous oscillations.
An emerging body of evidence suggests that even in the patho-logical states caused by dopamine denervation, global synchro-nous oscillatory activity is not common. A key finding of thestudies of synchronous oscillations in 1-methyl-4-phenyl-1,2,3,6-tetrahydropyridine (MPTP)-treated monkeys was the wide rangeof phase relationships among neurons in the globus pallidus,indicating that not all the cells oscillate synchronously (Raz et al.,2000). This is in contrast with the synchronous episodes seen inour random, sparsely connected network. We note that this ar-chitecture lacks the structure required to support spatially orga-nized activity, which could produce stable phase shifts amongneurons. The rest tremor in Parkinson’s disease also shows avariety of phases in different parts of the body, suggesting that itis not driven by a single oscillator (Hurtado et al., 2000; Ben-Pazet al., 2001). In the reduced preparation described by Plenz andKitai (1999), some STN–GPe pairs of cells showed in-phase slowoscillations, whereas others bursted out of phase. These resultssuggest that different parts of the STN–GPe system may oscillateseparately from others. In this case, one possibility is that therhythm-generating mechanisms that we have elucidated in ourmodel network could be played out among multiple oscillatorysubnetworks. In the model network, the structured architecturescould produce spatial clustering and waves, which are consistentwith the range of phase relations of cellular activity seen inexperimental dopamine depletion studies. The network also pro-duced the slow oscillations observed by Plenz and Kitai (1999) inculture. Our results suggest that the absence of rhythmic activityat tremor frequency in their preparation may occur because theSTN–GPe network in their experiment lacks the structured ar-chitecture (Fig. 5a) needed for the generation of a clusteredrhythm. The dynamic clustering rhythms seen in our network arealso reminiscent of behavior reported in several experimentalstudies. Hurtado et al. (1999) recorded neuronal activity fromawake Parkinson’s disease patients undergoing stereotaxic pal-lidotomy. They found that some paired recording sites within GPishowed periods of transient synchronization. Dynamic synchro-nization of pallidal activity in MPTP-treated monkeys was alsoreported by Bergman et al. (1998).
Roles of inhibition and the function ofthe indirect pathwayAccording to recent studies, correlated oscillatory activity in theGPe and STN neurons is closely related to the generation of thesymptoms of Parkinsonism. The origin of the oscillatory activityor the correlations among the neurons is not obvious, because thesame neurons do not show strong correlations in untreated ani-mals (Raz et al., 2000). The firing rate model holds that duringParkinsonian states, an increased level of inhibition from thestriatum to GPe causes a decrease in the activity of GPe. This in
Figure 8. Schematic diagram of the indirect pathway connections in thebasal ganglia in normal (lef t column) and parkinsonian (right column)states. Minus symbols denote inhibitory connections; plus symbols denoteexcitatory ones. In the parkinsonian regime, the combination of weakenedintra-GPe connections and strengthened striatal input set the stage forsynchronous GPe-STN oscillations and correlated rhythmic STN output.
2974 J. Neurosci., April 1, 2002, 22(7):2963–2976 Terman et al. • Subthalamopallidal Activity Patterns

turn would send less inhibition to STN, thus increasing STNactivity and ultimately leading to increased inhibitory outputfrom the basal ganglia to the thalamus (DeLong, 1990; Wichmannand DeLong, 1996; Obeso et al., 1997). In our model network, amore complex picture emerges, in which the STN and GPe arespontaneously oscillatory and synchronous, whereas intra-GPeinhibition and an appropriate level of input from the striatum canact to suppress rhythmic behavior. Note that inhibition playsmultiple roles in the generation of each of the activity patterns weobserved. In the clustered rhythm, for example, active STN neu-rons need moderate levels of feedback inhibition from the GPe tosynchronize among themselves. Silent STN neurons, on the otherhand, are prevented from firing because they receive more pow-erful tonic inhibition. For the generation of propagating waves,intra-GPe inhibition is needed to prevent activity from persistingin the wake of the wave. Hence, this inhibition helps to organizethe network into a structured activity pattern. If one increases theintra-GPe inhibition, this can desynchronize the GPe oscillations,and irregular firing may result. The role of striatal inhibition isthe most pivotal in generating or suppressing the organizedoscillatory activity, because it simultaneously controls the inhib-itory feedback to the STN through the GPe cells and influencesthe intra-GPe inhibition, which controls spatial patterning ofactivity in the network.
Some papers have questioned the role of the so-called indirectpathway (Parent and Hazrati, 1995; Levy et al., 1997; Parent andCicchetti, 1998). These arguments point to experiments demon-strating that GPe activity does not decrease substantially in aParkinsonian state, as well as results indicating that the overalllevel of GABAA received by GPe cells (from both striatal andintrinsic sources) may hold steady or even decrease. The analysisand simulations given in this paper suggest that to account for thenew experiments, one does not need to diminish the role ofthe indirect pathway. Instead, our analysis demonstrates that thediverse contributions of inhibition to indirect pathway firing pat-terns can shift the network between rhythmic and irregularmodes of firing. In Figure 8, we suggest an alternative interpre-tation of the roles of inhibition and excitation in allowing theindirect pathway to generate tremor-like activity. In the normalstate, there is strong GABAA synaptic inhibition among GPeneurons, making their output to the STN asynchronous, andeffectively weakening the synaptic interactions between GPe andSTN. After dopaminergic denervation, an increased level of in-hibition from the striatum to GPe is combined with the releaseof enkephalin and dynorphin, which acts presynaptically toweaken the collateral connections among GPe cells (Stanford andCooper, 1999; Ogura and Kita, 2000). From our results, this couldstrengthen and synchronize the interactions between STN andGPe and shift the network into an oscillatory mode.
REFERENCESAlbin RL, Young AB, Penney JB (1989) The functional anatomy of
basal ganglia disorders. Trends Neurosci 12:366–375.Baranauskas G, Thatch T, Surmeier DJ (1999) Delayed rectifier currents
in rat globus pallidus neurons are attributable to Kv2.1 and Kv3.1/3.2K(�) channels. J Neurosci 19:6394–6404.
Ben-Paz H, Bergman H, Goldberg JA, Giladi N, Hansel D, Reches A,Simon ES (2001) Synchrony of rest tremor in multiple limbs in par-kinson’s disease: evidence for multiple oscillators. J Neural Transm108:287–296.
Bergman H, Wichmann T, Karmon B, DeLong MR (1994) The primatesubthalamic nucleus. II. Neuronal activity in the MPTP model ofparkinsonism. J Neurophysiol 72:507–520.
Bergman H, Raz A, Feingold A, Nini A, Nelken I, Hansel D, Ben-Paz H,Reches A (1998) Physiology of MPTP tremor. Mov Disord 13:29–34.
Beurrier C, Bioulac B, Hammond C (2000) Slowly inactivating sodium
current (I(NaP)) underlies single-spike activity in rat subthalamic neu-rons. J Neurophysiol 83:1951–1957.
Bevan MD, Wilson CJ (1999) Mechanisms underlying spontaneous os-cillation and rhythmic firing in rat subthalamic neurons. J Neurosci19:7617–7628.
Bevan MD, Wilson CJ, Bolam JP, Magill PJ (2000) Equilibrium poten-tial of GABAA current and implications for rebound burst firing in ratsubthalamic neurons in vitro. J Neurophysiol 83:3169–3172.
Bevan MD, Magill PJ, Hallorth NE, Bolam JP, Wilson CJ (2001) Reg-ulation of the timing and pattern of action potential generation in ratsubthalamic neurons in vitro by GABAA IPSPs. J Neurophysiol, inpress.
Brown P, Oliviero A, Mazzone P, Insola A, Tonali P, Di Lazzaro V(2001) Dopamine dependency of oscillations between subthalamic nu-cleus and pallidum in Parkinson’s disease. J Neurosci 21:1033–1038.
Chesselet MF, Delfs JM (1996) Basal ganglia and movement disorders:an update. Trends Neurosci 18:417–422.
Cooper AJ, Stanford IM (2000) Physiological and morphological char-acteristics of three types of rat globus pallidus neurone in vitro.J Physiol (Lond) 527:291–3004.
DeLong MR (1971) Activity of pallidal neurons during movement.J Neurophysiol 34:414–427.
DeLong MR (1990) Primate models of movement disorders of basalganglia origin. Trends Neurosci 13:281–285.
Hansel D, Mato G (2001) Existence and stability of persistent states inlarge neuronal networks. Phys Rev Lett 86:4175–4178.
Hanson JE, Jaeger D (2002) Short-term plasticity shapes the response tosimulated normal and Parkinsonian input patterns in the globus palli-dus. J Neurosci, in press.
Hassani OK, Mouroux M, Feger J (1996) Increased subthalamic neuro-nal activity after nigral dopamine lesion independent of disinhibitionvia the globus pallidus. Neuroscience 72:105–115.
Hazrati LN, Parent A (1992) Convergence of subthalamic and striatalefferents at pallidal level in primates: an anterograde double-labelingstudy with biocytin and PHA-L. Brain Res 569:336–340.
Hernandez-Pineda R, Chow A, Amarillo Y, Moreno H, Saganich M, deMiera EV, Hernandez-Cruz A, Rudy B (1999) Kv3.1-Kv3.2 channelsunderlie a high-voltage-activating component of the delayed rectifierK� current in projecting neurons from the globus pallidus. J Neuro-physiol 82:1512–1528.
Hurtado JM, Gray CM, Tamas LB, Sigvardt KA (1999) Dynamics oftremor-related oscillations in the human globus pallidus: a single casestudy. Proc Natl Acad Sci USA 96:1674–1679.
Hurtado JM, Lachaux JP, Beckley DJ, Gray CM, Sigvardt KA (2000)Inter- and intralimb oscillator coupling in parkinsonian tremor. MovDisord 15:683–691.
Kita H, Kitai ST (1991) Intracellular study of rat globus pallidus neu-rons: membrane properties and responses to neostriatal, subthalamicand nigral stimulation. Brain Res 564:296–305.
Kitai ST, Kita H (1987) Anatomy and physiology of the subthalamicnucleus: a driving force of the basal ganglia. In: The basal ganglia II:structure and function; current concepts (Carpenter MB, Jayaraman A,eds), pp. 357–373. New York: Plenum.
Levy R, Hazrati L-N, Herrero M-T, Vila M, Hassani O-K, Mouroux M,Ruberg M, Asensi H, Agid Y, Feger J, Obeso JA, Parent A, Hirsch EC(1997) Re-evaluation of the functional anatomy of the basal ganglia innormal and parkinsonian states. Neuroscience 76:335–343.
Magill PJ, Bolam JP, Bevan MD (2000) Relationship of activity in thesubthalamic nucleus-globus pallidus network to cortical electroenceph-alogram. J Neurosci 20:820–833.
Magnin M, Morel A, Jeanmonod D (2000) Single-unit analysis of thepallidum, thalamus, and subthalamic nucleus in parkinsonian patients.Neuroscience 96:549–564.
Nambu A, Llinas R (1994) Electrophysiology of globus pallidus neuronsin vitro. J Neurophysiol 72:1127–1139.
Ni Z, Bouali-Benazzouz R, Gao D, Benabid A, Benazzouz A (2000)Changes in the firing pattern of globus pallidus neurons after thedegeneration of nigrostriatal pathway are mediated by the subthalamicnucleus in rat. Eur J Neurosci 12:4338–4344.
Nini A, Feingold A, Slovin H, Bergman H (1995) Neurons in the globuspallidus do not show correlated activity in the normal monkey, butphase-locked oscillations appear in the MPTP model of parkinsonism.J Neurophysiol 74:1800–1805.
Obeso J, Rodriguez M, DeLong MR (1997) Basal ganglia pathophysiol-ogy: a critical review. Adv Neurol 74:3–18.
Ogura M, Kita H (2000) Dynorphin exerts both postsynaptic and pre-synaptic effects in the globus pallidus of the rat. J Neurophysiol83:3366–3376.
Parent A, Cicchetti F (1998) The current model of basal ganglia orga-nization under scrutiny. Mov Disord 13:199–202.
Parent A, Hazrati L-N (1995) Functional anatomy of the basal ganglia.II. The place of subthalamic nucleus and external pallidum in basalganglia circuitry. Brain Res Rev 20:128–154.
Plenz D, Kitai S (1999) A basal ganglia pacemaker formed by the sub-thalamic nucleus and external globus pallidus. Nature 400:677–682.
Terman et al. • Subthalamopallidal Activity Patterns J. Neurosci., April 1, 2002, 22(7):2963–2976 2975
Raz A, Feingold A, Zelanskaya V, Vaadia E, Bergman H (1996) Neu-ronal synchronization of tonically active neurons in the striatum ofnormal and parkinsonian primates. J Neurophysiol 76:2083–288.
Raz A, Vaadia E, Bergman H (2000) Firing patterns and correlations ofspontaneous discharge of pallidal neurons in the normal and tremulous1-methyl-4-phenyl-1,2,3,6 tetrahydropyridine vervet model of parkin-sonism. J Neurosci 20:8559–8571.
Rush ME, Rinzel J (1995) The potassium A-current, low firing rates andrebound excitation in Hodgkin–Huxley models. Bull Math Biol57:899–929.
Sato F, Parent M, Levesque M, Parent A (2000) Axonal branchingpattern of neurons of the subthalamic nucleus in primates. J CompNeurol 424:142–152.
Shink E, Bevan MD, Bolam JP, Smith Y (1996) The subthalamic nucleusand the external pallidum: two tightly interconnected structures thatcontrol the output of the basal ganglia in the monkey. Neuroscience73:335–357.
Song WJ, Baba Y, Otsuka T, Murakami F (2000) Characterization ofCa 2� channels in rat subthalamic neurons. J Neurophysiol 84:2630–2637.
Stanford IM, Cooper AJ (1999) Presynaptic and opioid receptor mod-ulation of GABAA IPSCs in the rat globus pallidus in vitro. J Neurosci19:4796–4803.
Stefani A, Spadoni F, Bernardi G (1998) Group I mGluRs modulatecalcium currents in rat GP: functional implications. Synapse30:424–432.
Surmeier DJ, Seno N, Kitai ST (1994) Acutely isolated neurons of therat globus pallidus exhibit four types of high-voltage activated Ca 2�
current. J Neurophysiol 71:1272–1280.Urbain N, Gervasoni D, Souliere F, Lobo L, Rentero N, Windels F,
Astier B, Savasta M, Fort P, Renaud B, Luppi P, Chouvet G (2000)Unrelated course of subthalamic nucleus and globus pallidus neuronalactivities across vigilance states in the rat. Eur J Neurosci 12:3361–3374.
Wichmann T, DeLong MR (1996) Functional and pathophysiologicalmodels of the basal ganglia. Curr Opin Neurobiol 6:751–758.
2976 J. Neurosci., April 1, 2002, 22(7):2963–2976 Terman et al. • Subthalamopallidal Activity Patterns