activity seascapes highlight central place foraging
TRANSCRIPT
RESEARCH Open Access
Activity seascapes highlight central placeforaging strategies in marine predators thatnever stop swimmingYannis P. Papastamatiou1, Yuuki Y. Watanabe2,3, Urška Demšar4* , Vianey Leos-Barajas5, Darcy Bradley6,Roland Langrock7, Kevin Weng8, Christopher G. Lowe9, Alan M. Friedlander10,11 and Jennifer E. Caselle12
Abstract
Background: Central place foragers (CPF) rest within a central place, and theory predicts that distance of patches fromthis central place sets the outer limits of the foraging arena. Many marine ectothermic predators behave like CPFanimals, but never stop swimming, suggesting that predators will incur ‘travelling’ costs while resting. Currently, it isunknown how these CPF predators behave or how modulation of behavior contributes to daily energy budgets. Wecombine acoustic telemetry, multi-sensor loggers, and hidden Markov models (HMMs) to generate ‘activity seascapes’,which combine space use with patterns of activity, for reef sharks (blacktip reef and grey reef sharks) at an unfishedPacific atoll.
Results: Sharks of both species occupied a central place during the day within deeper, cooler water where they wereless active, and became more active over a larger area at night in shallower water. However, video cameras on twogrey reef sharks revealed foraging attempts/success occurring throughout the day, and that multiple sharks wererefuging in common areas. A simple bioenergetics model for grey reef sharks predicted that diel changes in energyexpenditure are primarily driven by changes in swim speed and not body temperature.
Conclusions: We provide a new method for simultaneously visualizing diel space use and behavior in marinepredators, which does not require the simultaneous measure of both from each animal. We show that blacktip andgrey reef sharks behave as CPFs, with diel changes in activity, horizontal and vertical space use. However, aspects oftheir foraging behavior may differ from other predictions of traditional CPF models. In particular, for species that neverstop swimming, patch foraging times may be unrelated to patch travel distance.
Keywords: Sharks, Acceleration, Hidden Markov models, Coral reefs, Foraging, Telemetry
BackgroundCentral place foraging (CPF) is a ubiquitous behavior seenacross animal groups ranging from insects, to birds, andhumans [1]. Unlike random movements within a homerange, CPF behavior consists of periodic and predictablemovements to and from a central place, often with mul-tiple individuals sharing the central place [1]. CPF animalstend to rest at the central place, with their energy costs in-creasing as they travel greater distances from this location[1, 2]. As such, the costs associated with travel distance to
the patch should define the limits of the animals foragingrange from the central place [2, 3]. CPF behavior can leadto heterogeneity in habitat or prey distribution as the ani-mal’s foraging rates will likely vary with distance from thecentral place [4, 5]. As patch distance to the central placeincreases, travel costs also increase, and the animal shouldspend more time foraging at the patch [1, 4].A key assumption of CPF theory is that an animal
rests at the central place, and foraging costs increasewith travel distance to a feeding patch. Yet, there aremany species of marine predators that exhibit CPF-likebehavior, but never stop swimming, and never truly rest.For these animals, energy costs may be independent oftravel distance to the patch, and simply a function of
* Correspondence: [email protected] of Geography and Sustainable Development, University of StAndrews, St Andrews, Scotland, UKFull list of author information is available at the end of the article
© The Author(s). 2018 Open Access This article is distributed under the terms of the Creative Commons Attribution 4.0International License (http://creativecommons.org/licenses/by/4.0/), which permits unrestricted use, distribution, andreproduction in any medium, provided you give appropriate credit to the original author(s) and the source, provide a link tothe Creative Commons license, and indicate if changes were made. The Creative Commons Public Domain Dedication waiver(http://creativecommons.org/publicdomain/zero/1.0/) applies to the data made available in this article, unless otherwise stated.
Papastamatiou et al. Movement Ecology (2018) 6:9 https://doi.org/10.1186/s40462-018-0127-3

swim speeds. Such predators include large coralreef-associated fishes (sharks and teleosts), which swimwithin a relatively small core area during the day,and move over an expanded area at night, with period-icity of movements related to diel or tidal cycles [6–9].Marine animals also move in a three-dimensional (3D)environment and CPF behavior can include a verticalcomponent as well as a horizontal one, with individualsperforming diel vertical migrations (DVM) relative tothe central place [10–12]. While few studies have mea-sured actual activity and swim speeds, some tropical reefsharks display patterns of activity that also vary with dieland tidal cycles [13–17]. However, why predators thatdo not use a shelter or ever stop swimming require acentral place, is unclear.CPF animals that never stop swimming are almost ex-
clusively ectotherms, so metabolic rates are sensitive tochanges in ambient temperature. At any particular time,routine metabolic rates should be a function of bodytemperature, movement speed, and other aspects of themovement process (e.g. turning costs more than straightline swimming [18]). While the animal may not stopswimming, they can establish the central place in coolerwaters where metabolic rates are reduced. If the animalsimultaneously maintains low activity in the centralplace while cooler, then energy costs may be essentiallysimilar to ‘resting’ [10]. In addition to changes in bodytemperature, routine metabolic rates can be modulatedvia changes in swim speed. Hence, the energetics of CPFin these animals must consider body temperature andmovement rates.Accelerometers have become popular for measuring
both the activity and energy requirements offree-ranging marine animals [14, 19–21]. Accelerometerdata can be combined with information about the geo-graphic location of the animal to generate a spatial rep-resentation of the animal’s energy costs [19–21].However, it is difficult to separate areas of high-energyexpenditure (e.g. traversing through an energetically ex-pensive habitat) from areas of high animal activity re-lated to specific behaviors (e.g. foraging) within thelandscape, especially for animals whose behaviors cannotbe easily defined from sensor measurements (e.g. con-tinuously swimming fish). For our general case of CPFforagers, we are interested in how the predator’s foragingactivity varies spatially in relation to the central place.This challenge is further complicated in fishes becausespace use and activity are often measured at differenttemporal scales, due to limitations of tagging technology.Movements can be recorded via telemetry over multipleyears, while fine-scale behaviors from accelerometers arerecorded over time-frames of days to weeks. The diel be-havior of CPF animals is likely to be predictable, suggest-ing that measurements made over shorter time periods
are representative of long-term behavior [14]. We tookadvantage of this predictability to develop a new spatialrepresentation of activity we term an ‘activity seascape’,for marine predators which show CPF behavior. The ac-tivity seascape combines long-term patterns of space usederived from acoustic telemetry data with the diel prob-ability of being more or less active, which is based onstatistical time-series models inferred from short deploy-ment accelerometers [22]. The seascapes allow the loca-tions/times where high activity may be strongest/weakest to be identified without requiring space use andactivity of individuals to be measured simultaneously.We use multi-sensor loggers and statistical time-series
models to build activity seascapes for two species of reefshark (blacktip reef sharks (Carcharhinus melanopterus),and grey reef sharks (C. amblyrhynchos)), whose move-ments appear similar to a CPF as they use smaller areasduring the day than at night [7–9, 12, 14, 23]. We alsoused these activity seascapes to better understand thedynamics of CPF in animals that never stop swimming.Specifically, we predict that sharks use a central placeduring the day while in deeper and cooler water wherethey decrease activity and reduce energy costs. We pre-dict they move over a larger area at night into shallowerwater, where they become more active. We then build asimple bioenergetics model for grey reef sharks to pre-dict the relative contribution of body temperature andswim speed to daily energy budget. We further predictthat grey reef sharks will maintain lower body tempera-tures within their central place as a tactic to reduce‘travel costs’ within their refuge.
MethodsStudy siteResearch was conducted at Palmyra Atoll (5°54’ N; 162°05’W), located in the central Pacific Ocean. Palmyra has beena U.S. federal wildlife refuge since 2001, with only a re-search station housing a small number of scientists andstaff. The atoll consists of two lagoons, surrounded bysandflats and backreefs, which transition to forereef habi-tats (see Additional file 1: Appendix S1). Due to its pro-tected status, large shark populations are found at the atoll[24]. Further details of the site can be found in [9, 14].
Patterns of activity
Data-loggers The first component of our study relatesto how shark activity varies throughout the diel and tidalcycles, and how it varies by depth and watertemperature. In order to quantify behavior, we tagged 5blacktip and 5 grey reef sharks with externaldata-loggers (ORI400-D3GT loggers, 12-mm diameter,45-mm length, and 9 g; Little Leonardo Co., Tokyo,Japan) in July 2013. Sensors measured 3D acceleration
Papastamatiou et al. Movement Ecology (2018) 6:9 Page 2 of 15
(sampled at 20 Hz), swimming depth, water temperature(1 Hz), and some animals were also fit with a speed sen-sor (1 Hz, three grey reef sharks) and video camera (oneblacktip, two grey reef sharks, Table 1). We usedDVL400 video cameras (recording duration 5–11 h) thatrecorded at 640 × 480 pixels at 30 frames/second. Thevideo cameras were programmed to turn on the dayafter the animal was released, to avoid the period ofstress associated with tagging. Cameras turned on at07:00–08:00 and recorded continuously until the batteryran out (5 h for the blacktip, 11 h each for the grey reefsharks, with the difference due to camera battery size).Loggers and cameras were embedded in copolymer foamfloats attached to the dorsal fin via tie wraps, and atime-release mechanism caused the package to detach3–5 days after deployment. Tags floated to the surfacewhere an embedded VHF transmitter enabled us to lo-cate and retrieve them.
Analysis of shark activity We filtered the static contri-bution of gravity from raw acceleration data, and thencalculated overall dynamic body acceleration (ODBA,[25]). ODBA was used as a measure of activity as it in-corporates tail beat frequency as well as activity alongother body axes. However, being time series data, ODBAvalues are highly correlated such that inferences basedon statistical models that do not take this key featureinto account will usually be invalid. Furthermore, theautocorrelation structure itself will provide interestingbehavioral information as the probability of the animalbeing active is likely to be a function of how active itwas previously. Understanding the biological importanceof changes in ODBA in animals that swim continuouslyis difficult as there is no true ‘resting’ period. We wereinterested in periods of increased activity, particularly‘bursts’ which could be indicative of foraging behavior.Hidden Markov models (HMMs) are stochastic time
series models where observed data (e.g. travel speed,depth, ODBA) are assumed to be driven by an under-lying hidden process. We assume that the hiddenprocess can be in either of N = 2 states, roughly corre-sponding to behavioral states, which we label ‘relativelyhigh activity’ and ‘relatively low activity’, respectively.
The observations can be considered noisy measurementsof the behavioral state, which cannot be explicitly ob-served [22, 26]. Traditionally, HMMs have inferred be-havioral states from the movement process itself (e.g.rate of movement, turning angles), but more recentlyhave been used with behavioral data and ODBA specific-ally [22]. We developed a 2-state HMM, where sharkswere in either a low state of activity (state 1) or highstate of activity (State 2), based on ODBA data from ac-celerometers. We could then compute probabilities ofsharks changing or remaining within behavioral statesbased on time of day, tidal state, or swimming depth andwater temperature. ODBA values were averaged over 1 sintervals before applying the HMMs, based on observa-tions of behaviors from video footage (see below). Weremoved the first 4 h of data from each animal so thatwe did not infer behavior when the animals may stillhave been highly stressed. All HMMs were built in thestatistical environment R using customized code. AllHMM details can be found in Additional file 2: Appen-dix S2.The HMMs provide a data-driven, objective approach
to analyzing acceleration data, but we still cannot iden-tify which specific behavior (e.g. feeding, predator avoid-ance) sharks perform while within the various states. Wehad the unique opportunity to correlate the results ofthe HMM with the simultaneously collected 22 h ofvideo obtained from two grey reef sharks. Video dataallowed us to see what the sharks were doing (and inwhich habitats) when inferred by the HMM to be in cer-tain states, providing validation for our interpretation ofthe model. We first observed all 22 h of video notingtimes of foraging, increased activity (both of the individ-ual shark and conspecifics) as well as the presence ofother sharks. For those specific time periods, we couldthen compare observations with the behavioral state pre-dicted by the HMM.We also analyzed swim speed data in grey reef sharks
as a direct measure of energy expenditure. To explorediel changes in swim speed, we constructed generalizedadditive models (GAMs) for each individual grey reefshark (N = 3) using hourly mean swim speed data. Speedwill still likely suffer from serial correlation, which we
Table 1 Details of sharks tagged with data-loggers or acoustic transmitters. BLT (blacktip reef shark), GR (grey reef shark), TL (TotalLength)
Tag Type BLT TL range (cm) Sex (M:F) GR TL range (cm) Sex (M:F)
1) Data-logger 4 113–127 0:4 4 149–159 0:4
Speed 2 113, 127 3 154–159
Video 1 127 2 154–158
2) Acoustic transmitters 20 105–133 0:20 43 107–168 13:30
Depth/temperature 9 105–126 13 107–168 4:9
Acceleration/depth 6 105–133 0
Papastamatiou et al. Movement Ecology (2018) 6:9 Page 3 of 15
accounted for by including an AR(1) (first-orderauto-regressive) process with time as the position vari-able. The correlation at lag = 1 was included in themodel to specify the correlation structure. The GAMwas constructed with a Gaussian error distribution andtime of day was modeled with a cyclic smooth spline.Model fit was assessed by examining residual diagnosticplots, and Akaike’s information criterion [27] (AIC) wasused to assess model performance against a null model(intercept only), with improved model fit indicated by aminimum ΔAIC value > 3 [28]. GAM analyses were con-ducted in R using the mgcv package.
Patterns of space use
Acoustic telemetry We quantified reef shark space usepatterns using acoustic telemetry methods. Between 2010and 2014, sharks were caught on hook and line and surgi-cally implanted with an acoustic transmitter (V16, 69 kHz,Vemco ltd, Nova Scotia). A small incision was made onthe ventral surface, the transmitter was inserted into thebody cavity and a single suture was used to close the inci-sion. The sharks were measured, sexed, externally darttagged and released. These individuals were not the samesharks as those tagged with data-loggers above, althoughthere was temporal overlap between periods of data col-lection (i.e. individuals were being tracked during thesame time when sharks were carrying loggers). We acous-tically tagged a total of 20 blacktip reef sharks, and 43 greyreef sharks. Of those, 9 blacktip reef sharks and 13 greyreef sharks were tagged with V16 PT transmitters that alsomeasured pressure (depth) and body temperature, and 6blacktip reef sharks were tagged with V13 AP transmittersthat measured 3D acceleration in addition to depth.Transmitters were detected by an array of up to 70 sub-surface omni-directional acoustic receivers (VR2W) de-ployed throughout the atoll [14]. Every time a shark swamwithin range of the receiver, the date/time of detection,along with swimming depth and body temperature (forthose individuals with PT tags) were recorded. We down-loaded receivers annually. Receiver detection range canvary by habitat and range tests of a subsample of receiversshowed an approximate range of 250 m on backreefs andclose to 500 m on forereef habitats. Note that blacktip reefshark acceleration, depth, and body temperatures were an-alyzed in [14].We calculated shark spatial utilization distributions
(UD) using a Brownian bridge movement model(BBMM), where consecutive acoustic detections betweenreceivers by moving sharks are linked by conditionalrandom walks [29, 30]. The BBMM also incorporatesmeasurement error (we set this to 300 m as the averagereceiver detection range) to provide a more realistic rep-resentation of the possible space used by the animal
[30]. CPF behavior will consist of periodic excursionsfrom the central place, and we were interested in thedistances sharks moved throughout the diel period fromthis core location. We calculated the central place foreach individual separately. For blacktip reef sharks, wedefined the central place as the 50% UD predicted bythe BBMM. However, grey reef sharks were detected onfar fewer receivers, making it difficult to calculate2-dimensional BBMMs. As such, for each individual wedefined the core area as the receiver where 80% of detec-tions were made, with a 1000 m buffer (assuming a de-tection range of 500 m on either side of forereefreceivers). For both species of shark, we then quantifiedthe distance of movement from this core area through-out the diel cycle. That is, for each individual we createda time series of distances to its own central place andthen in the last step we averaged these distances into atime series of average displacement for each shark spe-cies. Analyses were performed in R using the adehabitatLT and adehabitat HR packages.To explore diel patterns of vertical habitat use by grey
reef sharks, we constructed generalized additive mixedmodels (GAMMs) using hourly mean depth and bodytemperature data from the acoustic transmitters. Specif-ically, we estimated the effect of time of day on swim-ming depth and temperature, with individual sharkmodeled as a random effect. All other model compo-nents were the same as described above for swim speed.Diel changes in depth and temperature for blacktipswere reported in [14].
Patterns of space use and activity seascapes The ac-celeration data and HMMs provided probabilities ofsharks being in a relatively high active state throughoutthe diel cycle. We then combined these withthree-dimensional UDs calculated over months to yearsof movement from the telemetry data, to generate anoverall visual representation of the ‘activity seascape’ ofindividual animals within their environment. We usedthe telemetry data to produce space-time cubes (STC)where the bottom two dimensions represent the geo-graphic space over which the movement occurs and thethird dimension is time [29]. In a 2D kernel density UD,the surface representing this density is divided intosquare grid cells or pixels, the value of which representsthe probability of movement in that particular location.Analogously, in a 3D UD, the space-time volume is di-vided into so-called voxels, i.e. three-dimensional gridcubes, with each voxel assigned a probability of move-ment in that particular location in space and time. Ourthree-dimensional BBMM generalizations allow us touse time as part of the BBMM calculation, and showtime visually on the third axis of the space-time densityvolume [29]. We built 3D UDs for each shark by
Papastamatiou et al. Movement Ecology (2018) 6:9 Page 4 of 15
aggregating telemetry data by day. The space-time UDswere then combined with the diel activity probabilitiesfrom HMMs in order to visually emphasize areas in thespace-time UDs when sharks were the most active. Wedid this by multiplying each voxel in the space-time UDvolume with the probability at that particular moment intime of the shark being in an active state, as determinedby the HMMs. We removed any individuals from ana-lysis that had < 100 detections. The activity seascape al-gorithm is in the process of being published as Rpackage. In the mean time, a preliminary version of theR code will be placed to https://github.com/udemsarupon publication.
Bioenergetic modelTo predict the relative contribution of swimming speedand body temperature on daily energy budgets, we builta simple bioenergetics model for grey reef sharks. Wecalculated shark mass using W = 0.0045 L3.21 where L istotal length in cm and W is weight in kg (http://fishba-se.org). Routine metabolic rates (M) were then estimatedusing the equation for ectothermic sharks, Log10M =0.79*Log10W + 2.31 [31]. Metabolic rates were correctedfor changes in body temperature assuming a Q10 of 1.65and 3.0, to include the range of Q10 values seen withintropical sharks [32, 33]. To predict the effect of changingswim speed, we used the model developed for requiemsharks in [34]. Briefly, we assume that the average swim-ming speed for each animal represents its optimal travelspeed that minimizes its cost of transport. The percent-age increase or decrease in swim speeds from this aver-age leads to an equivalent change in metabolic rate (e.g.1% increase in speed = 1% increase in active metabolicrate [31]). We calculated hourly changes in routine
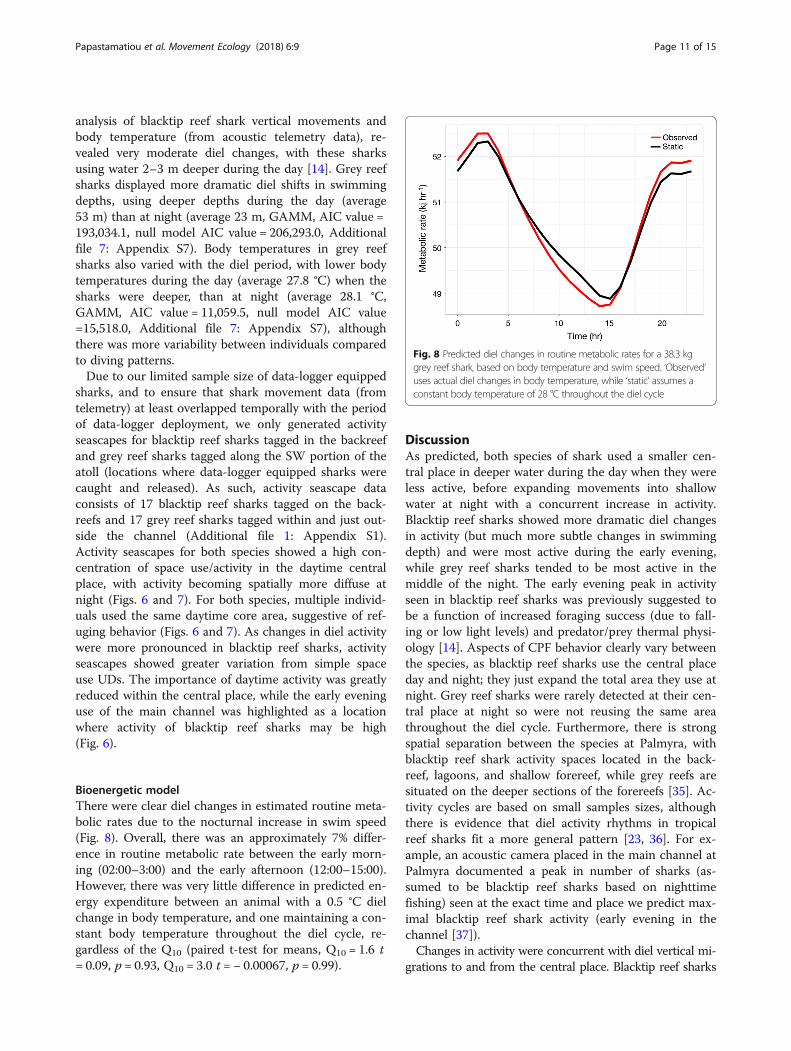
metabolic rate for a 38.3 kg (average grey reef sharkbody mass at Palmyra) individual using the observed dielchanges in body temperature, and then assuming theanimal maintained constant body temperature through-out the diel cycle (average 28.0 °C). Diel changes in swimspeed were inferred from the GAM results from theswim speed sensor data, described above. Model resultswere compared with a paired 2 sample t-test. Our goalwas not to estimate daily energy costs, but rather to de-termine if observed diel changes in body temperaturewere biologically relevant (at least regarding energycosts) and the relative contribution of shark swim speedto the daily energy budget.
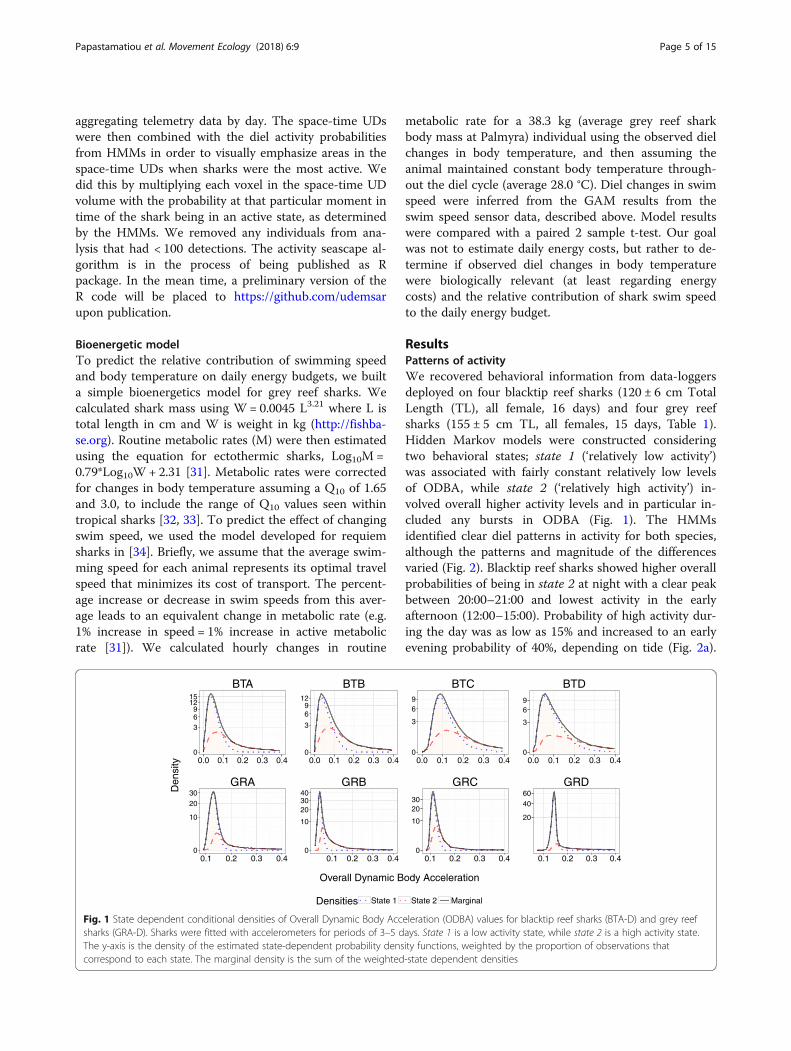
ResultsPatterns of activityWe recovered behavioral information from data-loggersdeployed on four blacktip reef sharks (120 ± 6 cm TotalLength (TL), all female, 16 days) and four grey reefsharks (155 ± 5 cm TL, all females, 15 days, Table 1).Hidden Markov models were constructed consideringtwo behavioral states; state 1 (‘relatively low activity’)was associated with fairly constant relatively low levelsof ODBA, while state 2 (‘relatively high activity’) in-volved overall higher activity levels and in particular in-cluded any bursts in ODBA (Fig. 1). The HMMsidentified clear diel patterns in activity for both species,although the patterns and magnitude of the differencesvaried (Fig. 2). Blacktip reef sharks showed higher overallprobabilities of being in state 2 at night with a clear peakbetween 20:00–21:00 and lowest activity in the earlyafternoon (12:00–15:00). Probability of high activity dur-ing the day was as low as 15% and increased to an earlyevening probability of 40%, depending on tide (Fig. 2a).
0
369
1215
0.0 0.1 0.2 0.3 0.4
BTA
0
3
69
12
0.0 0.1 0.2 0.3 0.4
BTB
0
10
2030
0.1 0.2 0.3 0.4
GRA
0
10
203040
0.1 0.2 0.3 0.4
GRB
0
3
69
0.0 0.1 0.2 0.3 0.4
BTC
0
3
69
0.0 0.1 0.2 0.3 0.4
BTD
0
10
2030
0.1 0.2 0.3 0.4
GRC
20
4060
0.1 0.2 0.3 0.4
GRD
Densities State 1 State 2 Marginal
Overall Dynamic Body Acceleration
Den
sity
Fig. 1 State dependent conditional densities of Overall Dynamic Body Acceleration (ODBA) values for blacktip reef sharks (BTA-D) and grey reefsharks (GRA-D). Sharks were fitted with accelerometers for periods of 3–5 days. State 1 is a low activity state, while state 2 is a high activity state.The y-axis is the density of the estimated state-dependent probability density functions, weighted by the proportion of observations thatcorrespond to each state. The marginal density is the sum of the weighted-state dependent densities
Papastamatiou et al. Movement Ecology (2018) 6:9 Page 5 of 15
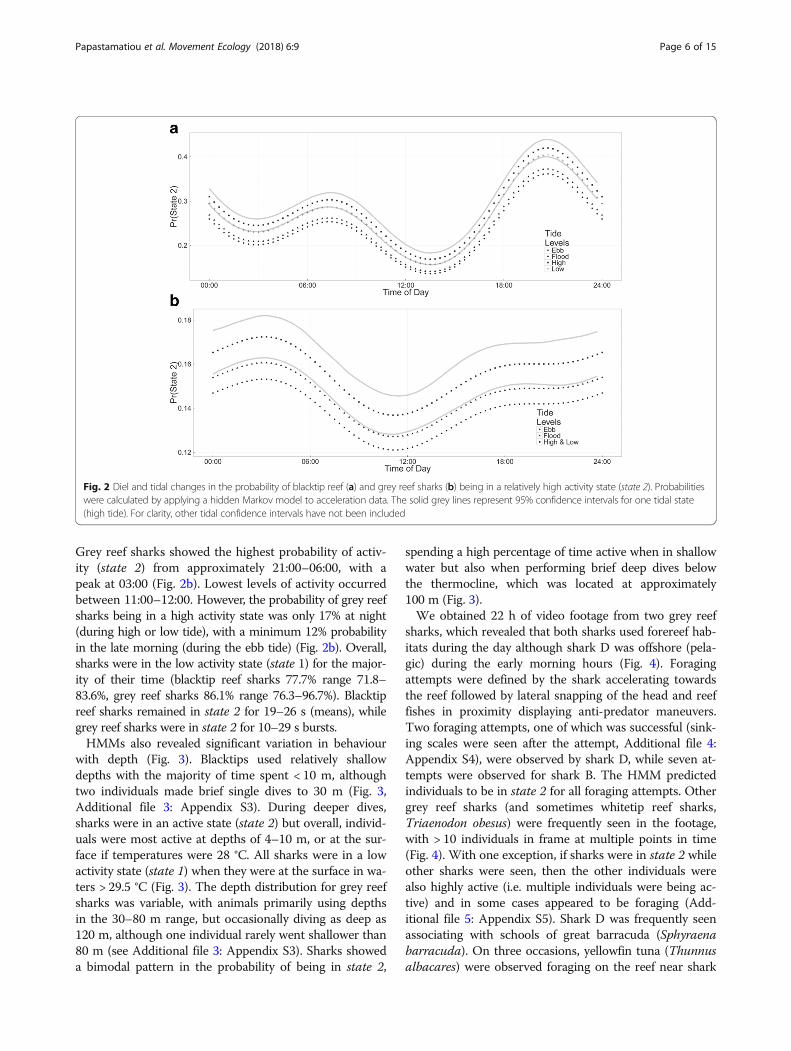
Grey reef sharks showed the highest probability of activ-ity (state 2) from approximately 21:00–06:00, with apeak at 03:00 (Fig. 2b). Lowest levels of activity occurredbetween 11:00–12:00. However, the probability of grey reefsharks being in a high activity state was only 17% at night(during high or low tide), with a minimum 12% probabilityin the late morning (during the ebb tide) (Fig. 2b). Overall,sharks were in the low activity state (state 1) for the major-ity of their time (blacktip reef sharks 77.7% range 71.8–83.6%, grey reef sharks 86.1% range 76.3–96.7%). Blacktipreef sharks remained in state 2 for 19–26 s (means), whilegrey reef sharks were in state 2 for 10–29 s bursts.HMMs also revealed significant variation in behaviour
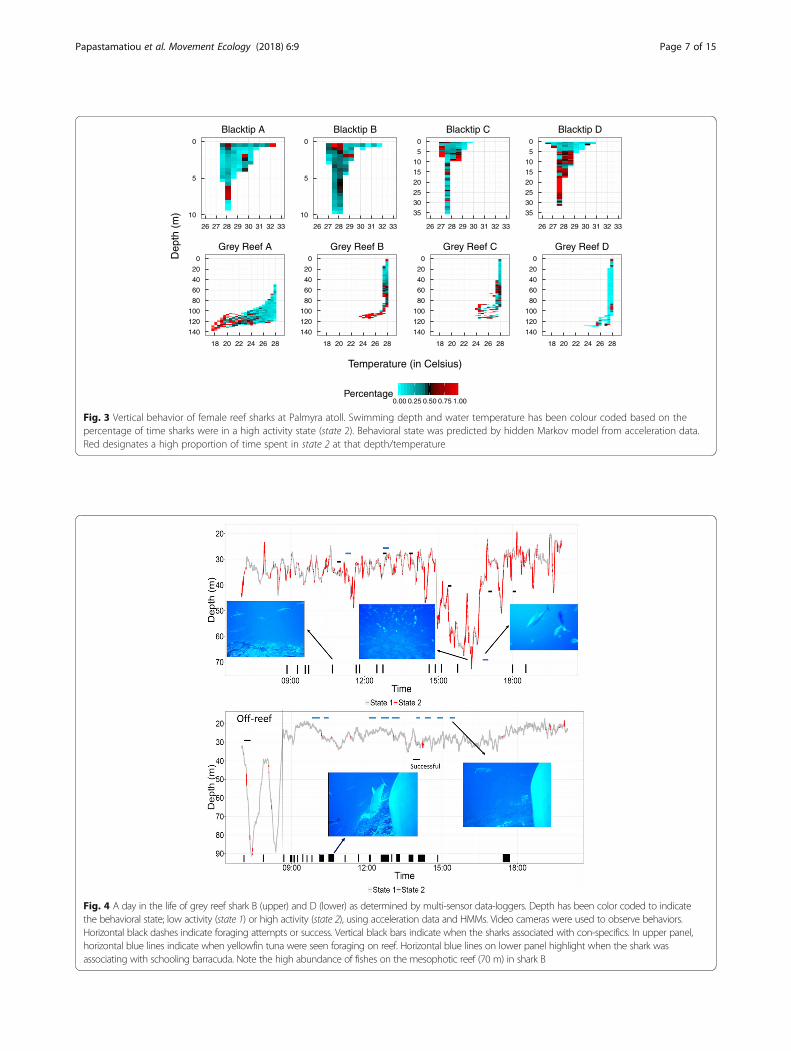
with depth (Fig. 3). Blacktips used relatively shallowdepths with the majority of time spent < 10 m, althoughtwo individuals made brief single dives to 30 m (Fig. 3,Additional file 3: Appendix S3). During deeper dives,sharks were in an active state (state 2) but overall, individ-uals were most active at depths of 4–10 m, or at the sur-face if temperatures were 28 °C. All sharks were in a lowactivity state (state 1) when they were at the surface in wa-ters > 29.5 °C (Fig. 3). The depth distribution for grey reefsharks was variable, with animals primarily using depthsin the 30–80 m range, but occasionally diving as deep as120 m, although one individual rarely went shallower than80 m (see Additional file 3: Appendix S3). Sharks showeda bimodal pattern in the probability of being in state 2,
spending a high percentage of time active when in shallowwater but also when performing brief deep dives belowthe thermocline, which was located at approximately100 m (Fig. 3).We obtained 22 h of video footage from two grey reef
sharks, which revealed that both sharks used forereef hab-itats during the day although shark D was offshore (pela-gic) during the early morning hours (Fig. 4). Foragingattempts were defined by the shark accelerating towardsthe reef followed by lateral snapping of the head and reeffishes in proximity displaying anti-predator maneuvers.Two foraging attempts, one of which was successful (sink-ing scales were seen after the attempt, Additional file 4:Appendix S4), were observed by shark D, while seven at-tempts were observed for shark B. The HMM predictedindividuals to be in state 2 for all foraging attempts. Othergrey reef sharks (and sometimes whitetip reef sharks,Triaenodon obesus) were frequently seen in the footage,with > 10 individuals in frame at multiple points in time(Fig. 4). With one exception, if sharks were in state 2 whileother sharks were seen, then the other individuals werealso highly active (i.e. multiple individuals were being ac-tive) and in some cases appeared to be foraging (Add-itional file 5: Appendix S5). Shark D was frequently seenassociating with schools of great barracuda (Sphyraenabarracuda). On three occasions, yellowfin tuna (Thunnusalbacares) were observed foraging on the reef near shark
Fig. 2 Diel and tidal changes in the probability of blacktip reef (a) and grey reef sharks (b) being in a relatively high activity state (state 2). Probabilitieswere calculated by applying a hidden Markov model to acceleration data. The solid grey lines represent 95% confidence intervals for one tidal state(high tide). For clarity, other tidal confidence intervals have not been included
Papastamatiou et al. Movement Ecology (2018) 6:9 Page 6 of 15
0
5
10
26 27 28 29 30 31 32 33
Blacktip A0
5
10
26 27 28 29 30 31 32 33
Blacktip B
0.00 0.25 0.50 0.75 1.00Percentage
0
5
10
15
20
25
30
35
26 27 28 29 30 31 32 33
Blacktip C0
5
10
15
20
25
30
35
26 27 28 29 30 31 32 33
Blacktip D
0
20
40
60
80
100
120
140
18 20 22 24 26 28
Grey Reef A0
20
40
60
80
100
120
140
18 20 22 24 26 28
Grey Reef B0
20
40
60
80
100
120
140
18 20 22 24 26 28
Grey Reef C0
20
40
60
80
100
120
140
18 20 22 24 26 28
Grey Reef D
Temperature (in Celsius)
Dep
th (
m)
Fig. 3 Vertical behavior of female reef sharks at Palmyra atoll. Swimming depth and water temperature has been colour coded based on thepercentage of time sharks were in a high activity state (state 2). Behavioral state was predicted by hidden Markov model from acceleration data.Red designates a high proportion of time spent in state 2 at that depth/temperature
Fig. 4 A day in the life of grey reef shark B (upper) and D (lower) as determined by multi-sensor data-loggers. Depth has been color coded to indicatethe behavioral state; low activity (state 1) or high activity (state 2), using acceleration data and HMMs. Video cameras were used to observe behaviors.Horizontal black dashes indicate foraging attempts or success. Vertical black bars indicate when the sharks associated with con-specifics. In upper panel,horizontal blue lines indicate when yellowfin tuna were seen foraging on reef. Horizontal blue lines on lower panel highlight when the shark wasassociating with schooling barracuda. Note the high abundance of fishes on the mesophotic reef (70 m) in shark B
Papastamatiou et al. Movement Ecology (2018) 6:9 Page 7 of 15

B (Fig. 4). Shark B used mesophotic reefs (> 50 m) withvery high reef fish abundance, including schooling plank-tivorous species.Grey reef sharks (154–159 cm TL) swam at average
speeds of 0.51–0.63 m/s with maximum speeds of3.6 m/s. Although the average speeds differed betweenthe three individuals, they all showed the same diel pat-tern with increased speeds at 02:00–03:00 and lowestspeeds from 12:00–18:00 (Additional file 6: AppendixS6). Average swim speeds increased by 5–10% duringthe night (GAM AIC values = − 13,561.7.27 (A), −10,896.4 (C), − 27,936.8 (D) compared to null modelsAIC values = − 8423.6 (A), − 7730.9 (C), − 16,824.0 (D),Additional file 5: Appendix S5).
Patterns of space use and activity seascapesWe acoustically tagged 20 female blacktip reef sharks (119± 7 cm TL) on the backreefs at Palmyra. Sharks were de-tected for an average of 392 ± 341 days (range 22–1108), al-though individuals detected for short durations were taggedwith transmitters with shorter battery lives (e.g. accelerationtransmitters). The majority of individuals (70%) showed evi-dence of limited diel movement patterns, using a core areaduring the day and moving over an expanded activity spaceat night (Figs. 5a and 6). However, the remaining 30% of in-dividuals appeared to use the same areas day and night.
Blacktip reef sharks had activity spaces of 1.9 ± 2.7 km2 andhad diel displacements from the core area of 0.73 ±0.63 km. We acoustically tagged and detected 43 grey reefsharks (30 F: 13 M, 143 ± 17 cm TL) for an average of1012 ± 429 days (range 5–1545 d) on the Palmyra forereefs.92.5% of individuals showed diel movement patterns, beingdetected on the forereefs during the day with far fewer de-tections at night, although we also captured the night timehabitat use of some individuals (Figs. 5c, d and 7). Grey reefsharks had activity spaces of 4.4 ± 1.3 km2 and showed dailydisplacement of 2.9 ± 1.3 km. We note that activity spaceand displacement estimates are only representative of reefshark movements within the receiver array and are there-fore likely underestimates of both. For both species, sharksshowed excursions from the central place that increased indistance between sunset and sunrise, although there werefar fewer detections at night (Fig. 5). The nighttime excur-sions were far more pronounced in grey reef sharks thanblacktip reef sharks, which only showed extended move-ments during the early evening when they were also pre-dicted to be most active (Fig. 5). Acoustic noise is alsolouder at night (e.g. snapping shrimp), which will likely re-duce the number of acoustic detections as well (K. Wengunpublished data).Shark vertical habitat use appeared to vary relative to
the diel cycle and the area of core use. Our previous
Fig. 5 Diel changes in average displacement from the central place by blacktip reef (a, n = 20) and grey reef sharks (c, n = 20). Grey and lightgreen backgrounds show night and day respectively. Probabilities of sharks being in state 2 (high activity) are shown as dark green lines (redrawnfrom Fig. 2). There were diel differences in number of detections (b, d) so daytime estimates of distance are based on larger sample sizes. Blacktipreef shark nocturnal displacements averaged 1 km, while grey reef sharks averaged 3 km from the central place
Papastamatiou et al. Movement Ecology (2018) 6:9 Page 8 of 15
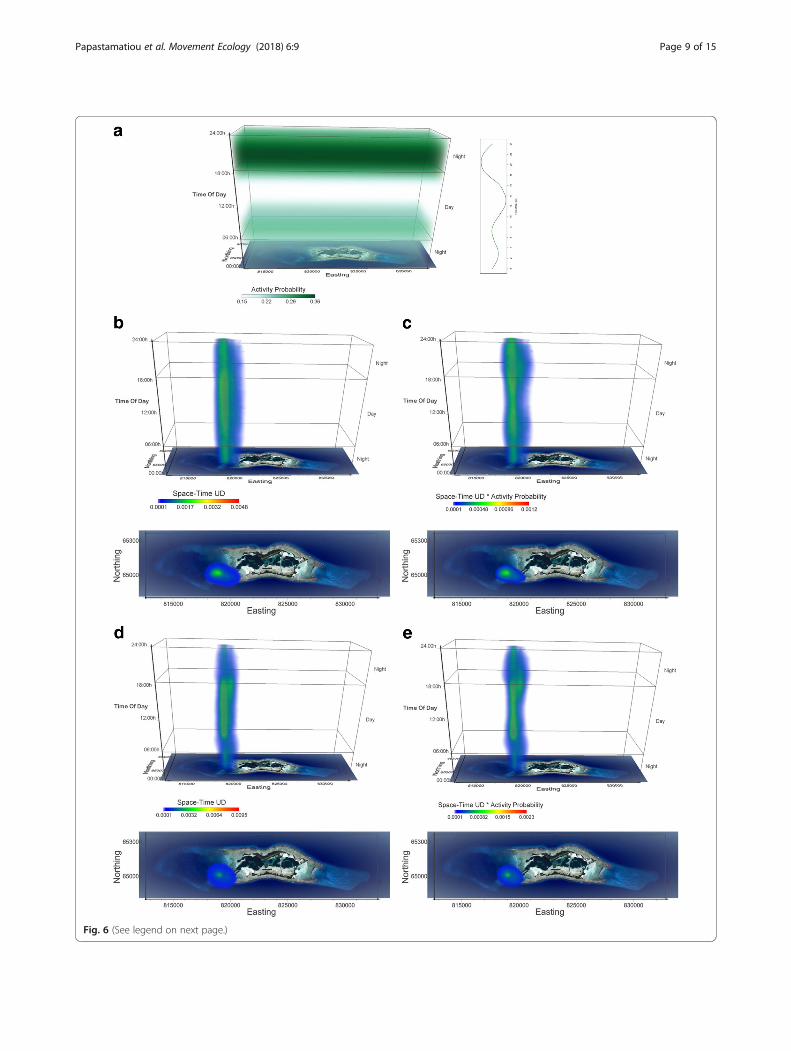
Fig. 6 (See legend on next page.)
Papastamatiou et al. Movement Ecology (2018) 6:9 Page 9 of 15
(See figure on previous page.)Fig. 6 Activity seascapes for blacktip reef sharks at Palmyra atoll. a The volume of probability of diel activity determined from accelerometers(see Fig. 2) shown in a space-time cube, where each voxel gets the value of respective probability based on the time in the voxel. Darker/lightergreen voxels in the probability volume correspond to higher/lower probability values in the chart. b Space-time density volume for blacktip reefsharks (n = 17). The bottom panel shows the projection of the volume onto the two geographic dimensions, i.e. the map of Palmyra atoll. Notethat this is a view from above the 3D UD volume and not a 2D UD surface. c Activity seascape for blacktip reef sharks (n = 17), where voxelvalues are obtained as a voxel-by-voxel product of volumes in a) and b). The bottom panel shows the projection of the volume onto the map ofPalmyra atoll. d Space-time density for an individual blacktip reef shark (duration = 1108 days) and e) activity seascape for the same blacktip reefshark. Note the similarity of the individual patterns with the respective patterns of the whole group in panels b) and c). Voxel size in allvolumetric representations is 100 m × 100 m × 10 min, creating a Space-Time volume of 202 × 56 × 144 voxels (20.2 km × 5.6 km × 24 h)
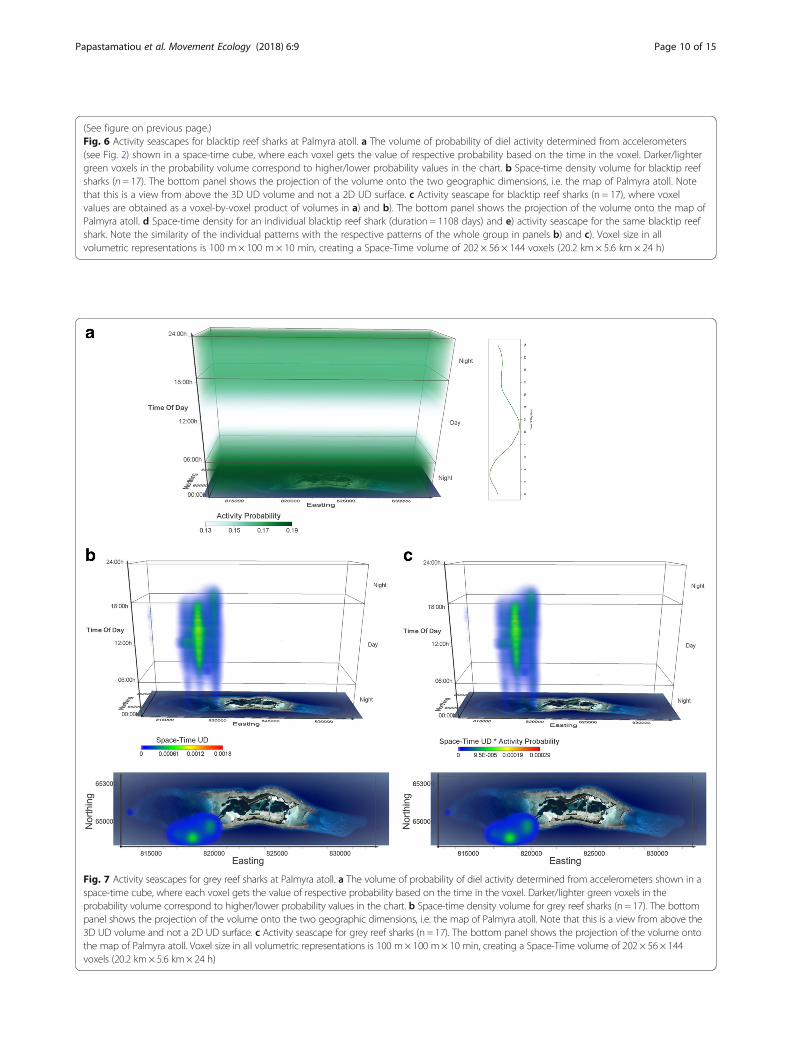
Fig. 7 Activity seascapes for grey reef sharks at Palmyra atoll. a The volume of probability of diel activity determined from accelerometers shown in aspace-time cube, where each voxel gets the value of respective probability based on the time in the voxel. Darker/lighter green voxels in theprobability volume correspond to higher/lower probability values in the chart. b Space-time density volume for grey reef sharks (n = 17). The bottompanel shows the projection of the volume onto the two geographic dimensions, i.e. the map of Palmyra atoll. Note that this is a view from above the3D UD volume and not a 2D UD surface. c Activity seascape for grey reef sharks (n = 17). The bottom panel shows the projection of the volume ontothe map of Palmyra atoll. Voxel size in all volumetric representations is 100 m× 100 m× 10 min, creating a Space-Time volume of 202 × 56 × 144voxels (20.2 km× 5.6 km× 24 h)
Papastamatiou et al. Movement Ecology (2018) 6:9 Page 10 of 15
analysis of blacktip reef shark vertical movements andbody temperature (from acoustic telemetry data), re-vealed very moderate diel changes, with these sharksusing water 2–3 m deeper during the day [14]. Grey reefsharks displayed more dramatic diel shifts in swimmingdepths, using deeper depths during the day (average53 m) than at night (average 23 m, GAMM, AIC value =193,034.1, null model AIC value = 206,293.0, Additionalfile 7: Appendix S7). Body temperatures in grey reefsharks also varied with the diel period, with lower bodytemperatures during the day (average 27.8 °C) when thesharks were deeper, than at night (average 28.1 °C,GAMM, AIC value = 11,059.5, null model AIC value=15,518.0, Additional file 7: Appendix S7), althoughthere was more variability between individuals comparedto diving patterns.Due to our limited sample size of data-logger equipped
sharks, and to ensure that shark movement data (fromtelemetry) at least overlapped temporally with the periodof data-logger deployment, we only generated activityseascapes for blacktip reef sharks tagged in the backreefand grey reef sharks tagged along the SW portion of theatoll (locations where data-logger equipped sharks werecaught and released). As such, activity seascape dataconsists of 17 blacktip reef sharks tagged on the back-reefs and 17 grey reef sharks tagged within and just out-side the channel (Additional file 1: Appendix S1).Activity seascapes for both species showed a high con-centration of space use/activity in the daytime centralplace, with activity becoming spatially more diffuse atnight (Figs. 6 and 7). For both species, multiple individ-uals used the same daytime core area, suggestive of ref-uging behavior (Figs. 6 and 7). As changes in diel activitywere more pronounced in blacktip reef sharks, activityseascapes showed greater variation from simple spaceuse UDs. The importance of daytime activity was greatlyreduced within the central place, while the early eveninguse of the main channel was highlighted as a locationwhere activity of blacktip reef sharks may be high(Fig. 6).
Bioenergetic modelThere were clear diel changes in estimated routine meta-bolic rates due to the nocturnal increase in swim speed(Fig. 8). Overall, there was an approximately 7% differ-ence in routine metabolic rate between the early morn-ing (02:00–3:00) and the early afternoon (12:00–15:00).However, there was very little difference in predicted en-ergy expenditure between an animal with a 0.5 °C dielchange in body temperature, and one maintaining a con-stant body temperature throughout the diel cycle, re-gardless of the Q10 (paired t-test for means, Q10 = 1.6 t= 0.09, p = 0.93, Q10 = 3.0 t = − 0.00067, p = 0.99).
DiscussionAs predicted, both species of shark used a smaller cen-tral place in deeper water during the day when they wereless active, before expanding movements into shallowwater at night with a concurrent increase in activity.Blacktip reef sharks showed more dramatic diel changesin activity (but much more subtle changes in swimmingdepth) and were most active during the early evening,while grey reef sharks tended to be most active in themiddle of the night. The early evening peak in activityseen in blacktip reef sharks was previously suggested tobe a function of increased foraging success (due to fall-ing or low light levels) and predator/prey thermal physi-ology [14]. Aspects of CPF behavior clearly vary betweenthe species, as blacktip reef sharks use the central placeday and night; they just expand the total area they use atnight. Grey reef sharks were rarely detected at their cen-tral place at night so were not reusing the same areathroughout the diel cycle. Furthermore, there is strongspatial separation between the species at Palmyra, withblacktip reef shark activity spaces located in the back-reef, lagoons, and shallow forereef, while grey reefs aresituated on the deeper sections of the forereefs [35]. Ac-tivity cycles are based on small samples sizes, althoughthere is evidence that diel activity rhythms in tropicalreef sharks fit a more general pattern [23, 36]. For ex-ample, an acoustic camera placed in the main channel atPalmyra documented a peak in number of sharks (as-sumed to be blacktip reef sharks based on nighttimefishing) seen at the exact time and place we predict max-imal blacktip reef shark activity (early evening in thechannel [37]).Changes in activity were concurrent with diel vertical mi-
grations to and from the central place. Blacktip reef sharks
Fig. 8 Predicted diel changes in routine metabolic rates for a 38.3 kggrey reef shark, based on body temperature and swim speed. ‘Observed’uses actual diel changes in body temperature, while ‘static’ assumes aconstant body temperature of 28 °C throughout the diel cycle
Papastamatiou et al. Movement Ecology (2018) 6:9 Page 11 of 15
perform small shifts in swimming depth, but tides played agreater role in swimming depth, with individuals movingclose to the surface during daytime low tide periods,where they are directly warmed by the sun [14, 38,39]. Grey reef sharks maintained cooler body temper-atures during the day by occasionally diving belowthe thermocline and showed a greater diel shift indepth. However, their diel variation in bodytemperature was small and dives below the thermo-cline during the day were short and tended to occurwhile they were in a high activity state. Due to ther-mal inertia effects, grey reef sharks would havewarmer muscle temperatures than mesophotic teleostprey residing below the thermocline, as long as divedurations are short. The increased muscle perform-ance from being warmer could provide sharks with ahunting advantage during these periodic deeper ex-cursions. Although behavior below the thermoclinewas consistent between individual grey reef sharks,there was also clearly some variability in the depthsselected by individuals, with one shark staying consid-erably deeper than the others. The reasons for thisvariability are unknown, but could reduceintra-specific competition which is also thought todrive horizontal separation between grey reef sharkgroups at Palmyra [35].Activity seascapes and video footage suggest that some
foraging may occur in the central place of grey reefsharks at Palmyra. If foraging has some significance toCPF behavior in grey reef sharks, then we would expectthe location of the central place to be in an area of highdiurnal prey biomass. We recently conducted amark-recapture study to determine spatially dependentdensities for grey reef sharks at Palmyra [24]. All fishingwas performed during the day so technically these distri-bution patterns represent daytime central place loca-tions. We also used diver surveys to estimate spatialpatterns of biomass for reef fishes of lengths 10–60 cm,as a proxy of potential prey distribution ([40], NOAACoral Reef Ecosystem Program, Additional file 8: Appen-dix S8). Qualitatively, there was broad overlap betweenshark density hotspots and prey biomass, with highestlevels of both metrics at the eastern and western tipsand lower values along the southern and northern por-tions of the atoll (Additional file 8: Appendix S8). Whileabiotic conditions may explain these patterns (e.g. areasof high current flow), we at least provide evidence thatgrey reef shark central place locations are in areas whereprey is most abundant. Similarly, seabirds establish cen-tral place locations dependent on local productivity andprey availability, although of course seabird prey are notlocated directly at the central place [41].Although our results match our general predictions,
our bioenergetics model for grey reef sharks suggests
that body temperatures are having an insignificant effecton routine metabolic rates, at least at the diel scale. In-stead, diel changes in routine metabolic rates are drivenby changes in swim speed. Similarly, activity made amuch larger contribution to the short-term field meta-bolic rates of sea snakes than changes in temperature[21]. These results suggest that CPF behavior of grey reefsharks may involve some different mechanisms thanthose seen in other animals, at least for the Palmyrapopulation (i.e. individuals at other locations may displaymore dramatic diel changes in body temperatures).Firstly, we cannot assume that foraging does not takeplace within the central place, which can have implica-tions for patterns of intra-specific competition in refug-ing animals. Secondly, energy costs will not be afunction of travel distance to the central place, but in-stead related to movement speeds and likely tortuosity[18]. Unlike seabirds and other colonial CPF, access toforaging patches by sharks should not be a function ofdistance to the patch as they still have to swim withinthe central place; sharks simply modulate speed [3]. Thiswould also call into question a key prediction of trad-itional CPF models; in reef sharks foraging time within apatch should be independent of patch to central placedistance, in species that never stop swimming [4]. Ofcourse, this assumes the only currency of value to thesharks is energy, when time itself may also be important,especially if coral reefs are heterogeneous with regardshabitat quality. In this case, the time taken to swim todistant patches may come at lost opportunities of for-aging at more reliable patches close to the central place.Why would sharks, which do not use a nest/shelter or
stop swimming, need a central place? CPF would requiresome degree of memory although the animal may onlyhave to use basic path integration and memorization ofsimple landmarks to return to a central place, whichshould optimize foraging rates [42, 43]. Therefore, CPFbehavior may optimize foraging success via improvednavigation to foraging areas, while minimizing memoryrequirements (which come with costs) when prey commu-nities are relatively abundant [42, 43]. CPF behavior mayalso foster social associations between reef sharks, as‘meeting’ would require a common daytime habitat. Wefound that multiple individuals used the same core day-time areas, and video footage showed large numbers ofconspecifics sharing the same areas and at times even for-aging simultaneously. It is becoming increasingly apparentthat some species of shark, including grey and blacktipreef sharks, are capable of forming social associations withconspecifics, and ‘refuging’ during the day may be a mech-anism to allow such associations to form [6, 15, 44, 45].Ideally, one would record spatial position and high
resolution activity from each individual simultaneously,and over long time periods, improving our ability to
Papastamatiou et al. Movement Ecology (2018) 6:9 Page 12 of 15
identify ‘activity hotspots’ [19]. Doing so with fishes willrequire technological advancements to existing satelliteor acoustic telemetry techniques or the development ofcompletely new technologies [20, 21]. While cyclical pat-terns of activity are likely reasonably consistent in CPFanimals that show high residency, this may changethroughout the year and requires testing. For example, asemi-captive study with lemon sharks suggested that theextent of diel activity differences could be a function ofsex and social position [15]. New logging technologiesmay also enable feeding events and meal size to be dir-ectly measured in free-ranging sharks, rather than in-ferred from acceleration signals [46]. Analytically, statespace models and HMMs can now incorporate multiplevariables simultaneously from individual animals (e.g.diving depth, acceleration, stomach temperature, turnangles) to infer and validate behavioral states and pro-duce population-level activity budgets [47, 48]. Futurestudies could also then address individual variability inbehavior rather than homogenizing it within populationscale analyses.Understanding the small-scale dynamics of predation
requires approaching behavior from a spatial and tem-poral context in concert. When considering predator ef-fects on prey, we must consider patterns of predatorhabitat selection, but also predator behavior within thosehabitats. A recent study suggested that even trophic cas-cades in marine systems may be confined to spatial ‘hot-spots’ used by predators (e.g. [39]). Our activity seascapeapproach simultaneously displays the space used and dielactivity of marine predators and could further identify lo-cations of ecological importance, taking into accountspace use and behaviour. These advancements could sig-nificantly improve our understanding of how marine pred-ators may influence lower trophic levels and furtherexplain the evolution of CPF behavior in marine animals.
ConclusionsWe develop a new method for simultaneously displayingdiel space use and activity, in marine animals wherespace use and behavior are often measured over differenttime scales. We use this method to show that reef sharksbehave similar to central place foragers, occupyingdeeper water during the day where they are less active,and being more active in shallower water at night. How-ever, unlike other CPF animals, grey reef sharks at least,showed some evidence of foraging in the central place.Furthermore, diel changes in energy expenditure appearto be regulated by changes in swim speed and not bodytemperature. The implications are that traditionalpredictions from CPF theory regarding patch foragingtimes, may not apply for CPF animals that never stopswimming.
Additional files
Additional file 1: Appendix S1. Map of Palmyra atoll and locations ofacoustic receivers. (DOCX 645 kb)
Additional file 2: Appendix S2. Details of the hidden Markov modelbuilt to analyze shark accelerometer data. (DOCX 15 kb)
Additional file 3: Appendix S3. Swimming depth distribution ofindividual blacktip reef and grey reef sharks fitted with data-loggers.(DOCX 23 kb)
Additional file 4: Video footage from a grey reef shark showing aforaging event on the reef. (WMV 10244 kb)
Additional file 5: Appendix S5. Table showing percentage time greyreef sharks were in an active state for specific behaviours, determinedfrom animal-borne video cameras. (DOCX 12 kb)
Additional file 6: Appendix S6. Diel changes in swim speed for threegrey reef sharks fitted with swim speed sensors. Both average changes inspeed and a cyclic spline from a generalized additive model are shown.(DOCX 325 kb)
Additional file 7: Appendix S7. Diel changes in swimming depth andbody temperature for grey reef sharks at Palmyra atoll (n= 13) as determined byacoustic telemetry. The y-axis are the standardized residuals from a generalizedadditive mixed model. Dashed lines indicate 95% confidence interval around thesmooth term. (DOCX 230 kb)
Additional file 8: Appendix S8. Spatially dependent densities for greyreef sharks, determined from a mark-recapture study (Bradley et al. 2017,lower panel) and ‘potential prey’ abundance determined by diver surveys(upper panel, NOAA, CREP 2015). (DOCX 409 kb)
AcknowledgementsWe would like to thank K. Pollock, A. Pollock, H. Lynch and all the TNC staffwho helped accommodate our stay at Palmyra. We thank I. Williams and theCoral Reef Ecosystem Program for reef fish biomass data. This is publicationnumber PARC-0129 from the Palmyra Atoll Research Consortium.
FundingThis work was supported by the Marisla Foundation, the Grants-in-Aids forscientific research from the Japan Society for the Promotion of Science(25850138), the Hawaii Undersea Research Laboratory/NOAA Coral Reef Con-servation Program (NA05OAR4301108, NA09OAR43002), and the Pelagic Fish-eries Research Program/Joint Institute for Marine and Atmospheric Research(NA09OAR4320075).
Availability of data and materialsData used in this study is available upon reasonable request to the leadauthor.
Authors’ contributionsYPP, YYW, and JEC conceived the study. Statistical analysis was performed byRL, VL, and DB, while spatial analysis was performed by UD. YPP, DB, CGL,AMF, JEC, KW, and YYW performed fieldwork. All authors contributed towriting the manuscript. All authors read and approved the final manuscript.
Ethics approvalShark tagging was permitted under UCSB IACUC #856, and US Fish and Wildlifepermit # (Permit numbers #12533–14,011, #12533–13,011, #12533–12,011,#12533–11,007, #12533–10,011, #12533–09010, #12533–08011, and #12533–07006).
Competing interestsThe authors declare that they have no competing interests.
Publisher’s NoteSpringer Nature remains neutral with regard to jurisdictional claims inpublished maps and institutional affiliations.
Papastamatiou et al. Movement Ecology (2018) 6:9 Page 13 of 15
Author details1Department of Biological Sciences, Florida International University, NorthMiami, Florida, USA. 2National Institute of Polar Research, Tachikawa, Tokyo,Japan. 3Department of Polar Science, SOKENDAI (The Graduate University forAdvanced Studies), Tachikawa, Tokyo, Japan. 4School of Geography andSustainable Development, University of St Andrews, St Andrews, Scotland,UK. 5Department of Statistics, Iowa State University, Ames, Iowa, USA. 6BrenSchool of Environmental Science and Management, University of CaliforniaSanta Barbara, Santa Barbara, California, USA. 7Department of BusinessAdministration and Economics, Bielefeld University, Bielefeld, Germany.8Department of Fisheries Science, Virginia Institute of Marine Science, Collegeof William & Mary, Gloucester Point, Virginia, USA. 9Department of BiologicalSciences, California State University Long Beach, Long Beach, California, USA.10Department of Biology, University of Hawaii at Manoa, Honolulu, Hawaii,USA. 11Pristine Seas, National Geographic Society, Washington DC, USA.12Marine Science Institute, University California Santa Barbara, Santa Barbara,California, USA.
Received: 16 February 2018 Accepted: 28 May 2018
References1. Hamilton WJ, Watt KEF. Refuging. Ann Rev Ecol Syst. 1970;1:263–86.2. Olsson O, Bolin A. A model for habitat selection and species distribution
derived from central place foraging theory. Oecologia. 2014;175:537–48.3. Boyd C, Punt AE, Weimerskirch H, Bertrand S. Movement models provide
insights into variation in the foraging effort of central place foragers. EcolModel. 2014;286:13–25.
4. Kacelnik A. Central place refuging in starlings (Sturnus vulgaris). I. Patchresidence time. J Anim Ecol. 1984;53:283–99.
5. Chase JM. Central-place forager effects on food web dynamics and spatialpattern in northern California meadows. Ecology. 1998;79:1236–45.
6. Klimley AP, Nelson DR. Diel movement patterns of the scallopedhammerhead shark (Sphyrna lewini) in relation to El Bajo Espiritu Santo: arefuging-central position social system. Behav Ecol Sociol. 1984;15:45–54.
7. McKibben JN, Nelson DR. Patterns of movement and grouping of gray reefsharks, Carcharhinus amblyrhynchos, at Enewetak, Marshall Islands. Bull MarSci. 1986;38:89–110.
8. Field IC, Meekan MG, Speed CW, White W, Bradshaw CJA. Quantifyingmovement patterns for shark conservation at remote coral atolls of theIndian Ocean. Coral Reefs. 2011;30:61–71.
9. Papastamatiou YP, Friedlander AM, Caselle JE, Lowe CG. Long-termmovement patterns and trophic ecology of blacktip reef sharks(Carcharhinus melanopterus) at Palmyra atoll. J Exp Mar Biol Ecol. 2010;386:94–102.
10. Sims DW, Weamouth VJ, Southall EJ, Hill JM, Moore P, Rawlinson K,Hutchinson N, Budd GC, Righton D, Metcalfe JD, Nash JP, Morritt D. Huntwarm, rest cool: bioenergetic strategy underlying diel vertical migration of abenthic shark. J Anim Ecol. 2006;75:176–90.
11. Chapman DD, Pikitch EK, Babcock EA, Shivji MS. Deep-diving and dielchanges in vertical habitat use by Caribbean reef sharks, Carcharhinus perezi.Mar Ecol Prog Ser. 2007;344:271–5.
12. Heupel MR, Simpfendorfer CA. Long-term movement patterns of a coralreef predator. Coral Reefs. 2015;34:679–91.
13. Whitney NM, Papastamatiou YP, Holland KN, Lowe CG. Use of anacceleration data logger to measure diel activity patterns in captivewhitetip reef sharks, Triaenodon obesus. Aquat Liv Res. 2007;20:299–305.
14. Papastamatiou YP, Watanabe YY, Bradley D, Dee LE, Weng K, Lowe CG,Caselle JE. Drivers of daily routines in an ectothermic marine predator: huntwarm, rest warmer? PLoS One. 2015;10:e0127807.
15. Wilson ADM, Brownscombe JW, Krause J, Krause S, Gutowsky LFG, Brooks EJ,Cooke SJ. Integrating network analysis, sensor tags, and observations tounderstand shark ecology and behavior. Behav Ecol. 2015;26:1577–86.
16. Barnett A, Payne NL, Semmens JM, Fitzpatrick R. Ecotourism increases thefield metabolic rate of whitetip reef sharks. Biol Conserv. 2016;199:132–6.
17. Shipley ON, Brownscombe JW, Danylchuk AJ, Cooke SJ, O’Shea OR, BrooksEK. Fine-scale movement and activity patterns of Caribbean reef sharks(Carcharhinus perezi) in the Bahamas. Environ Biol Fish. 2018; In Press
18. Wilson RP, Griffiths IW, Legg PA, Friswell MI, Bidder OR, Halsey LG,Lambertucci SA, Shepard ELC. Turn costs change the value of animal searchpaths. Ecol Lett. 2013;16:1145–50.
19. Wilson RP, Quintana F, Hobson VJ. Construction of energy landscapes canclarify the movement and distribution of foraging animals. Proc Roy Soc B.2011; https://doi.org/10.1098/rspb.2011.1544.
20. Brownscombe JW, Cooke SJ, Danylchuk AJ. Spatiotemporal drivers ofenergy expenditure in a coastal marine fish. Oecologia. 2017;183:689–99.
21. Udyawer V, Simpfendorfer CA, Heupel MR, Clark TD. Temporal and spatialactivity-associated energy partitioning in free-swimming sea snakes. FunctEcol. 2017;31:1739–49.
22. Leos-Barajas V, Photopoulou T, Langrock R, Patterson TA, WatanabeYY, Murgatroyd M, Papastamatiou YP. Analysis of animalaccelerometer data using hidden Markov models. Meth Ecol Evol.2017;8:161–73.
23. Vanderklift MA, Boschetti F, Roubertie C, Pillans RD, Haywood MDE, BabcockRC. Density of reef sharks estimated by applying an agent-based model tovideo surveys. Mar Ecol Prog Ser. 2014;508:201–9.
24. Bradley D, Conklin E, Papastamatiou YP, McCauley DJ, Pollock K, Pollock A,Kendall BE, Gaines SD, Caselle JE. Resetting predator baselines in coral reefecosystems. Sci Rep. 2017;7:43131.
25. Gleiss AC, Wilson RP, Shepard ELC. Making overall dynamic bodyacceleration work: on the theory of acceleration as a proxy for energyexpenditure. Meth Ecol Evol. 2011;2:23–33.
26. Langrock R, King R, Matthiopoulos J, Thomas L, Morales JM. Flexible andpractical modelling of animal telemetry data: hidden Markov models andextensions. Ecology. 2012;93:2336–42.
27. Akaike H. Information theory and an extension of the maximum likelihoodprinciple. Proceedings of the 2nd International Symposium on InformationTheory. Budapest: Akademiai Kiado; 1973. p. 267–81.
28. Richards SA. Testing ecological theory using the information-theoreticapproach: examples and cautionary results. Ecology. 2005;86(10):2805–14.
29. Demšar U, Buchin K, van Loon EE, Shamoun-Baranes J. Stacked space-timedensities: a geovisualisation approach to explore dynamics of space useover time. GeoInformatica. 2015;19:85–1185.
30. Horne JS, Garton EO, Krone SM, Lewis JS. Analyzing animal movementsusing Brownian bridges. Ecology. 2007;88:2354–63.
31. Payne NL, Snelling EP, Fitzpatrick R, Seymour J, Courtney R, Barnett A,Watanabe YY, Sims DW, Squire Jr L, Semmens JM. A new method forresolving uncertainty of energy requirements in large water breathers:the ‘mega-flume’ seagoing swim-tunnel respirometer. Meth Ecol Evol2015, 6: 668–677.
32. White CR, Phillips NF, Seymour RS. The scaling and temperaturedependence of vertebrate metabolism. Biol Lett. 2006;2:125–7.
33. Dowd WW, Brill RW, Bushnell PG. Standard and routine metabolic rates ofjuvenile sandbar sharks (Carcharhinus plumbeus), including the effects ofbody mass and acute temperature change. Fish Bull. 2006;104:323–31.
34. Iosilevskii G, Papastamatiou YP. Relations between morphology, buoyancyand energetics of requiem sharks. Roy Soc Op Sci. 2016;3:160406.
35. Papastamatiou YP, Bodey TW, Friedlander AM, Lowe CG, Bradley D, Weng K,Priestley V, Caselle JE. Spatial separation without territoriality in sharkcommunities. Oikos. 2018, In Press.
36. Mourier J, Maynard J, Parravicini V, Ballesta L, Clua E, Domeier ML. Extremeinverted trophic pyramid of reef sharks supported by spawning groupers.Curr Biol. 2016;26:2011–6.
37. McCauley DJ, DeSalles PA, Young HS, Gardner JPA, Micheli F. Use of high-resolution acoustic cameras to study reef shark behavioral ecology. J ExpMar Biol Ecol. 2016;482:128–33.
38. Speed CW, Meekan MG, Field IC, McMahon CR, Bradshaw CJA. Heat-seekingsharks: support for behavioural thermoregulation in reef sharks. Mar EcolProg Ser. 2012;463:231–44.
39. Rasher DB, Hoey AS, Hay ME. Cascading predator effects in a Fijian coralreef ecosystem. Sci Rep. 2017;7:15684.
40. McCoy K, Heenan A, Asher J, Ayotte P, Gorospe K, Gray A, Lino K, Zamzow J,Williams I. Pacific Reef Assessment and Monitoring Program. 2015, NOAACoral Reef Ecosystem Program.
41. Sandvick H, et al. Modelled drift patterns of fish larvae link coastalmorphology to seabird colony distribution. Nat Commun. 2016;7:11599.
42. Barraquand F, Inchausti P, Bretagnolle V. Cognitive abilities of a central placeforager interact with spatial aggregation in their effect on intake rate. AnimBehav. 2009;78:505–14.
43. Fagan WF, Lewis MA, Auger-Methe M, Avgar T, Benhamou S, Breed G, LaDageL, Schlagel UE, Tang W, Papastamatiou YP, Forester J, Mueller T. Spatialmemory and animal movement. Ecol Lett. 2013;16:1316–29.
Papastamatiou et al. Movement Ecology (2018) 6:9 Page 14 of 15
44. Jacoby DMP, Papastamatiou YP, Freeman R. Inferring animal social networksand leadership: applications for passive monitoring arrays. J Roy Soc Inter.2016;13:20160676.
45. Mourier J, Vercelloni J, Planes S. Evidence of social communities in aspatially structured network of a free-ranging shark species. Anim Behav.2012;83:389–401.
46. Brewster LR, Dale JJ, Guttridge TL, Gruber SH, Hansell AC, Elliott M, Cowx IG,Whitney NM, Gleiss AC. Development and application of a machinelearning algorithm for classification of elasmobranch behavior fromaccelerometry data. Mar Biol. 2018;165:62.
47. DeRuiter SL, Langrock R, Skirbutas T, Goldbogen JA, Calambokidis J,Friedlander AS, Southall BL. A multivariate mixed hidden Markov model forblue whale behaviour and responses to sound exposure. Ann Appl Stat.2017; In Press
48. McClintock BT, Russell DJF, Matthiopoulos J, King R. Combining individualanimal movement and ancillary biotelemetry data to investigatepopulation-level activity budgets. Ecology. 2013;94:838–49.
Papastamatiou et al. Movement Ecology (2018) 6:9 Page 15 of 15