activity slides again, but buyers still paying...
TRANSCRIPT

ACTIVITY SLIDES AGAIN, BUT BUYERS STILL PAYING UP FOR QUALITYPAGE 5»
HE ALT HCARE & I T SKE W MULT IPL E S
PAGE 7»
L E AGUE TABL E SPAGE 16»
I N P A R T N E R S H I P W I T H
US
3Q 20 16
C O - S P O N S O R E D B Y
PE E X I T VAL UE DECL INE S3 1% QOQPAGE 10»

FINANCIAL TRANSACTIONS & REPORTING | MARKETING & COMMUNICATIONS FOR REGULATED INDUSTRY | CUSTOMER CONTENT & COLLABORATION SOLUTIONS
MERRILL DATASITE
This year, Merrill DataSite reached the 1 billion mark.
That’s 1 billion pages uploaded to our award-winning virtual data room since 2004.
Thousands of companies worldwide trust us to securely host their confidential information. Our single platform exists to support your rapidly changing needs.
Contact us to see how we can help you with your next transaction.
merrillcorp.com
© Merrill Communications LLC. All rights reserved.
Reaching the summit is no small feat.
1,000,000,000PAGES UPLOADED
41,000+VIRTUAL DATA ROOM PROJECTS SECURED
SINCE 2003
31,000+M&A TRANSACTIONS
SINCE 2003
20TECHNOLOGY AWARDS
IN THE PAST 8 YEARS
14LANGUAGES
SPOKEN
Credits & ContactPitchBook Data, Inc.
JOHN GABBERT Founder, CEO
ADLEY BOWDEN Vice President,
Market Development & Analysis
Content
NIZAR TARHUNI Senior Analyst
DYLAN COX Analyst
BRYAN HANSON Data Analyst
JENNIFER SAM Senior Graphic Designer
Contact PitchBook pitchbook.com
RESEARCH
EDITORIAL
SALES
COPYRIGHT © 2016 by PitchBook Data, Inc. All rights reserved. No part of this publication may be reproduced in any form or by any means—graphic, electronic, or mechanical, including photocopying, recording, taping, and information storage and retrieval systems—without the express written permission of PitchBook Data, Inc. Contents are based on information from sources believed to be reliable, but accuracy and completeness cannot be guaranteed. Nothing herein should be construed as any past, current or future recommendation to buy or sell any security or an offer to sell, or a solicitation of an offer to buy any security. This material does not purport to contain all of the information that a prospective investor may wish to consider and is not to be relied upon as such or used in substitution for the exercise of independent judgment.
Contents
Introduction 4
Overview 5-6
Deal Multiples & Debt Levels 7
Q&A: Merrill Corporation 8
Deals by Size & Sector 9
Exits 10-11
Q&A: Murray Devine 12-13
Fundraising 14-15
3Q 2016 League Tables 16
3 PITCHBOOK 3Q 2016 US PE BREAKDOWN
CO-SPONSORED BYSPONSORED BY

A continued decline for US PEIntroduction
Nothing’s changed. That phrase can more or less some up the path in which
private equity has moved over recent quarters. Through the third quarter of the
year, transaction counts have fallen and while total capital invested at first sight
looks high, a significant proportion of that comes from one deal, so we don’t
think we can take that aggregate figure as an adequate representation of the
entire market’s general sentiment.
In today’s context, dealmakers have to be more prudent. The capital to get deals
done isn’t an issue but the exit markets are dryer and lenders are more skeptical
around the quality of, and the level at which they can lend to certain companies.
Further, there is a natural and cyclical element to the slow manner in which the
market has moved. Over recent years, a general partner could pull the trigger on
a few deals with the expectation that the general economy and market was more
accommodating to help underpin growth. Today, top-line revenue is increasingly
difficult to drive and earnings growth has remained sluggish, so many managers
are focused on building “recession-proof” businesses that can sustain any
external shocks we may get in the coming years, whether that be domestic or
foreign.
That trend will remain in place. And despite some limited partners cutting
allocations, the overall industry will continue to attract significant levels of
patient capital that can be put to work over time.
We hope this report and our data helps inform your decision-making process.
Please feel free to reach us at [email protected] with any questions or
comments you may have.
YOUR JOURNEY TO STRONGER RETURNS STARTS HERE
• Strengthen your LP relationships
• Build a better portfolio
• Exit efficiently and successfully
• Elevate your firm with award-winning technology
With data on:
Companies
Investors
Deals
M&A
Limited partners
Funds
Financials
Advisors
People
Request a free trial
US +1 206.623.1986
UK +44 (0)207.190.9809
pitchbook.com
The PitchBook Platform for private equity
NIZAR TARHUNI
Senior Analyst
4 PITCHBOOK 3Q 2016 US PE BREAKDOWN
CO-SPONSORED BYSPONSORED BY

Deal value has plateauedOverview
Through the third quarter of 2016,
nothing has changed in terms of
the trend around total PE deal volume.
Activity has consistently legged lower
quarter over quarter, yet if we look
at aggregate transaction value, the
numbers can be a bit deceiving. Three
quarters through the year, total capital
invested came in at $484 billion across
2,477 completed deals, which puts
2016 deal value on pace to come in
relatively flat with 2015 and volume set
to come in down nearly 18% YoY. On
a quarterly basis, the macro market
landscape looks even more perplexing.
3Q saw $171 billion invested across 662
transactions and while that volume
figure represents a quarterly drop
of more than 26%, that aggregate
transaction value number points to a
near 10% jump over what we saw in
Third quarter deal count wanes considerably
US PE activity by quarter
Through 3Q, volume is off pace but value remains stable
US PE activity
$501
$930
$369
$163
$356
$411
$470
$511
$644
$642
$484
2,785 2,7192,674
3,379
4,037
2,477
2006 2007 2008 2009 2010 2011 2012 2013 2014 2015 2016*
Deal Value ($B) # of Deals Closed
$70
$79
$83
$124
$100
$101
$91
$118
$92
$95
$96
$186
$102
$114
$125
$170
$153
$153
$168
$169
$152
$146
$190
$155
$157
$156
$171
643
595
759710
838 727 779861
1,0531,017 1,024 1,002 916
662
1Q 2Q 3Q 4Q 1Q 2Q 3Q 4Q 1Q 2Q 3Q 4Q 1Q 2Q 3Q 4Q 1Q 2Q 3Q 4Q 1Q 2Q 3Q 4Q 1Q 2Q 3Q
2010 2011 2012 2013 2014 2015 2016
Deal Value ($B)
# of Deals Closed
Source: PitchBook
*As of 9/30/2016
Source: PitchBook
*As of 9/30/2016
5 PITCHBOOK 3Q 2016 US PE BREAKDOWN
CO-SPONSORED BYSPONSORED BY
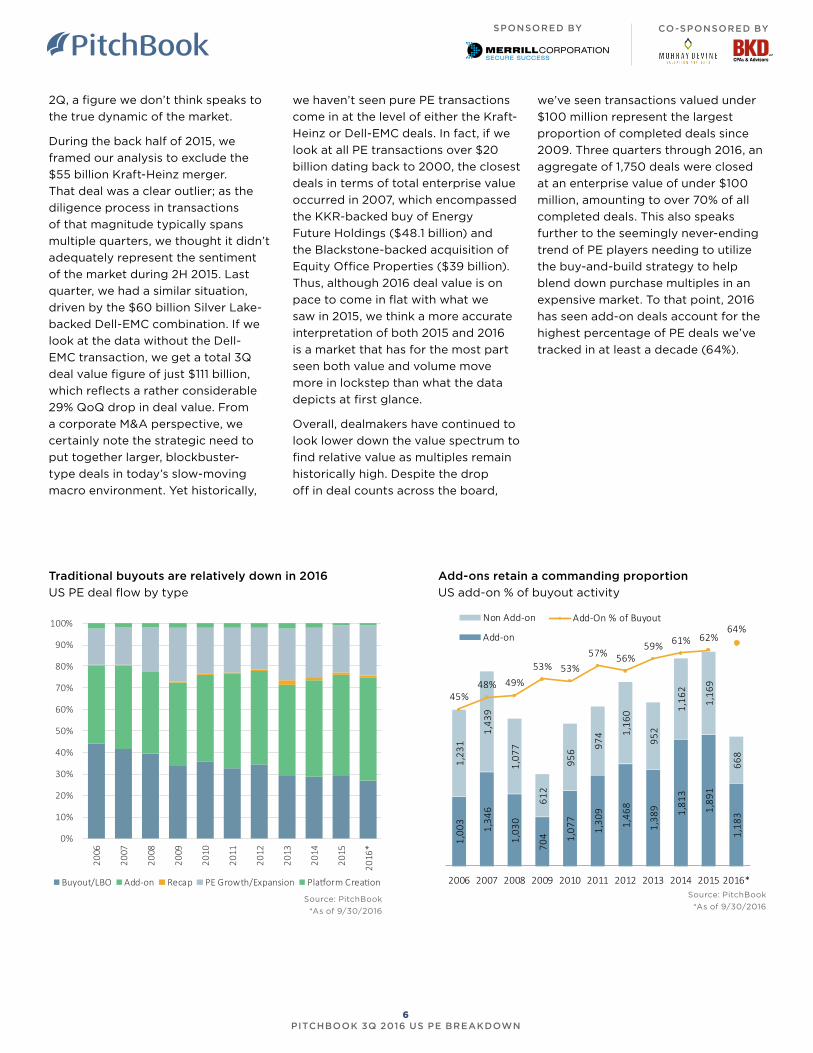
Add-ons retain a commanding proportion
US add-on % of buyout activity
Traditional buyouts are relatively down in 2016
US PE deal flow by type
1,00
3
1,34
6
1,03
0
704 1,
077
1,30
9
1,46
8
1,38
9 1,81
3
1,89
1
1,18
3
1,23
1
1,43
9
1,07
7
612
956 97
4 1,16
0
952
1,16
2
1,16
9
668
45%48% 49%
53% 53%57% 56%
59% 61% 62%64%
2006 2007 2008 2009 2010 2011 2012 2013 2014 2015 2016*
Non Add-on
Add-on
Add-On % of Buyout
2Q, a figure we don’t think speaks to
the true dynamic of the market.
During the back half of 2015, we
framed our analysis to exclude the
$55 billion Kraft-Heinz merger.
That deal was a clear outlier; as the
diligence process in transactions
of that magnitude typically spans
multiple quarters, we thought it didn’t
adequately represent the sentiment
of the market during 2H 2015. Last
quarter, we had a similar situation,
driven by the $60 billion Silver Lake-
backed Dell-EMC combination. If we
look at the data without the Dell-
EMC transaction, we get a total 3Q
deal value figure of just $111 billion,
which reflects a rather considerable
29% QoQ drop in deal value. From
a corporate M&A perspective, we
certainly note the strategic need to
put together larger, blockbuster-
type deals in today’s slow-moving
macro environment. Yet historically,
we haven’t seen pure PE transactions
come in at the level of either the Kraft-
Heinz or Dell-EMC deals. In fact, if we
look at all PE transactions over $20
billion dating back to 2000, the closest
deals in terms of total enterprise value
occurred in 2007, which encompassed
the KKR-backed buy of Energy
Future Holdings ($48.1 billion) and
the Blackstone-backed acquisition of
Equity Office Properties ($39 billion).
Thus, although 2016 deal value is on
pace to come in flat with what we
saw in 2015, we think a more accurate
interpretation of both 2015 and 2016
is a market that has for the most part
seen both value and volume move
more in lockstep than what the data
depicts at first glance.
Overall, dealmakers have continued to
look lower down the value spectrum to
find relative value as multiples remain
historically high. Despite the drop
off in deal counts across the board,
we’ve seen transactions valued under
$100 million represent the largest
proportion of completed deals since
2009. Three quarters through 2016, an
aggregate of 1,750 deals were closed
at an enterprise value of under $100
million, amounting to over 70% of all
completed deals. This also speaks
further to the seemingly never-ending
trend of PE players needing to utilize
the buy-and-build strategy to help
blend down purchase multiples in an
expensive market. To that point, 2016
has seen add-on deals account for the
highest percentage of PE deals we’ve
tracked in at least a decade (64%).
Source: PitchBook
*As of 9/30/2016
Source: PitchBook
*As of 9/30/2016
0%
10%
20%
30%
40%
50%
60%
70%
80%
90%
100%
2006
2007
2008
2009
2010
2011
2012
2013
2014
2015
2016
*
Buyout/LBO Add-on Recap PE Growth/Expansion Pla�orm Crea�on
6 PITCHBOOK 3Q 2016 US PE BREAKDOWN
CO-SPONSORED BYSPONSORED BY

Valuations continue to climbDeal multiples & debt levels
Starting last quarter, we combined
our PE and M&A transaction
multiple datasets to capture a more
comprehensive and accurate view of
the deal markets in terms of pricing
and debt usage. With that clarification,
valuation-to-EBITDA multiples through
3Q 2016 are at 11.2x—the highest level
since at least 2010 and up from 10.2x
in 2015.
4.8x 5.
5x
5.0x 6.
3x
5.6x
5.7x
5.4x
3.7x
4.1x
3.7x
3.9x
4.3x 4.5x 5.
8x
8.5x
9.6x8.7x
10.2x 9.9x 10.2x
11.2x
2010 2011 2012 2013 2014 2015 2016*
Debt / EBITDA Equity / EBITDA Valua�on / EBITDA
56.5% 57.3% 57.4%
61.7%
56.7% 55.9%
48.4%
40%
45%
50%
55%
60%
65%
2010 2011 2012 2013 2014 2015 2016*
To this point, 2016 has seen an uptick
in private investment in the healthcare
and IT sectors, both of which tend to
trade at higher EV/EBITDA multiples
due to their high perceived potential
for growth. As more and more deal
activity moves toward these high-
growth and high-multiple sectors,
some of the change we see may not be
in the valuations themselves, but in the
migration of PEGs to these industries.
15% of PE deals thus far in 2016 have
been in the healthcare industry, and
an additional 17% have taken place
in IT, both the highest figures in our
datasets.
As we have touched on in prior
editions of this report, the wider lack
of earnings growth and ample capital
availability have also contributed
to the current record-high multiple
environment across the M&A sphere.
According to Factset, companies in
the S&P 500 held a combined cash
and short-term investment balance of
$1.46 trillion at the end of July 2016—
the second highest total in at least 10
years, allowing companies to use their
balance sheets to grow inorganically
and possibly accept lower returns in
the short term.
Transitioning to debt usage, through
the third quarter, the median
debt percentage on PE and M&A
transactions was 48.4% of enterprise
value (EV). This figure is down from
what we reported a quarter ago,
but the broader trend is that more
and more equity is being used to
complete deals. While low compared
to EV, median debt usage is at 5.4x
EBITDA, down from 2013-2015, but still
relatively high on a historical basis.
Median EBITDA multiples of US M&A (including PE buyouts)
Median debt percentages for US M&A (including PE buyouts)
Source: PitchBook
*As of 9/30/2016.
Figures are likely to adjust as more data is collected.
Source: PitchBook
*As of 9/30/2016
7 PITCHBOOK 3Q 2016 US PE BREAKDOWN
CO-SPONSORED BYSPONSORED BY

To kick things off, what is your broad
take on the current private equity
landscape?
Generating alpha through traditional
PE strategies is about as difficult
as it’s ever been. Strategies such as
growth investing may also become
more popular, as thereby firms
can avoid some price pressure and
potentially gain exposure to smaller,
faster-growing companies. It’s not
a new weapon in PE firms’ arsenals
but one that has not been as utilized
as much over the past several years,
but niche growth strategies have
benefited certain firms as of late, such
as TSG Consumer Partners. Notably,
however, such investments may not
come directly from funds raised
specifically for growth or expansion
opportunities, but rather from more
multipurpose pools of capital, as the
raising of growth-dedicated vehicles
has declined in 2016 to date.
Do you foresee the capital-rich
environment remaining in place for
the foreseeable future?
It’s not that all limited partners are
clamoring to increase their allocations,
but rather, at the very least, maintain
them, or commit to even larger
vehicles run by the most experienced
and best-performing managers. This
has led to increased concentration
and segmentation in both fundraising
Richard A. Martin, Jr. Senior Director
Merrill Corporation
Richard A. Martin, Jr. is a Senior Director at Merrill Corporation, responsible for Merrill DataSite’s global marketing group. His 18 years of marketing experience working and residing in the US, U.K. and Europe has developed Martin’s understanding of disparate business cultures and the global financial industry, evidenced by a successful record of growing businesses. Martin currently works closely with financial professionals to provide first class virtual data room (VDR) solutions for their transaction and due diligence needs. Prior to joining Merrill, Martin led the hedge fund marketing strategy group at Morgan Stanley Capital International and the global equity product strategy group at Reuters International, London. He received his B.A. from Dartmouth College, a marketing certificate from the University of Michigan Business School and currently resides in New York City with his wife and children.
and deal flow. General partners will
wish to invest in all segments of the
market, while institutional investors
will seek out the best fund managers
in each market segment. By now,
strategies that take long-term volatility
into account are in high demand.
That could continue to encourage LP
interest, as the typical PE fund lifecycle
may now be seen more as a potential
benefit or at the least not as much of
a hindrance as it used to be. In short,
illiquidity isn’t still a positive but it
looks like less of a handicap in light of
sustained volatility.
Of those current challenges, what do
you think is most pressing for fund
managers?
Justifying the high prices that
quality companies are currently
commanding likely takes the top spot.
Correctly assessing macroeconomic
factors on a sector-by-sector basis
remains challenging, with certain
trade agreements or other political
developments such as Brexit clouding
mid-term forecasting. Coincidentally,
this is reinforcing many managers’
focus on the lower middle market,
simply because some of those
businesses are not as exposed to those
international concerns, plus, even if
prices do get overheated at those
lower reaches, total transaction values
really aren’t that lofty.
ABOUT MERRILL CORPORATION
Merrill Corporation provides technology-enabled platforms for secure content sharing, regulated communications and
disclosure services. Clients trust Merrill’s innovative applications and deep subject expertise to successfully navigate the
secure sharing of their most sensitive content, perfect and distribute critical financial and regulatory disclosures, and create
customized communications across stakeholders. With more than 3,800 people in 41 locations worldwide, clients turn to
Merrill when their need to manage complex content intersects with the need to collaborate securely around the globe.
8 PITCHBOOK 3Q 2016 US PE BREAKDOWN
CO-SPONSORED BYSPONSORED BY

US PE deals ($B) by sector
US PE deals (#) by sector
Sponsors continue to stay active primarily within the
core and lower reaches of the middle market
US PE deals (#) by deal size
Deals under $25M have accounted for over 46% of activity thus far in 2016, the highest proportion since 2009.
IT deal value through 3Q stood at $131B, the highest of any sector.
Deals over $1B make up majority of deal value in 2016
US PE deals ($B) by deal size
0%
10%
20%
30%
40%
50%
60%
70%
80%
90%
100%
2006
2007
2008
2009
2010
2011
2012
2013
2014
2015
2016
*$2.5B+
$1B-$2.5B
$500M-$1B
$100M-$500M
$25M-$100M
Under $25M
Source: PitchBook
*As of 9/30/2016
Deals by size and sector
0%
10%
20%
30%
40%
50%
60%
70%
80%
90%
100%
2006
2007
2008
2009
2010
2011
2012
2013
2014
2015
2016
*
$2.5B+
$1B-$2.5B
$500M-$1B
$100M-$500M
$25M-$100M
Under $25M
Source: PitchBook
*As of 9/30/2016
0
500
1,000
1,500
2,000
2,500
3,000
3,500
4,000
4,500
2006
2007
2008
2009
2010
2011
2012
2013
2014
2015
2016
*
Materials & Resources
ITHealthcareFinancial Services
Energy
B2C
B2B
$0
$100
$200
$300
$400
$500
$600
$700
$800
$900
$1,000
2006
2007
2008
2009
2010
2011
2012
2013
2014
2015
2016
*
Materials & Resources
IT
Healthcare Financial Services
Energy B2C
B2B
Source: PitchBook
*As of 9/30/2016
Source: PitchBook
*As of 9/30/2016
9 PITCHBOOK 3Q 2016 US PE BREAKDOWN
CO-SPONSORED BYSPONSORED BY

PE-backed sales plummet Exits
After a second quarter that
showed signs of recovery, the
value of PE-backed exits fell by 31%
in 3Q 2016 to $66 billion across just
218 transactions. Three-quarters of
the way through the year, exit value
is on pace to be about 25% behind
2015. Though still high by historical
standards, the falling-off speaks
to some softening of the overall
M&A cycle—not only in PE backed
companies. Both PE-backed exits and
the wider M&A markets peaked around
4Q 2015 and have fallen substantially
since.
In what has been a very slow year
for IPOs overall, the number of exits
via public offering has dampened
accordingly. Through 3Q 2016, just
20 PE backed companies have held
an IPO, compared to 34 by the same
point last year.
Sustained dip in exit activity
US PE-backed exit activity
Source: PitchBook
$26
$40
$34
$52
$30
$54
$33
$41
$36
$47
$41
$103
$20
$31
$78
$98
$74
$60
$63
$111
$75
$112
$89
$128
$66
$97
$66
164 169 180
212255
229
196
245269
320 313 304
261
218
1Q 2Q 3Q 4Q 1Q 2Q 3Q 4Q 1Q 2Q 3Q 4Q 1Q 2Q 3Q 4Q 1Q 2Q 3Q 4Q 1Q 2Q 3Q 4Q 1Q 2Q 3Q
2010 2011 2012 2013 2014 2015 2016
Exit Value ($B) # of Exits
US PE-backed exit activity
$153
$220
$114
$55
$153
$158
$227
$227
$309
$404
$229
722601
771
1,065
1,223
747
2006 2007 2008 2009 2010 2011 2012 2013 2014 2015 2016*
Exit Value ($B) # of Exits
While the market overall may not be
as strong as it was last year, there is
still plenty of appetite for high-quality,
high-value targets. The percentage
of exit value made up by transactions
with at least $2.5B in enterprise value
has risen each of the last two years,
and now makes up over half of the
value of US PE exits.
10 PITCHBOOK 3Q 2016 US PE BREAKDOWN
CO-SPONSORED BYSPONSORED BY
Source: PitchBook
*As of 9/30/2016

The healthcare sector has made up 32% of total exit value through 3Q 2016.
SBOs stood at 45% of all exits in 3Q 2016, while IPOs remain subdued.
11 PITCHBOOK 3Q 2016 US PE BREAKDOWN
CO-SPONSORED BYSPONSORED BY
Healthcare & B2C dominate exits by value.
US PE-backed exits ($B) by sector
Each individual sector is behind last year’s pace
US PE-backed exits (#) by sector
M&A is crucial particularly in terms of exit value
US PE-backed exits ($B) by type
Strategic buyers remain PE sellers’ salvation
US PE-backed exits (#) by type
Source: PitchBook
*As of 9/30/2016
Source: PitchBook
*As of 9/30/2016
Source: PitchBook
*As of 9/30/2016
Source: PitchBook
*As of 9/30/2016
0
200
400
600
800
1,000
1,200
1,400
2006 2007 2008 2009 2010 2011 2012 2013 2014 2015 2016*
Corporate Acquisi�on IPO Secondary Buyout
$0
$50
$100
$150
$200
$250
$300
$350
$400
$450
2006 2007 2008 2009 2010 2011 2012 2013 2014 2015 2016*
Corporate Acquisi�on
IPO
Secondary Buyout
0%
10%
20%
30%
40%
50%
60%
70%
80%
90%
100%
2006
2007
2008
2009
2010
2011
2012
2013
2014
2015
2016
*
B2B
B2C
Energy
FinancialServices
Healthcare
IT
Materials &Resources
0%
10%
20%
30%
40%
50%
60%
70%
80%
90%
100%
2006
2007
2008
2009
2010
2011
2012
2013
2014
2015
2016
*
B2B
B2C
Energy
FinancialServices
Healthcare
IT
Materials &Resources

Robert A. TribuianiManaging Director, Head of
Business Development
Murray Devine
Rob leads business development for Murray Devine, & Co. He is responsible for developing, executing and managing sales strategies that generate revenue from new and existing client relationships. He draws upon over twenty years of proven success in consultative sales, relationship management and business development in software and professional services having worked for private equity and venture capital backed emerging and growth stage companies.
Before joining Murray Devine, Rob worked as a senior business development executive for SolomonEdwards, a leading professional services firm headquartered in suburban Philadelphia that provides strategy execution services to companies from emerging to large global organizations. His principal focus was to assist clients in the Firm’s Banking & Financial Services Practice solve their critical business issues related to business transformation, accounting and finance, governance and regulatory compliance, and mergers and acquisitions. During his ten-year tenure at SolomonEdwards, Rob was consistently recognized as a top sales performer in achieving revenue targets.
Rob is a graduate of Villanova University and earned a Bachelor of Science degree in Business Administration with a concentration in Finance.
In the third quarter of 2016, total PE
deal value remained relatively flat. Do
you see anything that could shift this
trend?
Similarly to the second quarter, the
past three months have been again
marked by lingering uncertainty
among dealmakers. The summer
always seems to experience something
of a slowdown, particularly during a
year like this in which there may be
less urgency to put money to work.
But Brexit took just about everyone
by surprise in the second quarter and
definitely had a chilling effect on cross-
border M&A as we moved into the
second half of the year. You also had a
number of broken deals in the first six
months, many of which were the direct
result of government intervention.
While this may not have a tremendous
impact on certain sectors or small and
mid-market deals, it does create yet
more uncertainty. When you add in
the fact that valuations have shown
very little if any downward movement,
you’re going to encounter a market
in which quality assets are priced to
perfection but everybody is walking
on eggshells because they’re not quite
certain what the next six months will
bring.
That being said, these things can be
ephemeral once everyone digests the
news and puts everything into context.
UK-based Micro Focus, for instance,
just bought the software business of
Hewlett Packard Enterprise Co. in an
$8.8 billion transaction. This is the type
of deal, involving a British company,
that can instill confidence and help
kickstart activity throughout the
market. It can help both buyers and
sellers see beyond the paralysis that
resulted from the Brexit vote.
Still, there are quite a few unknown
factors that will continue to slow
dealmaking for the foreseeable future
or at least until certain questions
are resolved. For instance, sponsors
aren’t necessarily keen to buy into
the biotech or pharmaceutical sectors
and pay a valuation that may assume
drug prices can continue to climb into
perpetuity. In the event that Hillary
Clinton is elected, drug prices will
likely receive even more scrutiny. By
the same token, sponsors may be just
as hesitant to acquire a manufacturer
and risk dealing with a potential trade
war that could see raw material costs
spike should Donald Trump win. So
the election can have a huge impact.
We also have the sense that sellers
are actually just as reticent to go to
market amid the uncertainty unless
they’re shopping assets that have a
distinct value proposition, can show
multiple years of profitable growth and
have a moat in place that protects the
company against the unexpected. But
these types of high quality assets, as
you might imagine, are not cheap.
What do you make of the high EBITDA
multiples that we are seeing across
the market? How has this high-price
environment affected your approach
to valuation?
I might actually turn that question
on its head. If you look at the S&P
500, earnings have now fallen for six
straight quarters. This has been driven
by a number of factors, not the least
of which is the strong US dollar and
the woes in the energy sector. But
even as the price-to-earning ratio
climbs and the S&P continues to test
new highs, investors are drawn to US
stocks because there’s so little growth
anywhere else.
This does have an impact on valuations
in the private market and reflects
the struggle across the investment
landscape to find growth. This is why
you’re seeing a number of larger
companies look to get leaner and
more focused, particularly when they
can generate so much shareholder
value through shedding assets that
may no longer be a strategic fit. But
The Q&A is continued on the next page.
12 PITCHBOOK 3Q 2016 US PE BREAKDOWN
CO-SPONSORED BYSPONSORED BY

as it relates to valuations, there is a
hunt for quality in this market and
buyers have to pay up to get it. Also,
depending on the sector, buyers may
overlook slowing earnings because
they recognize that it may be related
to a temporary factor, such as a strong
dollar or something else.
Generally, at least for PE deals,
valuations won’t start to fall until the
debt markets pull back. We have seen
equity commitments as a percentage
of total enterprise value slowly climb
throughout 2016, but I’m not sure
that’s reflective of lender unrest.
Rather, I think that may be more of a
symptom of smaller deals making up
a larger proportion of the total M&A
picture. It’s often the case in PE, too,
that sponsors in the small and middle
markets will over-equitize transactions
because they’re planning to pursue a
rollup and will gradually add leverage
as they add assets.
The last time we spoke, we touched
upon those sectors that could
withstand market and economic
volatility and you cited the healthcare
and tech sectors as potential
destinations for dealmakers. Are there
any other industries that may show
similar activity during the balance of
the year?
To me, the tech sector still stands out,
particularly as IPOs become harder
and harder to price and as VCs seek
to monetize investments from over
the past five years. I don’t know that
the number of deals, or the total deal
values, in the sector at the end of
2016 will eclipse last year, necessarily,
but relative to other industries, there
should continue to be a lot of activity.
Beyond the closing of the IPO window,
you also have public targets that have
failed to show the kind of growth
shareholders expect. When public tech
companies plateau, it often presents
a great opportunity for PE to come
in and drive renewed growth. TPG’s
participation in the spinout of Intel
Security is a good example. Meanwhile,
some of the larger deals from earlier
in the year are creating opportunities
downstream. The merger between Dell
and EMC, for instance, saw Francisco
Partners and Elliott Management
swoop in to buy the Dell Software
Group, comprised of Quest Software
and SonicWALL.
On the other end of the spectrum, you
will likely start to see sponsors feel
around for a bottom in some other,
more distressed sectors. Energy, for
instance, could represent an area
where sponsors hunt for value. The
Enbridge acquisition of Spectra Energy
Corp., for instance, underscores
how motivated sellers are in this
environment. And let’s not forget that
this is a sector in which many sponsors
have built up considerable domain
expertise and are well positioned to
pick through the space to find the
most appealing assets.
What are you hearing from clients
regarding their ability to find value in
this market?
To be honest, it’s really tough. Those
that are willing to pay up to win a
deal are often bringing something to
the table in the form of a specialized
skillset that can drive value post
close. The value sponsors do find
in this market isn’t necessarily in
looking at the trailing 12-month
EBITDA and applying a multiple to
that; it’s in seeing something that
other prospective buyers don’t, either
because the investors can bring
resources to bear to drive growth or
because they recognize something
nobody else can.
The Francisco Partners deal for the
Dell assets is a good example of the
type of acquisition in which the buyers
are bringing relevant expertise and
also taking on a situation—a corporate
carveout—that often requires a hands-
on owner with experience in these
types of deals.
MAKE WAY FOR
SMARTER, ON-THE-FLY MEETING PREP
US +1 206.623.1986
UK +44 (0)207.190.9809
pitchbook.com
Introducing PitchBook Mobile. The same excellent data, technology
and service from the PitchBook Platform, now available on a mobile
device.
Search:
“PitchBook”Available for
CO-SPONSORED BYSPONSORED BY

PE groups show resilienceFundraising
Despite the fact that PE groups
closed the same number of funds
this quarter as last, the value of those
funds dropped rather sharply, about
40% QoQ, to just $33 billion. Though it
had been on pace for a post-recession
record, capital raised in 2016 is now
poised to be about equal with the last
few years.
Through the first three quarters of the
year, traditional buyout funds have
made up 81% of the capital raised and
66% of the funds that have closed—
both the highest since at least 2006.
The median buyout fund has raised
$225 million thus far in 2016. That
figure is up from $165 million in 2015
and constitutes the highest median
buyout fund size since 2010, which is
indicative of LPs’ recent preference
toward fewer and larger funds.
Moreover, the number of traditional
buyout funds, as a percentage of
Capital raised jumps higher, even as volume declines
US PE fundraising
total final closes, has increased every
year since 2012. One trend we’ve also
noticed lately is a tendency for buyout
shops to expand their strategies
and participate in growth capital. So
while traditional growth funds have
accounted for a lesser proportion of all
funds raised, the strategy is certianly
still alive.
Mezzanine fundraising is on track for
its slowest year in recent memory with
just $2.8 billion raised through the
first three quarters, a result of investor
preference toward safer, secured
notes in times of macroeconomic
uncertainty.
As we’ve noted previously, 2016 has
seen subdued energy fundraising,
with just $11.1 billion raised across 15
vehicles. After a strong year in 2015,
which saw approximately $38 billion
raised, energy funds have been wary
to put that capital to work. A big driver
here is that oil and gas prices have
remained low for much longer than
many investors had expected. At the
time of this writing, WTI Crude Oil
is trading around $50 a barrel—well
above its $30 lows earlier in the year
and approaching the break-even prices
that many exploration companies
require. If the price of crude can
stabilize or even increase from here,
deal flow in this sector should pick up
substantially.
Through the third quarter, 90% of
funds have hit their stated target,
higher than any other year in our
dataset. This figure is somewhat
contradictory to the recent news that
many LPs are looking to slash their
alternative asset allocations, which will
be something to monitor closely in the
months ahead.
$29
$22
$18
$18
$24
$26
$24
$29
$36
$72
$27
$70
$51
$60
$28
$55
$54
$35
$41
$63
$53
$56
$33
47 39
52 45
62
71
93
67 74 74
78
57
1Q 2Q 3Q 4Q 1Q 2Q 3Q 4Q 1Q 2Q 3Q 4Q 1Q 2Q 3Q 4Q 1Q 2Q 3Q 4Q 1Q 2Q 3Q
2011 2012 2013 2014 2015 2016
Capital Raised ($B)
# of Funds Closed
Source: PitchBook
14 PITCHBOOK 3Q 2016 US PE BREAKDOWN
CO-SPONSORED BYSPONSORED BY

US PE funds (#) to hit target
Both buyout funds and the overall PE fund population
for 2016 are at the highest level in years
Median US PE fund size ($M)
Closing times above last year’s pace
Average US PE fund closing times (months)
By count, buyout funds accounted for a record
proportion of fundraising through 3Q 2016
US PE funds (#) by type
$165.0
$225.0
$173.0
$0
$50
$100
$150
$200
$250
$300
$350
2006 2007 2008 2009 2010 2011 2012 2013 2014 2015 2016*
Buyout Funds All PE Funds
0%
10%
20%
30%
40%
50%
60%
70%
80%
90%
100%
2006 2007 2008 2009 2010 2011 2012 2013 2014 2015 2016*
Hit Target Missed Target
0%
10%
20%
30%
40%
50%
60%
70%
80%
90%
100%
2006
2007
2008
2009
2010
2011
2012
2013
2014
2015
2016
*
Other
Co-Investment
Mezzanine
Energy
PE Growth-Expansion
Buyout
15.12
17.91
16.69
8
11
14
17
20
2006 2007 2008 2009 2010 2011 2012 2013 2014 2015 2016*
Buyout Funds All PE Funds
Buyout funds have seen relative growth every year since 2013 and now stand at 66% of vehicles raised in 2016.
90% of all PE funds hit their fundraising targets through 3Q 2016.
15 PITCHBOOK 3Q 2016 US PE BREAKDOWN
CO-SPONSORED BYSPONSORED BY
Source: PitchBook
*As of 9/30/2016
Source: PitchBook
*As of 9/30/2016
Source: PitchBook
*As of 9/30/2016
Source: PitchBook
*As of 9/30/2016

League tables3Q 2016
ABRY Partners 12
HarbourVest Partners 12
Audax Group 9
Kohlberg Kravis Roberts 9
Apollo Global Management 7
Huron Capital Partners 7
CIP Capital 6
Genstar Capital 6
Golden Gate Capital 6
Stone Point Capital 6
Apax Partners 5
Five Points Capital 5
Great Point Partners 5
Gryphon Investors 5
H.I.G. Capital 5
Hellman & Friedman 5
Marlin Equity Partners 5
New Mountain Capital 5
The Jordan Company 5
The Riverside Company 5
Thoma Bravo 5
Vista Equity Partners 5
Warburg Pincus 5
Kirkland & Ellis 56
Latham & Watkins 27
DLA Piper 18
Goodwin Procter 16
Jones Day 14
Morgan, Lewis & Bockius 12
Sidley Austin 12
Paul, Weiss, Rifkind, Wharton & Garrison
11
Paul Hastings 10
Ropes & Gray 10
Weil, Gotshal & Manges 10
Cooley 9
Debevoise & Plimpton 9
Skadden, Arps, Slate, Meagher & Flom
9
Andrews Kurth 7
Dechert 6
Dentons 6
Gibson, Dunn & Crutcher 6
Honigman Miller Schwartz & Cohn
6
Morris Manning & Martin 6
Bass, Berry & Sims 5
Cahill Gordon & Reindel 5
Locke Lord 5
McDermott Will & Emery 5
McGuireWoods 5
O’Melveny & Myers 5
Simpson Thacher & Bartlett 5
Willkie Farr & Gallagher 5
Winston & Strawn 5
Most active investors by deal count Most active law firms by deal count
Antares Capital 22
Golub Capital 10
Twin Brook Capital Partners 10
Bank of America 7
BMO Harris Bank 7
Wells Fargo 7
Barclays 6
Houlihan Lokey 15
The Goldman Sachs Group 13
Duff & Phelps 11
Barclays 10
Raymond James Financial 10
Robert W. Baird & Co. 10
Evercore Group 9
Lincoln International 9
Moelis & Company 8
Morgan Stanley 8
RBC Capital Markets 8
Harris Williams & Co. 7
Bofa Merrill Lynch 6
J.P. Morgan 6
Cascadia Capital 5
Wells Fargo Securities 5
Most active advisors by deal count
Most active lenders by deal count
Deutsche Bank 6
MidCap Financial 6
J.P. Morgan 4
Madison Capital Funding 4
NXT Capital 4
PrivateBancorp 4
RBC Capital Markets 4
The Goldman Sachs Group 4
Most active lenders by deal count, ctd.
16 PITCHBOOK 3Q 2016 US PE BREAKDOWN
CO-SPONSORED BYSPONSORED BY
Source: PitchBook
Source: PitchBook
Source: PitchBook
Source: PitchBook

See how the PitchBook Platform can
help your private equity firm close your
next deal.
We do EBITDA multiples,private comps,valuations,market trends,growth metrics.
You build a better portfolio.