actnowaste domestic waste audit report december 09
TRANSCRIPT

Kerbside Domestic Waste & Recycling
Audit
FOR
ACT NoWaste
December 2009
APRINCE CONSULTING PTY LTD TRADING AS APC
ACN 077 504 226 4/28 West Street, North Sydney NSW 2060 ~ Phone: 612 9907 0994 Fax: 612 9907 0330
Web: www.aprince.com.au E-mail: [email protected]

Domestic Waste Audit 2009 ACT NOWaste
__________________________________________________________________________________
2009 - DEC Page 2
This report was researched and prepared by
APrince Consulting Pty Ltd trading as APC Environmental Management ACN 077 504 226 Email: [email protected] Web: www.aprince.com.au
for
ACT NoWaste Department of Territory & Municipal Services GPO Box 158 Canberra City ACT 2601 Tel: (02) 6205 2672 Fax: (02) 6207 6255 December, 2009 © 2009 APC DISCLAIMER Any representation, statement, opinion or advice, expressed or implied in this publication is made in good faith, but on the basis that APC is not liable (whether by reason of negligence, lack of care or otherwise) to any person for any damage or loss whatsoever, which has occurred or may occur in relation to that person taking or not taking (as the case may be) action in respect to any representation, statement of advice referred to here.
Sydney 4/28 West Street North Sydney NSW 2084 Phone: (02) 9907 0994 Fax: (02) 9907 0330
Domestic Waste Audit 2009 ACT NOWaste
__________________________________________________________________________________
2009 - DEC Page 3
TABLE OF CONTENTS
DEFINITIONS .............................................................................................................................................5
EXECUTIVE SUMMARY...............................................................................................................................6
1. BACKGROUND .................................................................................................................................10
2. INTRODUCTION.................................................................................................................................11
3. METHODOLOGY...............................................................................................................................12
3.1 Sample Size................................................................................................................................................12 3.2 Sample Selection........................................................................................................................................13 3.3 Sample Collection ......................................................................................................................................13 3.4 Sorting........................................................................................................................................................15 3.5 Equipment ..................................................................................................................................................15 3.6 Occupational Health & Safety ..................................................................................................................15 3.7 Data Entry and Analysis............................................................................................................................16 3.8 Study limitations .......................................................................................................................................16 4. KEY FINDINGS......................................................................................................................................18
5. RESULTS...........................................................................................................................................20
5.1 Garbage.....................................................................................................................................................20 5.2 Recycling .................................................................................................................................................23 5.3 Total Waste Stream...................................................................................................................................26 5.4 Key Performance Indicators .....................................................................................................................29 5.5 Recovery Rates .........................................................................................................................................30 6. COMPARISONS WITH PREVIOUS AUDITS .........................................................................................35
7. STAKEHOLDER FEEDBACK ....................................................................................................................44
7.1 Cleanaway Transpacific Ltd .....................................................................................................................44 7.2 Thiess Services .........................................................................................................................................45 7.3 Summary...................................................................................................................................................45 8. CONCLUSION ...................................................................................................................................46
9. RECOMMENDATIONS.......................................................................................................................48
APPENDIX A – LIST OF RECYCLABLE MATERIALS .......................................................................................49
APPENDIX B – COMPOSITION OF GARBAGE STREAM ...............................................................................50
APPENDIX C – COMPOSITION OF THE RECYCLING STREAM.......................................................................51
Domestic Waste Audit 2009 ACT NOWaste
__________________________________________________________________________________
2009 - DEC Page 4
TABLES AND CHARTS
Table 1 -Private Dwellings by Structure, ACT, 2006 ....................................................................... 12 Table 2 – Number of Samples by Suburb ......................................................................................... 14 Table 3 – Material Sorting Categories .............................................................................................. 15 Table 4 – Key Performance Indicators 2007 - 2009 ......................................................................... 19 Table 5 - Consolidated Composition of the Garbage Stream............................................................ 20 Table 6 - Garbage Stream Composition (Minor Categories) ............................................................ 21 Table 7 - Consolidated Garbage - Weights per Dwelling per Week................................................. 22 Table 8 - Consolidated Composition of the Recycling Stream ......................................................... 24 Table 9 - Consolidated Recycling - Weights per Dwelling per Week .............................................. 25 Table 10 - Consolidated Waste Stream (per Dwelling per Week) and Diversion Rates................... 27 Table 11 - Actual and Potential Diversion Rates...............................................................................29 Table 12 – Recovery Rates for Major Classes of Materials – Single Dwellings .............................. 30 Table 13 - Recovery Rates for Major Classes of Materials - Multi-unit Dwellings ......................... 31 Table 14 - Recovery Rates for Major Classes of Materials - All Dwellings..................................... 32 Table 15 – Volume of Garbage Bins Used (Single Dwellings Only) ............................................... 34 Table 16 – Volume of Recycling Containers Used (Single Dwellings Only)................................... 34 Table 17 - Consolidated Composition of Garbage – Waste Stream Categories................................ 35 Table 19 – Consolidated Composition of Recycling Categories ...................................................... 38 Table 20 - Detailed Composition of Recycling Stream -Comparison with 2007 Audit.................... 39 Table 21 - Recovery Rates - All Dwellings - Comparison with Previous Audits ............................. 41 Chart 1 Consolidated Composition of the Garbage Stream .............................................................. 20 Chart 2 Composition of the Garbage Stream (Major Categories) ..................................................... 21 Chart 3 - Consolidated Garbage - Average Weights per Dwelling per Week................................... 22 Chart 4 - Composition of the Recycling Stream ............................................................................... 23 Chart 5 - Consolidated Composition of the Recycling Stream ......................................................... 25 Chart 6 - Consolidated Recycling - Weight s per Dwelling per Week ............................................. 26 Chart 7 - Consolidated Total Waste Stream (per Dwelling per Week) ............................................. 27 Chart 8 - Total Waste Stream (kg/household/week) by Dwelling Type ........................................... 28 Chart 9 - Actual and Potential Diversion .......................................................................................... 29 Chart 10 – Recovery Rates for Major Classes of Materials – Single Dwellings............................... 31 Chart 11 - Recovery Rates for Major Classes of Materials - MUDs................................................. 32 Chart 12 - Recovery Rates for Major Classes of Materials - All Dwellings ..................................... 33 Chart 13 - Consolidated Composition of Garbage - Comparison with Previous Audits................... 35 Chart 14 – Detailed Composition of Garbage Stream – Comparison with 2007 Audit .................... 37 Chart 15 - Consolidated Composition of Recycling - Comparison with Previous Audits ................ 38 Chart 16 – Detailed Composition of Recycling Stream – Comparison with 2007 Audit ................. 40 Chart 17 - Total Waste Generation - Comparison with Previous Audits .......................................... 41 Chart 18 - Recovery Rates - All Dwellings - Comparison with Previous Audits ............................. 42 Chart 19 - Diversion Rates by Dwelling Type - Comparison with Previous Audits ........................ 42 Chart 20 - Key Performance Indicators, All Dwelling -Comparison with Previous Audits ............. 43
Domestic Waste Audit 2009 ACT NOWaste
__________________________________________________________________________________
2009 - DEC Page 5
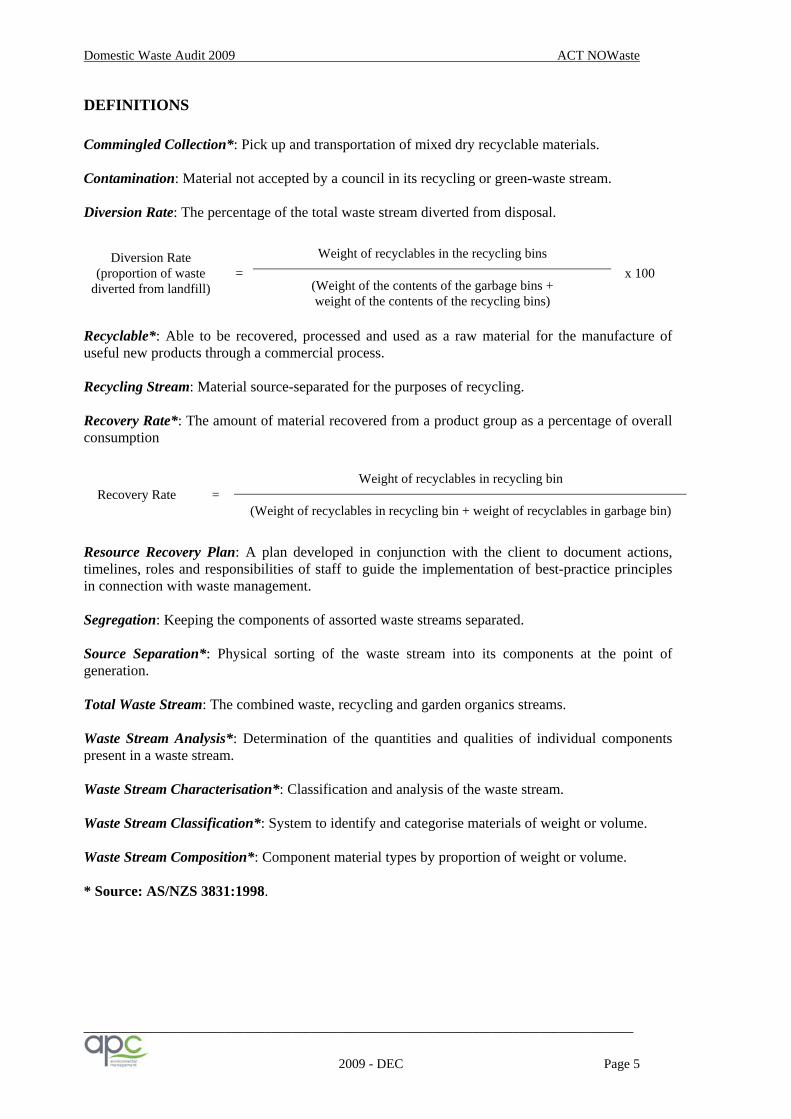
DEFINITIONS Commingled Collection*: Pick up and transportation of mixed dry recyclable materials. Contamination: Material not accepted by a council in its recycling or green-waste stream. Diversion Rate: The percentage of the total waste stream diverted from disposal.
Weight of recyclables in the recycling bins Diversion Rate (proportion of waste
diverted from landfill) =
(Weight of the contents of the garbage bins + weight of the contents of the recycling bins)
x 100
Recyclable*: Able to be recovered, processed and used as a raw material for the manufacture of useful new products through a commercial process. Recycling Stream: Material source-separated for the purposes of recycling. Recovery Rate*: The amount of material recovered from a product group as a percentage of overall consumption
Weight of recyclables in recycling bin Recovery Rate =
(Weight of recyclables in recycling bin + weight of recyclables in garbage bin) Resource Recovery Plan: A plan developed in conjunction with the client to document actions, timelines, roles and responsibilities of staff to guide the implementation of best-practice principles in connection with waste management. Segregation: Keeping the components of assorted waste streams separated. Source Separation*: Physical sorting of the waste stream into its components at the point of generation. Total Waste Stream: The combined waste, recycling and garden organics streams. Waste Stream Analysis*: Determination of the quantities and qualities of individual components present in a waste stream. Waste Stream Characterisation*: Classification and analysis of the waste stream. Waste Stream Classification*: System to identify and categorise materials of weight or volume. Waste Stream Composition*: Component material types by proportion of weight or volume. * Source: AS/NZS 3831:1998.

Domestic Waste Audit 2009 ACT NOWaste
__________________________________________________________________________________
2009 - DEC Page 6
EXECUTIVE SUMMARY
ACT NoWaste engaged APC Environmental Management to conduct a Domestic Waste and Recycling Audit at the kerbside.
The objectives of this study were to:
• Determine the contents of a representative sample of domestic waste and recycling bins using methodology consistent and comparable with previous surveys;
• Analyse and report on trends and opportunities to further improve recycling and assist with community education programs conducted by ACT NoWaste; and
• Make recommendations on how this information might be used to reduce waste
and increase recycling recovery.
The waste audit was conducted during the week commencing 4th May, 2009 during which time 259 garbage samples and 155 recycling samples were collected over five days from randomly selected households using a stratified sampling method. The household types selected were in proportion with the housing stock within the ACT and included both single and multi-unit dwellings (MUDs). In October 2009 two problems were discovered with the original MUDs that had been sampled in the May audit. The MUDs selected that used MGBs exclusively for both garbage and recycling were in fact aged care units and were therefore considered atypical. Furthermore the MUD block selected as the sample that used hoppers for both garbage and recycling had been emptied by the contractor on a different collection day for the schedule of that area which meant less than one day’s worth of waste had been collected. On consideration of these issues requested that APC conduct a new representative audit of MUDs to provide a more typical data set and to incorporate these findings into an amended final report. This report contains the original data from single dwellings audited in May 2009 and the MUD data from November 2009. In May 2009, 3.5 tonnes of domestic waste was sorted into 38 agreed categories over five consecutive days for the original audit and an additional 700 kgs were collected and sorted from MUD’s only in November, 2009. In total over 4.2 tonnes of waste was sorted for this project. The key findings of the 2009 domestic waste audit are summarised as follows: Total Waste Generation – The overall waste generation for ACT has dropped from 16.37kg per household per week in 2007 to 14.52kg in 2009. This result represents a major decrease in household waste generation, which could be due to many external influences and factors but the most likely candidate is the variations in consumption and disposal patterns due to seasonality. The 2007 audit was conducted in November (spring – summer) and the 2009 in May (autumn – winter). Other factors that could also contribute include the economic downturn, household size, disposable income, education, home ownership and random variation.
Domestic Waste Audit 2009 ACT NOWaste
__________________________________________________________________________________
2009 - DEC Page 7
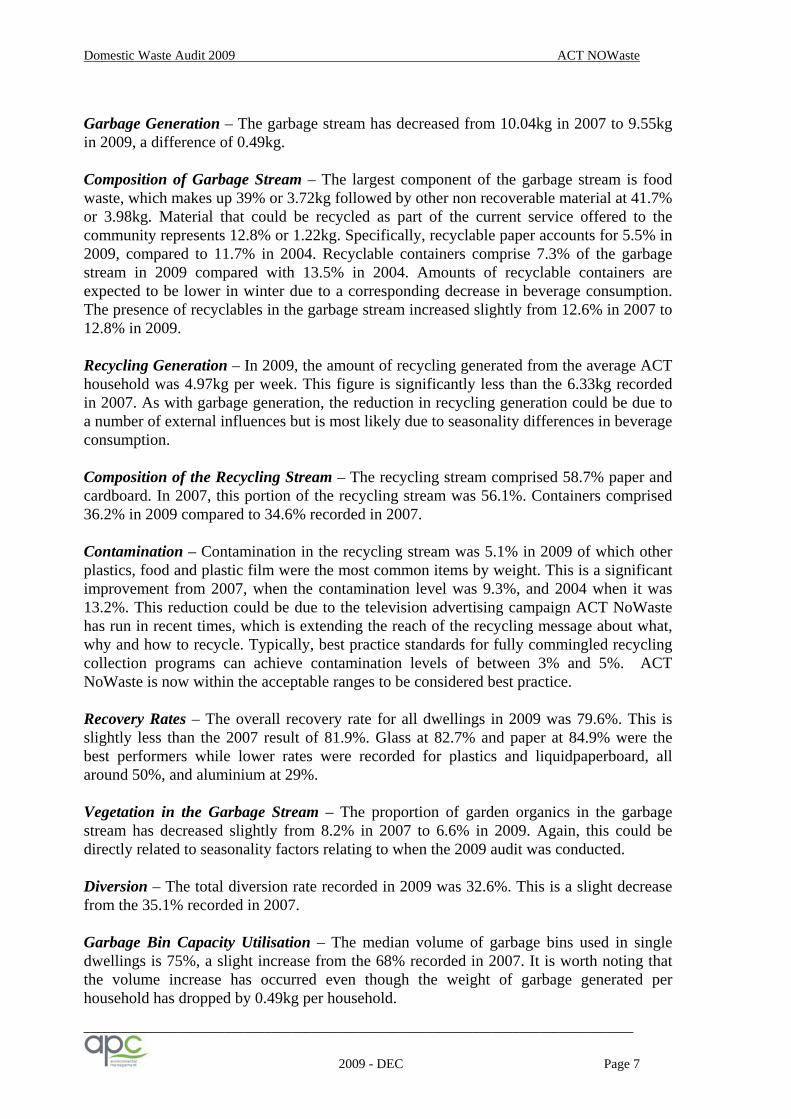
Garbage Generation – The garbage stream has decreased from 10.04kg in 2007 to 9.55kg in 2009, a difference of 0.49kg. Composition of Garbage Stream – The largest component of the garbage stream is food waste, which makes up 39% or 3.72kg followed by other non recoverable material at 41.7% or 3.98kg. Material that could be recycled as part of the current service offered to the community represents 12.8% or 1.22kg. Specifically, recyclable paper accounts for 5.5% in 2009, compared to 11.7% in 2004. Recyclable containers comprise 7.3% of the garbage stream in 2009 compared with 13.5% in 2004. Amounts of recyclable containers are expected to be lower in winter due to a corresponding decrease in beverage consumption. The presence of recyclables in the garbage stream increased slightly from 12.6% in 2007 to 12.8% in 2009. Recycling Generation – In 2009, the amount of recycling generated from the average ACT household was 4.97kg per week. This figure is significantly less than the 6.33kg recorded in 2007. As with garbage generation, the reduction in recycling generation could be due to a number of external influences but is most likely due to seasonality differences in beverage consumption. Composition of the Recycling Stream – The recycling stream comprised 58.7% paper and cardboard. In 2007, this portion of the recycling stream was 56.1%. Containers comprised 36.2% in 2009 compared to 34.6% recorded in 2007. Contamination – Contamination in the recycling stream was 5.1% in 2009 of which other plastics, food and plastic film were the most common items by weight. This is a significant improvement from 2007, when the contamination level was 9.3%, and 2004 when it was 13.2%. This reduction could be due to the television advertising campaign ACT NoWaste has run in recent times, which is extending the reach of the recycling message about what, why and how to recycle. Typically, best practice standards for fully commingled recycling collection programs can achieve contamination levels of between 3% and 5%. ACT NoWaste is now within the acceptable ranges to be considered best practice. Recovery Rates – The overall recovery rate for all dwellings in 2009 was 79.6%. This is slightly less than the 2007 result of 81.9%. Glass at 82.7% and paper at 84.9% were the best performers while lower rates were recorded for plastics and liquidpaperboard, all around 50%, and aluminium at 29%. Vegetation in the Garbage Stream – The proportion of garden organics in the garbage stream has decreased slightly from 8.2% in 2007 to 6.6% in 2009. Again, this could be directly related to seasonality factors relating to when the 2009 audit was conducted. Diversion – The total diversion rate recorded in 2009 was 32.6%. This is a slight decrease from the 35.1% recorded in 2007. Garbage Bin Capacity Utilisation – The median volume of garbage bins used in single dwellings is 75%, a slight increase from the 68% recorded in 2007. It is worth noting that the volume increase has occurred even though the weight of garbage generated per household has dropped by 0.49kg per household.

Domestic Waste Audit 2009 ACT NOWaste
__________________________________________________________________________________
2009 - DEC Page 8
Recycling Bin Capacity Utilisation – The average volume of recycling bins used in single dwellings in 2009 was 80%, very similar to the 76% recorded in 2007. Overall, the results of the 2009 audit show a significant improvement in performance in the areas of contamination and an improvement in waste generation and green waste present in the garbage stream over the 2007 audit results. However, diversion and recovery have declined slightly and the amount of recyclables in the garbage stream has increased slightly over the 2007 results It is understood ACT NoWaste has spent considerable funds on a high profile communication program which appears, from the audit results, not to have achieved the desired results of a higher yield in this season. However, given the known impacts of seasonality on waste generation, consumption and disposal practices we urge some caution in these results as while they may be typical of this season they may not be truly representative of the annual results. Audits provide indicative data and provide detailed information on waste and recycling composition however, information on trends in generation and diversion are better looked at over a longer term by reference to weighbridge dockets which confirm seasonal fluctuations and are more reliable. This audit has identified that the greatest opportunity for improvement is in MUDs using hoppers, which currently contain the largest amount of recyclables in the garbage stream not diverted for recycling. Future education and communication efforts must concentrate on improving the performance of MUDs. A review of current education strategies to reach MUD residents should be undertaken. Focus should also be increasing the recovery of all materials but in particular the heaviest materials, being paper and glass which by weight represent 85.7% of the recycling stream. This year, the overall diversion rate fell slightly from 35.1% to 32.6%. For ACT NoWaste to increase diversion further the focus has to be on recycling performance in MUD’s with hoppers and organics recovery as food recovery has a potential to increase diversion by a further 25.6% with garden organics contributing a further 4.3% while the most the recycling service can achieve is 8.4%. If recyclables and organics are recovered the maximum diversion possible is 70.9%. Many other municipal waste management programs nationally are achieving in excess of 60% diversion through both recycling and organic diversion. Organics are recovered by either source separation and the provision of an additional mobile garbage bin or by Advance Waste Treatment (AWT) recovery. The greatest opportunity for ACT NoWaste to improve the performance of the waste management system for domestic premises is to increase diversion from landfill by managing the organic fraction of the waste stream and in particular the food waste component. This component represents 51.6 % of the current bin contents and includes food and kitchen waste (39%), disposable and contaminated paper (6%) and garden waste (6.6%).

Domestic Waste Audit 2009 ACT NOWaste
__________________________________________________________________________________
2009 - DEC Page 9
Other councils nationally have offered garden waste services to their residents and are now incorporating food waste collections. Many council’s have moved garbage service collection frequency to fortnightly and organics collection to weekly. However, the ACT has encouraged its residents to manage green waste on-site or by engaging private contractors. This now presents a dilemma as to how to undertake a program to extract the small amount of garden waste and the considerable amount of food waste from the garbage stream. The use of Alternate Waste Technologies (AWT) to process the entire residual waste stream is one clear option available. While the waste audit provides a snapshot of current waste generation, consumption and disposal patterns from a randomly selected stratified number of households, it is only one piece of information that the ACT needs if it is to undertake a full review of current waste management in its quest for greater performance. APC would recommend the following activities are also undertaken: 1. That ACT NoWaste undertake an Operational Review and Communication Audit to
ascertain how the existing service is being delivered, interaction with residents and what methods and means are used to communicate with the community about the recycling service.
2. That emphasis be placed on communicating with residents living in multi-unit
dwellings in relation to recycling performance as this is where a substantial amount of recyclables are evident in the garbage stream and greatest opportunity lies.
3. Ongoing education, communication and motivation of the broader community are
necessary to maintain current recycling performance. The method and means to undertake this activity may become clearer after the Communications Audit is undertaken. However, it is generally accepted that multi-pronged comprehensive campaigns desired to reach all sectors of the community achieve the greatest results
4. Options for processing the residuals to recover the organic fraction of the waste stream
and in particular the food waste and the recyclables still in the garbage stream need to be investigated. Such a process can target 60% of the current garbage bin contents and greatly reduce the future needs for landfill capacity.
Domestic Waste Audit 2009 ACT NOWaste
__________________________________________________________________________________
2009 - DEC Page 10
1. BACKGROUND ACT NoWaste is a business unit within the Department of Territory and Municipal Services of the ACT Government. It has responsibility for the management of municipal waste and recycling services, infrastructure and landfill. It also holds responsibility for the planning, design and construction of future landfill and recycling capacity to cater for the needs of the city of Canberra. ACT NoWaste is seeking accurate information in relation to current waste management practices in the ACT including data on the volumes and composition of waste to landfill from all sources, which will assist ACT NoWaste to:
• Review and develop waste avoidance and recycling strategies and policies; • Identify sectors that are producing large quantities of waste for landfill disposal; • Identify wastes that could potentially be recycled or reduced; • Assist with planning for future waste and resource recovery services and
infrastructure.
ACT NoWaste engaged APC Environmental Management (APC) to undertake the following three separate but related projects:
1. Waste To Landfill Composition Study 2. Domestic Waste and Recycling Audits of kerbside collected municipal waste 3. MRF residual waste audit
Currently, the domestic waste stream generates 59,000 tonnes of waste per annum and 45,500 tonnes of recyclables are generated from the kerbside collection program and the drop off system that operates throughout the city.
The ACT Government has conducted five prior domestic waste composition audits in 2001, 2003, 2004, 2005 and 2007 of which APC undertook four audits. Comparisons between the 2009, the 2007 and the 2004 results have been provided within this report to show trends.
ACT NoWaste set out in its initial brief, the following project objectives:
• Determine the contents of a representative sample of domestic waste and recycling bins using methodology consistent and comparable with previous surveys; and
• Analyse and report on trends and opportunities to further improve recycling and assist with community education programs conducted by ACT NoWaste.
This report relates solely to the domestic kerbside waste and recycling audit from ACT households.
Domestic Waste Audit 2009 ACT NOWaste
__________________________________________________________________________________
2009 - DEC Page 11
2. INTRODUCTION The scope of works specifies the following information in relation to current service provision. 2.1 Single Dwellings – Approximately 115,000 households in the ACT are single dwellings (houses) that use 140-litre bins for garbage collected weekly. There are 117,000 recycling services that use a 240-litre bin for fully commingled recyclables collected fortnightly.
2.2 Multi-unit Dwellings - (blocks of units or MUDs) have a range of bins for garbage from 240-litre, 1.5m3, 3m3 or 4.5m3. Recyclables are collected fully commingled in 240-litre or 1.1m3 bins. 20,000 MUD dwellings are provided with hoppers for domestic waste services while 11,000 MUD dwellings are provided with hoppers for recyclable materials. The garbage hoppers are collected weekly or twice weekly while the recycling hoppers are collected fortnightly, weekly or twice a week, depending on the block. Recycling bins are collected fortnightly or sometimes weekly.
2.3 Recycling System – materials accepted: • All paper including writing paper, junk mail, newspapers, magazines, paper
packaging, flattened cardboard boxes, envelopes, egg cartons, telephone books, etc; • Corrugated cardboard including beer cartons and pizza boxes;
• All glass bottles and jars;
• All cartons including all fruit juice, milk and laundry cartons;
• All rigid plastic bottles and containers including polyethylene terephthalate (or PET), high-density polyethylene (HDPE) and polyvinyl chloride (PVC), polypropylene (PP), non-expanded polystyrene (PS - plastic type 6) and other rigid plastic containers
• Steel cans; and
• Aluminium cans, trays and foil.

Domestic Waste Audit 2009 ACT NOWaste
__________________________________________________________________________________
2009 - DEC Page 12
3. METHODOLOGY 3.1 Sample Size The statement of requirements specifies that the methodology used for this component should be consistent and comparable with previous surveys.
APC conducted prior domestic audits in 2001, 2003, 2004 and 2007. The 2007 sample size was 250 households. Using actual household data from audits carried out by APC in the ACT, we have calculated that confidence intervals of ± 7% were achieved when this sample size was used.
Previously, the samples were stratified for single-unit dwellings (SDs) and multi-unit dwellings (MUDs) according to the proportion of all residences in Canberra, which were defined as follows:
SDs – Separate houses/duplexes/townhouses – These are considered as separate dwellings as they usually have one set of waste containers to each household. MUDs – Medium density or high rise flats – These are usually ‘three-storey walk-ups’ or blocks of six or more storeys with elevators and secure entry. These have shared garbage and recycling containers and varying waste arrangements but usually communal garbage containers or bulk bins.
APC’s statistician advised that in accordance with the NSW DECC Guidelines,1 suitable sample sizes for producing reliable estimates of proportions of waste in the domestic waste stream at 10% uncertainty at the 90% confidence level, generally lie between 191 and 260 households. In the case of this audit, the preferred number of sample households is 250, as this number lies between recognised limits, and was also the number used in previous audits.
The 2007 sample of 250 comprised 190 samples from single dwellings and 60 samples from MUDs for garbage. 125 households were sampled for recycling. The following table shows numbers of occupied private dwellings (i.e. households) in the ACT in the year of 2006 tabulated by structure:
Table 1 - Private Dwellings by Structure, ACT, 2006 Dwelling Structure Number Per cent Separate house 89,219 76% Semi-detached, row/terrace, townhouse 15,661 13% Flats up to 3 storeys 9,164 8% Flats 4+ storeys 2,625 2% Other, Not Stated 249 0% Total 116,918 100%
Data source: ABS 2006 Census of Population and Housing,
APC proposed that sample numbers should reflect these proportions as closely as is practical. Thus, it was recommended that, as in the previous audit, the sample consist of 190 separate dwellings and 60 multi-unit dwellings (MUDs). Within the MUDs sample, approximately 30 (50%) should have MGBs for recycling and 30 (50%) have hoppers.
1 Department of Environment and Climate Change NSW. Guidelines for Conducting Household Kerbside Residual Waste, Recycling and Garden Organics Audits in NSW Local Government Areas, 2008
Domestic Waste Audit 2009 ACT NOWaste
__________________________________________________________________________________
2009 - DEC Page 13
3.2 Sample Selection Samples should be taken from as wide a range of suburbs as possible and from all daily collection zones. Samples from single households were collected as sequences of occupied dwellings, starting at a specified corner or address whereas multi-unit dwellings (MUDs) were identified by street address. The project aimed to collect 52 households per day over five consecutive week day morning’s prior to the normal scheduled collection as this is a naturally stratified sample by collection day. Samples were randomly selected from a Bins Database supplied by ACT NoWaste. The selected addresses were then checked to determine the respective garbage and recycling service days for single dwellings from an online calendar and supporting web information. For MUDs, the collection day/s, bin size, type and number were referenced from a spreadsheet provided by the contractor and ACT NoWaste. The sample was stratified for single dwellings (SDs) and multi-unit dwellings (MUDs) according to the proportions reported in the 2006 Census. (Refer to Table 1 on page 8.) A number of sample collection starting points were selected randomly without replacement within stratified records from the bins database. The households to be audited were those nearest the selected sample collection starting points. In the case of multi-unit dwellings, all households in each unit block selected were audited, since garbage and recycling facilities are often communal. For single dwellings, because the recycling collection is fortnightly, half the garbage samples were selected from the recycling zone and half from the non-recycling zone. In this way, the equivalent of one week’s worth of garbage and recycling was collected for all the single dwelling households in the sample, without the need to adjust the data. In October 2009, ACT NoWaste identified two problems with the original MUD’s data from the May audit. The MUDs selected that used mobile garbage bins (MGBs) exclusively for both garbage and recycling were aged care units and were therefore considered atypical of MUD’s generally. Furthermore, the MUD block selected as the sample that used hoppers for both garbage and recycling had been emptied by the contractor on a different collection day to the schedule for that area unbeknown to the consultants which meant less than one day’s worth of waste had been collected. On consideration of these issues ACT NoWaste requested that APC conduct a new representative audit of MUDs to provide a more typical data set and to incorporate these findings into an amended final report. The new MUD addresses to be audited were selected by ACT NoWaste.
3.3 Sample Collection In the initial audit on the morning of the normal collection service, waste from up to 10 single dwelling households nearest the randomly selected starting points was collected and up to four starting points were selected each day to make up the sample size.
Domestic Waste Audit 2009 ACT NOWaste
__________________________________________________________________________________
2009 - DEC Page 14
In the subsequent MUD audit in November, ACT NoWaste staff collected recycling from the 2nd MUD address in Watson and the remainder of the collections was undertaken by APC staff. Samples of garbage and recycling were collected in bags from the selected locations just prior to the regular collection service. Each bag was labelled with a code to identify whether it contained garbage or recycling and assigned a number from the data collection sheet. The name of the street and house number from which waste was collected was recorded on the data collection sheet where the volume of the bins collected was also recorded. To ensure only positive public relations with the community, APC requested ACT NoWaste to provide a representative to accompany the collection crew for the duration of the sample collections to deal with any questions or complaints from residents. ACT NoWaste prepared an information sheet printed on ACT Government letterhead which was provided to any concerned residents in both the initial and subsequent MUD audit. For both audits APC’s collection crew consisted of three people, two who emptied the bins and one whose sole task was to record sample data codes, estimate bin content volume and label sample bags. In this way, accurate data collection is guaranteed and safe work conditions are provided for all staff. All bags were placed in a truck hired for the purpose and transported to the sorting location for sorting. In the November audit one of the MUD’s had a weekly recycling frequency and all material was collected. In the case of the other MUD a fortnightly recycling system was in place so while all the material was collected only half of the material was sorted to give a representative sample.
It should be noted that when sampling large complexes, it is hard to be as sure of the quantities generated per unit without sampling all units.
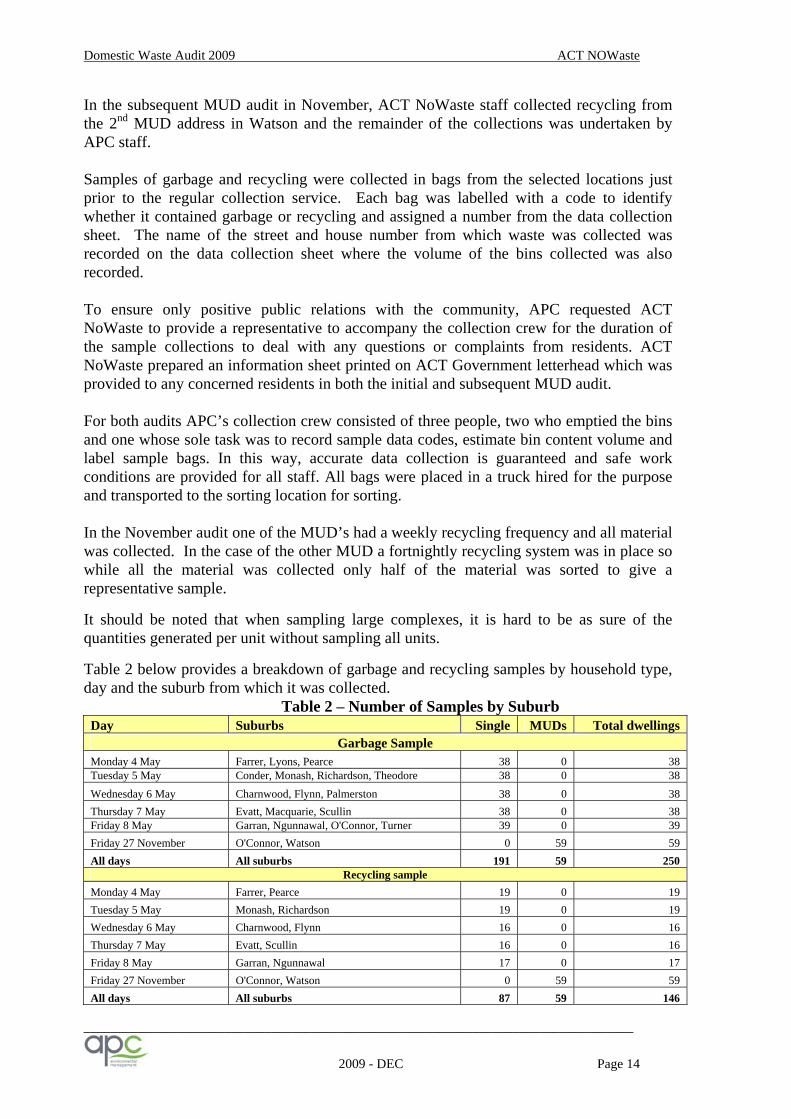
Table 2 below provides a breakdown of garbage and recycling samples by household type, day and the suburb from which it was collected.
Table 2 – Number of Samples by Suburb Day Suburbs Single MUDs Total dwellings
Garbage Sample Monday 4 May Farrer, Lyons, Pearce 38 0 38 Tuesday 5 May Conder, Monash, Richardson, Theodore 38 0 38 Wednesday 6 May Charnwood, Flynn, Palmerston 38 0 38 Thursday 7 May Evatt, Macquarie, Scullin 38 0 38 Friday 8 May Garran, Ngunnawal, O'Connor, Turner 39 0 39 Friday 27 November O'Connor, Watson 0 59 59 All days All suburbs 191 59 250
Recycling sample Monday 4 May Farrer, Pearce 19 0 19 Tuesday 5 May Monash, Richardson 19 0 19 Wednesday 6 May Charnwood, Flynn 16 0 16 Thursday 7 May Evatt, Scullin 16 0 16 Friday 8 May Garran, Ngunnawal 17 0 17 Friday 27 November O'Connor, Watson 0 59 59 All days All suburbs 87 59 146
Domestic Waste Audit 2009 ACT NOWaste
__________________________________________________________________________________
2009 - DEC Page 15
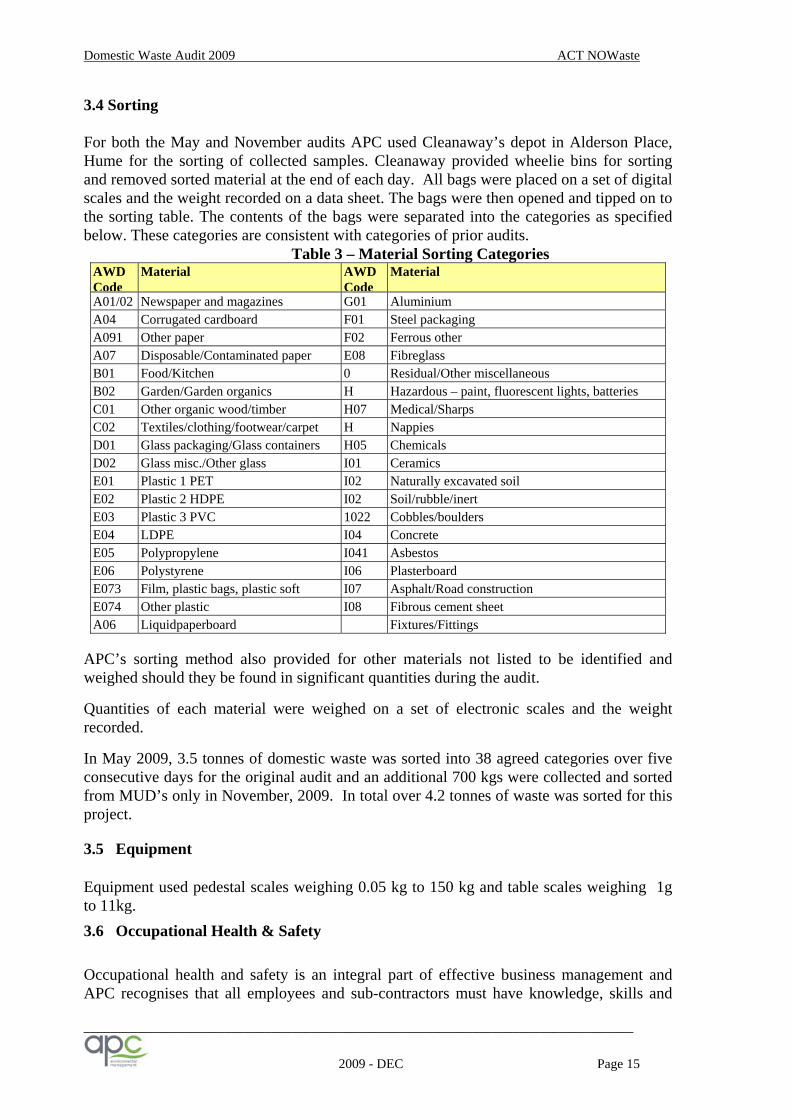
3.4 Sorting For both the May and November audits APC used Cleanaway’s depot in Alderson Place, Hume for the sorting of collected samples. Cleanaway provided wheelie bins for sorting and removed sorted material at the end of each day. All bags were placed on a set of digital scales and the weight recorded on a data sheet. The bags were then opened and tipped on to the sorting table. The contents of the bags were separated into the categories as specified below. These categories are consistent with categories of prior audits.
Table 3 – Material Sorting Categories AWD Code
Material AWD Code
Material
A01/02 Newspaper and magazines G01 Aluminium A04 Corrugated cardboard F01 Steel packaging A091 Other paper F02 Ferrous other A07 Disposable/Contaminated paper E08 Fibreglass B01 Food/Kitchen 0 Residual/Other miscellaneous B02 Garden/Garden organics H Hazardous – paint, fluorescent lights, batteries C01 Other organic wood/timber H07 Medical/Sharps C02 Textiles/clothing/footwear/carpet H Nappies D01 Glass packaging/Glass containers H05 Chemicals D02 Glass misc./Other glass I01 Ceramics E01 Plastic 1 PET I02 Naturally excavated soil E02 Plastic 2 HDPE I02 Soil/rubble/inert E03 Plastic 3 PVC 1022 Cobbles/boulders E04 LDPE I04 Concrete E05 Polypropylene I041 Asbestos E06 Polystyrene I06 Plasterboard E073 Film, plastic bags, plastic soft I07 Asphalt/Road construction E074 Other plastic I08 Fibrous cement sheet A06 Liquidpaperboard Fixtures/Fittings
APC’s sorting method also provided for other materials not listed to be identified and weighed should they be found in significant quantities during the audit.
Quantities of each material were weighed on a set of electronic scales and the weight recorded.
In May 2009, 3.5 tonnes of domestic waste was sorted into 38 agreed categories over five consecutive days for the original audit and an additional 700 kgs were collected and sorted from MUD’s only in November, 2009. In total over 4.2 tonnes of waste was sorted for this project.
3.5 Equipment Equipment used pedestal scales weighing 0.05 kg to 150 kg and table scales weighing 1g to 11kg. 3.6 Occupational Health & Safety Occupational health and safety is an integral part of effective business management and APC recognises that all employees and sub-contractors must have knowledge, skills and

Domestic Waste Audit 2009 ACT NOWaste
__________________________________________________________________________________
2009 - DEC Page 16
resources necessary to meet their obligations and fulfil the commitment to health and safety of the work place.
3.7 Data Entry and Analysis The data collected from the sorting was entered into MS Excel for analysis. All information was aggregated and no individual premises identified. The waste audit method described above enabled APC to provide the results by type of dwelling stock:
Single dwelling using mobile garbage bins (MGBs); MUDs using MGBs; and MUDs using hoppers.
The following analysis was undertaken for each type of premises: • Composition of the garbage and recycling stream by weight of the material in each
category • Amount of garbage and recycling produced per household per week • Contamination in the recycling stream • Recovery rates for recyclables • Diversion rate of whole waste stream • Overall volume of garbage and recycling stream by household. With the exception of the subsequent MUD audit, the sample selection, collection and sorting method described above is essentially the same as that used in previous audits in Canberra. This has enabled direct and unequivocal comparison with previous audit data held by APC.
3.8 Study limitations The data for this study was collected and analysed using the best and most accurate methods available within the constraints of available time and budget. This study is a survey, which means that a relatively small amount of data has been collected and then treated as representative of the total. As in any survey there are limitations to the accuracy of the data, as described below: • Short timeframe – This audit was carried out over six days, taking samples distributed carefully over the geographic area of the ACT. The data was then used as being representative of the whole ACT. It should be noted that seasonal trends (e.g. warmer weather leading to more use of beverages), seasonal celebrations (e.g. Easter, Christmas) and the impact of weather events (e.g. high rainfall leading to grass growth and larger amounts of organic waste) may change waste generation over time. Thus the results of the audit should be treated with due caution when analyzing this report or comparing it to reports based on data taken at different times of year. • Representativeness of the sample – the sample for this audit is necessarily small due to the high per capita cost and resource-intensive nature of collecting household waste at kerbside. There is always a small probability of inadvertently collecting waste from atypical households, resulting in non-representative data. APC audits are carried out using

Domestic Waste Audit 2009 ACT NOWaste
__________________________________________________________________________________
2009 - DEC Page 17
strict random sampling, stratified by geographic area, to minimise the chance of this situation occurring. • Weight based analysis – The collection of data for this audit was recorded by weight. This type of collection may cause some materials to appear to be present in quite small proportions due to their comparatively low densities (e.g. plastic beverage containers). Weight based analysis has been used in this audit because it is a standard procedure and is the most accurate way to collect data on a number of different types of materials. • Limitations of sample size – all surveys carry an element of sampling error which is the mathematical error associated with using a sample to represent a total population. Sampling error can be reduced by taking larger samples. The sampling error involved in waste audits is usually small and can be tabulated by producing estimates augmented by upper and lower confidence intervals. • Human behaviour – Residents of an area may not always comply with administrative arrangements as expected. For example, a large family with considerable waste generation might have an informal arrangement with a neighbour to use the neighbour’s waste containers as well as their own. Alternatively, residents of a large multi-address medium density complex might use the waste facilities of a neighbouring address as they are closer than their own. Compensating for human behaviour of this type is outside the scope of standard APC waste audits, but it is reasonable to assume that such behaviour is relatively rare, and it would be expected that the size of the sample would minimize the effects on the data.

Domestic Waste Audit 2009 ACT NOWaste
__________________________________________________________________________________
2009 - DEC Page 18
4. KEY FINDINGS Total Waste Generation – The overall waste generation for ACT has dropped from 16.37kg per household per week in 2007 to 14.52kg in 2009. This result represents a major decrease in household waste generation, which could be due to many external influences and factors but the most likely candidate is the variations in consumption and disposal patterns due to seasonality. The 2007 audit was conducted in November (spring – summer) and the 2009 in May (autumn – winter). Other factors that could also contribute include the economic downturn, household size, disposable income, education, home ownership and random variation. Garbage Generation – The garbage stream has decreased from 10.04kg in 2007 to 9.55kg in 2009, a difference of 0.49kg. Composition of Garbage Stream – The largest component of the garbage stream is food waste, which makes up 39% or 3.72kg followed by other non recoverable material at 41.7% or 3.98kg. Material that could be recycled as part of the current service offered to the community represents 12.8% or 1.22kg. Specifically, recyclable paper accounts for 5.5% in 2009, compared to 11.7% in 2004. Recyclable containers comprise 7.3% of the garbage stream in 2009 compared with 13.5% in 2004. Amounts of recyclable containers are expected to be lower in winter due to a corresponding decrease in beverage consumption. The presence of recyclables in the garbage stream increased slightly from 12.6% in 2007 to 12.8% in 2009. Recycling Generation – In 2009, the amount of recycling generated from the average ACT household was 4.97kg per week. This figure is significantly less than the 6.33kg recorded in 2007. As with garbage generation, the reduction in recycling generation could be due to a number of external influences but is most likely due to seasonality differences in beverage consumption. Composition of the Recycling Stream – The recycling stream comprised 58.7% paper and cardboard. In 2007, this portion of the recycling stream was 56.1%. Containers comprised 36.2% in 2009 compared to 34.6% recorded in 2007. Contamination – Contamination in the recycling stream was 5.1% in 2009 of which other plastics, food and plastic film were the most common items by weight. This is a significant improvement from 2007, when the contamination level was 9.3%, and 2004 when it was 13.2%. This reduction could be due to the television advertising campaign ACT NoWaste has run in recent times, which is extending the reach of the recycling message about what, why and how to recycle. Typically, recycling collection services utilizing a fully co-mingled system can achieve contamination levels of between 3% and 5%, deemed to be best practice standards. ACT NoWaste is now within the acceptable ranges to be considered best practice. Recovery Rates – The overall recovery rate for all dwellings in 2009 was 79.6%. This is slightly less than the 2007 result of 81.9%. Glass at 82.7% and paper at 84.9% were the best performers while lower rates were recorded for plastics and liquidpaperboard, all around 50%, and aluminium at 29%.

Domestic Waste Audit 2009 ACT NOWaste
__________________________________________________________________________________
2009 - DEC Page 19
Vegetation in the Garbage Stream – The proportion of garden organics in the garbage stream has decreased slightly from 8.2% in 2007 to 6.6% in 2009. Again, this could be directly related to seasonality factors relating to when the 2009 audit was conducted. Diversion – The total diversion rate recorded in 2009 was 32.6%. This is a slight decrease from the 35.1% recorded in 2007. Garbage Bin Capacity Utilisation – The median volume of garbage bins used in single dwellings is 75%, a slight increase from the 68% recorded in 2007. It is worth noting that the volume increase has occurred even though the weight of garbage generated per household has dropped by 0.49kg per household. Recycling Bin Capacity Utilisation – The average volume of recycling bins used in single dwellings in 2009 was 80%, very similar to the 76% recorded in 2007. The results of the 2009 waste audit are compared to that of the 2007 data in Table 4 below. These results show an improvement in performance in the areas of contamination, waste generation and green waste present in the garbage stream compared to the 2007 audit results. However, diversion and recovery have declined slightly and the amount of recyclables in the garbage stream has increased slightly.
Table 4 – Key Performance Indicators 2007 - 2009 Indicator 2007 2009 Total waste stream per household 16.37 kg 14.52 kg Average weight of garbage stream per household 10.04 kg 9.55 kg Average weight of recycling stream per household 6.33 kg 4.97 kg Recyclables in the garbage 12.6% 12.8% Contamination 9.3% 5.1% Overall Recovery 81.9% 79.6% Diversion 35.1% 32.6% Recovery by Material Aluminium cans 45.6% 28.6% Glass 79.6% 82.7% Steel 44.6% 50.0% Paper 91.5% 84.9% Cardboard 83.8% 83.3% PET 81.9% 66.7% HDPE 79.0% 73.3% PVC 47.2% 50.0% Mixed plastics 32.0% 31.3% Liquidpaperboard cartons 63.4% 58.0%

Domestic Waste Audit 2009 ACT NOWaste
__________________________________________________________________________________
2009 - DEC Page 20
5. RESULTS
5.1 Garbage 5.1.1 Consolidated Composition of the Garbage Stream - Chart 1 below shows each major waste category with Food waste the largest component of the Garbage Stream, accounting for 39% of the total sample. Other non-recyclable material is next largest at 19.4%. Materials for which a recycling service is currently available – paper, cardboard and containers currently represent 12.8% of the garbage bins’ contents. For an itemised composition of the garbage stream refer Appendix B.
Chart 1 Consolidated Composition of the Garbage Stream
Food, 39.0%
Garden w aste, 6.6%
Other non-recyclable, 19.4%
Nappies, 4.9%
Film plastic, 5.9%
Contaminated paper, 6.0%
Recyclable paper / cardboard, 5.5%
Recyclable containers, 7.3%
Textiles, 5.6%
Table 5 below shows the garbage stream composition consolidated into five major categories. Food waste is the largest single component in single dwellings (SD) and multi-unit dwellings (MUDs) with hoppers. However, in multi-unit dwellings (MUDs) with mobile garbage bins, the ‘other non-recyclable’ the largest component and food waste is the second largest component.
Table 5 - Consolidated Composition of the Garbage Stream
Single dwgs
MUDs hoppers #
MUDs MGBs ^ Total Per cent
Material Weight (kgs) Recyclable paper / cardboard 79.9 23.0 27.6 130.5 5.5% Recyclable containers 127.8 32.1 14.3 174.2 7.3% Food waste 740.1 90.7 100.1 930.9 39.0% Garden waste 107.9 20.4 28.5 156.8 6.6% Other non-recyclable 788.3 82.0 125.8 996.1 41.7% Total material 1,844.0 248.2 296.3 2,388.5 100.0%
# Multi-unit dwellings with hoppers as garbage containers, ^ Multi-unit dwellings with MGBs as garbage containers
Domestic Waste Audit 2009 ACT NOWaste
__________________________________________________________________________________
2009 - DEC Page 21
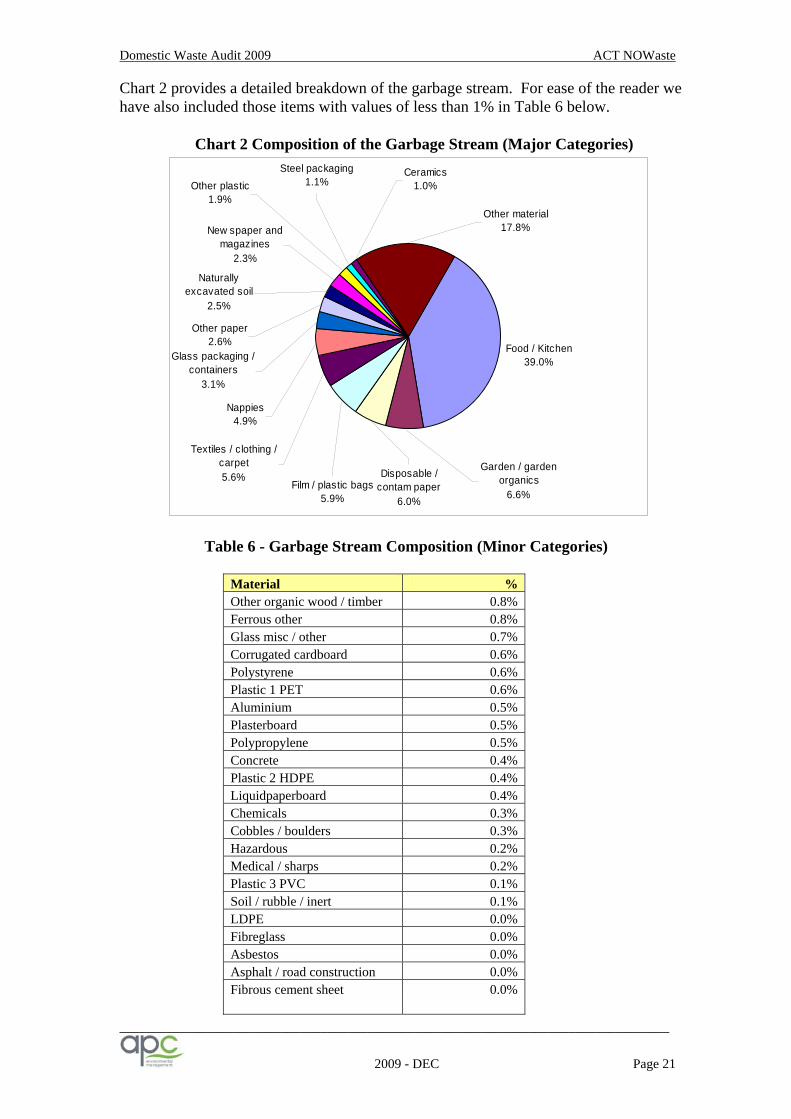
Chart 2 provides a detailed breakdown of the garbage stream. For ease of the reader we have also included those items with values of less than 1% in Table 6 below.
Chart 2 Composition of the Garbage Stream (Major Categories)
Food / Kitchen39.0%
New spaper and magazines
2.3%
Other plastic1.9%
Ceramics1.0%
Steel packaging1.1%
Naturally excavated soil
2.5%
Other paper2.6%
Textiles / clothing / carpet5.6%
Other material17.8%
Glass packaging / containers
3.1%
Nappies4.9%
Film / plastic bags5.9%
Disposable / contam paper
6.0%
Garden / garden organics
6.6%
Table 6 - Garbage Stream Composition (Minor Categories)
Material % Other organic wood / timber 0.8% Ferrous other 0.8% Glass misc / other 0.7% Corrugated cardboard 0.6% Polystyrene 0.6% Plastic 1 PET 0.6% Aluminium 0.5% Plasterboard 0.5% Polypropylene 0.5% Concrete 0.4% Plastic 2 HDPE 0.4% Liquidpaperboard 0.4% Chemicals 0.3% Cobbles / boulders 0.3% Hazardous 0.2% Medical / sharps 0.2% Plastic 3 PVC 0.1% Soil / rubble / inert 0.1% LDPE 0.0% Fibreglass 0.0% Asbestos 0.0% Asphalt / road construction 0.0% Fibrous cement sheet 0.0%

Domestic Waste Audit 2009 ACT NOWaste
__________________________________________________________________________________
2009 - DEC Page 22
5.1.2 Consolidated Garbage – Average Weights Per Dwelling –Table 7 and Chart 3 below shows that MUDs with MGBs or hoppers are generating almost as much garbage per household as single dwellings, 9.26 kg and 9.19 kgs respectively versus 9.65kg for single dwellings. Typically, garbage generation from units is usually significantly less per household than single dwellings regardless of the disposal system in place. Food waste generation and ‘Other non-recyclable’ material are the major categories in all three housing types.
Table 7 - Consolidated Garbage - Weights per Dwelling per Week
Material Single dwgs MUDs
hoppers # MUDs MGBs ^ Total Number of dwellings 191 27 32 250
Weights (kgs / dwelling) Recyclable paper / cardboard 0.42 0.85 0.86 0.52 Recyclable containers 0.67 1.19 0.45 0.70 Food waste 3.87 3.36 3.13 3.72 Garden waste 0.56 0.76 0.89 0.63 Other non-recyclable 4.13 3.04 3.93 3.98 Total material 9.65 9.19 9.26 9.55
# Multi-unit dwellings with hoppers as garbage containers, ^ Multi-unit dwellings with MGBs as garbage containers
Chart 3 - Consolidated Garbage - Average Weights per Dwelling per Week
0.42 0.85 0.860.67
1.190.45
3.87
3.36
3.13
0.560.76
0.89
4.13 3.043.93
0
1
2
3
4
5
6
7
8
9
10
Single dw gs MUDs whoppers
MUDs w MGBs
Kgs
per
dw
ellin
g Other non-recyclable
Garden w aste
Food w aste
Recyclable containers
Recyclable paper / cardboard
Domestic Waste Audit 2009 ACT NOWaste
__________________________________________________________________________________
2009 - DEC Page 23
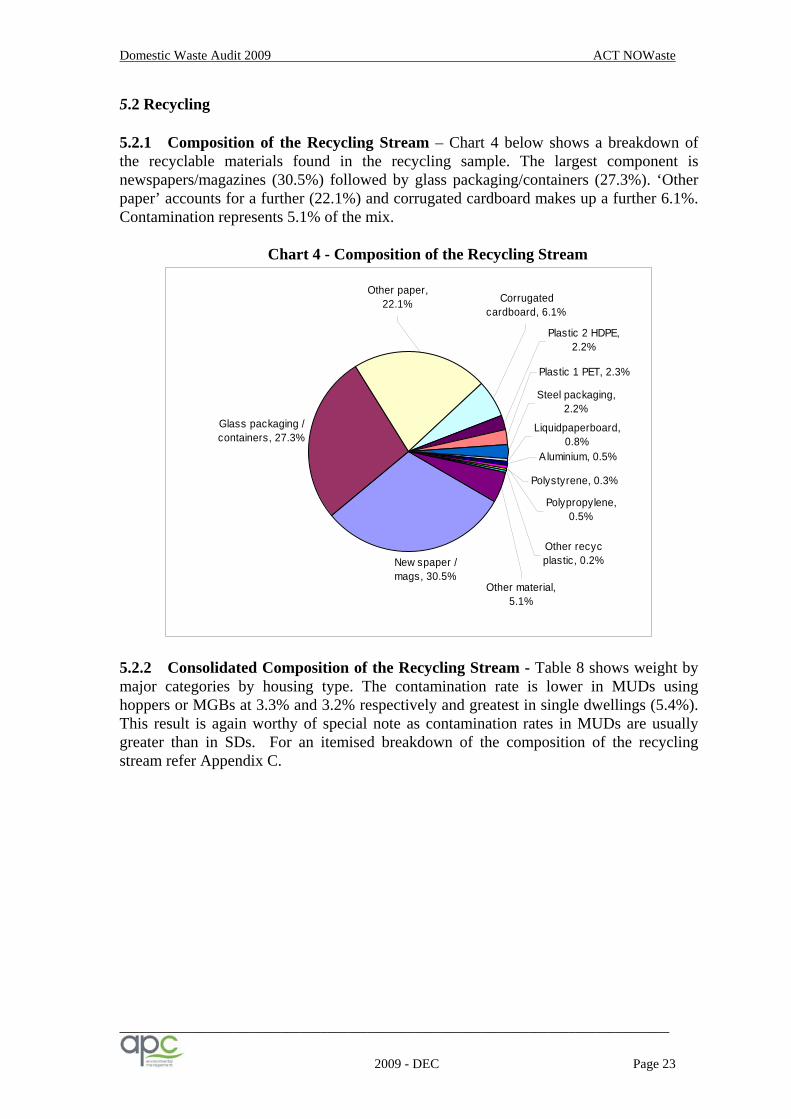
5.2 Recycling 5.2.1 Composition of the Recycling Stream – Chart 4 below shows a breakdown of the recyclable materials found in the recycling sample. The largest component is newspapers/magazines (30.5%) followed by glass packaging/containers (27.3%). ‘Other paper’ accounts for a further (22.1%) and corrugated cardboard makes up a further 6.1%. Contamination represents 5.1% of the mix.
Chart 4 - Composition of the Recycling Stream
New spaper / mags, 30.5%
Glass packaging / containers, 27.3%
Polystyrene, 0.3%
Other recyc plastic, 0.2%
Polypropylene, 0.5%
Aluminium, 0.5%
Liquidpaperboard, 0.8%
Steel packaging, 2.2%
Plastic 1 PET, 2.3%
Other material, 5.1%
Plastic 2 HDPE, 2.2%
Corrugated cardboard, 6.1%
Other paper, 22.1%
5.2.2 Consolidated Composition of the Recycling Stream - Table 8 shows weight by major categories by housing type. The contamination rate is lower in MUDs using hoppers or MGBs at 3.3% and 3.2% respectively and greatest in single dwellings (5.4%). This result is again worthy of special note as contamination rates in MUDs are usually greater than in SDs. For an itemised breakdown of the composition of the recycling stream refer Appendix C.

Domestic Waste Audit 2009 ACT NOWaste
__________________________________________________________________________________
2009 - DEC Page 24
Table 8 - Consolidated Composition of the Recycling Stream
Material Category Definition Single MUDs w
hoppers # MUDs w MGBs ^ Total
Weight (kgs)
Recyclable paper / cardboard
Newspaper / magazines, Other paper, Corrugated cardboard 678.4 38.6 42.4 759.4
Recyclable containers
Glass containers, PET, HDPE, PVC, LDPE, Polypropylene, Polystyrene, Liquidpaperboard, Aluminium, Steel 396.4 28.7 43.5 468.6
Other non-recyclable
Disposable / contaminated paper, food, garden organics, wood, textiles/clothing/carpet, film/plastic bags, other plastic, other ferrous, hazardous, medical/sharps, nappies, chemicals, ceramics, other glass 60.9 2.3 2.8 66.0
Total material 1,135.7 69.6 88.7 1,294.0 Contamination rate 5.4% 3.3% 3.2% 5.1%

Domestic Waste Audit 2009 ACT NOWaste
__________________________________________________________________________________
2009 - DEC Page 25
Chart 5 shows that paper and cardboard are the largest component of the recycling stream and account for 58.7% of the total sample with recyclable containers comprising 36.2% and the overall contamination rate at 5.1%.
Chart 5 - Consolidated Composition of the Recycling Stream
Recyclable paper / cardboard
58.7%
Recyclable containers
36.2%
Other non-recyclable
5.1%
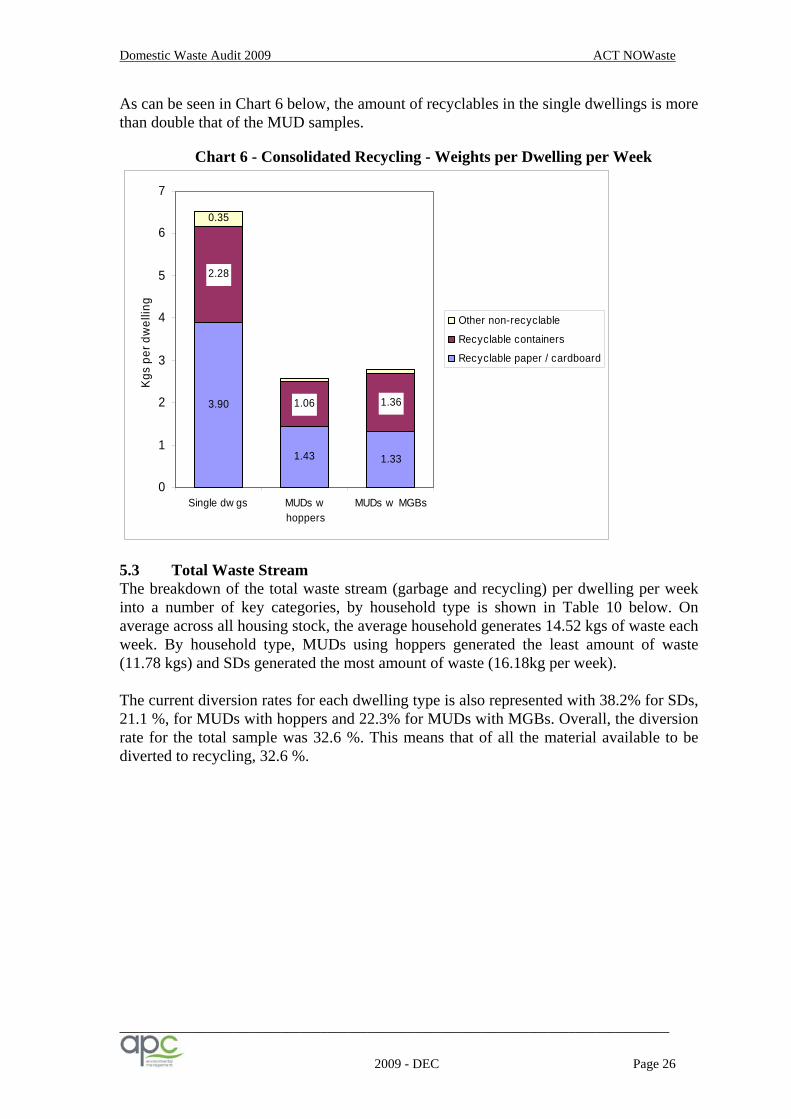
5.2.3 Consolidated Recycling – Weights Per Dwelling – On average, SDs generated 6.53kg of recyclables per week. MUDs with MGBs generated 2.77 kgs of recyclables per week, which outperformed MUDs with hoppers which generated 2.58 kgs of material. In single dwellings and MUDs with hoppers, recyclable paper/cardboard is the largest component of the recycling stream. In MUDs with MGBs the largest component is 1.36 kgs closely followed by the recyclable paper/cardboard category at 1.33 kgs. Again, caution should be exercised as the samples from MUDs are from one address only for each MUD type and may not be representative of all unit blocks using this service.
Table 9 - Consolidated Recycling - Weights per Dwelling per Week
Material Single dwgs MUDs w hoppers # MUDs w MGBs ^ Total
Number of dwellings 87 27 32 146 Weights (kgs / dwelling / week)
Recyclable paper / cardboard 3.90 1.43 1.33 2.88 Recyclable containers 2.28 1.06 1.36 1.85 Other non-recyclable 0.35 0.09 0.09 0.24 Total material 6.53 2.58 2.77 4.97
# Multi-unit dwellings with hoppers as garbage containers, ^ Multi-unit dwellings with MGBs as garbage containers
Domestic Waste Audit 2009 ACT NOWaste
__________________________________________________________________________________
2009 - DEC Page 26
As can be seen in Chart 6 below, the amount of recyclables in the single dwellings is more than double that of the MUD samples.
Chart 6 - Consolidated Recycling - Weights per Dwelling per Week
3.90
1.43 1.33
2.28
1.06 1.36
0.35
0
1
2
3
4
5
6
7
Single dw gs MUDs whoppers
MUDs w MGBs
Kgs
per
dw
ellin
g
Other non-recyclable
Recyclable containers
Recyclable paper / cardboard
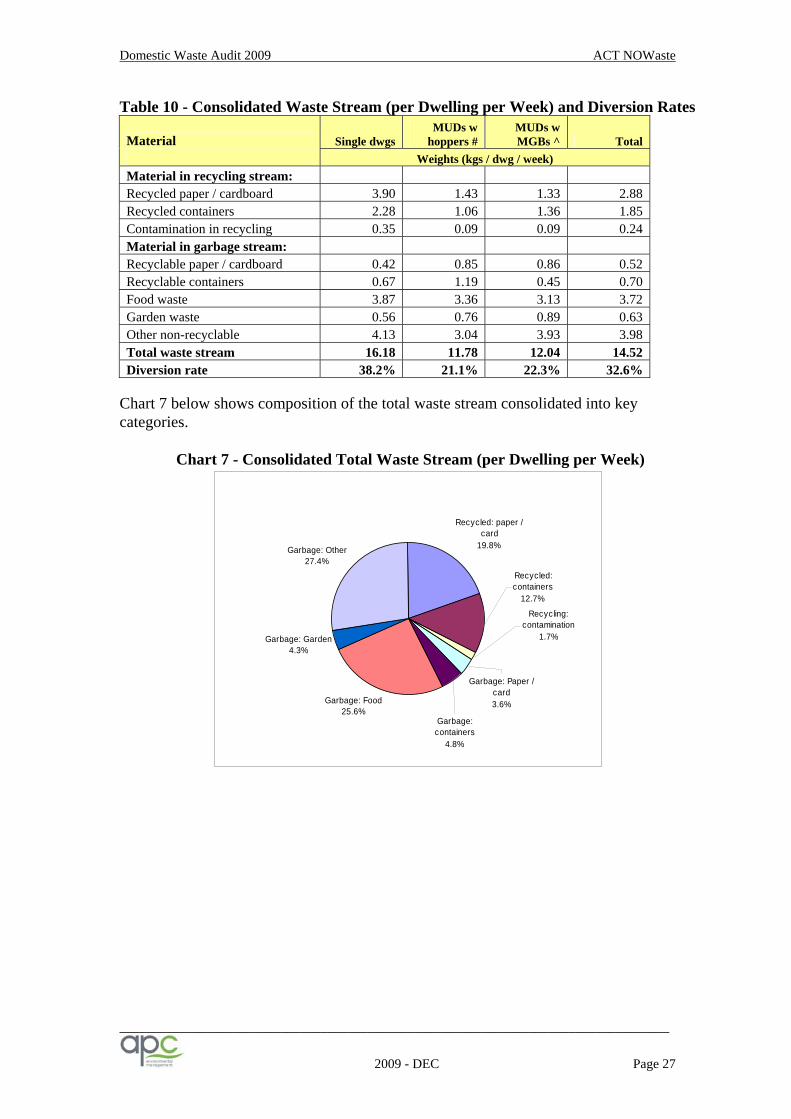
5.3 Total Waste Stream The breakdown of the total waste stream (garbage and recycling) per dwelling per week into a number of key categories, by household type is shown in Table 10 below. On average across all housing stock, the average household generates 14.52 kgs of waste each week. By household type, MUDs using hoppers generated the least amount of waste (11.78 kgs) and SDs generated the most amount of waste (16.18kg per week). The current diversion rates for each dwelling type is also represented with 38.2% for SDs, 21.1 %, for MUDs with hoppers and 22.3% for MUDs with MGBs. Overall, the diversion rate for the total sample was 32.6 %. This means that of all the material available to be diverted to recycling, 32.6 %.
Domestic Waste Audit 2009 ACT NOWaste
__________________________________________________________________________________
2009 - DEC Page 27
Table 10 - Consolidated Waste Stream (per Dwelling per Week) and Diversion Rates
Material Single dwgs MUDs w
hoppers # MUDs w MGBs ^ Total
Weights (kgs / dwg / week) Material in recycling stream: Recycled paper / cardboard 3.90 1.43 1.33 2.88 Recycled containers 2.28 1.06 1.36 1.85 Contamination in recycling 0.35 0.09 0.09 0.24 Material in garbage stream: Recyclable paper / cardboard 0.42 0.85 0.86 0.52 Recyclable containers 0.67 1.19 0.45 0.70 Food waste 3.87 3.36 3.13 3.72 Garden waste 0.56 0.76 0.89 0.63 Other non-recyclable 4.13 3.04 3.93 3.98 Total waste stream 16.18 11.78 12.04 14.52 Diversion rate 38.2% 21.1% 22.3% 32.6%
Chart 7 below shows composition of the total waste stream consolidated into key categories.
Chart 7 - Consolidated Total Waste Stream (per Dwelling per Week)
Recycled: paper / card
19.8%
Garbage: Food25.6%
Garbage: Garden4.3%
Garbage: Other27.4%
Garbage: Paper / card3.6%
Garbage: containers
4.8%
Recycling: contamination
1.7%
Recycled: containers
12.7%
Domestic Waste Audit 2009 ACT NOWaste
__________________________________________________________________________________
2009 - DEC Page 28
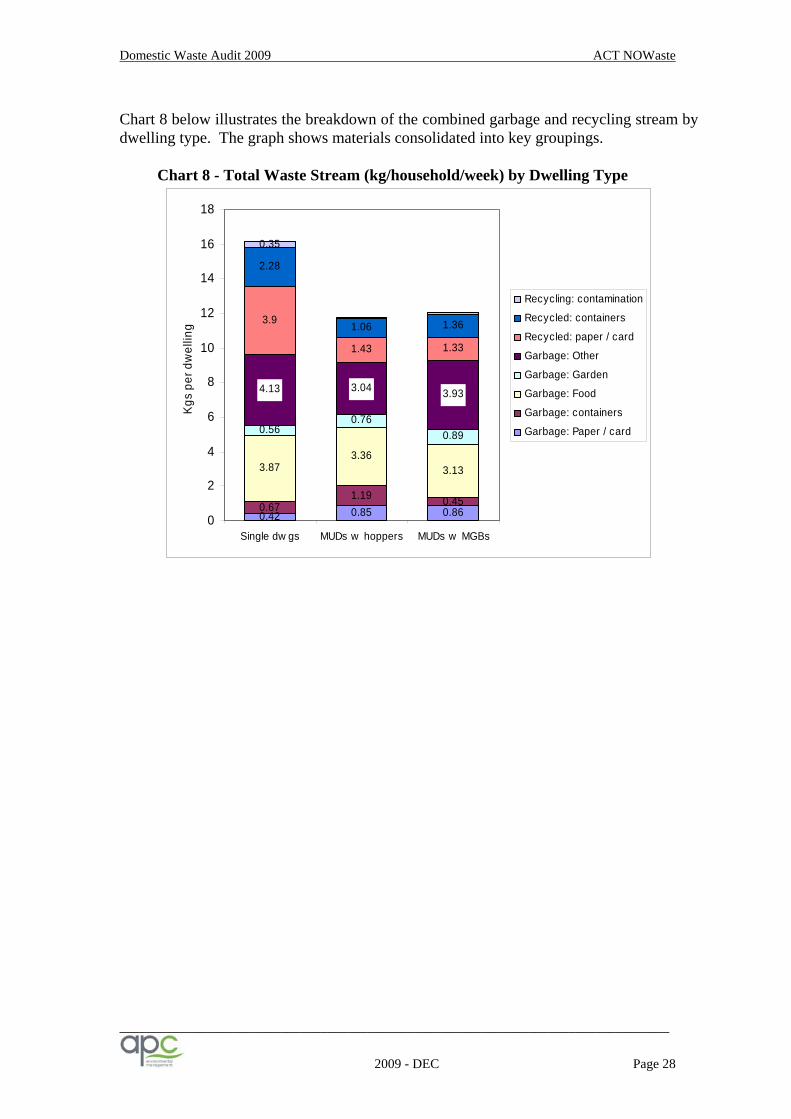
Chart 8 below illustrates the breakdown of the combined garbage and recycling stream by dwelling type. The graph shows materials consolidated into key groupings.
Chart 8 - Total Waste Stream (kg/household/week) by Dwelling Type
0.42 0.85 0.860.671.19 0.45
3.87
0.560.76
0.89
4.13 3.04 3.93
3.9
1.43 1.33
2.28
1.06 1.36
0.35
3.133.36
0
2
4
6
8
10
12
14
16
18
Single dw gs MUDs w hoppers MUDs w MGBs
Kgs
per
dw
ellin
g
Recycling: contamination
Recycled: containers
Recycled: paper / card
Garbage: Other
Garbage: Garden
Garbage: Food
Garbage: containers
Garbage: Paper / card
Domestic Waste Audit 2009 ACT NOWaste
__________________________________________________________________________________
2009 - DEC Page 29
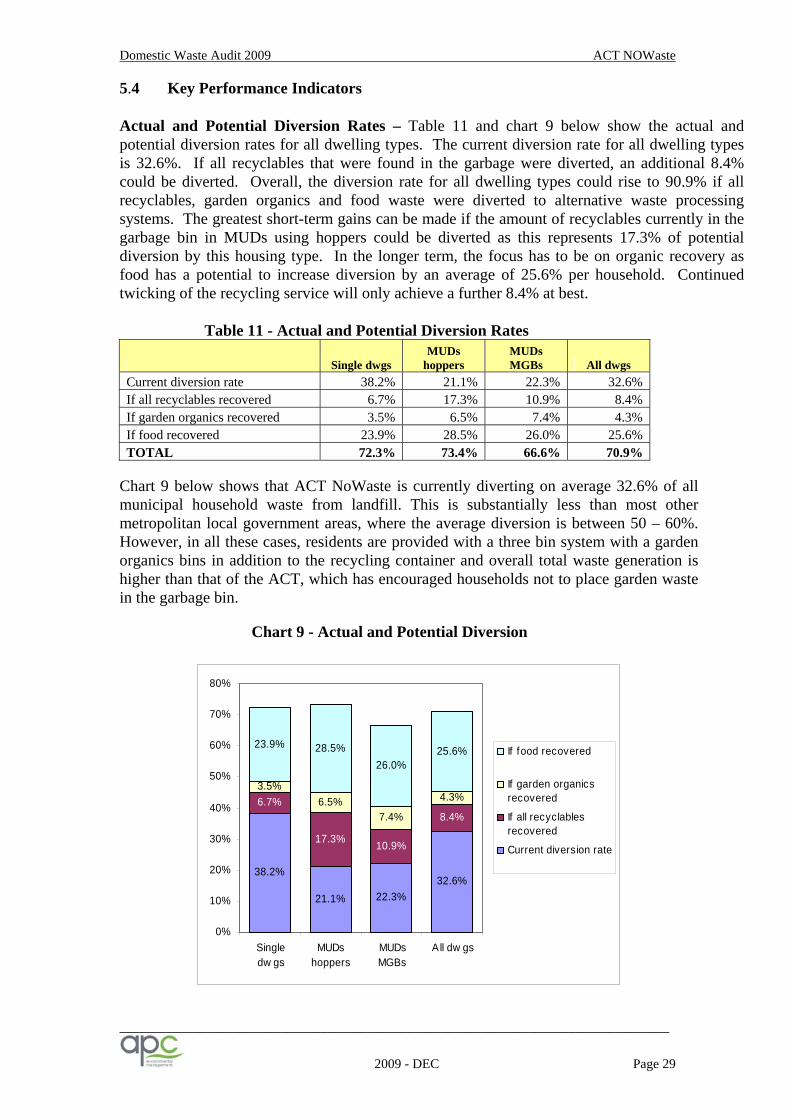
5.4 Key Performance Indicators Actual and Potential Diversion Rates – Table 11 and chart 9 below show the actual and potential diversion rates for all dwelling types. The current diversion rate for all dwelling types is 32.6%. If all recyclables that were found in the garbage were diverted, an additional 8.4% could be diverted. Overall, the diversion rate for all dwelling types could rise to 90.9% if all recyclables, garden organics and food waste were diverted to alternative waste processing systems. The greatest short-term gains can be made if the amount of recyclables currently in the garbage bin in MUDs using hoppers could be diverted as this represents 17.3% of potential diversion by this housing type. In the longer term, the focus has to be on organic recovery as food has a potential to increase diversion by an average of 25.6% per household. Continued twicking of the recycling service will only achieve a further 8.4% at best.
Table 11 - Actual and Potential Diversion Rates
Single dwgs MUDs
hoppers MUDs MGBs All dwgs
Current diversion rate 38.2% 21.1% 22.3% 32.6% If all recyclables recovered 6.7% 17.3% 10.9% 8.4% If garden organics recovered 3.5% 6.5% 7.4% 4.3% If food recovered 23.9% 28.5% 26.0% 25.6% TOTAL 72.3% 73.4% 66.6% 70.9%
Chart 9 below shows that ACT NoWaste is currently diverting on average 32.6% of all municipal household waste from landfill. This is substantially less than most other metropolitan local government areas, where the average diversion is between 50 – 60%. However, in all these cases, residents are provided with a three bin system with a garden organics bins in addition to the recycling container and overall total waste generation is higher than that of the ACT, which has encouraged households not to place garden waste in the garbage bin.
Chart 9 - Actual and Potential Diversion
38.2%
21.1% 22.3%32.6%
6.7%
17.3% 10.9%
8.4%
3.5%6.5%
7.4%
4.3%
23.9% 28.5%26.0%
25.6%
0%
10%
20%
30%
40%
50%
60%
70%
80%
Singledw gs
MUDshoppers
MUDsMGBs
All dw gs
If food recovered
If garden organicsrecovered
If all recyclablesrecovered
Current diversion rate
Domestic Waste Audit 2009 ACT NOWaste
__________________________________________________________________________________
2009 - DEC Page 30
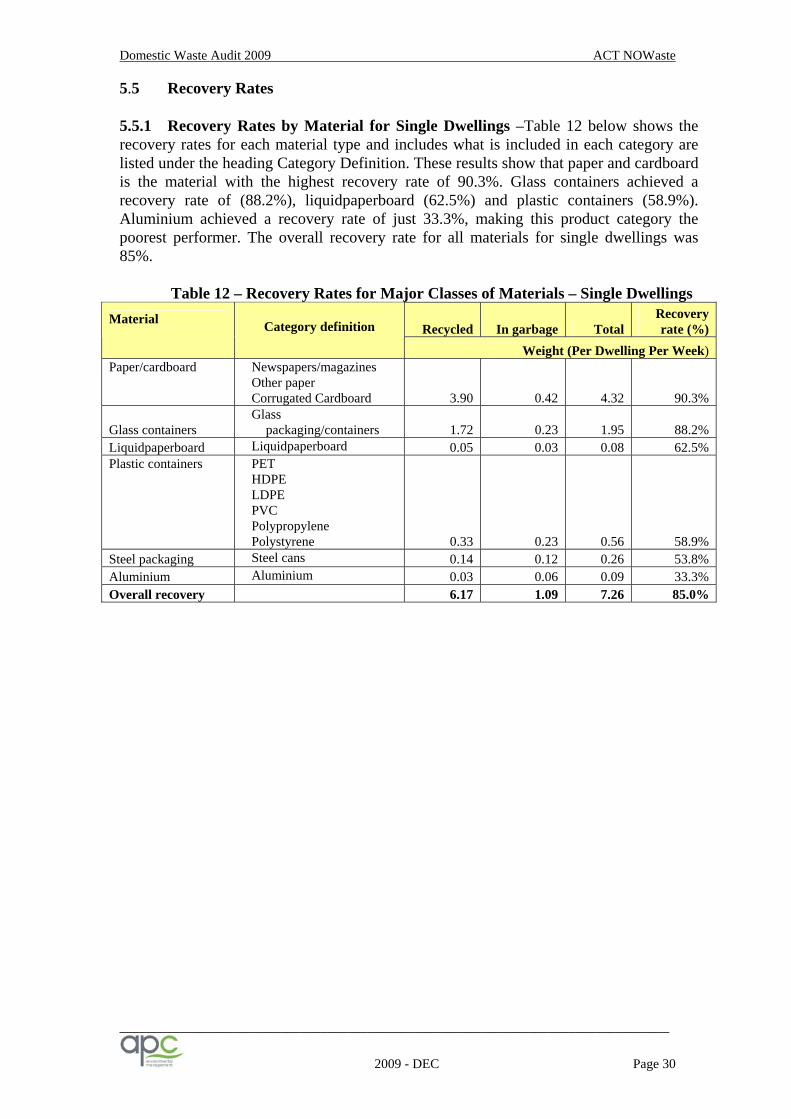
5.5 Recovery Rates 5.5.1 Recovery Rates by Material for Single Dwellings –Table 12 below shows the recovery rates for each material type and includes what is included in each category are listed under the heading Category Definition. These results show that paper and cardboard is the material with the highest recovery rate of 90.3%. Glass containers achieved a recovery rate of (88.2%), liquidpaperboard (62.5%) and plastic containers (58.9%). Aluminium achieved a recovery rate of just 33.3%, making this product category the poorest performer. The overall recovery rate for all materials for single dwellings was 85%.
Table 12 – Recovery Rates for Major Classes of Materials – Single Dwellings
Recycled In garbage Total Recovery rate (%)
Material
Category definition
Weight (Per Dwelling Per Week) Paper/cardboard
Newspapers/magazines Other paper Corrugated Cardboard 3.90 0.42 4.32 90.3%
Glass containers Glass
packaging/containers 1.72 0.23 1.95 88.2% Liquidpaperboard Liquidpaperboard 0.05 0.03 0.08 62.5% Plastic containers
PET HDPE LDPE PVC Polypropylene Polystyrene 0.33 0.23 0.56 58.9%
Steel packaging Steel cans 0.14 0.12 0.26 53.8% Aluminium Aluminium 0.03 0.06 0.09 33.3% Overall recovery 6.17 1.09 7.26 85.0%

Domestic Waste Audit 2009 ACT NOWaste
__________________________________________________________________________________
2009 - DEC Page 31
These results are shown graphically below and the results are consistent with other recent audits conducted by APC where typically paper and glass are high performers and aluminium consistently records a low recovery rate.
Chart 10 – Recovery Rates for Major Classes of Materials – Single Dwellings
90.3% 88.2%
58.9%62.5%
33.3%
53.8%
85.0%
0%
10%
20%
30%
40%
50%
60%
70%
80%
90%
100%
Per
cen
t
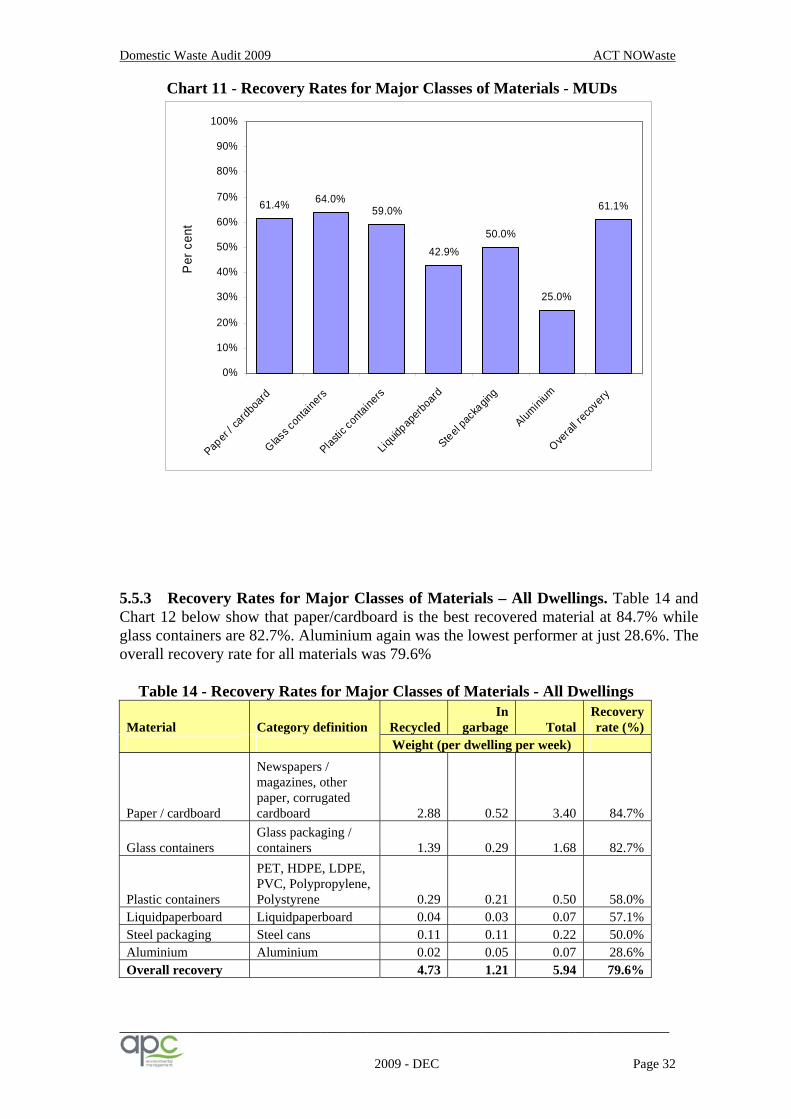
5.5.2 Recovery Rates for Major Classes of Materials for MUDs –Table 13 and Chart 11 below show that in the MUDs, Glass containers is the best performer with a recovery rate of 64%. Paper/cardboard achieved a rate of 61.4%. Aluminium achieved the lowest recovery rate of 25 %, making this product category the poorest performer, consistent with the results in single dwellings. The overall recovery rate for all materials generated from MUDs was 61.1% less than the 78.8% recorded in single dwellings.
Table 13 - Recovery Rates for Major Classes of Materials - Multi-unit Dwellings
Material Category definition Recycled In
garbage Total Recovery rate (%)
Weight (per dwelling per week)
Paper / cardboard
Newspapers / magazines, other paper, corrugated cardboard 1.37 0.86 2.23 61.4%
Glass containers Glass packaging / containers 0.89 0.50 1.39 64.0%
Plastic containers
PET, HDPE, LDPE, PVC, Polypropylene, Polystyrene 0.23 0.16 0.39 59.0%
Liquidpaperboard Liquidpaperboard 0.03 0.04 0.07 42.9% Steel packaging Steel cans 0.06 0.06 0.12 50.0% Aluminium Aluminium 0.01 0.03 0.04 25.0% Overall recovery 2.59 1.65 4.24 61.1%
Domestic Waste Audit 2009 ACT NOWaste
__________________________________________________________________________________
2009 - DEC Page 32
Chart 11 - Recovery Rates for Major Classes of Materials - MUDs
61.4% 64.0%59.0%
42.9%50.0%
25.0%
61.1%
0%
10%
20%
30%
40%
50%
60%
70%
80%
90%
100%
Paper
/ card
board
Glass c
ontai
ners
Plastic
conta
iners
Liquid
paperb
oard
Steel pa
ckagin
g
Alumini
um
Overal
l reco
very
Per
cen
t
5.5.3 Recovery Rates for Major Classes of Materials – All Dwellings. Table 14 and Chart 12 below show that paper/cardboard is the best recovered material at 84.7% while glass containers are 82.7%. Aluminium again was the lowest performer at just 28.6%. The overall recovery rate for all materials was 79.6%
Table 14 - Recovery Rates for Major Classes of Materials - All Dwellings
Material Category definition Recycled In
garbage Total Recovery rate (%)
Weight (per dwelling per week)
Paper / cardboard
Newspapers / magazines, other paper, corrugated cardboard 2.88 0.52 3.40 84.7%
Glass containers Glass packaging / containers 1.39 0.29 1.68 82.7%
Plastic containers
PET, HDPE, LDPE, PVC, Polypropylene, Polystyrene 0.29 0.21 0.50 58.0%
Liquidpaperboard Liquidpaperboard 0.04 0.03 0.07 57.1% Steel packaging Steel cans 0.11 0.11 0.22 50.0% Aluminium Aluminium 0.02 0.05 0.07 28.6% Overall recovery 4.73 1.21 5.94 79.6%

Domestic Waste Audit 2009 ACT NOWaste
__________________________________________________________________________________
2009 - DEC Page 33
Chart 12 - Recovery Rates for Major Classes of Materials - All Dwellings
84.7% 82.7%
58.0% 57.1%50.0%
28.6%
79.6%
0%
10%
20%
30%
40%
50%
60%
70%
80%
90%
100%
Paper
/ card
board
Glass c
ontai
ners
Plastic
conta
iners
Liquid
paperb
oard
Steel pa
ckagin
g
Alumini
um
Overal
l reco
very
Per
cen
t
Domestic Waste Audit 2009 ACT NOWaste
__________________________________________________________________________________
2009 - DEC Page 34
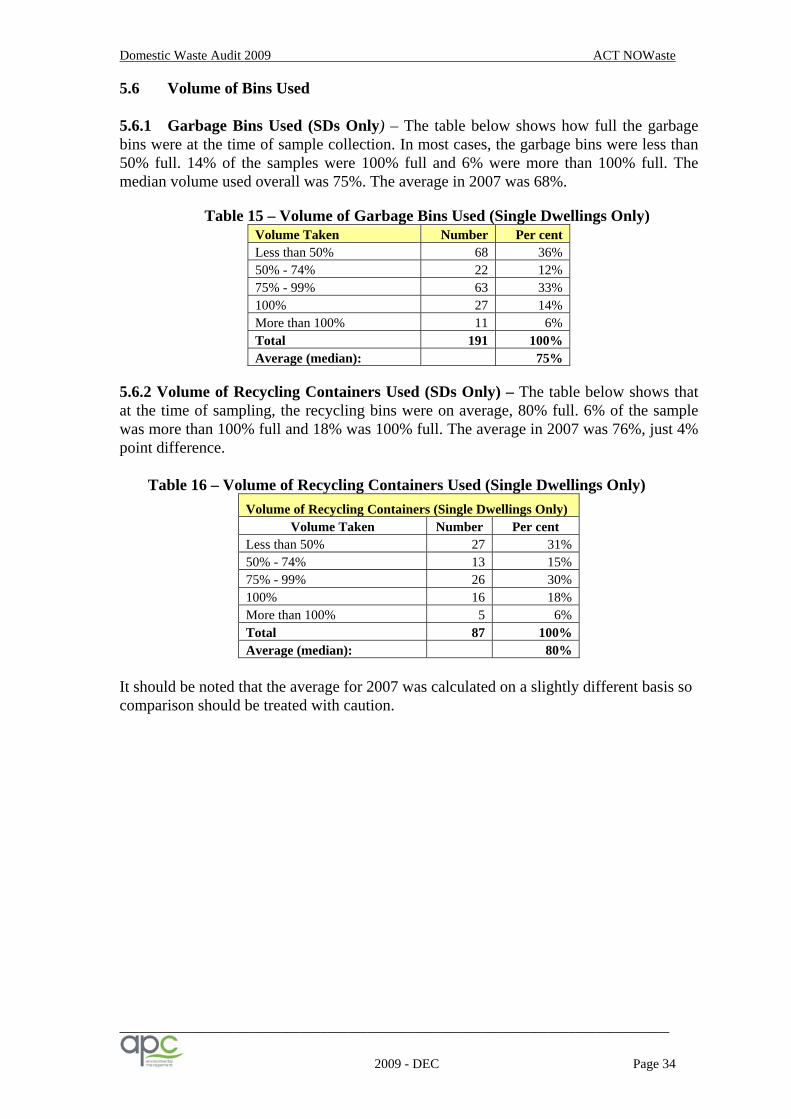
5.6 Volume of Bins Used 5.6.1 Garbage Bins Used (SDs Only) – The table below shows how full the garbage bins were at the time of sample collection. In most cases, the garbage bins were less than 50% full. 14% of the samples were 100% full and 6% were more than 100% full. The median volume used overall was 75%. The average in 2007 was 68%.
Table 15 – Volume of Garbage Bins Used (Single Dwellings Only) Volume Taken Number Per cent Less than 50% 68 36% 50% - 74% 22 12% 75% - 99% 63 33% 100% 27 14% More than 100% 11 6% Total 191 100% Average (median): 75%
5.6.2 Volume of Recycling Containers Used (SDs Only) – The table below shows that at the time of sampling, the recycling bins were on average, 80% full. 6% of the sample was more than 100% full and 18% was 100% full. The average in 2007 was 76%, just 4% point difference.
Table 16 – Volume of Recycling Containers Used (Single Dwellings Only) Volume of Recycling Containers (Single Dwellings Only)
Volume Taken Number Per cent Less than 50% 27 31% 50% - 74% 13 15% 75% - 99% 26 30% 100% 16 18% More than 100% 5 6% Total 87 100% Average (median): 80%
It should be noted that the average for 2007 was calculated on a slightly different basis so comparison should be treated with caution.

Domestic Waste Audit 2009 ACT NOWaste
__________________________________________________________________________________
2009 - DEC Page 35
6. COMPARISONS WITH PREVIOUS AUDITS The following charts and tables provide comparative analyses of the results from previous audits conducted in 2004 and 2007 against those recorded for the 2009 audit.
6.1 Consolidated Composition of the Garbage – Comparison with Previous Audits. The chart below shows a breakdown of ACT’s garbage for the audits conducted in 2004, 2007 and 2009. In 2004 and 2007, the ‘Food and compostables’ stream was the largest component. In 2009 ‘Other material’ is the largest component at 40.9% increasing from 26.9% in 2004. Recyclable paper has decreased from 11.7% in 2004 to 5.5% in 2009. Recyclable containers have also decreased from 13.5% in 2004 to 7.3% in 2009.
Chart 13 - Consolidated Composition of Garbage - Comparison with Previous Audits
11.7%3.6% 5.5%
13.5%
9.0% 7.3%
41.7%
48.5%39.0%
6.2%8.2%
7.4%
26.9% 30.7%40.9%
0%
10%
20%
30%
40%
50%
60%
70%
80%
90%
100%
2004 2007 2009
Other material
Green w aste
Food and compostables
Recyclable containers
Recyclable paper
Note the percentages of “Green waste” and “Other material” are slightly different here to other parts of the report due to the addition of the category “Other organic wood/timber” to Green waste for this chart only.
The consolidated categories used in the chart above are detailed in the table below:
Table 17 - Consolidated Composition of Garbage – Waste Stream Categories Category name Streams consolidated Category name Streams consolidated
Other Material Disposable/contaminated paper Food/kitchen Film/plastic bags Textiles/clothing/carpet Ceramics Ferrous other Garden organics Nappies Chemicals Wood Hazardous Medical/sharps Other plastic
Recycling containers Glass containers HDPE PET Steel Liquidpaperboard Aluminium Polypropylene Polystyrene PVC LDPE
Green Waste Garden organics Other organic wood/timber
Recyclable paper Newspapers/magazines Other paper Corrugated Cardboard
Food and compostables Food/Kitchen
Domestic Waste Audit 2009 ACT NOWaste
__________________________________________________________________________________
2009 - DEC Page 36
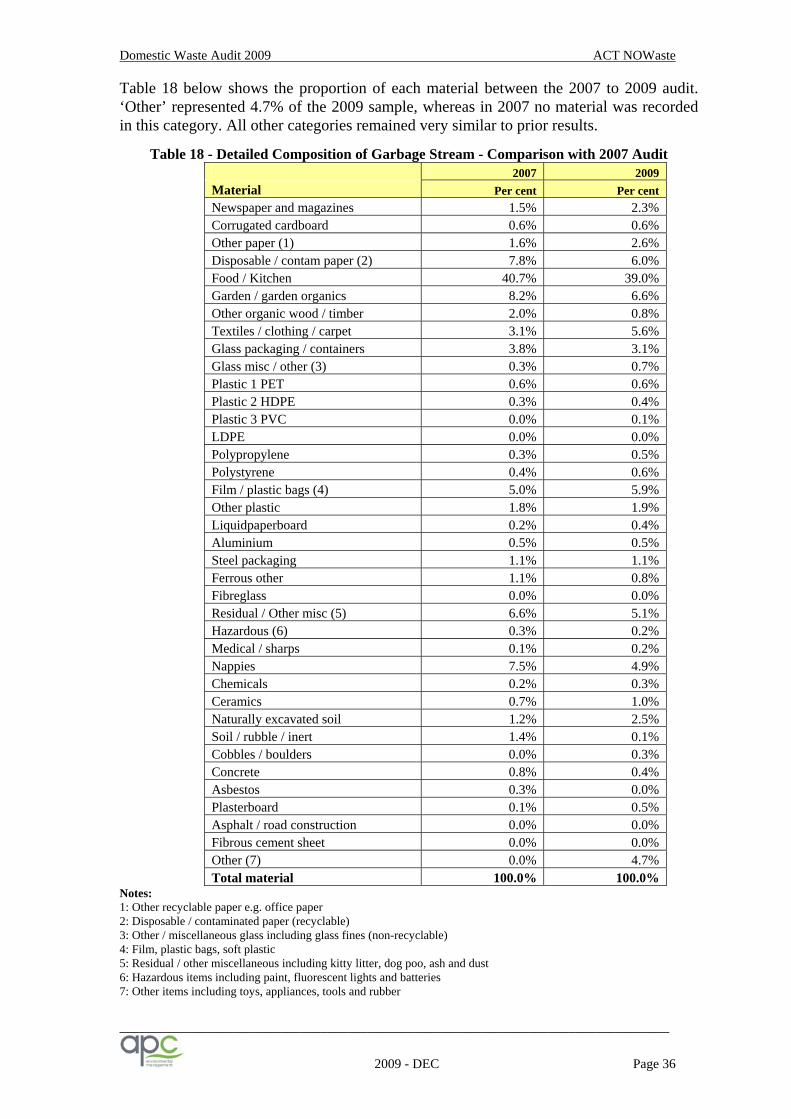
Table 18 below shows the proportion of each material between the 2007 to 2009 audit. ‘Other’ represented 4.7% of the 2009 sample, whereas in 2007 no material was recorded in this category. All other categories remained very similar to prior results.
Table 18 - Detailed Composition of Garbage Stream - Comparison with 2007 Audit 2007 2009 Material Per cent Per cent Newspaper and magazines 1.5% 2.3% Corrugated cardboard 0.6% 0.6% Other paper (1) 1.6% 2.6% Disposable / contam paper (2) 7.8% 6.0% Food / Kitchen 40.7% 39.0% Garden / garden organics 8.2% 6.6% Other organic wood / timber 2.0% 0.8% Textiles / clothing / carpet 3.1% 5.6% Glass packaging / containers 3.8% 3.1% Glass misc / other (3) 0.3% 0.7% Plastic 1 PET 0.6% 0.6% Plastic 2 HDPE 0.3% 0.4% Plastic 3 PVC 0.0% 0.1% LDPE 0.0% 0.0% Polypropylene 0.3% 0.5% Polystyrene 0.4% 0.6% Film / plastic bags (4) 5.0% 5.9% Other plastic 1.8% 1.9% Liquidpaperboard 0.2% 0.4% Aluminium 0.5% 0.5% Steel packaging 1.1% 1.1% Ferrous other 1.1% 0.8% Fibreglass 0.0% 0.0% Residual / Other misc (5) 6.6% 5.1% Hazardous (6) 0.3% 0.2% Medical / sharps 0.1% 0.2% Nappies 7.5% 4.9% Chemicals 0.2% 0.3% Ceramics 0.7% 1.0% Naturally excavated soil 1.2% 2.5% Soil / rubble / inert 1.4% 0.1% Cobbles / boulders 0.0% 0.3% Concrete 0.8% 0.4% Asbestos 0.3% 0.0% Plasterboard 0.1% 0.5% Asphalt / road construction 0.0% 0.0% Fibrous cement sheet 0.0% 0.0% Other (7) 0.0% 4.7% Total material 100.0% 100.0%
Notes: 1: Other recyclable paper e.g. office paper 2: Disposable / contaminated paper (recyclable) 3: Other / miscellaneous glass including glass fines (non-recyclable) 4: Film, plastic bags, soft plastic 5: Residual / other miscellaneous including kitty litter, dog poo, ash and dust 6: Hazardous items including paint, fluorescent lights and batteries 7: Other items including toys, appliances, tools and rubber
Domestic Waste Audit 2009 ACT NOWaste
__________________________________________________________________________________
2009 - DEC Page 37
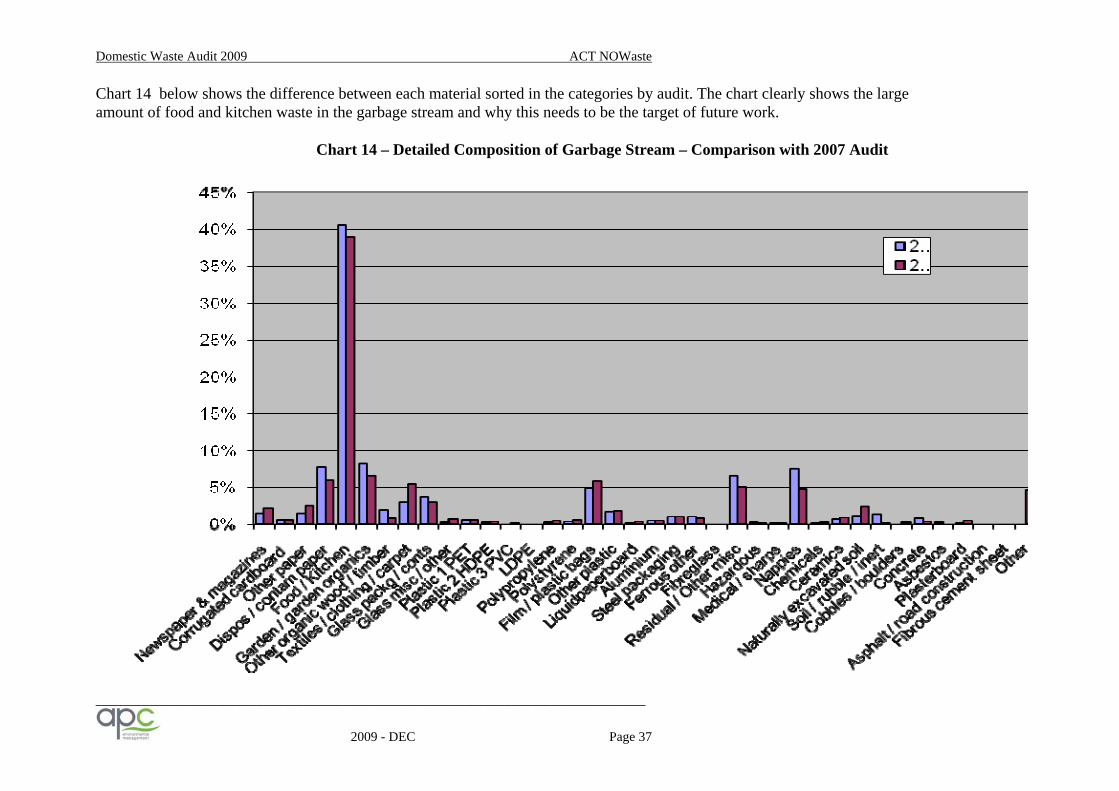
Chart 14 below shows the difference between each material sorted in the categories by audit. The chart clearly shows the large amount of food and kitchen waste in the garbage stream and why this needs to be the target of future work.
Chart 14 – Detailed Composition of Garbage Stream – Comparison with 2007 Audit

Domestic Waste Audit 2009 ACT NOWaste
__________________________________________________________________________________
2009 - DEC Page 38
6.2 Consolidated Composition of the Recycling – Comparison with Previous Audits – Chart 15 below shows a breakdown of the recycling stream for the previous audits along with this year’s analysis. The most significant improvement since 2004 is the reduction in contamination levels from 13.2% to 5.1% in 2009. The proportion of paper to containers is similar to previous results Chart 15 - Consolidated Composition of Recycling - Comparison with Previous Audits
52.3% 56.1% 58.7%
34.5%34.6%
36.2%
13.2% 9.3% 5.1%
0%
10%
20%
30%
40%
50%
60%
70%
80%
90%
100%
2004 2007 2009
Non-recyclablecontamination
Recyclable containers
Recyclable paper
The consolidated categories used in the chart above are detailed in the table below: Table 19 – Consolidated Composition of Recycling Categories
Category name Streams consolidated Category name Streams consolidated Non recyclable material
Disposable/contaminated paper Food/kitchen Film/plastic bags Textiles/clothing/carpet Ceramics Ferrous other Garden organics Nappies Chemicals Wood Hazardous Medical/sharps Other plastic Garden organics Other organic wood/timber Food/Kitchen
Recycling containers Glass containers HDPE PET Steel Liquidpaperboard Aluminium Polypropylene Polystyrene PVC LDPE
Recyclable paper Newspapers/magazines Other paper Corrugated Cardboard
Domestic Waste Audit 2009 ACT NOWaste
__________________________________________________________________________________
2009 - DEC Page 39
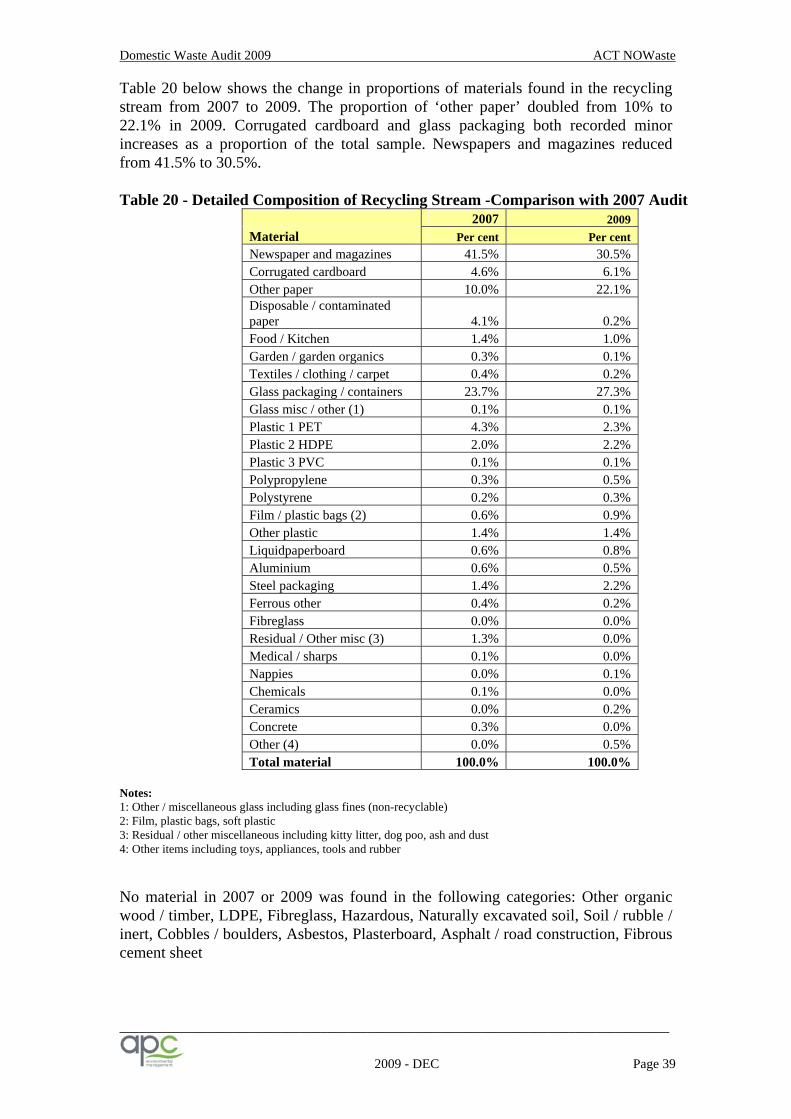
Table 20 below shows the change in proportions of materials found in the recycling stream from 2007 to 2009. The proportion of ‘other paper’ doubled from 10% to 22.1% in 2009. Corrugated cardboard and glass packaging both recorded minor increases as a proportion of the total sample. Newspapers and magazines reduced from 41.5% to 30.5%.
Table 20 - Detailed Composition of Recycling Stream -Comparison with 2007 Audit
2007 2009 Material Per cent Per cent Newspaper and magazines 41.5% 30.5% Corrugated cardboard 4.6% 6.1% Other paper 10.0% 22.1% Disposable / contaminated paper 4.1% 0.2% Food / Kitchen 1.4% 1.0% Garden / garden organics 0.3% 0.1% Textiles / clothing / carpet 0.4% 0.2% Glass packaging / containers 23.7% 27.3% Glass misc / other (1) 0.1% 0.1% Plastic 1 PET 4.3% 2.3% Plastic 2 HDPE 2.0% 2.2% Plastic 3 PVC 0.1% 0.1% Polypropylene 0.3% 0.5% Polystyrene 0.2% 0.3% Film / plastic bags (2) 0.6% 0.9% Other plastic 1.4% 1.4% Liquidpaperboard 0.6% 0.8% Aluminium 0.6% 0.5% Steel packaging 1.4% 2.2% Ferrous other 0.4% 0.2% Fibreglass 0.0% 0.0% Residual / Other misc (3) 1.3% 0.0% Medical / sharps 0.1% 0.0% Nappies 0.0% 0.1% Chemicals 0.1% 0.0% Ceramics 0.0% 0.2% Concrete 0.3% 0.0% Other (4) 0.0% 0.5% Total material 100.0% 100.0%
Notes: 1: Other / miscellaneous glass including glass fines (non-recyclable) 2: Film, plastic bags, soft plastic 3: Residual / other miscellaneous including kitty litter, dog poo, ash and dust 4: Other items including toys, appliances, tools and rubber No material in 2007 or 2009 was found in the following categories: Other organic wood / timber, LDPE, Fibreglass, Hazardous, Naturally excavated soil, Soil / rubble / inert, Cobbles / boulders, Asbestos, Plasterboard, Asphalt / road construction, Fibrous cement sheet

Domestic Waste Audit 2009 ACT NOWaste
__________________________________________________________________________________
2009 - DEC Page 40
Chart 16 below shows the difference between each material sorted in the categories by audit year. The chart clearly shows the large amount of paper and glass relative to all other materials
Chart 16 – Detailed Composition of Recycling Stream – Comparison with 2007 Audit

Domestic Waste Audit 2009 ACT NOWaste
__________________________________________________________________________________
2009 - DEC Page 41
6.3 Consolidated Composition of the Total Waste Stream – Comparison with Previous Audits
Chart 17 below shows that the total waste stream per household in 2009 is 14.52 kgs, which is less than the 2007 audit result of 16.37kg and slightly higher than the 2004 audit of 11.68kg.
Chart 17 - Total Waste Generation - Comparison with Previous Audits
7.5710.04 9.55
4.11
6.334.97
0
2
4
6
8
10
12
14
16
18
2004 2007 2009
Kilo
gram
s
Recycling
Garbage
Total 11.68 kg
Total 16.37 kg
Total 14.52 kg
6.4 Recovery Rates – All Dwellings – Comparison with Previous Audits Table 21 shows the recovery rates for major classes of materials. The recovery rates for glass, steel and PVC have increased in 2009 while cardboard has remained relatively stable. The recovery rates for all other products have dropped from the 2007 results including PET and HDPE which maybe seasonally related.
Table 21 - Recovery Rates - All Dwellings - Comparison with Previous Audits
Material Recovery rates (per cent) 2004 2007 2009 Aluminium 51.3% 45.6% 28.6% Glass 74.3% 79.6% 82.7% Steel 27.7% 44.6% 50.0% Paper 69.1% 91.5% 84.9% Cardboard 84.2% 83.8% 83.3% Liquidpaperboard 46.4% 63.4% 58.0% PET 63.3% 81.9% 66.7% HDPE 65.0% 79.0% 73.3% PVC 25.2% 47.2% 50.0% Other plastic 16.2% 32.0% 31.3% Overall 65.1% 81.9% 79.6%
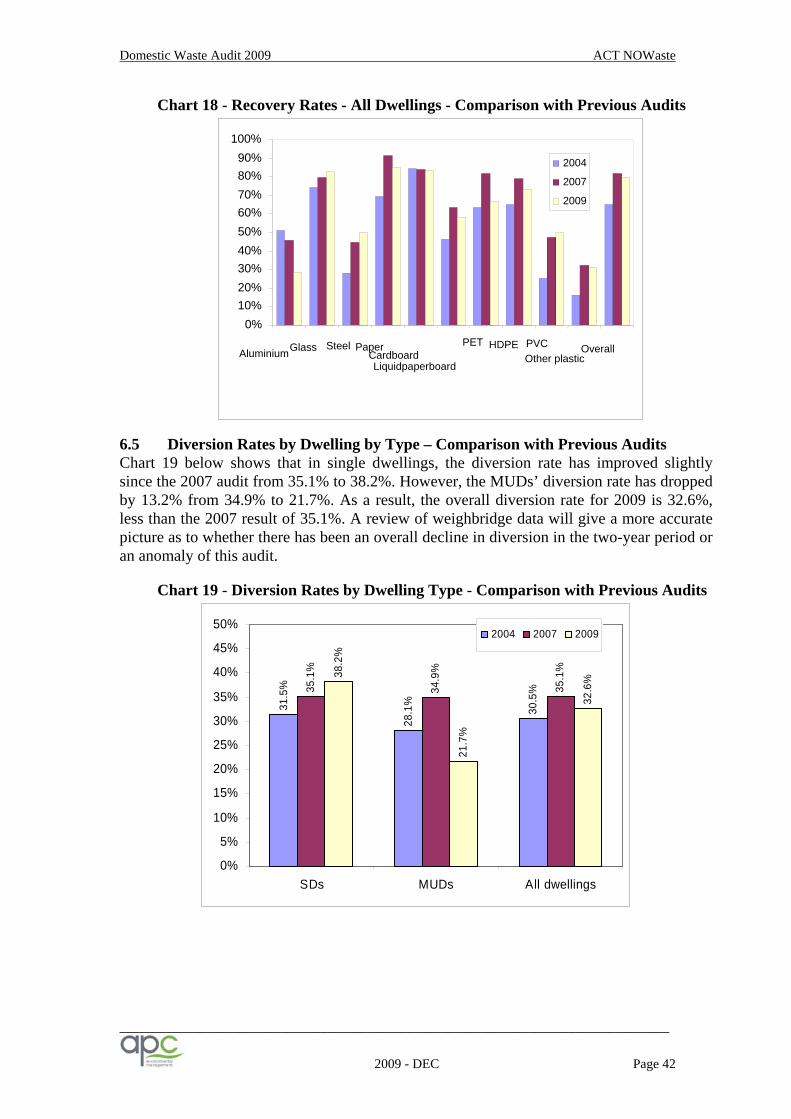
Domestic Waste Audit 2009 ACT NOWaste
__________________________________________________________________________________
2009 - DEC Page 42
Chart 18 - Recovery Rates - All Dwellings - Comparison with Previous Audits
6.5 Diversion Rates by Dwelling by Type – Comparison with Previous Audits Chart 19 below shows that in single dwellings, the diversion rate has improved slightly since the 2007 audit from 35.1% to 38.2%. However, the MUDs’ diversion rate has dropped by 13.2% from 34.9% to 21.7%. As a result, the overall diversion rate for 2009 is 32.6%, less than the 2007 result of 35.1%. A review of weighbridge data will give a more accurate picture as to whether there has been an overall decline in diversion in the two-year period or an anomaly of this audit.
Chart 19 - Diversion Rates by Dwelling Type - Comparison with Previous Audits
31.5
%
28.1
%
30.5
%35.1
%
34.9
%
35.1
%38.2
%
21.7
%
32.6
%
0%
5%
10%
15%
20%
25%
30%
35%
40%
45%
50%
SDs MUDs All dwellings
2004 2007 2009
0% 10% 20% 30% 40% 50% 60% 70% 80% 90%
100%
Aluminium Glass Steel PaperCardboardLiquidpaperboard
PET HDPE PVCOther plastic
Overall
2004 2007 2009
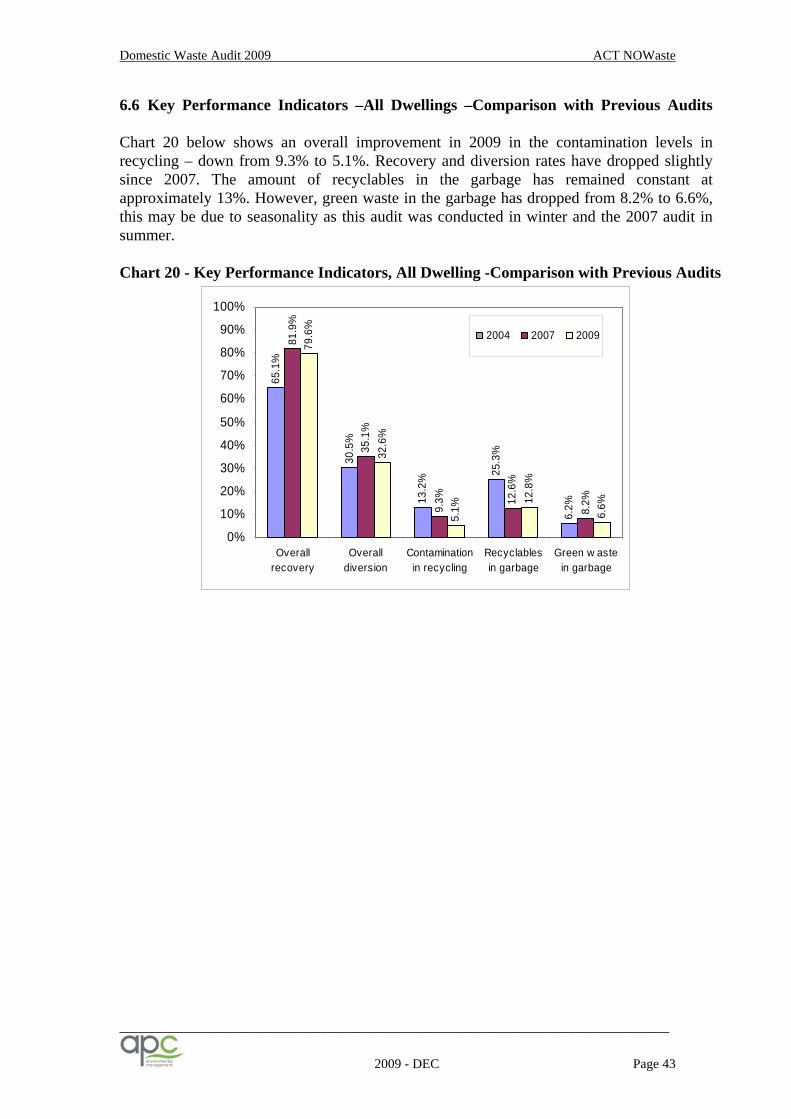
Domestic Waste Audit 2009 ACT NOWaste
__________________________________________________________________________________
2009 - DEC Page 43
6.6 Key Performance Indicators –All Dwellings –Comparison with Previous Audits
Chart 20 below shows an overall improvement in 2009 in the contamination levels in recycling – down from 9.3% to 5.1%. Recovery and diversion rates have dropped slightly since 2007. The amount of recyclables in the garbage has remained constant at approximately 13%. However, green waste in the garbage has dropped from 8.2% to 6.6%, this may be due to seasonality as this audit was conducted in winter and the 2007 audit in summer. Chart 20 - Key Performance Indicators, All Dwelling -Comparison with Previous Audits
65.1
%
30.5
%
13.2
% 25.3
%
6.2%
81.9
%
35.1
%
9.3% 12
.6%
8.2%
79.6
%
32.6
%
5.1%
12.8
%
6.6%
0%
10%
20%
30%
40%
50%
60%
70%
80%
90%
100%
Overallrecovery
Overalldiversion
Contaminationin recycling
Recyclablesin garbage
Green w astein garbage
2004 2007 2009

Domestic Waste Audit 2009 ACT NOWaste
__________________________________________________________________________________
2009 - DEC Page 44
7. STAKEHOLDER FEEDBACK The scope of works required the consultant to hold discussions with representatives from Cleanaway, the collection contractor and Thiess Services, the Materials Recovery Facility (MRF) operator on how and why undesirable materials enter the domestic waste stream and how this might be reduced, avoided or remedied. A summary of these discussions and suitable recommendations for remedial actions or educational activities that might address the situation were to be included. Only the draft report of May 2009 was forwarded to the stakeholders for comment due to time constraints in completing the December report with the November MUDG data. 7.1 Cleanaway Transpacific Ltd A copy of the draft report was sent to John Coughlin, Regional Manager of Cleanaway Transpacific on 25th May 2009, seeking review and input following initial telephone contact by APC. We specifically requested that Cleanaway review the report and provide any feed back or comments for inclusion in this section. On 3rd June 2009 APC received an email response that simply stated “I have had a quick look, please proceed don’t let me hold up the process.” Further email correspondence was sent by ACT NoWaste requesting any specific comments relating to: “how and why undesirable materials enter the domestic waste stream and how this might be reduced, avoided or remedied”. The email also asked, “Are there any issues relating to stickering of bins, monitoring of contents, problem customers etc that we should be aware of or improve? Other issues? It’s a good opportunity to get recommendations on the books.” John Couglan responded by providing the following response: “Cleanaway does keep looking at weights and monitor variations or trends in waste generation as we are contracted to collect and deliver to the appropriate facility for disposal or recovery the MSW waste stream. However, in respect to the recent waste audit APC conducted for the ACT government I would consider that any decrease in waste generation is due mainly to seasonality given the 2007 audit was conducted in summer (November) and this one in May 2009. Canberra has a highly educated community with a higher than average level of environmental awareness and a general sense of compliance with regulations. This is reflected in the low level of green waste in garbage as many households have private arrangements with “trash pak” operators. It is cheaper and easier to put it in the garbage bin but they are compliant and try to do “the right thing”. The Customer Call Centre get many calls from people seeking clarification on information and how to dispose of unusual items – they don’t want to do the wrong thing. The decrease in contamination levels is likely to be as a result of a recent TV campaign that ACT NoWaste has undertaken with education funds provided by the contractors. All bins are correctly stickered and in the majority of cases correctly used.

Domestic Waste Audit 2009 ACT NOWaste
__________________________________________________________________________________
2009 - DEC Page 45
Canberra would have one of the largest recycling ratios to garbage of any community in Australia. What else we can do is just keep on reinforcing the message for new-comers and as reminders to existing customers and the community generally. It must be noted that the audit only tells part of the story as residents have other opportunities to dispose of excess rubbish at the landfill or transfer stations and excess recycling at the six drop off centres. Since Cleanaway commenced the Domestic collection contract, we have noticed over the years the tonnages at the drop off facilities have increased dramatically and are used by both households and commercial premises. They are also used as a dumping ground with a very high level of contamination found, which is cause for concern to the MRF operator.”
7.2 Thiess Services Richard Iles, MRF Manager of the Thiess Services MRF provided the following information to David Roberts from ACT NoWaste in relation to previous audit years and specific audit periods. “In short, the end of October beginning of November is the start of the biggest tonnes in recycling, basically the silly season in Canberra. To compare November to May is difficult. May has more paper, less glass. November considerably more glass. This will produce the biggest difference for bin weights with the same volume. May historically is a month where tonnage starts to drop. Looking at the suburbs listed for 07 and 09, the cross section of suburbs listed would cancel out the effect of some areas recycling better than others. I must advise though that we at the MRF do see a difference in recycling quality from suburb to suburb.”
7.3 Summary Both the collection contractor and the MRF processor confirm that garbage has less garden waste while recyclable paper is higher in winter and lower in summer and with glass the reverse is true. It is therefore difficult to directly compare results due to seasonal differences in the consumption and disposal habits of society. In the opinion of Cleanaway, everything that can be is being done, from bins being correctly stickered, customer support to assist enquiries and the recently conducted mass media television campaign. Neither contractor can offer a practical suggestion as to how to improve on the overall results of the 2009 audit.
Domestic Waste Audit 2009 ACT NOWaste
__________________________________________________________________________________
2009 - DEC Page 46
8. CONCLUSION Overall, the results of the 2009 audit show an improvement in performance in the areas of contamination, waste generation and green waste present in the garbage stream over the 2007 audit results. However, diversion and recovery have declined slightly and the amount of recyclables in the garbage stream has increased slightly. The overall waste generation for ACT has dropped from 16.37kg per household per week in 2007 to 12.82kg in 2009, with the garbage component decreasing from 10.04kg to 8.38kg – a difference of 1.6kg. Contamination in the recycling stream decreased from 9.3% to 4.9%. Typically, recycling collection services utilising a fully commingled system can achieve contamination levels of between 3% and 5% deemed to be best practice standards. ACT NoWaste is now within this standard. The presence of green waste in the garbage bin also decreased from 8.2% to 5.3% however, this may be more a response to the climatic season when the audit was conducted than the behaviour of residents. The presence of recyclables in the garbage stream increased slightly from 12.6% in 2007 to 13% in 2009 and the overall recovery rate for all dwellings dropped from 81.9% in 2007 to 72.8% in 2009. Glass had the highest recovery of 81.4% with paper at 74.7%, and plastics and liquidpaperboard were all around the 50% with aluminium at just 25%. It is understood ACT NoWaste has spent considerable funds on a high profile communication program which appears, from the audit results, not to have achieved the desired results of higher yield as recycling recovery has decreased. The greatest opportunity for improvement is in MUDs using hoppers which currently contain the largest amount of recyclables in the garbage stream not diverted for recycling. Future education and communication efforts must concentrate on improving the performance of MUDs and the recovery of all materials, in particular the heaviest materials being paper and glass. This year, the overall diversion rate fell slightly from 35.1% to 33%. The focus has to be on organic recovery as food has a potential to increase diversion by 25% while the most the recycling service can achieve is 8.4% diversion at best. The greatest opportunity for ACT NoWaste to improve the performance of the waste management system for domestic premises is to increase diversion from landfill by managing the organic fraction of the waste stream and, in particular, the food waste component. This component represents 51.6% of the current bin contents and includes food and kitchen waste (39%), disposable and contaminated paper (6%) and garden waste (6.6%). Other councils nationally have offered garden waste services to their residents and are now incorporating food waste collections. Many council’s have moved garbage service collection frequency to fortnightly and organics collection to weekly. However, the ACT

Domestic Waste Audit 2009 ACT NOWaste
__________________________________________________________________________________
2009 - DEC Page 47
has encouraged its residents to manage green waste on-site or by engaging private contractors. This now presents a dilemma as to how to undertake a program to extract the small amount of garden waste and the considerable amount of food waste from the garbage stream. The use of AWT to process the entire residuals waste stream is one clear option available. If AWT processes are not considered, then ACT NoWaste will need to make long-term plans to have sufficient landfill capacity for up to 68% of the garbage waste stream in future years until the organic fraction is addressed. After addressing the organic fraction, the remaining 41.7% comprising ‘other material’ (19.4%), nappies (4.9%), textiles/clothing and carpet (5.6%), plastic film (5.9%) and contaminated paper (6%), will still require disposal as this is the proportion of the current waste stream that is neither organic nor recyclable with current processes.
Domestic Waste Audit 2009 ACT NOWaste
__________________________________________________________________________________
2009 - DEC Page 48
9. RECOMMENDATIONS
The scope of works required the consultant to make recommendations on how the information contained in this audit might be used to reduce waste to landfill and increase recycled waste.
While the waste audit provides a snapshot of current waste generation and consumption and disposal patterns from a randomly selected stratified number of households, it is only one piece of information that the ACT needs if it is to undertake a full review of current waste management in the Territory’s quest for greater performance. APC would recommend the following activities are also undertaken: Short Term
1. That ACT NoWaste undertake an independent operational review and communication audit to ascertain how the existing service is being delivered, interaction with residents and what methods and means are used to communicate with the community about the recycling service.
2. That emphasis be placed on communicating with residents living in multi-unit
dwellings in relation to recycling performance, as this is where a substantial amount of recyclables are evident in the garbage stream and the greatest opportunity lies.
3. Ongoing education, communication and motivation of the broader community are
necessary to maintain current recycling performance. The method and means to undertake this activity may become clearer if a communication audit is undertaken. However, it is generally accepted that multi-pronged comprehensive campaigns desired to reach all sectors of the community achieve the greatest results.
Mid Term 4. Investigate the options for processing the residuals to recover the organic fraction of the
waste stream and, in particular, the food waste and the recyclables still in the garbage stream. Such a process can target 70% of the current garbage bin contents and reduce substantially the need for landfill capacity in the decades ahead.
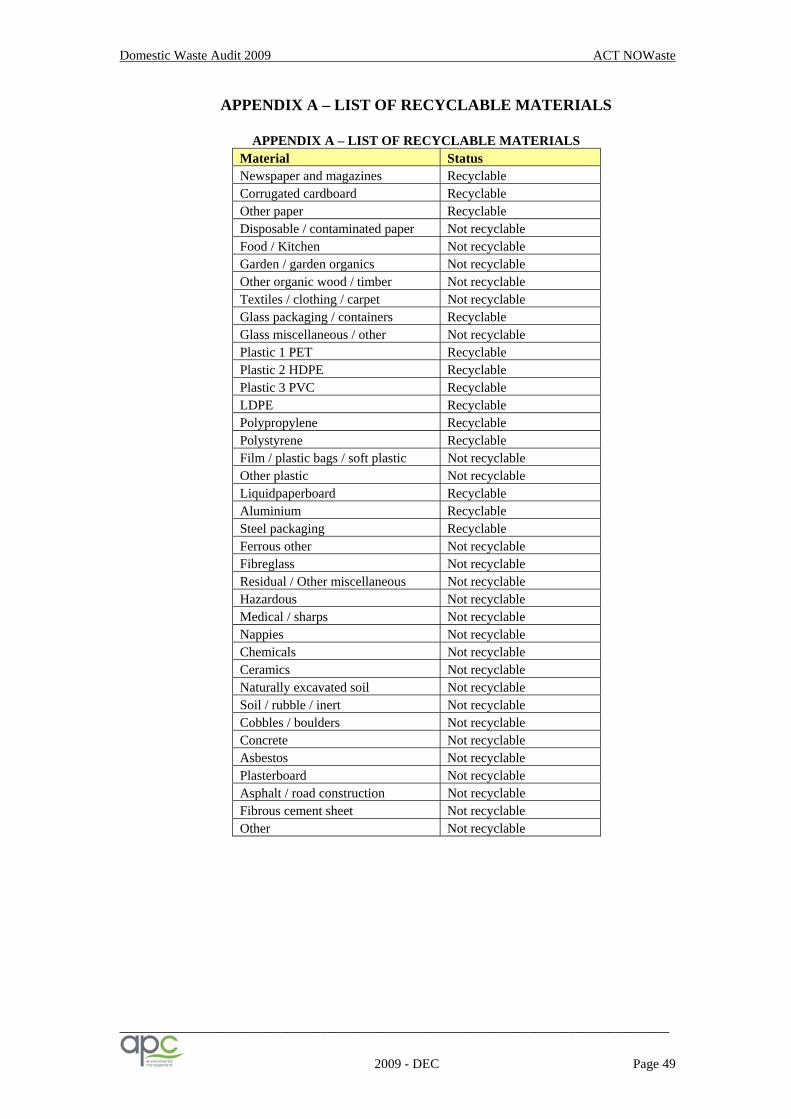
Domestic Waste Audit 2009 ACT NOWaste
__________________________________________________________________________________
2009 - DEC Page 49
APPENDIX A – LIST OF RECYCLABLE MATERIALS
APPENDIX A – LIST OF RECYCLABLE MATERIALS Material Status Newspaper and magazines Recyclable Corrugated cardboard Recyclable Other paper Recyclable Disposable / contaminated paper Not recyclable Food / Kitchen Not recyclable Garden / garden organics Not recyclable Other organic wood / timber Not recyclable Textiles / clothing / carpet Not recyclable Glass packaging / containers Recyclable Glass miscellaneous / other Not recyclable Plastic 1 PET Recyclable Plastic 2 HDPE Recyclable Plastic 3 PVC Recyclable LDPE Recyclable Polypropylene Recyclable Polystyrene Recyclable Film / plastic bags / soft plastic Not recyclable Other plastic Not recyclable Liquidpaperboard Recyclable Aluminium Recyclable Steel packaging Recyclable Ferrous other Not recyclable Fibreglass Not recyclable Residual / Other miscellaneous Not recyclable Hazardous Not recyclable Medical / sharps Not recyclable Nappies Not recyclable Chemicals Not recyclable Ceramics Not recyclable Naturally excavated soil Not recyclable Soil / rubble / inert Not recyclable Cobbles / boulders Not recyclable Concrete Not recyclable Asbestos Not recyclable Plasterboard Not recyclable Asphalt / road construction Not recyclable Fibrous cement sheet Not recyclable Other Not recyclable

Domestic Waste Audit 2009 ACT NOWaste
__________________________________________________________________________________
2009 - DEC Page 50
APPENDIX B – COMPOSITION OF GARBAGE STREAM Weight (kgs)
Material Single
dwgs (1) Per
cent
MUDs w hoppers
(2) Per
cent MUDs w
MGBs (3) Per
cent Total Per
cent Newspaper and magazines 30.6 1.7% 14.3 5.8% 9.0 3.0% 53.9 2.3% Corrugated cardboard 5.1 0.3% 8.7 3.5% 1.1 0.4% 14.9 0.6% Other paper (4) 44.2 2.4% 0.0 0.0% 17.5 5.9% 61.7 2.6% Disposable / contam paper (5) 116.6 6.3% 12.4 5.0% 13.8 4.7% 142.8 6.0% Food / Kitchen 740.1 40.1% 90.7 36.5% 100.1 33.8% 930.9 39.0% Garden / garden organics 107.9 5.9% 20.4 8.2% 28.5 9.6% 156.8 6.6% Other organic wood / timber 18.9 1.0% 0.0 0.0% 0.7 0.2% 19.6 0.8% Textiles / clothing / carpet 78.3 4.2% 7.3 2.9% 47.4 16.0% 133.0 5.6% Glass packaging / containers 43.9 2.4% 22.2 8.9% 7.5 2.5% 73.6 3.1% Glass misc / other (6) 12.3 0.7% 1.5 0.6% 1.9 0.6% 15.7 0.7% Plastic 1 PET 10.0 0.5% 2.0 0.8% 1.8 0.6% 13.8 0.6% Plastic 2 HDPE 7.1 0.4% 1.6 0.6% 1.0 0.3% 9.7 0.4% Plastic 3 PVC 2.0 0.1% 0.2 0.1% 0.3 0.1% 2.5 0.1% LDPE 0.9 0.0% 0.0 0.0% 0.0 0.0% 0.9 0.0% Polypropylene 11.6 0.6% 0.0 0.0% 0.0 0.0% 11.6 0.5% Polystyrene 11.9 0.6% 1.7 0.7% 0.8 0.3% 14.4 0.6% Film / plastic bags (7) 111.1 6.0% 13.5 5.4% 15.3 5.2% 139.9 5.9% Other plastic 36.3 2.0% 4.0 1.6% 4.3 1.5% 44.6 1.9% Liquidpaperboard 6.2 0.3% 1.5 0.6% 0.7 0.2% 8.4 0.4% Aluminium 11.1 0.6% 0.9 0.4% 0.7 0.2% 12.7 0.5% Steel packaging 23.1 1.3% 2.0 0.8% 1.5 0.5% 26.6 1.1% Ferrous other 10.0 0.5% 5.1 2.1% 4.5 1.5% 19.6 0.8% Fibreglass 0.0 0.0% 0.0 0.0% 0.0 0.0% 0.0 0.0% Residual / Other misc (8) 120.7 6.5% 0.0 0.0% 0.0 0.0% 120.7 5.1% Hazardous (9) 5.0 0.3% 0.2 0.1% 0.4 0.1% 5.6 0.2% Medical / sharps 5.4 0.3% 0.0 0.0% 0.0 0.0% 5.4 0.2% Nappies 107.7 5.8% 6.9 2.8% 1.7 0.6% 116.3 4.9% Chemicals 5.0 0.3% 1.1 0.4% 1.1 0.4% 7.2 0.3% Ceramics 18.2 1.0% 0.0 0.0% 4.8 1.6% 23.0 1.0% Naturally excavated soil 59.2 3.2% 0.0 0.0% 0.0 0.0% 59.2 2.5% Soil / rubble / inert 2.5 0.1% 0.0 0.0% 0.0 0.0% 2.5 0.1% Cobbles / boulders 6.9 0.4% 0.0 0.0% 0.0 0.0% 6.9 0.3% Concrete 4.1 0.2% 0.0 0.0% 5.9 2.0% 10.0 0.4% Asbestos 0.0 0.0% 0.0 0.0% 0.0 0.0% 0.0 0.0% Plasterboard 12.2 0.7% 0.0 0.0% 0.0 0.0% 12.2 0.5% Asphalt / road construction 0.0 0.0% 0.0 0.0% 0.0 0.0% 0.0 0.0% Fibrous cement sheet 0.0 0.0% 0.0 0.0% 0.0 0.0% 0.0 0.0% Other (10) 57.9 3.1% 30.0 12.1% 24.0 8.1% 111.9 4.7% Total material 1,844.0 100.0% 248.2 100.0% 296.3 100.0% 2,388.5 100.0%
Notes: 1: Single dwellings 2: Multi-unit dwellings with hoppers as garbage containers 3: Multi-unit dwellings with MGBs as garbage containers 4: Other recyclable paper e.g. office paper 5: Disposable / contaminated paper (recyclable) 6: Other / miscellaneous glass including glass fines (non-recyclable) 7: Film, plastic bags, soft plastic 8: Residual / other miscellaneous including kitty litter, dog poo, ash and dust 9: Hazardous items including paint, fluorescent lights and batteries 10: Other items including toys, appliances, tools and rubber
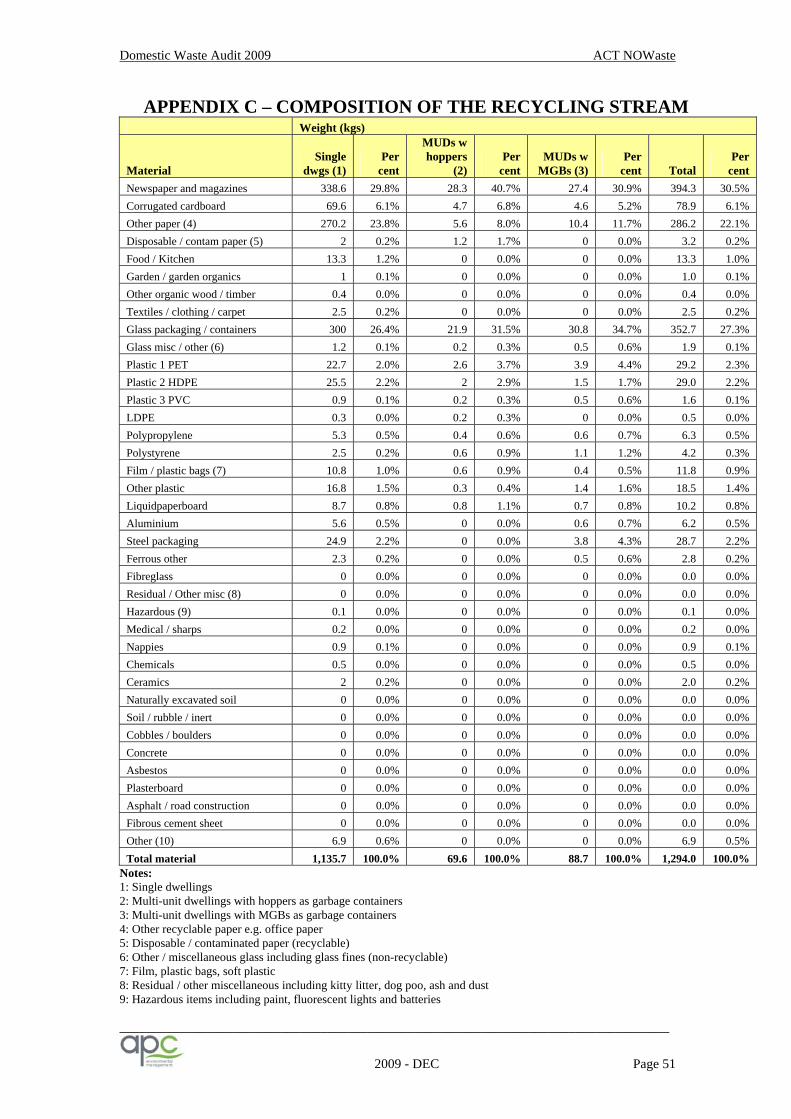
Domestic Waste Audit 2009 ACT NOWaste
__________________________________________________________________________________
2009 - DEC Page 51
APPENDIX C – COMPOSITION OF THE RECYCLING STREAM Weight (kgs)
Material Single
dwgs (1) Per
cent
MUDs w hoppers
(2) Per
cent MUDs w
MGBs (3) Per
cent Total Per
cent Newspaper and magazines 338.6 29.8% 28.3 40.7% 27.4 30.9% 394.3 30.5% Corrugated cardboard 69.6 6.1% 4.7 6.8% 4.6 5.2% 78.9 6.1% Other paper (4) 270.2 23.8% 5.6 8.0% 10.4 11.7% 286.2 22.1% Disposable / contam paper (5) 2 0.2% 1.2 1.7% 0 0.0% 3.2 0.2% Food / Kitchen 13.3 1.2% 0 0.0% 0 0.0% 13.3 1.0% Garden / garden organics 1 0.1% 0 0.0% 0 0.0% 1.0 0.1% Other organic wood / timber 0.4 0.0% 0 0.0% 0 0.0% 0.4 0.0% Textiles / clothing / carpet 2.5 0.2% 0 0.0% 0 0.0% 2.5 0.2% Glass packaging / containers 300 26.4% 21.9 31.5% 30.8 34.7% 352.7 27.3% Glass misc / other (6) 1.2 0.1% 0.2 0.3% 0.5 0.6% 1.9 0.1% Plastic 1 PET 22.7 2.0% 2.6 3.7% 3.9 4.4% 29.2 2.3% Plastic 2 HDPE 25.5 2.2% 2 2.9% 1.5 1.7% 29.0 2.2% Plastic 3 PVC 0.9 0.1% 0.2 0.3% 0.5 0.6% 1.6 0.1% LDPE 0.3 0.0% 0.2 0.3% 0 0.0% 0.5 0.0% Polypropylene 5.3 0.5% 0.4 0.6% 0.6 0.7% 6.3 0.5% Polystyrene 2.5 0.2% 0.6 0.9% 1.1 1.2% 4.2 0.3% Film / plastic bags (7) 10.8 1.0% 0.6 0.9% 0.4 0.5% 11.8 0.9% Other plastic 16.8 1.5% 0.3 0.4% 1.4 1.6% 18.5 1.4% Liquidpaperboard 8.7 0.8% 0.8 1.1% 0.7 0.8% 10.2 0.8% Aluminium 5.6 0.5% 0 0.0% 0.6 0.7% 6.2 0.5% Steel packaging 24.9 2.2% 0 0.0% 3.8 4.3% 28.7 2.2% Ferrous other 2.3 0.2% 0 0.0% 0.5 0.6% 2.8 0.2% Fibreglass 0 0.0% 0 0.0% 0 0.0% 0.0 0.0% Residual / Other misc (8) 0 0.0% 0 0.0% 0 0.0% 0.0 0.0% Hazardous (9) 0.1 0.0% 0 0.0% 0 0.0% 0.1 0.0% Medical / sharps 0.2 0.0% 0 0.0% 0 0.0% 0.2 0.0% Nappies 0.9 0.1% 0 0.0% 0 0.0% 0.9 0.1% Chemicals 0.5 0.0% 0 0.0% 0 0.0% 0.5 0.0% Ceramics 2 0.2% 0 0.0% 0 0.0% 2.0 0.2% Naturally excavated soil 0 0.0% 0 0.0% 0 0.0% 0.0 0.0% Soil / rubble / inert 0 0.0% 0 0.0% 0 0.0% 0.0 0.0% Cobbles / boulders 0 0.0% 0 0.0% 0 0.0% 0.0 0.0% Concrete 0 0.0% 0 0.0% 0 0.0% 0.0 0.0% Asbestos 0 0.0% 0 0.0% 0 0.0% 0.0 0.0% Plasterboard 0 0.0% 0 0.0% 0 0.0% 0.0 0.0% Asphalt / road construction 0 0.0% 0 0.0% 0 0.0% 0.0 0.0% Fibrous cement sheet 0 0.0% 0 0.0% 0 0.0% 0.0 0.0% Other (10) 6.9 0.6% 0 0.0% 0 0.0% 6.9 0.5% Total material 1,135.7 100.0% 69.6 100.0% 88.7 100.0% 1,294.0 100.0%
Notes: 1: Single dwellings 2: Multi-unit dwellings with hoppers as garbage containers 3: Multi-unit dwellings with MGBs as garbage containers 4: Other recyclable paper e.g. office paper 5: Disposable / contaminated paper (recyclable) 6: Other / miscellaneous glass including glass fines (non-recyclable) 7: Film, plastic bags, soft plastic 8: Residual / other miscellaneous including kitty litter, dog poo, ash and dust 9: Hazardous items including paint, fluorescent lights and batteries