actuarial 101 – pension basics - surs 4- 5b...actuarial 101 – pension basics illinois surs...
TRANSCRIPT

Copyright © 2013 GRS – All rights reserved.
Actuarial 101 – Pension Basics
Illinois SURS September 12, 2013From the GRS education syllabus
Exhibit 4

Agenda
Retirement Plans
Actuarial Mathematics
Actuarial Assumptions
Outlook
2
Exhibit 4

RETIREMENT PLANS
3
Exhibit 4

Types of Retirement Plans
Defined Benefit (DB) Plans
Defined Contribution (DC) Plans
Hybrid Plans
4
Exhibit 4

Pure Defined Benefit Plans
Benefit determined by a formula
Usually involves Years of Credited Service
Final Average Salary (FAS)
A multiplier such as 2.2%
2.2% x 30 years x $50,000 = $33,000 per year
5
Exhibit 4

Pure Defined Contribution Plans
A stated percent of earnings is put into an account each year
Employee can usually direct the investment of that account
Balance in the account is available for distribution at retirement (or earlier)
6
Exhibit 4

Hybrid Plans
Pension plans that have elements of defined benefit plans and defined contributions
Usually involved the benefit for the participant being awarded as a lump sum instead of as an annuity
These types of plans are regulated as defined benefit plans
Examples of hybrid pension plans include cash balance and pension equity plans
7
Exhibit 4

Defined Benefit Plan
Investment Risk (Poor performance) Mortality Risk (Long lives)Inflation Risk (Pay increases, CPI COLA)
Employer bears the risksBenefits are predictable (defined)
8
Risk Characteristics
Exhibit 4

Defined Contribution Plan
Investment Risk (Poor performance)Mortality Risk (Long lives)Inflation Risk (No COLA)
Employee bears the risksBenefits are not predictable
9
Risk Characteristics
Exhibit 4

ACTUARIAL MATHEMATICS
10
Exhibit 4

Basic Retirement Funding Equation
Where:►C is Contribution Income►I is Investment Return►B is Benefits Paid►E is Expenses
11
C I B E
“Money In = Money Out”
Exhibit 4

Basic Retirement Funding Equation
B depends on►Plan Provisions►Experience
C depends on►Short Term: Actuarial Assumptions
Actuarial Cost Method►Long Term: I, B, E
12
C I =B E
Exhibit 4

The Concept of Present Value
Actuarial calculations almost always begin with the calculation of a present value
The present value of an amount of money payable in the future is the amount of money that, if we had it today, would accumulate to the amount that will be payable in the future
13
Exhibit 4

Funding a $10,000 Annual Pension for a Person
14
$8,000Present Value of
Future Normal Costs
At Retirement Date
At Valuation Date
$90,000
$25,000
Allocated to Past and Future Service
$17,000Actuarial Accrued Liability
Actuarial Accrued Liabilities- Accrued Assets
Unfunded Actuarial Accrued Liabilities
Present Value of Benefits
Exhibit 4

Funding a $10,000 Annual Pension for a Person
15
Present Value of Benefits At Valuation Date: $25,000
Present Value of Benefits at Retirement: $90,000
Allocated to Past and Future Service
• Actuarial Accrued Liability: $17,000
• Present Value of Future Normal Costs: $8,000
Exhibit 4

Funding a $10,000 Annual Pension for a Person
16
Actuarial Accrued Liability
Accrued Assets
Unfunded Actuarial Accrued Liability
Exhibit 4

Completing the Pension Funding
17
As the person ages, the boxes grow Northward until the PVB becomes $90,000. At the same time, the normal cost layer moves to the right. At retirement, there is one big square box; the accrued liability and the PVB are both $90,000, and the Future Normal Cost is $0.
Accrued Liability Future Normal Cost
Normal Cost
25 X RET$25,000
$17,000 $8,000
$90,000 PVB
Exhibit 4

As the person ages, the boxes grow Northward until the PVB becomes $90,000. At the same time, the normal cost layer moves to the right. At retirement, there is one big square box; the accrued liability and the PVB are both $90,000, and the Future Normal Cost is $0.
Accrued Liability Future Normal Cost
Normal Cost
25 X RET$25,000
$90,000 PVB
Completing the Pension Funding
18
Exhibit 4

As the person ages, the boxes grow Northward until the PVB becomes $90,000. At the same time, the normal cost layer moves to the right. At retirement, there is one big square box; the accrued liability and the PVB are both $90,000, and the Future Normal Cost is $0.
Accrued Liability Future Normal
Cost
Normal Cost
25 X RET$25,000
$90,000 PVB
Completing the Pension Funding
19
Exhibit 4

As the person ages, the boxes grow Northward until the PVB becomes $90,000. At the same time, the normal cost layer moves to the right. At retirement, there is one big square box; the accrued liability and the PVB are both $90,000, and the Future Normal Cost is $0.
Accrued Liability Future Normal
Cost
Normal Cost
25 X RET
$25,000
$90,000 PVB
Completing the Pension Funding
20
Exhibit 4

As the person ages, the boxes grow Northward until the PVB becomes $90,000. At the same time, the normal cost layer moves to the right. At retirement, there is one big square box; the accrued liability and the PVB are both $90,000, and the Future Normal Cost is $0.
Accrued Liability=PVB=$90,000
PVB
25
$25,000
$90,000
RET
Completing the Pension Funding
21
Exhibit 4

The Long Term Solution to the Equation
22
Start 50
% of ActiveMemberPayroll
Years of Time
CASH BENEFITS
Employer and Employee Contributions
Investment IncomeLevel Contributions
Pay-As-You-Go Contributions
Exhibit 4

Measurement of Assets
For assets that have to be used today, Market Value is the most sensible measure
In the long term, the Market is always right In the short term the Market is often volatile and subject to
temporary conditions and mood swings that distort the value In pension funding, a volatile measurement of assets would
tend to produce volatile contribution rates and funding progress measurements, both of which are undesirable
Commonly in pension funding, some type of smoothed market measurement is applied to the assets, and the result is called the ʺActuarial Value of Assetsʺ or the ʺFunding Value of Assetsʺ
23
Exhibit 4

Example Calculation
Beginning Funding Value 45,676.7$ Plus Net Cash Flow (735.4) + Assumed Return (8.0%) 3,624.7 +Phased in Return (loss) (36)
=Ending Funding Value of Assets 48,530$ Market Value of Assets 47,452$ Ratio 102%
24
Total Assets in Thousands
The difference between Funding Value and Market Value is $1,078 which must be phased‐in over a period of future years.
Exhibit 4
Development of Funded Ratio ($000)
25
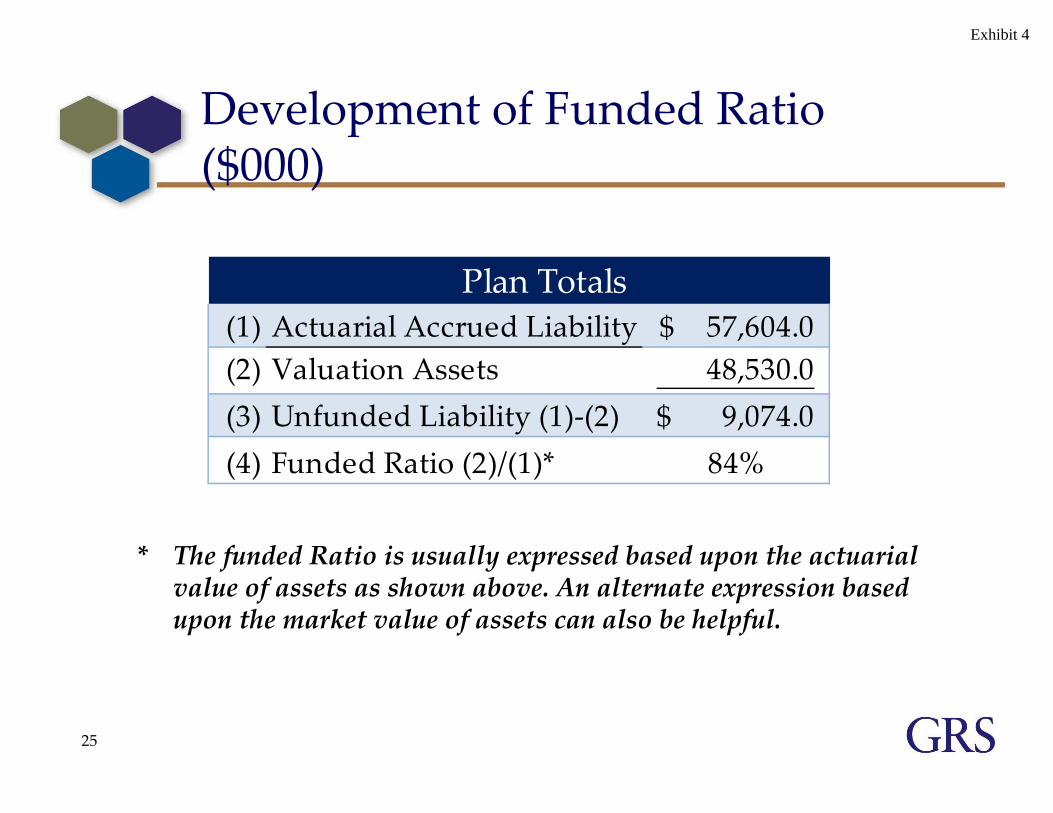
(1) Actuarial Accrued Liability 57,604.0$ (2) Valuation Assets 48,530.0 (3) Unfunded Liability (1)‐(2) 9,074.0$ (4) Funded Ratio (2)/(1)* 84%
Plan Totals
* The funded Ratio is usually expressed based upon the actuarial value of assets as shown above. An alternate expression based upon the market value of assets can also be helpful.
Exhibit 4

Discussion of Funded Ratios
Difficult to compare from one system to another
Actuarial assumptions not uniformValuation dates and reporting schedules are different
Different past historyTrend in funded ratio is more important than the absolute level
26
Exhibit 4

Which Plan Would You Want To Retire From?
27
Plan 1 Plan 22001 30% 90%2002 33% 87%2003 36% 84%2004 39% 81%2005 42% 78%2006 45% 75%2007 48% 72%2008 51% 69%2009 54% 66%2010 57% 63%2011 60% 60%
Funding Ratio
Exhibit 4

Example Contribution Rate Results
28
20%
4%
24%
Contribution for Normal
Cost
Contribution for Unfunded Actuarial Liability: 30 year financing of $9,074,000
• Normal Cost is the value of this year’s benefit accruals. Some portion is often paid by members.
• Contributions are usually expressed as a % of payroll.
Exhibit 4

Funding Unfunded Liabilities
Usually funded as a level % of payrollOften over a closed (decreasing) period of years
Floating or fixed period (open) also possible
Narrow range of practice, but practices change with the market
29
Exhibit 4

Case Study of a Benefit Change
A plan is amended to provide a 10% benefit increase, so the contribution rate has to go up 10% right?
30
Exhibit 4

Wrong!!
Before Change After Change
Total Normal Cost 20% 22%
Accrued Liabilities $100 Million $110 Million
Assets $90 Million $90 Million
Unfunded Liability $10 Million $20 Million
% to Amortize 4% 8%
Total Contribution 24% 30%
% Increase 25.0%
31
Contribution Expressed as %’s of Active Payroll
In this example, a 10% increase in benefits led to a 25% increase in contributions.
Exhibit 4

Comments
If the Market Value and the Actuarial Value of Assets differ materially, there will be an upward or downward bias in the actuary’s calculations of the contribution rate going forward
Consequently, some actuaries provide an alternate expression of the contribution rate based on Market Value of Assets
32
Exhibit 4

ACTUARIAL ASSUMPTIONS
33
Exhibit 4

The Concept of Present Value
Actuarial calculations almost always begin with the calculation of a present value
The present value of an amount of money payable in the future is the amount of money that, if we had it today, would accumulate to the amount that will be payable considering:►Investment return►Probability that money will be paid
The calculation of the present value depends upon assumptions
34
Exhibit 4

Present Value Assumptions
Investment Return►Relates to Economic Assumptions
Probability that Money will be Paid►Relates to Demographic Assumptions, Mortality, Turnover, etc.
35
Exhibit 4

How Do Economic Assumptions Compare?
36
Assumption Interest Wage Inflation SpreadHigh 8.5% 5.5% 5.5%Low 7.0% 2.5% 2.75%
Most Common 8.0% 3.5% 4.5%
As a general rule, the most important assumption is the spread. A high spread indicates a higher level of risk, which is similar to, but not necessarily identical to, the Equity Risk Premium share of the interest rate assumption.
Information from the FY 2010 NASRA/NCTR Public Fund Survey indicates the following for 126 large Retirement Systems.
Exhibit 4

Selection of Assumptions
Economic•Investment Return•Payroll Growth Rate
•Population Growth Rate (Usually, a constant population size is assumed)
Demographic•Retirement Rates•Promotional/Step Pay Increases
•Disability•Turnover•Mortality
Economic
• Board• Actuary• Other Advisors
Demographic
• Mostly Actuary
• Board Approves
37
What Are They? Who Selects Them?
Exhibit 4

Changes in Major Assumptions
Assumption Action Usual Effect
Interest Rate Increase Decrease
Wage Inflation Increase Increase
Spread Increase Decrease
Population Growth Increase Decrease
Retirement Retire Younger Increase
Turnover More Quits Decrease
Mortality Live Longer Increase
38
Effect on Liabilities and Contributions
Exhibit 4

Outlook for Public Sector DB Plans
Higher costsFewer benefit enhancementsNew tiers for new hiresMore focus on actuarial assumptions DB Plans could be closed to new entrantsIncreased focus on Defined Contribution
39
Exhibit 4

THANK YOU
40
Exhibit 4

Disclaimers
Circular 230 Notice: Pursuant to regulations issued by the IRS, to the extent this presentation concerns tax matters, it is not intended or written to be used, and cannot be used, for the purpose of (i) avoiding tax‐related penalties under the Internal Revenue Code or (ii) marketing or recommending to another party any tax‐related matter addressed within. Each taxpayer should seek advice based on the individual’s circumstances from an independent tax advisor.
This presentation shall not be construed to provide tax advice, legal advice or investment advice.
Readers are cautioned to examine original source materials and to consult with subject matter experts before making decisions related to the subject matter of this presentation.
This presentation expresses the views of the author and does not necessarily express the views of Gabriel, Roeder, Smith & Company.
41
Exhibit 4
ACKNOWLEDGEMENT
Thank you to Brian Murphy, FSA, EA who checked and peer reviewed this presentation
42
Exhibit 4
Copyright © 2013 GRS – All rights reserved.
SURS and the Illinois Pension System Landscape
A review of risks, trends and responses to the changing pension environment
September 12, 2013Leslie Thompson, FSA, FCA, EA, MAAAAmy Williams, ASA, MAAA
Exhibit 4

Discussion Agenda
I. SURS Benefit StructureII. Actuarial Fundamentals
► The annual valuation► Assumptions about the future► Funding method “101”
III. Funding► Statutory requirements► Variance from actuarial standards► The true cost of the plan► The target funded ratio► Risks
IV. Key Actuarial Metrics of Retirement SystemsV. RiskVI. Trends in Public Sector Retirement SystemsVII. Recent Illinois Reform Proposals
2
Exhibit 4
I. Benefit Structure
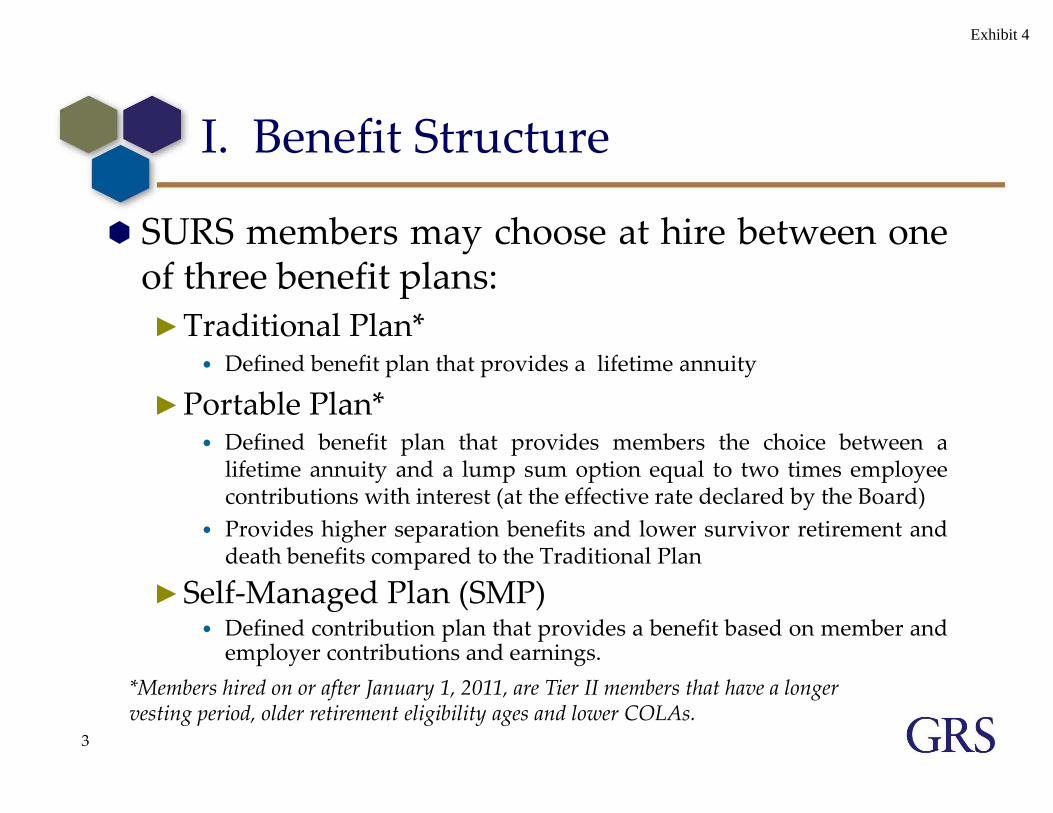
SURS members may choose at hire between oneof three benefit plans:►Traditional Plan*
• Defined benefit plan that provides a lifetime annuity
►Portable Plan*• Defined benefit plan that provides members the choice between alifetime annuity and a lump sum option equal to two times employeecontributions with interest (at the effective rate declared by the Board)
• Provides higher separation benefits and lower survivor retirement anddeath benefits compared to the Traditional Plan
►Self‐Managed Plan (SMP)• Defined contribution plan that provides a benefit based on member andemployer contributions and earnings.
3
*Members hired on or after January 1, 2011, are Tier II members that have a longer vesting period, older retirement eligibility ages and lower COLAs.
Exhibit 4

I. Benefit Structure
The benefits provided under the Traditional andPortable Plans are based on the General Formula of2.2% of final average earnings times years of service
For members hired before July 1, 2005, the benefit isthe greater of the benefit calculated under theGeneral Formula and the Money Purchase Formula►The money purchase benefit is based on the annuitizedvalue of the account balance which includes:• Member contributions• Employer contributions of $2.40 for each $1.00 of member contributions• Interest at the Effective Rate of Interest declared by the Comptroller
4
Exhibit 4

II. Actuarial FundamentalsThe annual valuation
The actuary’s role is to perform an actuarialvaluation in order to measure the future benefitpromises, and using probabilistic assumptionsabout the future, determine the annual costnecessary to fund those benefits.►Each year the annual June 30 valuation of SURS iscompleted in October.
The actuarial accrued liability and normal cost isbased on:►Covered member data as of the valuation date;►Actuarial assumptions that have been adopted by theBoard; and
►Benefit provisions defined in statute.
5
Exhibit 4

II. Actuarial FundamentalsAssumptions about the future
Assumptions must be set for every contingency►The “decrements” that create a benefit stream, such asdeath, disability, retirement and termination
►The service, salary and ERI that lead to the ultimate benefitamount
Ideally there will be no bias in the assumptions►Their expected value of difference from experience is zero!► Some assumptions are cyclical, varying with economiccycles; mortality is progressive
►Bias will create upward or downward pressure oncontributions, potentially giving a false picture of the costsof the plan
Plan experience is monitored each year, and acomprehensive experience study is performed atleast every five years to validate the assumptions
6
Exhibit 4

II. Actuarial FundamentalsFunding Method “101”
Two primary goals►Accumulate sufficient funds by retirement►Maximize the amount of benefit paid for throughinvestment earnings
Accumulate by contributing the Normal Cost eachyear►Keeps the plan 100% funded
The Accrued Liability is the value of theaccumulated Normal Costs► “Where we should be”
But when funding or experience falls short, there isan unfunded portion of the accrued liability►Must also then make an amortization payment on the UAL
7
Exhibit 4

III. FundingStatutory Requirements
Section 15‐155 of the statute requires SURS to be 90%funded by 2045 based on a constant percentage ofpayroll or “backs into” an annual contribution that willachieve the 90% target
The contribution requirement under the current statutesis based on:► Current assets at the time of the valuation► Projected liabilities at 2045►Amount of contributions, calculated as a percent of pay,
required to reach a funded status (assets/liabilities) of 90% in2045• Takes into account projected member contributions and assumedinvestment earnings through 2045
8
Exhibit 4

III. FundingVariance from Actuarial Standards
The statute varies from actuarial standards inthat►The statute does not have a goal of funding all costs (ittargets 90%)• This means the plan costs more in contributions and is funded less byinvestments
►When future benefits are changed, the state takes a“credit” in the current period• But there is no such thing as a credit, since those members are not yethired
9
Exhibit 4

III. FundingThe true cost of the plan
Ultimately the cost of the plan is the benefits paid However, wanting to have investments pay for thebulk of the benefits means the plan needs to beactuarially funded
Contributions need to be in the plan soon enough sothey can work on earning income
10
Exhibit 4

III. FundingThe target funded ratio
Why isn’t a funding target of 90% “goodenough”?
The greatest efficiency of taxpayer dollarsoccurs when pension benefits are fundedeach year with normal cost►Efficiency means that the bulk of the benefitsare paid for the investment returns, therebypreserving taxpayer dollars for other uses.
11
Exhibit 4

12
III. FundingTarget Funded Ratios ‐Proportion Funded (a crude but illustrative example)
% funded at time=0
Initial contribution
Earnings over
30 year period
Balloon payment
Proportion funded by
contributions
Proportion funded by earnings
100% $106.53 $893.47 $0.00 11% 89%90% $95.88 $804.12 $100.00 20% 80%80% $85.23 $714.77 $200.00 29% 71%70% $74.57 $625.43 $300.00 37% 63%60% $63.92 $536.08 $400.00 46% 54%50% $53.27 $446.73 $500.00 55% 45%40% $42.61 $357.39 $600.00 64% 36%30% $31.96 $268.04 $700.00 73% 27%20% $21.31 $178.69 $800.00 82% 18%10% $10.65 $89.35 $900.00 91% 9%0% $0.00 $0.00 $1,000.00 100% 0%
Proportion of funding for various funded ratio targetsAssumes 7.75% earnings and a balloon payment at the end of 30 years
30 year funding to accumulate to $1,000
Exhibit 4

III. FundingRisks
Retirement Plans face many risks Ruin (running out of money); rising contributionrates; declining funded status (these are reallythe metrics for all the same risk‐that of being onthe path to ruin)
And the above risks can occur due to poorinvestment performance; lack of funding; higherthan expected liabilities
The trick is figuring out what can be managedand carefully containing those risks
13
Exhibit 4

IV. Key Actuarial Metrics
Similar to our physical health, there is not one key measure that can encompass the entire picture of a pension plan’s health.
However, a combination of measures, along with trend, can provide a better picture of a plan’s actuarial condition.
14
Exhibit 4

IV. Key Actuarial Metrics
Funded ratio measures the proportion of accruedliability (past normal costs) that is covered by assets.
A low funded ratio, combined with a trend ofdecreasing funded ratios would be an indication of aplan headed into poor actuarial condition.►Poor actuarial condition means either more contributions,more investment income or decreasing liabilities will berequired.
►As of June 30, 2012 the SURS funded ratio was 42%.►The national average is approximately 80%.
15
Exhibit 4

IV. Key Actuarial Metrics
A history of not meeting the annual requiredcontribution would be an indication of pooractuarial condition►The statute does not permit an “ARC” contribution
The missed contributions continue to flow back intothe unfunded accrued liability and would alsodecrease the funded ratio
16
Exhibit 4

V. Risk
Plans are maturing, and a large loss on the assets would fall to the active population/employer to make up the difference (since retirees no longer contribute to the enterprise or the plan).
To manage this risk, plans might consider “de‐risking” the asset portfolio as the plans mature.
Or plans might want to add a contribution reserve.
17
Exhibit 4

V. Risk
Plans often look at the ratio of the unfunded accruedliability to payroll.
This is a measure of “liability risk” – the larger theratio the greater the risk of liabilities rapidlyoutgrowing the affordability of the plan (sinceliabilities and contributions are generally computedas a percent of payroll).
18
Exhibit 4
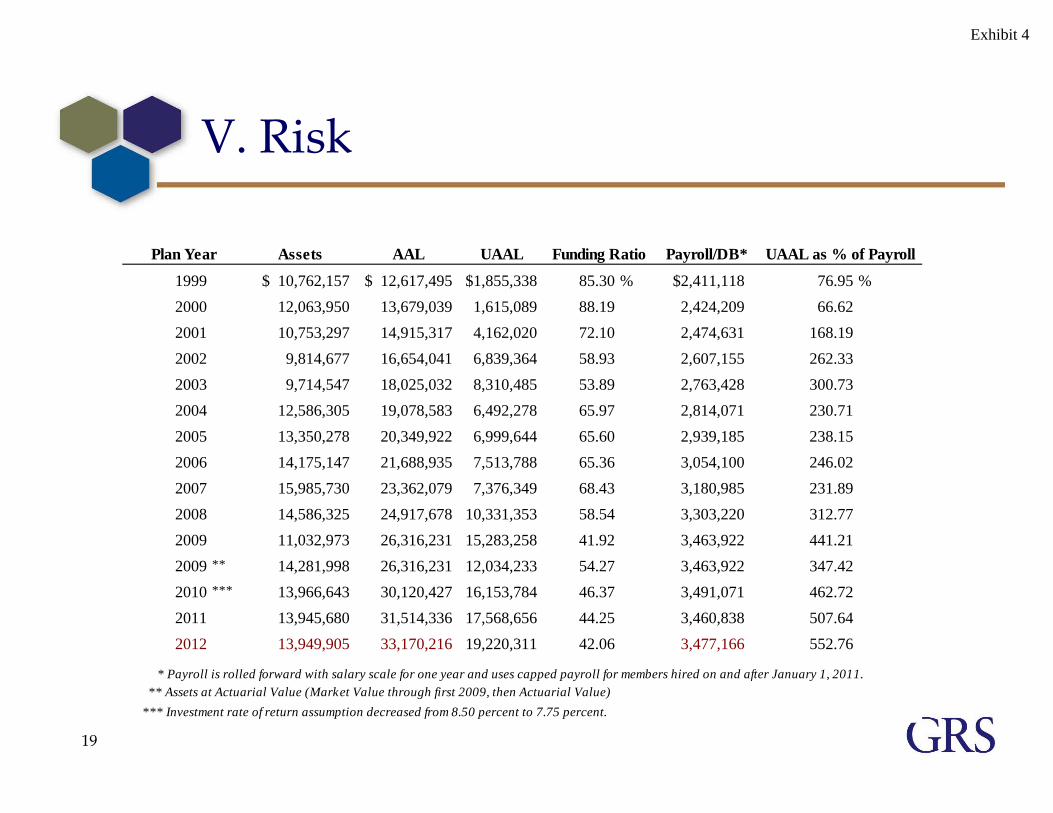
V. Risk
19
Assets AAL UAAL Payroll/DB*
1999 $ 10,762,157 $ 12,617,495 $1,855,338 85.30 % $2,411,118 76.95 %2000 12,063,950 13,679,039 1,615,089 88.19 2,424,209 66.622001 10,753,297 14,915,317 4,162,020 72.10 2,474,631 168.192002 9,814,677 16,654,041 6,839,364 58.93 2,607,155 262.332003 9,714,547 18,025,032 8,310,485 53.89 2,763,428 300.732004 12,586,305 19,078,583 6,492,278 65.97 2,814,071 230.712005 13,350,278 20,349,922 6,999,644 65.60 2,939,185 238.152006 14,175,147 21,688,935 7,513,788 65.36 3,054,100 246.022007 15,985,730 23,362,079 7,376,349 68.43 3,180,985 231.892008 14,586,325 24,917,678 10,331,353 58.54 3,303,220 312.772009 11,032,973 26,316,231 15,283,258 41.92 3,463,922 441.212009 ** 14,281,998 26,316,231 12,034,233 54.27 3,463,922 347.422010 *** 13,966,643 30,120,427 16,153,784 46.37 3,491,071 462.722011 13,945,680 31,514,336 17,568,656 44.25 3,460,838 507.642012 13,949,905 33,170,216 19,220,311 42.06 3,477,166 552.76
* Payroll is rolled forward with salary scale for one year and uses capped payroll for members hired on and after January 1, 2011. ** Assets at Actuarial Value (Market Value through first 2009, then Actuarial Value)*** Investment rate of return assumption decreased from 8.50 percent to 7.75 percent.
Plan Year Funding Ratio UAAL as % of Payroll
Exhibit 4

V. Risk
20
0%
100%
200%
300%
400%
500%
600%
0%
10%
20%
30%
40%
50%
60%
70%
80%
90%
100%
1999 2000 2001 2002 2003 2004 2005 2006 2007 2008 2009 2009 2010 2011 2012
UAA
L as
% of
Pay
Fund
ing
Rat
io
Funding Ratio UAAL as % of Pay
Exhibit 4

VI. Trends in Public Sector Retirement Systems
Local Government Bankruptcy catches our attention►Putting the plan “on the table” for cutbacks, similar totheir bonded debt
►Courts will decide whether the constitutional protectionsupersedes bankruptcy.
New hire plan designs Future accruals using choice as a waiver of rights
21
Exhibit 4

VII. Recent Illinois Pension Reform Proposals
Proposals have included:►Changes to both benefits and contributions (both frommembers and the State)
►Changes that affect both current and future retirees• Changes that mainly affect Tier 1 members
– Proposed changes to the Effective Rate of Interest would also affect current Tier 2members and new hires in the Defined Benefit Plans
►Changes to the current statutory funding policy to a moreactuarially based policy of normal cost plus 30‐yearamortization of the unfunded liability (calculated as eithera level dollar amount or level percentage of pay)
The Self Managed Plan has not been changed inrecent proposals, which may make this plan moreattractive if pension reform passes► SMP has no cap on pay22
Exhibit 4

VII. Recent Illinois Pension Reform Proposals
Effective date of July 1, 2014 Tier 1 benefit changes
► Decrease in Tier 1 employee contribution rates of 1% of pay► Decrease in interest crediting rate for all purposes (assumed ERI
decreases from 7.75% to 4.00%)► Changes conversion rates for money purchase formula benefits
• Preserves benefit at effective date under old conversion factors► Decrease in COLA from 3% compound to ½ of CPI compound
(max of 6%), including for members receiving disability andsurvivor annuities• Impacts both current and future retirees
► Staggered COLA delay depending on age at effective date(members forfeit COLA increases in alternate years that wouldotherwise have been granted)• Impacts future retirees only
Change in ERI affects Tier 2 and new hires SMP continued to be offered to new hires
23
Exhibit 4

VII. Recent Illinois Pension Reform Proposals
Changes State’s funding policy to payments calculatedas normal cost plus 30‐year closed period level percentof pay amortization of the unfunded liability in order toreach 100% funded in 2044►Eliminate maximum contribution cap from 2003 POBissuance
Changes actuarial cost method to Entry Age Normalbeginning with FY 2016 contribution
Adds additional supplemental payments beginning inFY 2019
Establishes State and Employer Funding Enforcement
24
Exhibit 4

VII. Recent Illinois Pension Reform Proposals
Estimated financial impact of recent proposal►Reduction in present value of State contributions of $5.4billion through 2045
• $3.8 billion from change in future COLA rate• $1.3 billion from change in assumed Effective Rate of Interest• Remaining decrease from all other changes
► Initial increase in funded ratio of about 8%► Increase in funded ratio at 2045 from 90% to 100%
Estimated financial impact is based on valuationresults and underlying assumptions used in themost recent valuation as of June 30, 2012► Financial impact measured as of June 30, 2013 will differfrom impact as of June 30, 2012
25
Exhibit 4
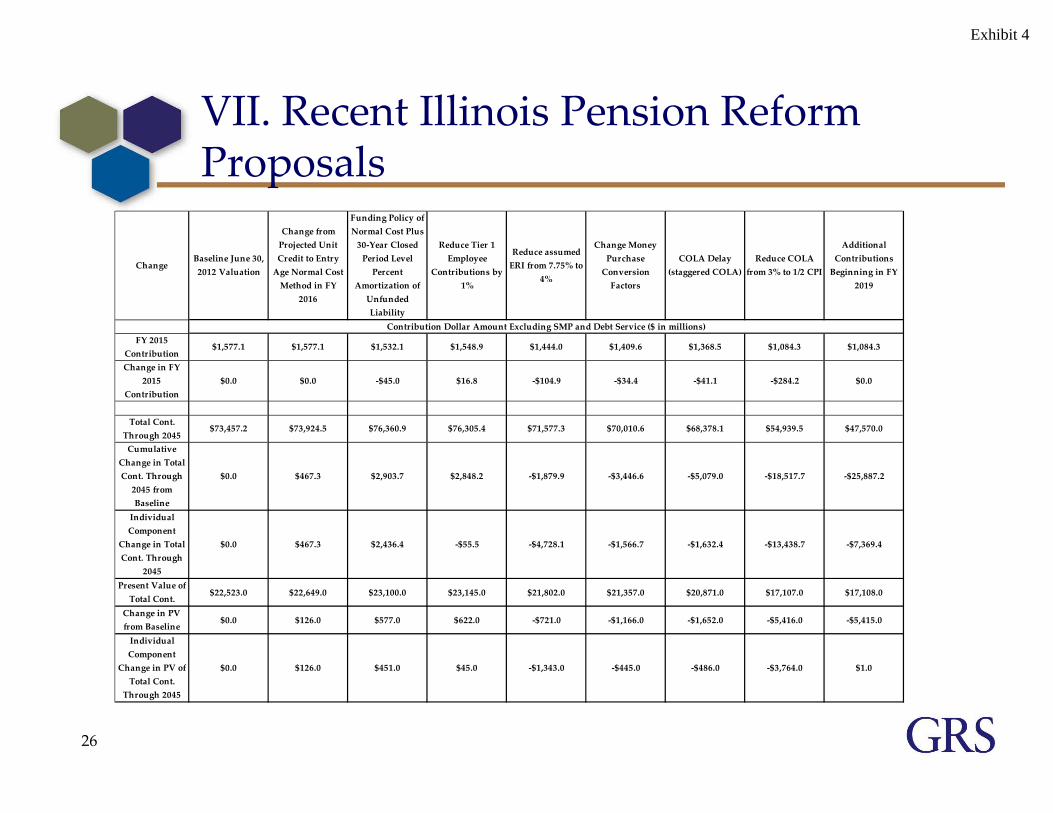
VII. Recent Illinois Pension Reform Proposals
26
ChangeBaseline June 30, 2012 Valuation
Change from Projected Unit Credit to Entry Age Normal Cost Method in FY
2016
Funding Policy of Normal Cost Plus 30‐Year Closed Period Level Percent
Amortization of Unfunded Liability
Reduce Tier 1 Employee
Contributions by 1%
Reduce assumed ERI from 7.75% to
4%
Change Money Purchase Conversion Factors
COLA Delay (staggered COLA)
Reduce COLA from 3% to 1/2 CPI
Additional Contributions Beginning in FY
2019
FY 2015 Contribution
$1,577.1 $1,577.1 $1,532.1 $1,548.9 $1,444.0 $1,409.6 $1,368.5 $1,084.3 $1,084.3
Change in FY 2015
Contribution$0.0 $0.0 ‐$45.0 $16.8 ‐$104.9 ‐$34.4 ‐$41.1 ‐$284.2 $0.0
Total Cont. Through 2045
$73,457.2 $73,924.5 $76,360.9 $76,305.4 $71,577.3 $70,010.6 $68,378.1 $54,939.5 $47,570.0
Cumulative Change in Total Cont. Through 2045 from Baseline
$0.0 $467.3 $2,903.7 $2,848.2 ‐$1,879.9 ‐$3,446.6 ‐$5,079.0 ‐$18,517.7 ‐$25,887.2
Individual Component
Change in Total Cont. Through
2045
$0.0 $467.3 $2,436.4 ‐$55.5 ‐$4,728.1 ‐$1,566.7 ‐$1,632.4 ‐$13,438.7 ‐$7,369.4
Present Value of Total Cont.
$22,523.0 $22,649.0 $23,100.0 $23,145.0 $21,802.0 $21,357.0 $20,871.0 $17,107.0 $17,108.0
Change in PV from Baseline
$0.0 $126.0 $577.0 $622.0 ‐$721.0 ‐$1,166.0 ‐$1,652.0 ‐$5,416.0 ‐$5,415.0
Individual Component
Change in PV of Total Cont. Through 2045
$0.0 $126.0 $451.0 $45.0 ‐$1,343.0 ‐$445.0 ‐$486.0 ‐$3,764.0 $1.0
Contribution Dollar Amount Excluding SMP and Debt Service ($ in millions)
Exhibit 4
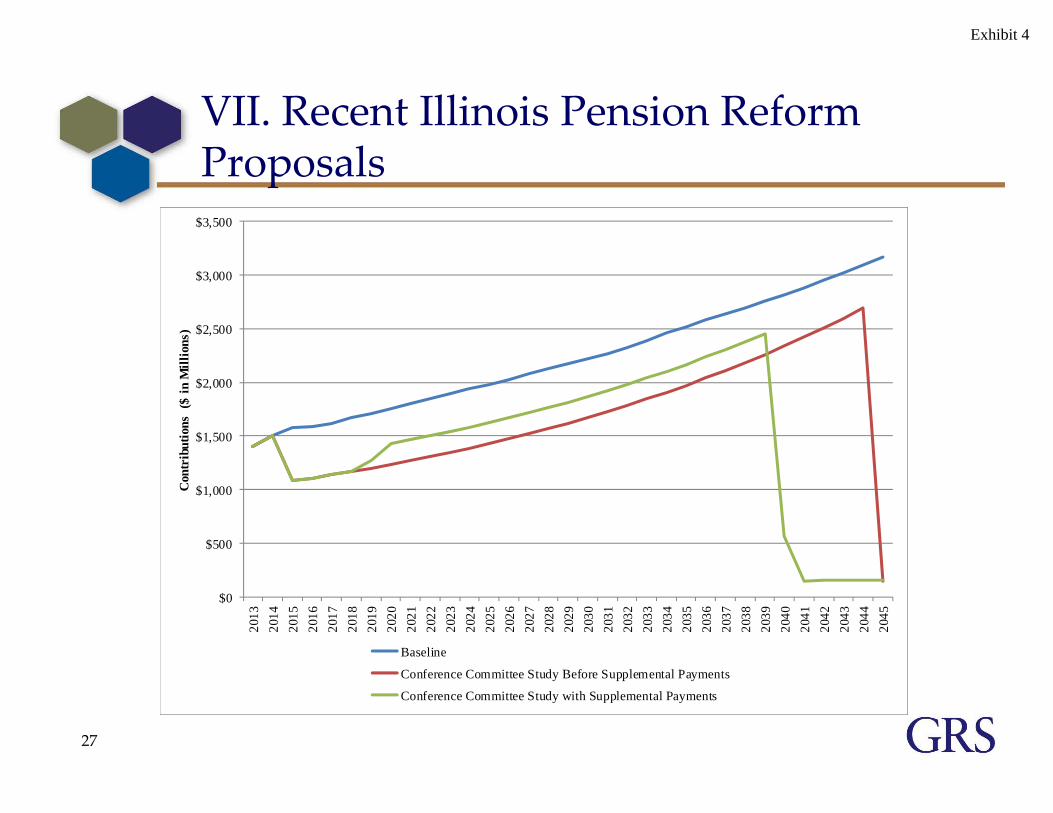
VII. Recent Illinois Pension Reform Proposals
27
$0
$500
$1,000
$1,500
$2,000
$2,500
$3,000
$3,500
2013
2014
2015
2016
2017
2018
2019
2020
2021
2022
2023
2024
2025
2026
2027
2028
2029
2030
2031
2032
2033
2034
2035
2036
2037
2038
2039
2040
2041
2042
2043
2044
2045
Con
trib
utio
ns (
$ in
Mill
ions
)
Baseline
Conference Committee Study Before Supplemental Payments
Conference Committee Study with Supplemental Payments
Exhibit 4

VII. Recent Illinois Pension Reform Proposals
28
0%
10%
20%
30%
40%
50%
60%
70%
80%
90%
100%
2013
2014
2015
2016
2017
2018
2019
2020
2021
2022
2023
2024
2025
2026
2027
2028
2029
2030
2031
2032
2033
2034
2035
2036
2037
2038
2039
2040
2041
2042
2043
2044
2045
Fund
ed R
atio
Baseline
Conference Committee Study Before Supplemental Payments
Conference Committee Study with Supplemental Payments
Exhibit 4

Additional Comments
Circular 230 Notice: Pursuant to regulations issued by the IRS, tothe extent this presentation concerns tax matters, it is not intendedor written to be used, and cannot be used, for the purpose of (i)avoiding tax‐related penalties under the Internal Revenue Code or(ii) marketing or recommending to another party any tax‐relatedmatter addressed within. Each taxpayer should seek advice basedon the individual’s circumstances from an independent tax advisor.
This presentation shall not be construed to provide tax advice, legaladvice or investment advice.
29
Exhibit 4